
Abstract
New developments in instrumentation and data analysis have further improved the perspectives of hyperspectral imaging in clinical use. Thus, hyperspectral imaging can be considered as “Next Generation Imaging” for future clinical research. As a contactless, non-invasive method with short process times of just a few seconds, it quantifies predefined substance classes. Results of hyperspectral imaging may support the detection of carcinomas and the classification of different tissue structures as well as the assessment of tissue blood flow. Taken together, this method combines the principle of spectroscopy with imaging using conventional visual cameras. Compared to other optical imaging methods, hyperspectral imaging also analyses deeper layers of tissue.
Introduction
Hyperspectral imaging (HSI) has become an innovative new tool for detecting and characterizing biological samples. HSI integrates digital spectroscopy and imaging to obtain spatial and spectral information. An HSI system detects the aggregate signal of reflected, absorbed, and emitted radiance at specific wavelengths. It can capture a vast number of contiguous spectral bands across the electromagnetic spectrum (see Figure 1) and enables us to answer questions that cannot be solved with conventional grey-scale or color imaging. HSI data differ from conventional red, green and blue (RGB) images in terms of their spectral resolution. While the visible (VIS) wavelength range in RGB images is averaged over broad areas with three values for each primary color (red, green, and blue), there is a high-resolution spectrum in hyperspectral images for every pixel.1–6 Consequently, HSI data are characterized by a hundred different spectral channels in each pixel, increasing the amount of data acquired beyond the human eye’s capabilities. Each pixel acquired by an HSI system contains diagnostic spectral absorption features. 7
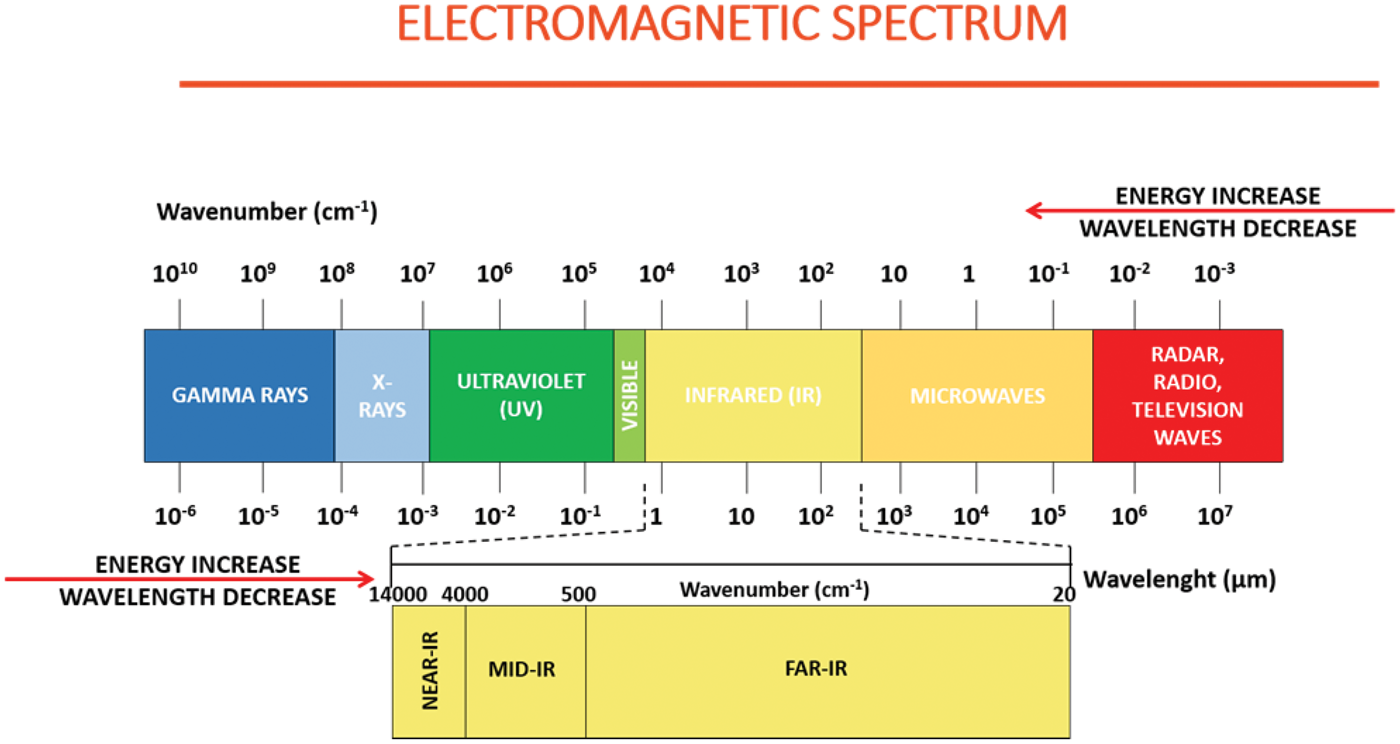
Schematic representation of the electromagnetic spectrum.
In this way, statements about the surface of a sample can be made. HSI appears particularly attractive because it is an accurate, reliable, and non-destructive analysis method. However, the great effort involved in taking HSI data, the need to purchase expensive hardware, and the high computing time and memory requirements for evaluating HSI data have prevented this optical method from being widely used despite its numerous advantages. 8
First applications investigated the earth’s surface and atmosphere using air- or satellite-supported cameras for mineral exploration, 9 vegetation monitoring, 10 and marine analysis. 11 The subsequent technical development of HSI cameras and the associated decreasing costs made it possible to use them in laboratories, such as medical diagnostics12–14 or food safety issues.15–17 In parallel to hardware evolution, information extraction methods have been developed.13,14,18,19 Today, HSI is a promising non-invasive and non-ionizing technique that supports the rapid acquisition and analysis of diagnostic information in several fields. This technology is nowadays used for remote sensing,20,21 archeology,22,23 drug identification,24–27 forensics,28–30 defense and security,31,32 agriculture,33,34 food safety inspection and control.30,35,36
This article summarizes current literature on relevant hardware, software, and applications and presents HSI as an innovative medical research tool.
Acquisition of HSI data
There are several possible interactive mechanisms between electromagnetic radiation and matter, such as absorption and diffuse reflection. In practice, diffuse reflection is the most important interaction, as it needs minor sample preparatory works regarding the respective object. For HSI, different measurement principles can be used in the visible, ultraviolet, and infrared light spectra (VIS, UV, and IR, respectively). The spectral range selection often depends on the given task and the samples’ associated spectral characteristics. According to the spectra of HSI, the sensor types areas follows:
37
The resulting data are then recorded as a “spectral cube,” which contains both the location information (x and y) and the spectral information (wavelength ʎ) of a sample. Thus, information about the shape, dimensions, and structure, together with extended physical and chemical properties, are captured. The sample is recorded spatially and spectrally resolved, getting a spectrum for each pixel. 38 Figure 2 depicts an example of a typical HSI spectral cube.
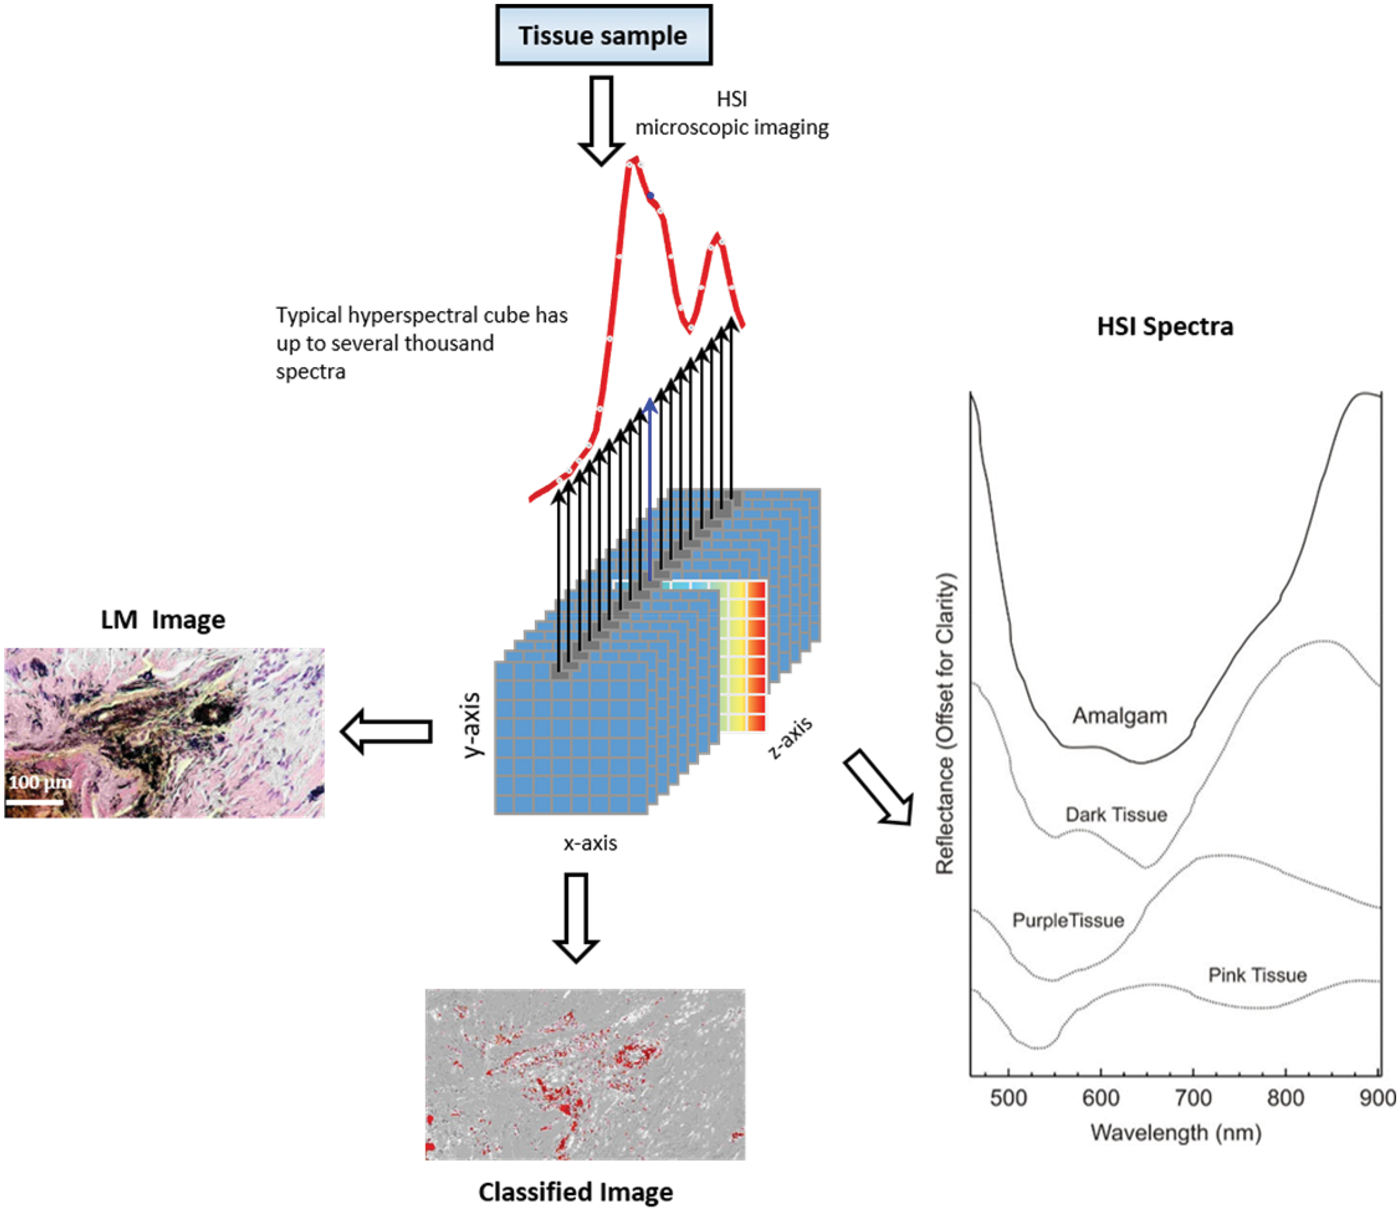
Model of an HSI spectral cube. A single tissue section provides thousands of images at various wavelengths. The result is a three-dimensional image data cube.
The measuring principles differ in structure and arrangement of the optical system, the method of spectral channel separation, the properties of the image sensor, and the type and timing of the scanning. Simultaneous acquisition of spatial and spectral information can be made in a variety of ways. The most common measurement principles are the following:
The HSI sensor type and acquisition system selected is highly application dependent. Out of these, for real-time analysis, the HSI snapshot cameras are the most suitable, as used for in-vivo tissue analysis. It optimally combines high spectral resolution with tissues’ optical properties and high spatial resolution, permitting tissue’s spectral and morphological properties.
HSI data processing
For extraction, unmixing, and classification of relevant spectral information from captured data, advanced image-classification methods are used. 42 Gained molecular signatures are related to a specific disease by decomposing mixtures of spectral and spatial information into intrinsic molecular components.43,44 So far, HSI is progressively used in the fields of drug analysis,45,46 food quality inspection, 39 or defense and security. 47 Therefore, the algorithms now have to be adapted to medical HSI data. 48 HSI data containing specific spectral and spatial information can be crucial for disease screening, diagnosis, and treatment.
HSI measurements contain a wealth of data, but interpreting them requires an understanding of precisely what properties of a sample should be measured and how they relate to the HSI sensor measurements. In principle, most objects can be identified by their spectral reflectance alone. The choice of the relevant spectral bands is crucial for further analysis.
Extensive literature is available on the classification of HSI data, 49 with most algorithms being developed to classify HSI images based on the remote sensing field. 50 Not every pixel in the image represents a single fluorophore but maybe a combination or mixture of various spectra. 51 Computer-based algorithms are applied for extraction, storage, and manipulation.38,52 The HSI data processing workflow then consists of image acquirement, calibration, spectral, spatial preprocessing, reduction of dimensions, and detection of specific targets. Preprocessing methods aim to demonstrate image information more precisely. They are used to process the data in spatial and spectral domains, where both spatial and spectral preprocessing techniques can be used together. In the data preprocessing phase, noise reduction, image segmentation, image smoothness, flattening, normalization, baseline correction, and compression are used.38,53 Removal of noise, dead pixels, spiked points, and data compression is performed after that. 54
HSI data classification
Assignments to a particular sample based on its spectral information can be done by pixel-wise classification methods,55,56 which include both supervised and unsupervised classifiers. For interpretation, manipulation, and pattern recognition of ordinary data, spatial postprocessing is commonly used. Appropriate filters in the frequency domain can also be used to extract specific features. 57 Spectral shape and peak width can be obtained using the first and second-order derivative tests and baseline corrections.58,59 Feature extraction is then applied with the linear or nonlinear transformation to reduce data redundancy by transformation into a new lower-dimension space because of redundant information. Thus, principle component analyses (PCA),12,60 partial least squares (PLS), 61 Kernel PCA, 62 and a Linear Discriminant Analyser (LDA) can be used. 38
The supervised classification algorithms rely on training an algorithm on spectral signatures with known class labels. The training process must be performed with a library of spectral signatures, with each type of signature being identified as a particular membership class. The aim is to generate a library, which is sufficiently representative for generalization purposes. Supervised learning is comparable to human learning of patterns. Methods include linear discriminant analysis, decision trees, random forest (RF), 63 artificial neural networks (ANNs),64–67 and Kernel-based methods like the support vector machine (SVM) classifier.68–71 Other relevant algorithms are linear and partial regression methods, such as PLS and LDA, having problems generalizing to larger patient datasets.12,60–62 In general, these algorithms face high dimensionality, a limited number of samples, and inter-patient spectral variability when applied to medical HSI data.
Unsupervised classifiers aim to divide an image into a certain number of similar groups. Each group shares approximately the same spectral information and provides the correspondent cluster centroid. 72 Each cluster centroid represents a spectrum corresponding to a component in the investigated area. Therefore, unsupervised methods do not require a training process using labeled samples. There is no information about the material’s nature, and unsupervised clustering does not provide any discriminant features by itself. The most common unsupervised algorithms for HSI data are K-means, 73 the Iterative Self-Organizing Data Analysis (ISODATA) technique,74,75 and hierarchical clustering.76–78
Today, deep learning (DL) approaches to classify HSI data have become increasingly common in the medical field.79–85 These techniques have been used for many applications of remote sensing data analysis. 86 The DL approach generates predictive models that are formed by several stacked processing layers with “neurons”. DL methods can learn new mathematical representations from input data required for detection or classification. 87 Several DL frameworks have been applied to HSI data, where convolutional neural networks (CNNs) are of particular interest.88–91
HSI in clinical research
In medicine, HSI is a novel technique with high potential, especially for diagnostic applications.92–94 So far, HSI provides diagnostic information for anemia, hypoxia, cancer detection, skin lesions and ulcer identification, and urinary stone analysis.12–14,95–106 Additional applications range from in vivo to ex vivo measurements including image-guided surgery,12,106–108 endoscopy,78,109 dermatology, 110 macroscopic investigations of ex-vivo tissue specimens111–113 and histology.13,14,114
In detail, as image-guided surgery to different anatomical structures and physiological conditions, HSI may assess tissue perfusion, oxygenation, and water balance, and can be used for wound therapy, 115 and particularly in colorectal surgery, HSI allowed to reduce anastomotic complications.116–118 HSI is superior to near-infrared (NIR) fluorescence with indocyanine green (ICG) as HSI does not lead to allergic and cardiovascular complications at all, and quantitative analysis can be directly performed. 115 For oncology, HSI can discriminate between normal and tumor tissue in the brain,93,94,119 ensure complete cancer resection,12,106–108 and detect laryngeal and colorectal cancer using flexible endoscopy.78,109 Limitations of intraoperative use are currently mainly due to the size of the available camera.
Ex vivo, digital pathology as an emerging technology promises quantitative diagnosis of pathological samples, relying on RGB digitized histology images.13,14,114,120–123 In Figure 3 an exemplary workflow for HSI as a diagnostic tool to differentiate amalgam tattoos from melanocytic lesions is presented.
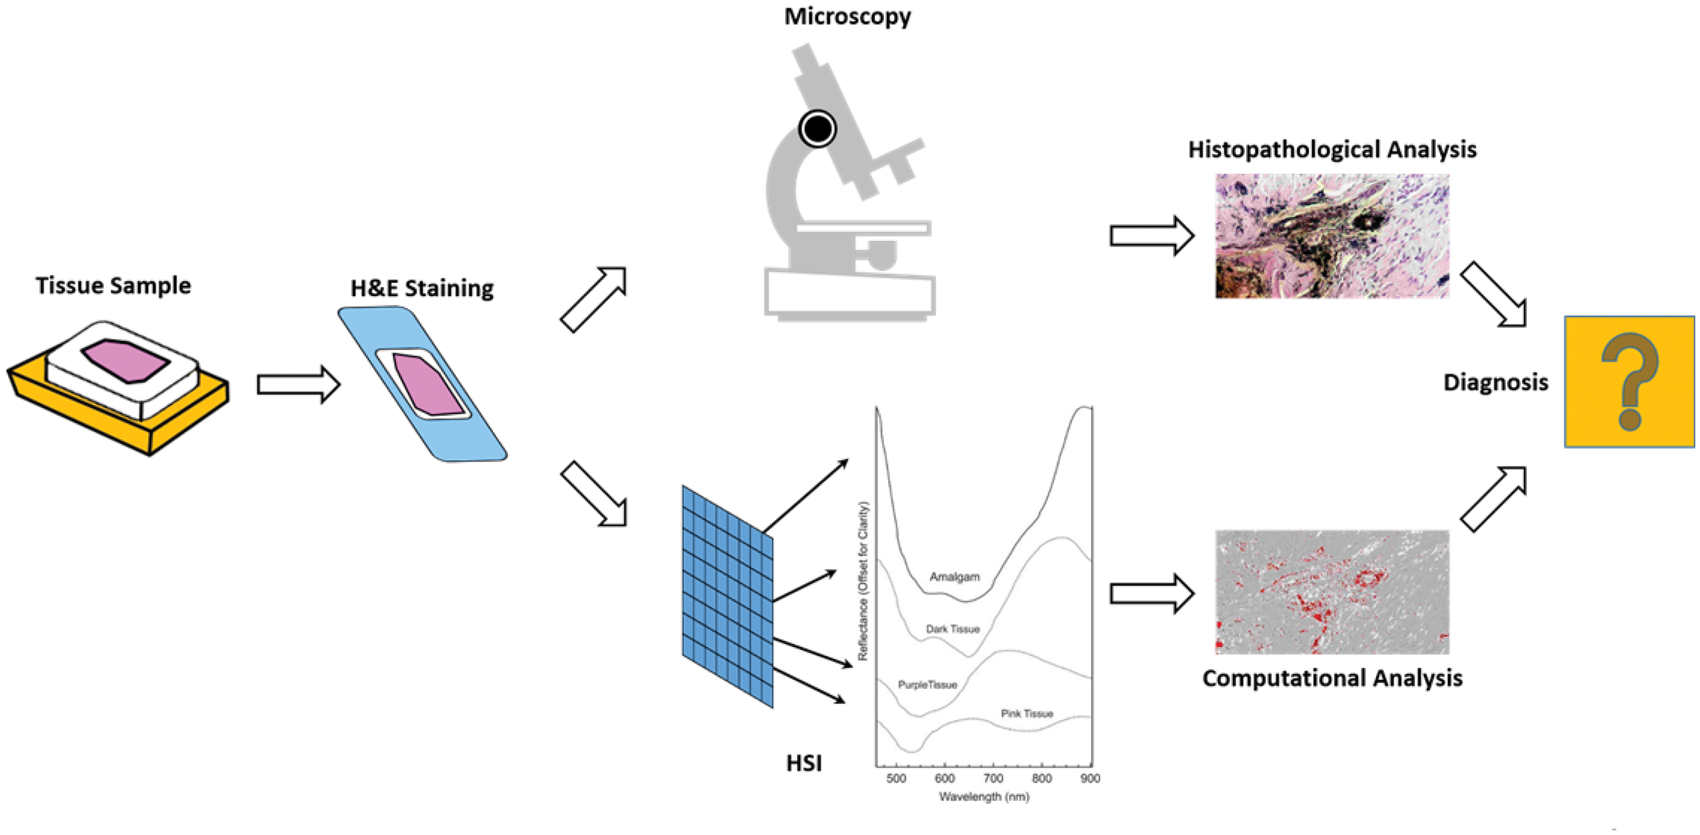
Workflow proposal for HSI as a diagnostic tool to differentiate amalgam tattoos from melanocytic lesions. 14 The current workflow for tissue diagnosis involves sample preparation, assessment of tissue morphology by a pathologist, measurements of several tissue sections, analysis of the obtained data, and direct comparisons of the HSI results with the pathological examination.
HSI objectifies the composition of cells and tissues with different biochemical ingredients compared to light microscopy as time consuming gold standard with inter- and intra-observer discrepancies.13,14,114,122,123 The pre-analytical phase with the sample preparation is identical for both methods, and HSI then represents a noncontact technique depending only on the statistical analyses of the recorded data with HIS data processing and classification as detailed above. HSI then provides a “molecular fingerprint” of the samples directly linked to biochemical changes.124–127 The future challenge will be to assess the accuracy of HSI for specific additional analyses. 128 With the help and support of pathologists, this field can be considered very promising.
Conclusion
HSI is a fast, relatively inexpensive method that provides high spectral and image information. HSI is easy to use compared to other techniques in this field. 129 For the future, algorithms have to be optimized to redundancies and clinically irrelevant information, and HSI accuracy must be determined for routine clinical use. For example, intraoperative assessment of tumor margins and safety distances and affected lymph nodes using HSI could provide the surgeon with important additional information. For the intraoperative application, limitations include the size of the commercially available cameras and the need for specific software tools for the intraoperative visualization of the tumor boundaries and safety distances to support intraoperative decision-making. Increasing the HSI database will further accelerate the development of new software tools.
In summary, the following points must be addressed for future research:
Comparison of HSI benefits compared to conventional RGB cameras Optimization of data analysis with the development of technical and scientific protocols Establishment of calibration standards and validation of techniques Development of a small camera system for use in minimally invasive surgery and endoscopy Evaluation of possible clinical consequences of HSI use in prospective multicenter studies.
Footnotes
Declaration of conflicting interests
The author(s) declared no potential conflicts of interest with respect to the research, authorship, and/or publication of this article.
Funding
The author(s) received no financial support for the research, authorship, and/or publication of this article.