
Abstract
Background
Alzheimer’s disease (AD) progression is critically modulated by neuroinflammatory cascades involving chemokine-mediated glial activation.
Objective
This study aimed to systematically compare compartment-specific chemokine signatures between two distinct AD mouse models (2×Tg-AD [APPswe/PS1dE9] and 3×Tg-AD [APPswe/PS1M146V/TauP301L]), hypothesizing that differential chemokine expression patterns would emerge in a model- and brain region-specific manner, correlating with glial activation profiles.
Results
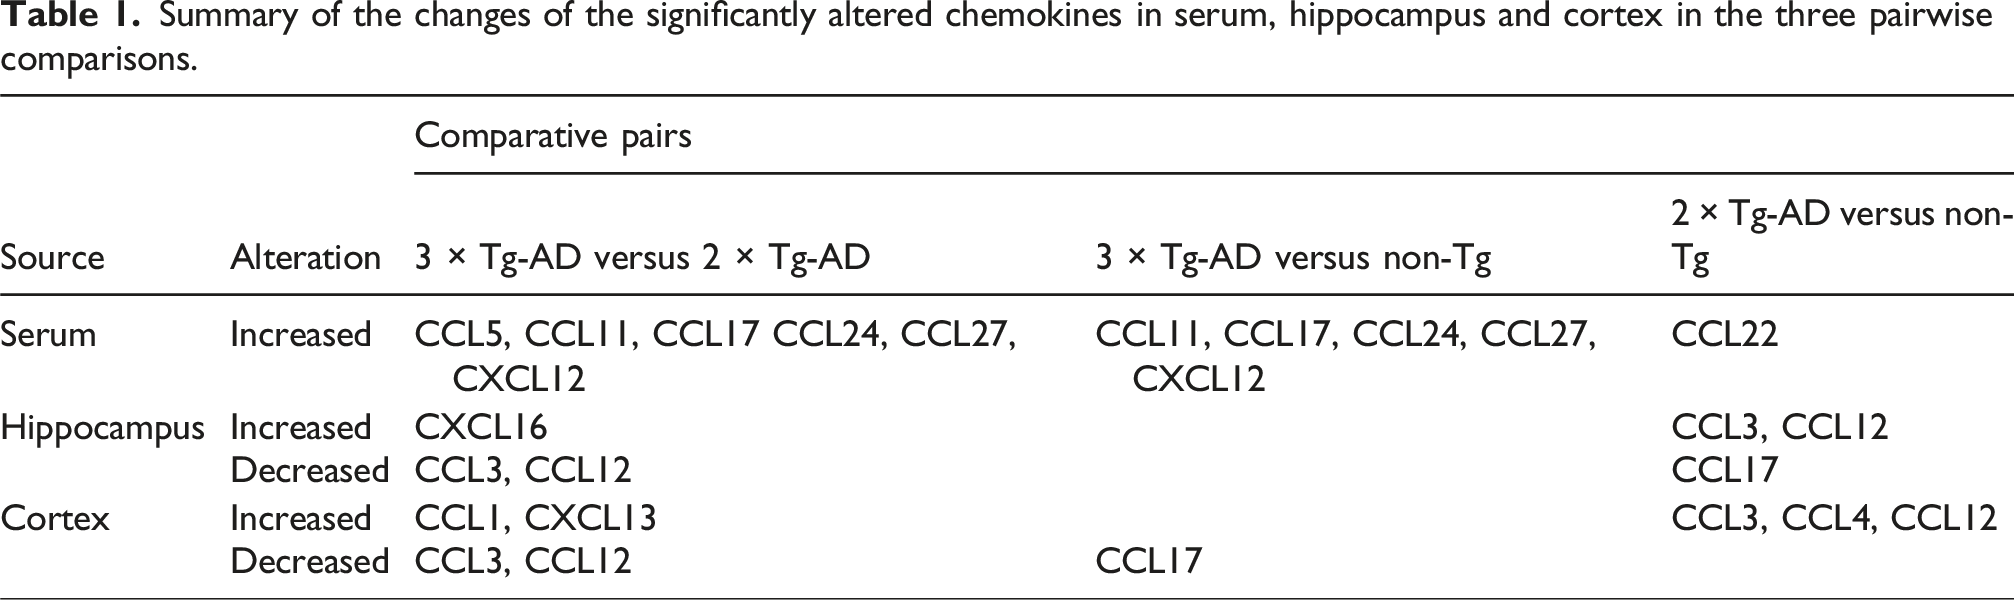
Using a Luminex liquid suspension chip assay, we quantified 22 chemokines in serum and brain tissues from transgenic and non-transgenic controls, complemented by Western blot analysis of microglial and astrocytic markers. Twenty-two chemokines were quantitatively analyzed with three key findings: First, serum analysis revealed elevated levels of (i) CCL11, CCL17, CCL24, CCL27, and CXCL12 in 3×Tg-AD versus non-Tg mice; (ii) CCL22 in 2×Tg-AD versus non-Tg mice; and (iii) CCL5, CCL11, CCL17, CCL24, CCL27, and CXCL12 in 3×Tg-AD versus 2×Tg-AD mice. Second, hippocampal changes showed upregulation of CCL3/CCL12 in 2×Tg-AD and CXCL16 in 3×Tg-AD mice, with cortical alterations demonstrating distinct CCL3/CCL12/CCL4 increases in 2×Tg-AD versus elevated CCL1/CXCL13 in 3×Tg-AD mice. Third, Western blot confirmed enhanced hippocampal microglial activation specifically in 3×Tg-AD mice.
Conclusion
Our findings establish model-specific chemokine signatures that differentially engage neuroinflammatory pathways, suggesting that 3×Tg-AD mice may better replicate human AD’s complex chemokine-glia interactions. This compartmentalized profiling provides a framework for targeting chemokine networks in model-specific therapeutic development and biomarker discovery. Further studies are needed to determine whether elevated chemokine expression directly contributes to microglial activation.
Keywords
Introduction
Alzheimer’s disease (AD), affecting over 57 million individuals globally, is characterized by amyloid-beta (Aβ) plaques, neurofibrillary tangles (NFTs), glial activation, neuronal loss and synaptic degeneration. 1 While glial activation is recognized as a key driver of pathogenesis, the molecular mechanisms linking inflammation to Aβ/tau pathologies remain incompletely understood. 2
Chemokines, a class of chemotactic cytokines produced by CNS glial cells, regulate inflammation and apoptosis in neurodegeneration. 3 Structurally categorized into CXC, CC, CX3C, and XC subfamilies 3 based on cysteine motifs, their secretion by immune and CNS cells (microglia, astrocytes, neurons) responds to pathogenic threats. Beyond immune surveillance and leukocyte recruitment, they modulate neurodevelopment and synaptic plasticity. 4 In AD, chemokine-receptor interactions critically influence Aβ plaque formation and tau hyperphosphorylation. AD patients and models exhibit distinct chemokine dysregulation: peripheral blood shows elevated CCL16, CCL27, CXCL8/9/10 5 ; CSF displays increased CCL2. 6 Mechanistically, CCL5 enhances Aβ-mediated microglial migration, 7 while CCL2 facilitates Aβ-microglia co-aggregation, 8 highlighting their central role in AD pathology.
Despite progress, three barriers hinder therapeutic translation: (i) No spatiotemporal mapping of chemokine networks across AD stages; (ii) Contradictory findings on how specific chemokines bidirectionally regulate Aβ versus tau; (iii) Disconnects between human AD chemokine signatures and transgenic models. Notably, widely used 3×Tg-AD (APPswe/PS1M146V/tauP301L) and 2×Tg-AD (APPswe/PS1dE9) mice exhibit divergent Aβ/tau progression timelines and inflammatory priming.9–11 Comparing these models may resolve how chemokine dynamics scale with pathological complexity—a critical step for extrapolating preclinical findings to heterogeneous human AD. Here, we performed high-throughput chemokine profiling in matched serum and brain tissues from 3×Tg-AD and 2×Tg-AD mice. We hypothesized that genotype-specific chemokine networks would correlate with compartmentalized pathology (hippocampal Aβ vs. cortical tau) and that systemic chemokine shifts would predict central inflammatory burden.
Materials and methods
Animals
3×Tg-AD (n = 6) and 2×Tg-AD mice (n = 8), originally generated by Jackson Laboratory (Bar Harbor, ME, USA), were bred under specific pathogen-free (SPF) conditions by Aniphe Biolaboratory Inc. (Jiangsu, China). Age-matched male C57BL/6J wild-type mice (non-Tg, n = 9) from the same vendor served as controls. All mice were housed in SPF facilities at Gannan Medical University under a 12 h/12 h light/dark cycle with ambient temperature maintained at 22 ± 1°C. Body weights were monitored throughout the study. Experimental protocols were approved by the Institutional Animal Care and Use Committee of Gannan Medical University (approval no. 2021218; March 3, 2021) and complied with NIH guidelines.
Sample collection
Serum preparation
Mice were anesthetized via intraperitoneal injection of pentobarbital sodium (50 mg/kg). Blood (∼2 mL) was collected from the retro-orbital plexus using heparinized capillaries, transferred to serum separator tubes, and allowed to clot passively at room temperature for 30 min. After centrifugation (1000×g, 10 min, 4°C), supernatants were aliquoted and stored at −80°C.
Brain tissue processing
Following euthanasia by cervical dislocation under deep anesthesia, brains were rapidly extracted, rinsed in ice-cold PBS, and dissected on a chilled platform. Hippocampi and cortices were isolated bilaterally, snap-frozen in liquid nitrogen, and homogenized in RIPA lysis buffer (Beyotime, China) containing protease inhibitors (Roche, Basel, Switzerland). Lysates were clarified by sequential centrifugation (13,200×g, 15 min, 4°C × 2), and protein concentrations were determined via BCA assay (Pierce, USA).
Multiplex luminex assay
Chemokine profiling was performed by Wayen Biotechnologies (Shanghai, China) using the Bio-Plex Pro Mouse Chemokine 31-Plex Panel (Bio-Rad, Hercules, CA, USA; Cat# M60009RDPD). Briefly, serum/brain lysates (50 μg protein/sample) were incubated with antibody-conjugated magnetic microspheres (30 min, RT). After washing, complexes were labeled with biotinylated detection antibodies (30 min), followed by streptavidin-phycoerythrin (10 min). Fluorescence signals were quantified using a Bio-Plex MAGPIX System (Bio-Rad). Data were normalized to internal controls and analyzed with Bio-Plex Manager 6.1.
Western blot
Proteins (20 μg/lane) were resolved on 12% SDS-PAGE gels and transferred to PVDF membranes (Millipore, USA). Membranes were blocked with 5% non-fat dry milk (BD Biosciences, USA) and probed overnight (4°C) with: anti-GFAP (1:1000; Cat# 3670, Cell Signaling Technology, Danvers, MA, USA), anti-Iba1 (1:1000; Cat# 17198, CST), anti-β-actin (1:1000; Cat# BM0627, Boster Biological, Wuhan, China). HRP-conjugated secondary antibodies (1:5000; Cat# sc-2004, Santa Cruz Biotechnology, USA) were incubated for 1 h (RT). Bands were visualized via ECL Prime (GE Healthcare, USA) and quantified using ImageJ v1.53 (NIH, Bethesda, MD, USA).
Statistical analysis
Data are expressed as mean ± SEM. Fold-change (RoM, mean chemokine ratio) was assessed per individual study, with delta method-derived 95% CIs. 12 Normality of distribution was verified using Shapiro-Wilk test prior to parametric analysis. Group differences were analyzed using one-way ANOVA followed by Tukey’s post-hoc test for multiple comparisons. The sample size (n = 6–9 per group) was determined based on previous studies demonstrating sufficient power. Potential batch effects were minimized through randomized sample processing across experimental batches. All statistical analyses were performed using GraphPad Prism 9.0 (GraphPad Software Inc.). Statistical significance thresholds: *p < 0.05, **p < 0.01, ***p < 0.001, ****p < 0.0001.
Results
Serum chemokine profiles in transgenic AD mouse models
As depicted in Figure 1, serum concentrations of CCL5, CCL11, CCL17, CCL24, CCL27, and CXCL12 showed significant elevations in 3×Tg-AD mice relative to 2×Tg-AD controls. Quantitative comparisons demonstrated: CCL5 (570.80 ± 82.96 vs. 362.30 ± 29.34 pg/mL, +58%, RoM = 1.58, 95% CI = 1.14–2.18, p < 0.05; Figure 2A); CCL11 (14.14 ± 0.90 vs. 8.84 ± 1.33 ng/mL, +60%, RoM = 1.6, 95% CI = 1.16–2.2, p < 0.01; Figure 2B); CCL17 (4.94 ± 0.83 vs. 2.55 ± 0.73 ng/mL, +93%, RoM = 1.93, 95% CI = 1.01–3.72, p < 0.05; Figure 2C); CCL24 (311.94 ± 28.27 vs. 97.23 ± 7.30 ng/mL, +221%, RoM = 3.21, 95% CI = 2.55–4.04, p < 0.0001; Figure 2E); and CCL27 (19.67 ± 1.90 vs. 11.34 ± 1.08 ng/mL, +73%, RoM = 1.73, 95% CI = 1.33–2.26, p < 0.01; Figure 2F); CXCL12 (19.96 ± 2.63 vs. 9.24 ± 1.22 ng/mL, +116%, RoM = 2.16, 95% CI = 1.5–3.11, p < 0.001; Figure 2G). When compared to non-Tg controls (Figure 1, Table 1), three-tiered elevation patterns emerged in 3×Tg-AD mice: CCL11 (+82%, RoM = 1.82, 95% CI = 1.46–2.28, p < 0.01); CCL17 (+100%, RoM = 2.0, 95% CI = 1.34–2.98, p < 0.05); CCL24 (+233%, RoM = 3.33, 95% CI = 2.6–4.26, p < 0.0001); CCL27 (+46%, RoM = 1.46, 95% CI = 1.12–1.92, p < 0.05); and CXCL12 (+69%, RoM = 1.69, 95% CI = 1.23–2.31, p < 0.01). Comparative analysis of serum chemokine profiles in 3×Tg-AD, 2×Tg-AD, and non-Tg mice. Serum concentrations of specific chemokines (CCL5, CCL11, CCL17, CCL22, CCL24, CCL27, CXCL12) in 3×Tg-AD, 2×Tg-AD, and non-Tg mice. 3×Tg-AD mice exhibited significant elevations compared to 2×Tg-AD controls in: CCL5 (+57%, p = 0.026), CCL11 (+60%, p = 0.007), CCL17 (+94%, p = 0.04), CXCL12 (+110%, p = 0.0005), CCL24 (+221%, p < 0.0001), and CCL27 (+73%, p = 0.002). Summary of the changes of the significantly altered chemokines in serum, hippocampus and cortex in the three pairwise comparisons.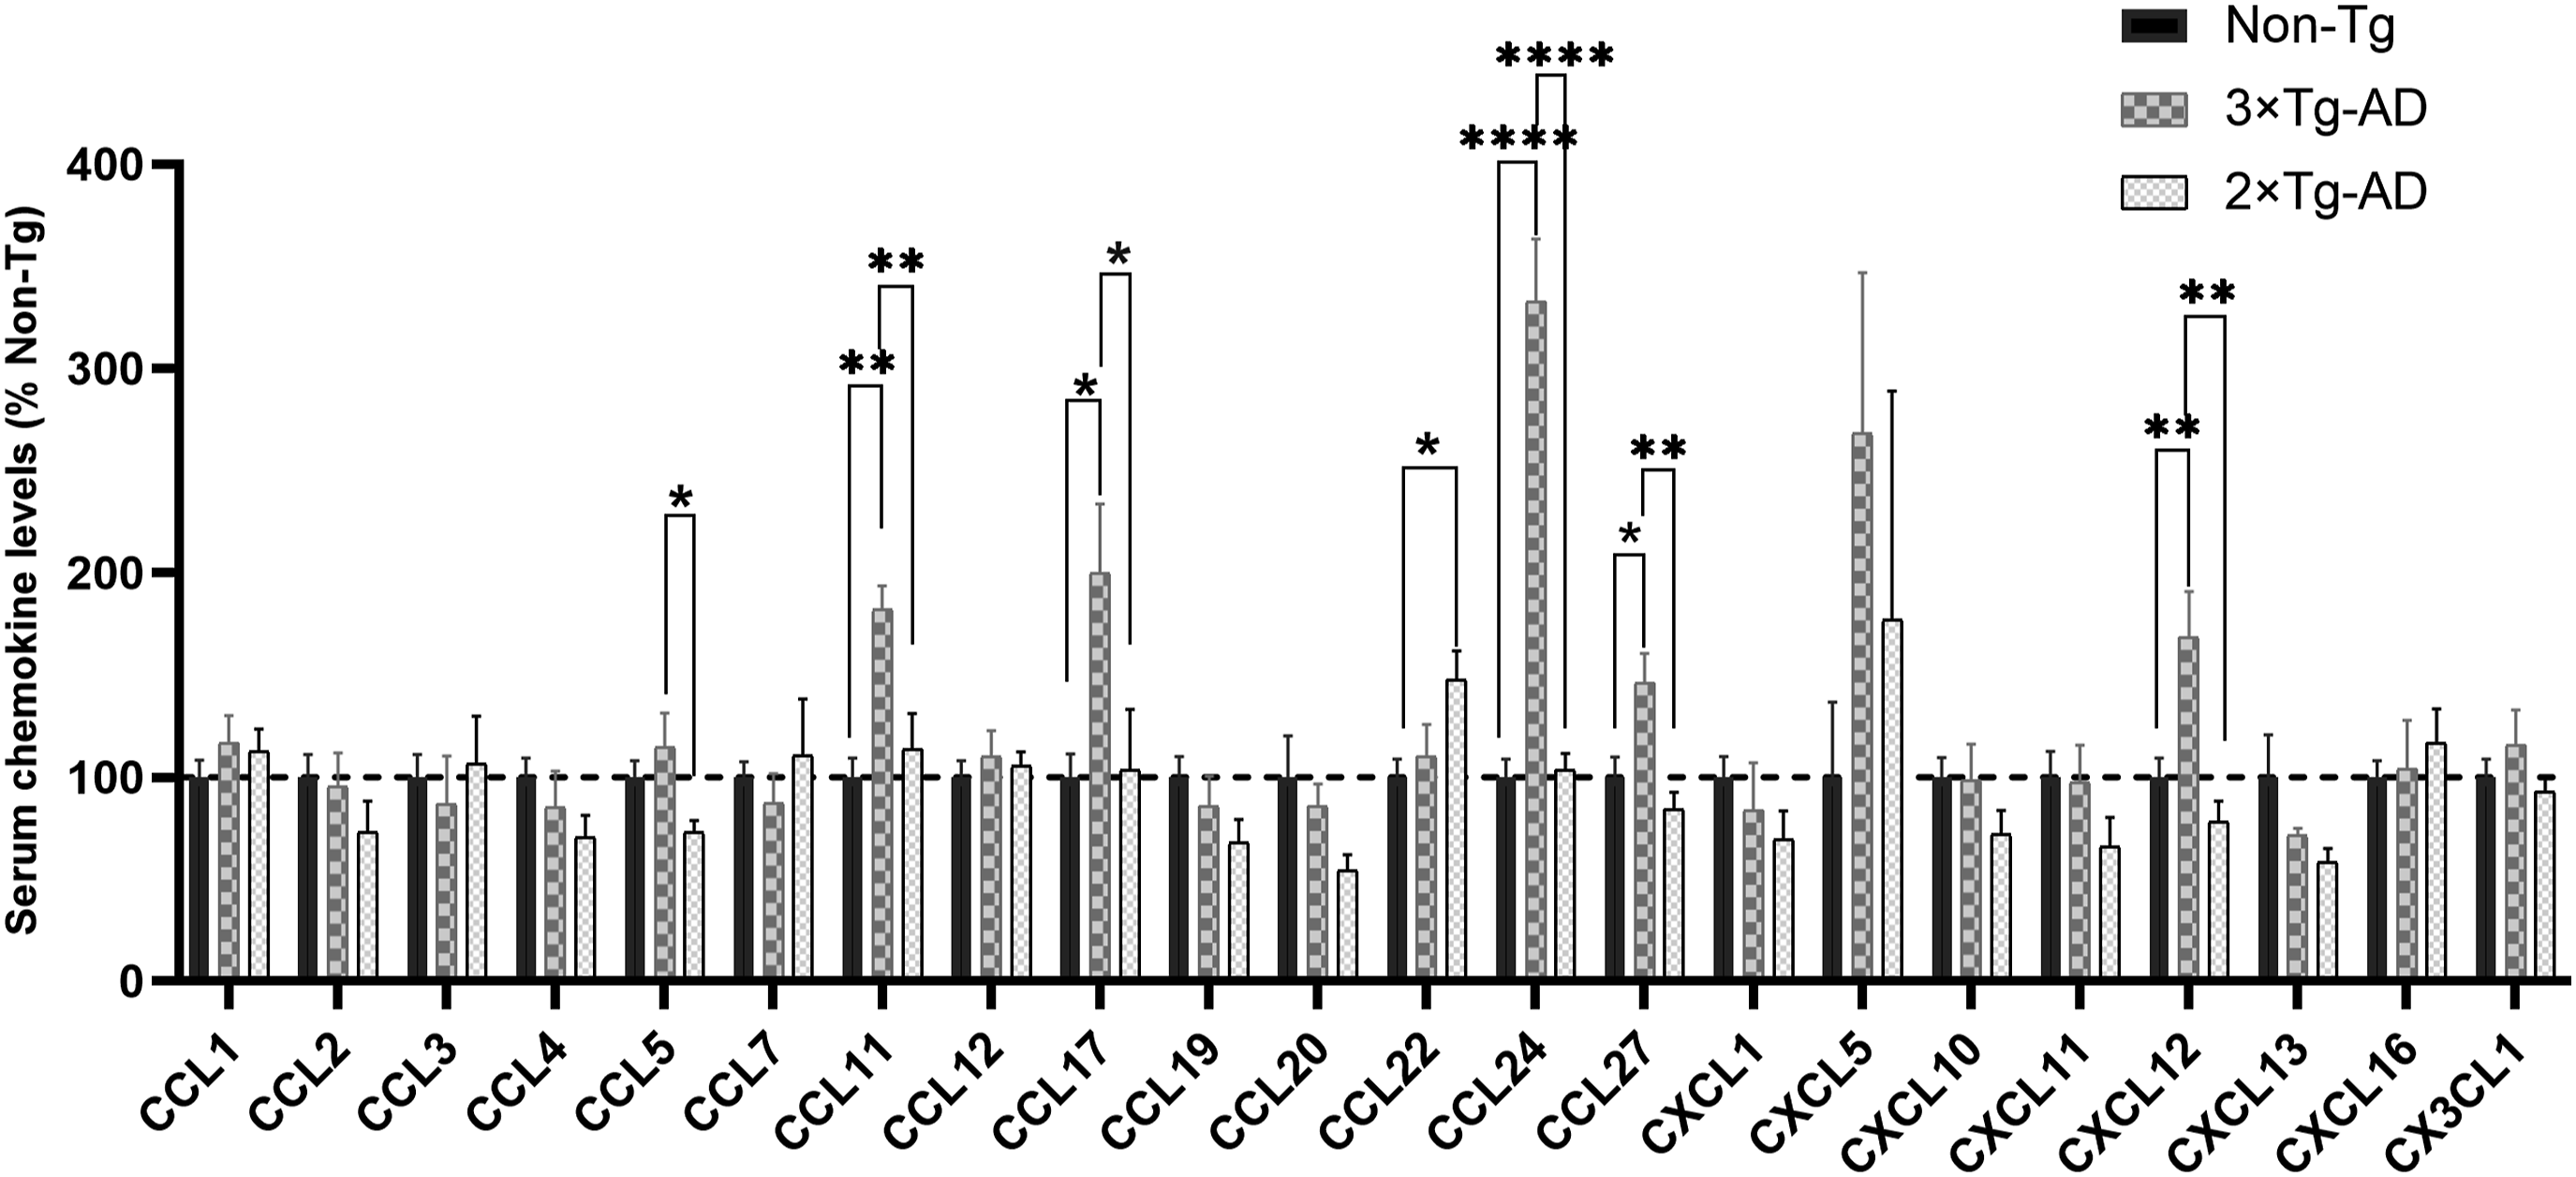

In 2×Tg-AD mice, only CCL22 showed significant elevation compared to non-Tg controls (2.05 ± 0.29 vs. 1.85 ± 0.16 ng/mL, p < 0.05; Figure 2D). No significant alterations were detected in the remaining 15 chemokines (CCL1, CCL2, CCL3, CCL4, CCL7, CCL12, CCL19, CCL20, CXCL1, CXCL5, CXCL10, CXCL11, CXCL13, CXCL16, CX3CL1).
Hippocampal chemokine dysregulation in AD transgenic models
Hippocampal chemokine profiling demonstrated genotype-dependent expression patterns (Figures 3 and 4), with three principal observations: (1) A 3×Tg-AD-specific elevation was observed for CXCL16, showing ≈1.5-fold higher levels versus 2×Tg-AD mice (15.33 ± 0.86 vs. 10.48 ± 1.44 pg/µg, +46%, RoM = 1.46, 95% CI = 1.09–1.96, p < 0.05; Figure 4D). (2) Marked increases in 2×Tg-AD mice were detected versus both transgenic and non-Tg controls: CCL3 increased by + 191% versus 3×Tg-AD (RoM = 2.91, 95% CI = 1.91-4.42, p < 0.001; Figure 4A) and +306% versus non-Tg (RoM = 4.06, 95% CI = 2.65-6.21, p < 0.001); CCL12 rose by + 140% versus 3×Tg-AD (RoM = 2.4, 95% CI = 1.68-3.43, p < 0.01; Figure 4B) and +79% versus non-Tg (RoM = 1.79, 95% CI = 1.16-2.74, p < 0.05). (3) In contrast, CCL17 exhibited 34% suppression in 2×Tg-AD versus non-Tg mice (RoM = 0.66, 95% CI = 0.46–0.96, p < 0.05; Figure 4C). Notably, the remaining 18 hippocampal chemokines showed no significant alterations across comparison groups (Figure 3). Differential expression of hippocampal chemokines across 3×Tg-AD, 2×Tg-AD, and non-Tg mice. Hippocampal chemokine levels (CCL3, CCL12, CCL17, CXCL16) in 3×Tg-AD, 2×Tg-AD, and non-Tg mice. Hippocampal chemokine dynamics with divergent trends: 3×Tg-AD-specific CXCL16 elevation (+46%, p = 0.013 vs. 2×Tg-AD); 2×Tg-AD-specific upregulation of CCL3 (+191% vs. 3×Tg-AD, p = 0.0043; +306% vs. non-Tg, p = 0.0004) and CCL12 (+140% vs. 3×Tg-AD, p = 0.006); CCL17 suppression in 2×Tg-AD (−34% vs. non-Tg, p = 0.041).

Cortical chemokine dysregulation in AD transgenic models
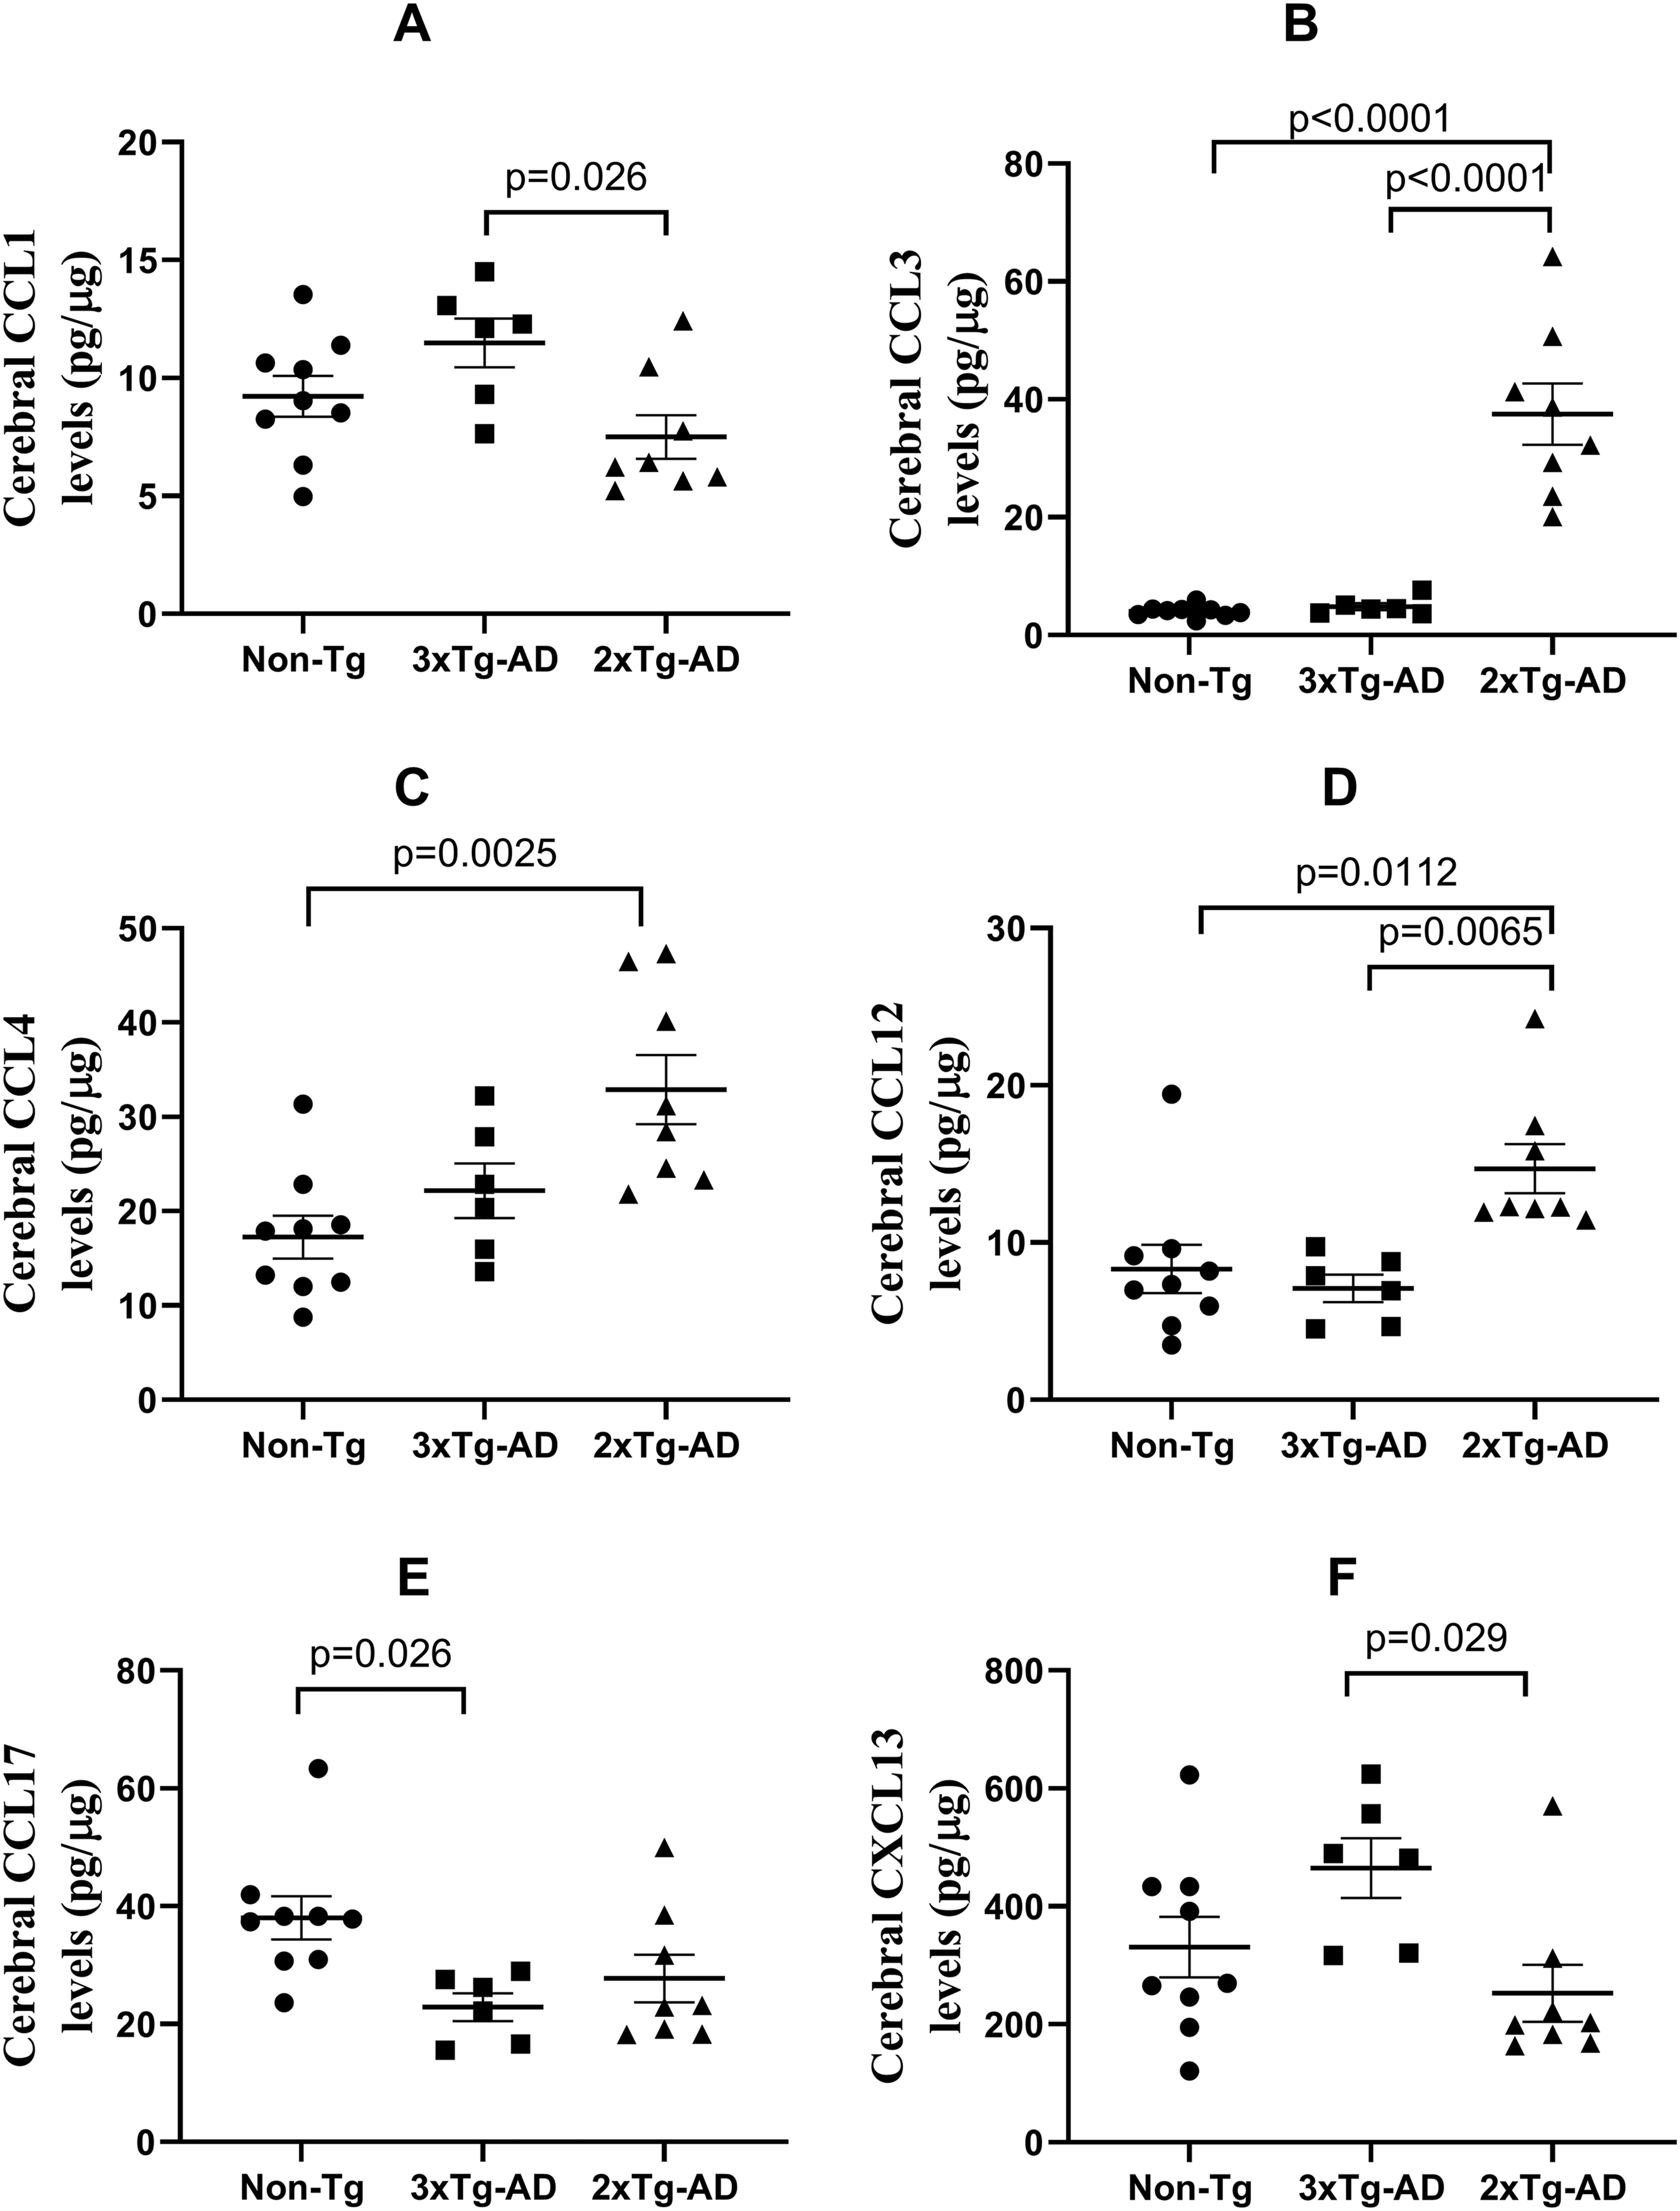
Cortical chemokine analysis identified distinct expression profiles between 3×Tg-AD and 2×Tg-AD mice (Figure 5). In 3×Tg-AD mice, CCL1 and CXCL13 exhibited significant elevation compared to 2×Tg-AD mice: CCL1 (11.49 ± 1.04 vs. 7.50 ± 0.92 pg/µg, +53%, RoM = 1.53, 95% CI = 1.14–2.06, p < 0.05; Figure 6A); CXCL13 (465.20 ± 50.78 vs. 252.80 ± 48.27 pg/µg, +84%, RoM = 1.84, 95% CI = 1.2–2.83, p < 0.05). Conversely, 2×Tg-AD mice exhibited pronounced upregulation of CCL3, CCL4, and CCL12 across all comparison groups: CCL3 increased by + 677% versus 3×Tg-AD (RoM = 7.76, 95% CI = 5.39–11.17, p < 0.0001; Figure 6B) and +826% versus non-Tg (RoM = 9.26, 95% CI = 6.12–14.01, p < 0.0001); CCL4 rose by + 91% versus non-Tg (RoM = 1.91, 95% CI = 1.36–2.67, p < 0.01; Figure 6C); CCL12 increased by + 77% versus non-Tg (RoM = 1.77, 95% CI = 1.12–1.92, p < 0.05; Figure 6D). Notably, CCL17 displayed opposing trends: levels were 66% higher in non-Tg versus 3×Tg-AD mice (38.05 ± 3.67 vs. 22.87 ± 2.34 pg/µg, RoM = 1.66, 95% CI = 1.26–2.19, p < 0.05; Figure 6E), whereas no significant difference was observed between 2×Tg-AD and non-Tg groups (data not shown). Cortical chemokine expression in 3×Tg-AD, 2×Tg-AD, and non-Tg mice. Cortical chemokine quantification (CCL1, CCL3, CCL4, CCL12, CCL17, CXCL13) in 3×Tg-AD, 2×Tg-AD, and non-Tg mice. Cortical chemokine alterations in transgenic models: 3×Tg-AD-driven increases in CCL1 (+53%, p = 0.026 vs. 2×Tg-AD) and CXCL13 (+84%, p = 0.029 vs. 2×Tg-AD); 2×Tg-AD-specific hyperactivation of CCL3 (+677% vs. 3×Tg-AD, p < 0.0001; +826% vs. non-Tg, p < 0.0001), CCL4 (+91%, p = 0.0025 vs. non-Tg), and CCL12 (+77%, p = 0.011 vs. non-Tg); Divergent CCL17 regulation (+66% in non-Tg vs. 3×Tg-AD, p = 0.026).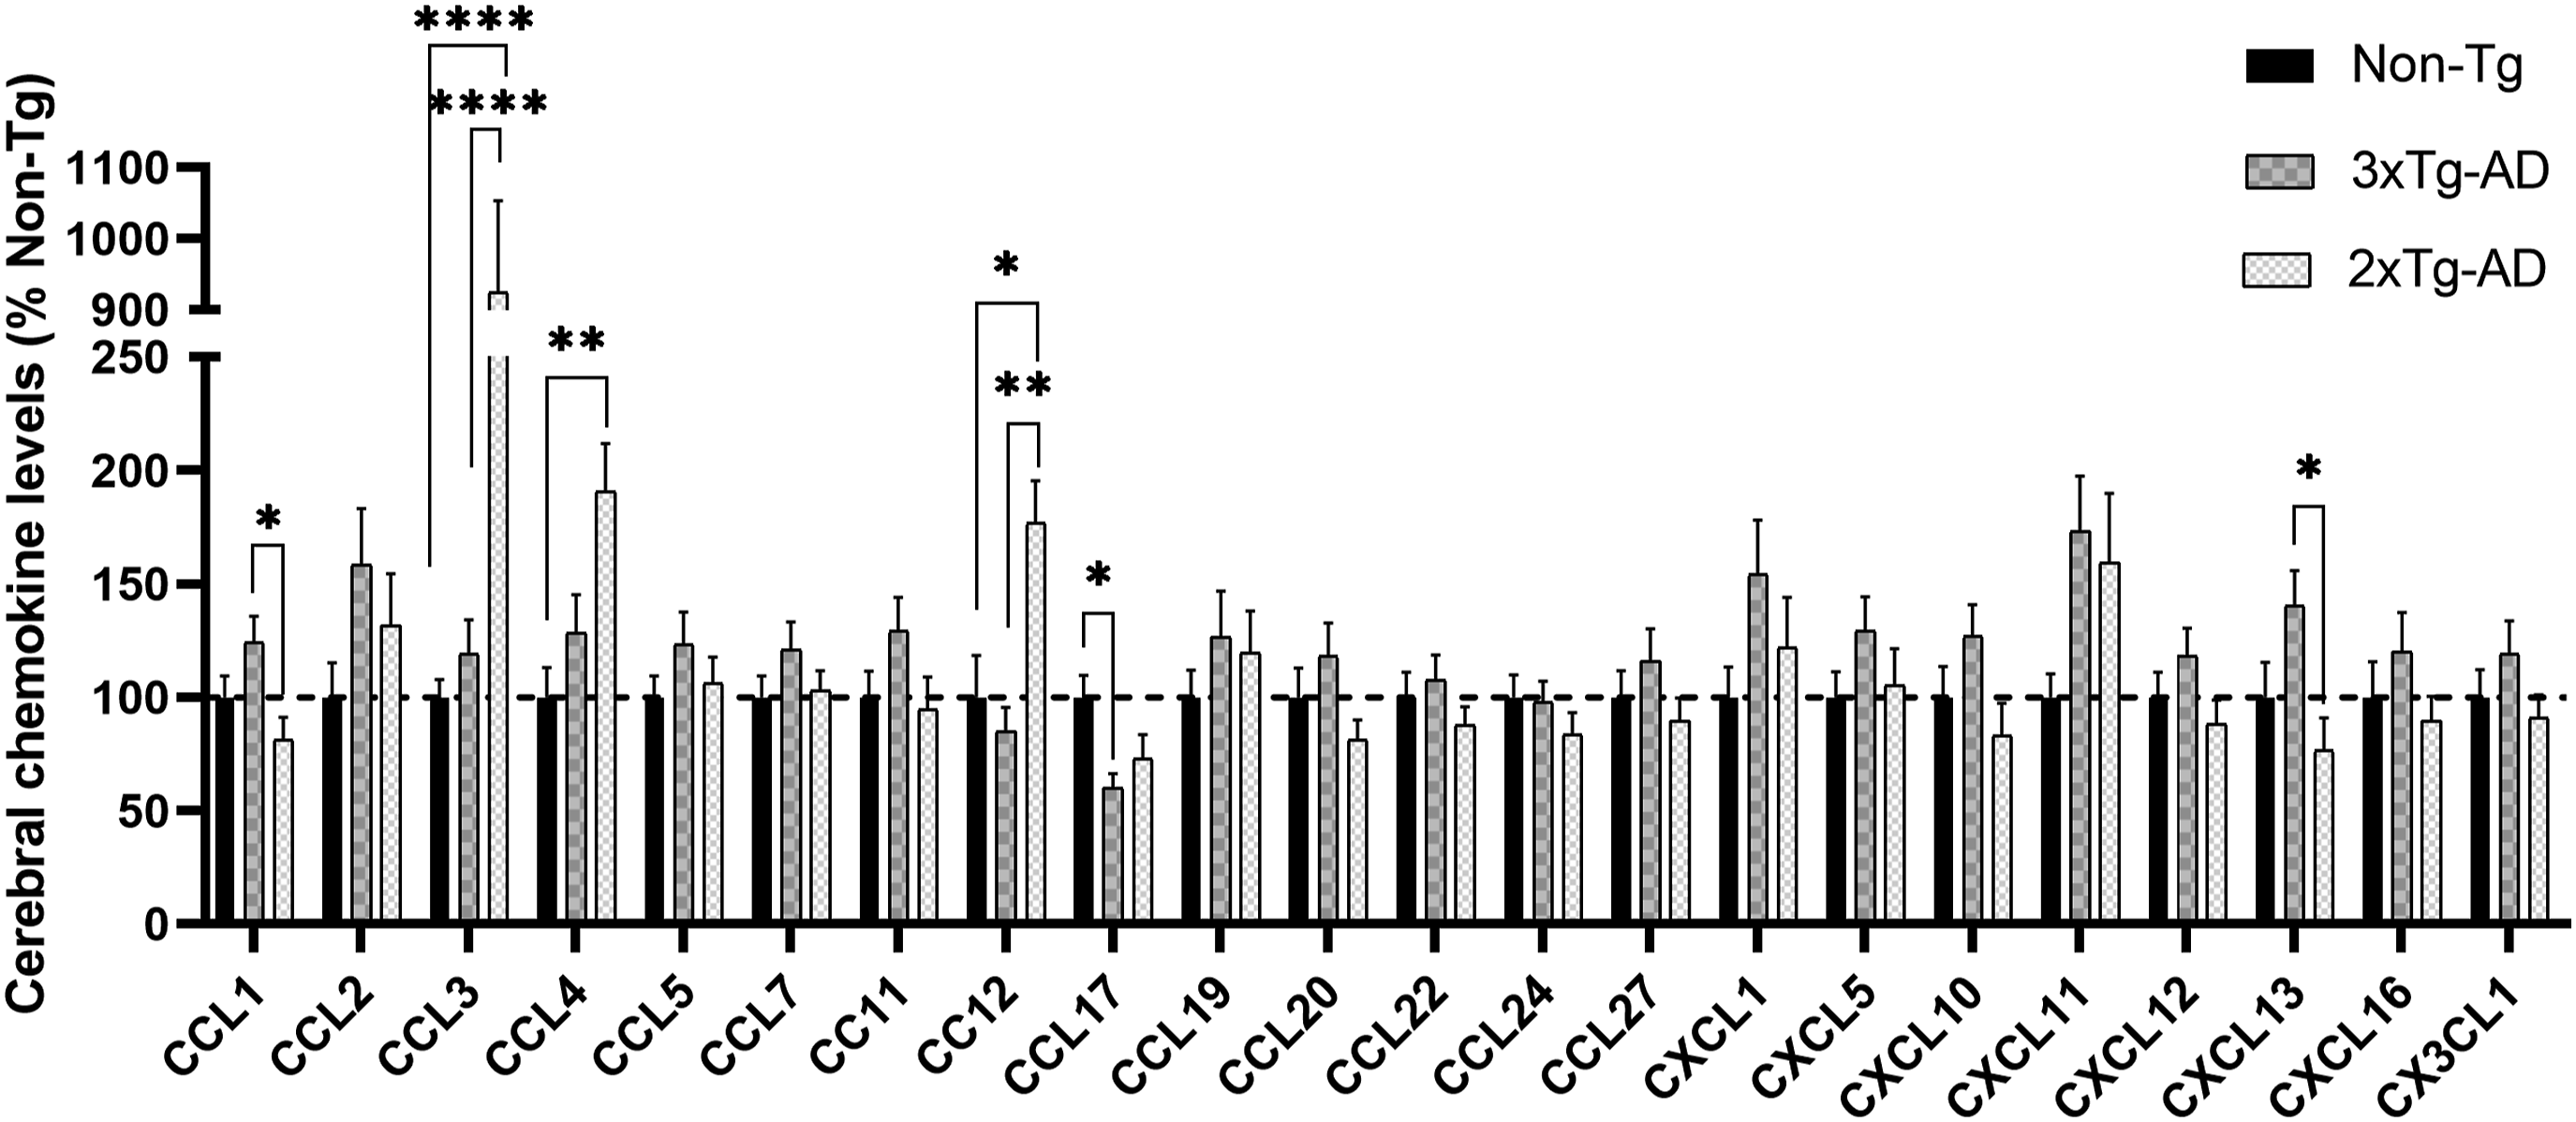
No alterations were detected in 16 other cortical chemokines (CCL2, CCL5, CCL7, CCL11, CCL19, CCL20, CCL22, CCL24, CCL27, CXCL1, CXCL5, CXCL10, CXCL11, CXCL12, CXCL16, CX3CL1).
Microglial and astrocytic activation profiles in AD transgenic models
To investigate neuroinflammatory glial responses and their potential linkage to chemokine dysregulation in Alzheimer’s disease pathogenesis, we quantified activation states of microglia and astrocytes through Western blot analysis of Iba1 (microglial marker) and GFAP (astrocytic marker) in 3×Tg-AD and 2×Tg-AD mice. Hippocampal microglial hyperactivity: Iba1 expression was 3.2-fold higher in 3×Tg-AD mice compared to non-Tg controls (p < 0.001; Figure 7A and B). This pronounced microglial activation positively correlated with elevated hippocampal CXCL16 levels. This suggests upregulation of CXCL16 by microglia. No significant GFAP changes were detected across groups (Figure 7C), indicating model-specific microglial predominance in neuroinflammatory responses. Western blot analyses of the expression of the Iba-1 and GFAP proteins in the hippocampus and cortex of 3×Tg-AD, 2×Tg-AD and non-Tg mice (12-month-old). The immunoblots and semiquantitative densitometric analyses are shown in the hippocampus (A–C) and cortex (D–F). *p < 0.05. GFAP: Glial fibrillary acidic protein; ns: not significant. Bar graphs showing the normalized comparison with the non-Tg mouse control.
Discussion
Our systematic characterization of chemokine networks identified 13 dysregulated mediators—CCL1, CCL3, CCL4, CCL5, CCL11, CCL12, CCL17, CCL22, CCL24, CCL27, CXCL12, CXCL13, and CXCL16—across 3×Tg-AD (APPswe/PS1M146V/TauP301L) and 2×Tg-AD (APPswe/PS1dE9) models, suggesting these chemokines critically contribute to Alzheimer’s disease (AD) pathogenesis. Three findings warrant emphasis: i) Hippocampal CXCL16-microglia axis: CXCL16 levels were 1.8-fold higher in 3×Tg-AD hippocampus versus 2×Tg-AD mice (p < 0.05), concomitant with significant microglial activation (3.2-fold Iba1 elevation vs. non-Tg). This spatial co-regulation implies CXCL16-mediated microglial priming may drive hippocampal neuroinflammation, consistent with human AD studies showing CXCL16+ plaque-associated microglia; ii) Model-specific chemokine signatures: 3×Tg-AD: Dominant upregulation of CCL1/CXCL13 (cortex) and CCL5/CCL11/CCL24 (serum). 2×Tg-AD: Selective elevation of CCL3/CCL4/CCL12 (brain) and CCL22 (serum). Pathogenic convergence: Shared chemokines (e.g., CCL17, CXCL12) exhibited compartmentalized dysregulation, reflecting blood-brain barrier dysfunction or cell-type-specific production.
In AD patients, CCL1 (I309) has been reported to be highly expressed in the blood. 13 CCL1 expression was significantly lower in the cortex of 2×Tg-AD mice, and I309 levels in cerebrospinal fluid (CSF) from AD patients have been shown to correlate with the severity of cognitive impairment. 14 Fewer studies have focused on CXCL13 in AD, although its expression levels have been associated with autoimmunity. A recent report 15 demonstrated that microglial depletion and repopulation did not alter amyloid pathology but did affect Tau hyperphosphorylation in the hippocampus of 3×Tg-AD mice, where the renewed microglial subpopulation exhibited strong expression of CXCL13. This finding suggests that CXCL13 plays a significant role in microglial renewal and tau pathology. In the present study, we observed higher levels of CCL1 and CXCL13 in the cortex, but not in the hippocampus, of 3×Tg-AD mice compared to 2×Tg-AD mice. These findings indicate that CCL1 and CXCL13 may play roles in the 3×Tg-AD model, particularly in tau pathology.
The chemokines CCL3, CCL4, and CCL5 share the common receptor CCR5. Additionally, CCL3 and CCL4 are members of the macrophage inflammatory protein 1 family. CCL3 has been shown to be expressed in neurons and microglia, 16 potentially enhancing neuronal network activity in vitro. 17 Elevated levels of CCL3 have been observed in peripheral blood T lymphocytes of AD patients compared to healthy controls. 18 Studies have reported upregulated CCL3 expression in brain autopsies of AD patients. 18 Our findings indicate that CCL3 levels are significantly elevated in the cortex and hippocampus of 2×Tg-AD mice compared to non-Tg and 3×Tg-AD mice. 19 This observation aligns with the study by Jorda et al. 20 which suggests that CCL3 overproduction may be involved in distinct mechanisms in 2×Tg-AD mice, potentially inhibited by specific molecules in the brains of 3×Tg-AD mice. CCL4 is considered to exert pro-inflammatory effects. 21 CCL4 is primarily expressed in reactive astrocytes, with elevated levels observed in the brains of AD patients. 16 The signaling pathway for Aβ1-42-induced CCL4 mRNA expression is exclusively dependent on phosphatidylinositol 3-kinase (PI3K). 22 Xia et al. 16 reported a substantial abundance of CCL4-positive astrocytes in the brains of AD patients, along with their association with amyloid deposition, suggesting that CCL4 is implicated in plaque-related responses. Morgan et al. 23 indicated that, compared to controls, patients with mild cognitive impairment (MCI) exhibited reduced plasma CCL4 levels, whereas AD patients displayed elevated plasma CCL4 levels relative to those with MCI. Zhu et al. 22 demonstrated that CCL4 mRNA and protein expression are upregulated and correlate with elevated Aβ levels in 2×Tg-AD mice. Our findings support the notion that CCL4 expression levels are significantly higher in the cortex of 2×Tg-AD mice compared to non-Tg mice, but not in 3×Tg-AD mice. Previous studies have consistently reported that CCL5 is upregulated in brain tissue from AD patients and mouse models, positively correlating with Aβ and tau pathology in AD mice.20,24 Moreover, studies have reported lower plasma CCL5 levels in AD patients compared to controls. 25 Conversely, other studies have indicated elevated plasma levels of CCL5 in AD patients relative to controls, with expression levels correlating with age and sex, notably showing higher levels in men. 26 Our data reveal that serum CCL5 expression levels are significantly higher in 3×Tg-AD mice compared to 2×Tg-AD mice, suggesting a role for CCL5 in the pathogenesis of AD. In 2×Tg-AD mice, as described in the studies mentioned above, studies found that up-regulation of CCL3 and CCL4 was accompanied by down-regulation of CCR5, their receptor. In CCR5-deficient mice, a greater number of reactive astrocytes were observed compared to CCR5+/+ mice, indicating that the absence of CCR5 promotes astrocyte activation. 27 Based on these findings, the expression differences of the three CCR5 ligands in AD transgenic mice may be influenced by the cellular source of the chemokines, the degree of cellular reactivity, and the effects of the knock-in genes.
CCL11 and CCL24, members of the eotaxin family, serve as chemotactic agents for eosinophils and play a significant role in innate immunity, commonly referred to as eotaxin-1 and eotaxin-2, respectively. Eotaxins are synthesized by various cell types. Inflammatory mediators stimulate in vitro cultured astrocytes, pericytes, and microglia to release CCL11.28,29 CCL11 has been implicated in the pathological processes of AD by disrupting neuronal structure and function. 30 CSF levels of CCL11 were significantly elevated in 2×Tg-AD mice compared to non-Tg mice,28,29 with CCL11 levels correlating positively with age. 31 Additionally, CCL11 concentrations in the cerebral cortex were found to be higher in 2×Tg-AD mice compared to non-Tg mice. 32 Studies have also detected overexpression of CCL11 in the serum of patients with mild cognitive impairment and in the plasma of AD patients. 23 While studies on CCL24 in AD remain limited, research has demonstrated that CCL11, CCL24, and CCL26 play critical roles in driving symptomatic inflammatory responses during allergic crises, particularly in clinical conditions like atopic asthma and atopic dermatitis. 33 Our study demonstrated that serum concentrations of CCL11 and CCL24 were significantly elevated in 3×Tg-AD mice, whereas no significant differences were observed in the hippocampus and cortex across the three pairwise comparisons. This suggests that CCL11 may be predominantly produced by peripheral cells and plays a critical role in the 3×Tg-AD model.
In the cortex, the expression of CCL12 (MCP-5) was significantly higher in 2×Tg-AD mice compared to non-Tg mice. 32 Under normal conditions, CCL12 is expressed in the lymph nodes and thymus and can be highly induced in macrophages. 34 In allergic responses, CCL12 facilitates the coordination of cell motility and the immune response to pathogens. 35 However, the role of CCL12 in AD has been less frequently reported. Our experimental data indicate that CCL12 levels were significantly elevated in the brain tissues of 2×Tg-AD mice, but not in 3×Tg-AD mice, consistent with previous studies. The mechanisms underlying these differences remain to be elucidated. 36
The chemokines CCL17 and CCL22 share a common receptor, CCR4. Previous studies have demonstrated that the expression levels of CCL17 and CCL22 are elevated in the cortex of 2×Tg-AD mice compared to non-Tg mice. 32 This elevation is associated with disease progression, as evidenced by increased plasma CCL17 concentrations in AD patients at month 54, but not at month 18. 32 In relation to CCL22, Roos et al. 37 identified a significant correlation between serum CCL22 levels and cognitive decline in CHMP2B-mediated frontotemporal dementia, indicating a peripheral inflammatory response to neurodegeneration. Moreover, decreased CCL22 levels are associated with reduced inflammation and demyelination. 38 In the present study, CCL17 was significantly up-regulated in the serum of 3×Tg-AD mice, while it was down-regulated in the hippocampus and cortex of the two AD model mice; in contrast, the expression level of CCL22 was significantly altered only in the serum of 2×Tg-AD mice. The underlying reasons for the differential expression of CCL17 and CCL22 remain unclear. The production of both chemokines appears to be regulated by distinct mediators in the central nervous system (CNS), 39 which may partially account for this discrepancy. 40
CCL27 has been implicated in allergic inflammatory processes in peripheral tissues; in the central nervous system (CNS), various CCL27 variants are predominantly expressed in neurons of the cerebral cortex and limbic regions. 39 Significantly elevated serum levels of CCL27 have been observed in AD patients. 41 Davila et al. 42 reported that CCL27 deficiency resulted in dysregulated localization of T cells that express CCR10, the cognate receptor for CCL27, as well as overreactive skin inflammatory responses, suggesting the role of CCL27 in establishing immune homeostasis in resident lymphocytes and barrier tissues. A prior study indicated that elevated circulating levels of CCL27 are associated with an increased risk of developing Alzheimer’s disease. 43 Laske et al. 44 found that in early-stage AD patients, plasma levels of CXCL12 were decreased and significantly negatively correlated with CSF tau protein levels, as well as positively correlated with CSF levels of CXCL12. In mice with ischemic brain injury, CXCL12-engineered endothelial progenitor cells enhance post-injury neurogenesis and angiogenesis. 45 Under pathological conditions, CXCL12 expression is upregulated in neurons and the endothelium of the post-ischemic hemispheric region, thereby promoting angiogenesis, neurogenesis, and synaptic transmission. 46 Our findings indicate elevated serum levels of CCL27 and CXCL12 expression in 3×Tg-AD mice, suggesting that both chemokines may play significant roles in both peripheral and central contexts within the 3×Tg-AD model. However, this relationship warrants further clarification.
It was known that in the brain CXCL16 levels increased with inflammatory conditions, and that both microglia and astrocytes released CXCL16. However, in the brain of AD, CXCL16 was identified to be located in plaque-associated myeloid cells of Iba1+. 47 Recently, studies showed that CXCL16 was consistently upregulated in brain tissues (including the hippocampus) of AD patients and mouse models and was positively correlated with Aβ and tau pathology in AD mice. 47 We found that CXCL16 expression levels were significantly higher in the hippocampus of 3×Tg-AD mice, where microglia were obviously activated, indicating that the up-regulation of CXCL16 appears to be due to microglia activation in 3×Tg-AD mice, which needs to be further verified.
While our multi-compartment chemokine mapping provides novel insights into AD model disparities, key questions remain: i) Cellular origins: single-cell RNA sequencing could delineate chemokine production by specific glial/neuronal subsets; ii) Functional validation: CCR5/CXCR6 knockout studies are needed to establish causality; iii) human translatability: Parallel analysis of AD patient biofluids would strengthen clinical relevance. In addition, two key limitations warrant consideration. First, reliance on a single 12-months timepoint (selected based on prior evidence of peak amyloid/tau pathology in these models) may obscure dynamic chemokine fluctuations during earlier or later disease stages. Second, the absence of behavioral or cognitive metrics (e.g., spatial memory deficits in Morris water maze) limits functional correlation with the observed chemokine-microglial axis dysregulation, particularly in 3×Tg-AD mice showing heightened hippocampal CXCL16 and microglial activation. Future longitudinal studies integrating multi-timepoint chemokine profiling and functional assessments will clarify temporal dynamics and clinical relevance.
Conclusions
The results showed significant changes in chemokines in the hippocampus, cortex, and serum of 12-month-old 3×Tg-AD and 2×Tg-AD mice. A total of 17 significantly altered chemokines were identified in the hippocampus (CCL3, CCL12, CCL17, CXCL16), cortex (CCL1, CCL3, CCL4, CCL12, CCL17, CXCL13), and serum (CCL5, CCL11, CCL17, CCL22, CCL24, CCL27, CXCL12). These chemokines may serve as key biomarkers or mechanistic mediators of Aβ deposition and tau phosphorylation in AD. Future studies should prioritize functional validation of these chemokine networks and their translational relevance to human AD pathobiology.
Ethical statement
All procedures performed in studies involving animals were approved by the Gannan Medical University Ethics Committee (approval number: 2021218; approval date: March 3, 2021). Experimental protocols were approved by the Institutional Animal Care and Use Committee of Gannan Medical University (approval no. 2021218; March 3, 2021).
Footnotes
Author contributions
ZF and SY wrote the main manuscript text, and XX, ZX prepared Figure 1 and ![]() . All authors reviewed the manuscript. The authors declare that all data were generated in-house and that no paper mill was used.
. All authors reviewed the manuscript. The authors declare that all data were generated in-house and that no paper mill was used.
Funding
The authors disclosed receipt of the following financial support for the research, authorship, and/or publication of this article: The work was supported by the National Natural Science Foundation of China (No. 32160212).
Declaration of conflicting interests
The authors declared no potential conflicts of interest with respect to the research, authorship, and/or publication of this article.
Data Availability Statement
Data were generated and are available upon reasonable request or clarify the repository (if not publicly shared).