
Abstract
Introduction
Oral carcinoma cancer exhibits high global incidence and mortality. Physalin A (PA) was reported to induce programmed cell death in cancer cells. No study has yet investigated the influence of PA in oral squamous cell carcinoma. Herein, this study aims to explore PA-induced anti-cancer effects in human oral carcinoma.
Methods
This study used DNA gel electrophoresis and Annexin V/PI staining to detect DNA fragmentation and cell apoptosis. Western blotting and immunofluorescence analyzed protein expression. Flow cytometry measured Ca2+ release and mitochondrial membrane potential (∆Ψm). Moreover, molecular docking models predicted the molecular binding affinity.
Results
DNA gel electrophoresis and annexin V/PI staining confirmed PA-induced DNA fragmentation and apoptosis. Flow cytometry showed PA increased Ca2+ release and reduced ∆Ψm levels. PA activated cleaved caspase-3, -8, and -9, upregulated Bax and Bid, and downregulated Bcl-2. PA dose-dependently increased Fas (CD95/APO-1), apoptosis-inducing factor (AIF), and cytochrome c release in western blotting analysis. Confocal microscopy confirmed increased Bax, AIF, cleaved caspase-3, and Fas, with decreased Bcl-2. Molecular docking showed strong PA binding via hydrophobic interactions with the Fas-associated death domain (FADD). Compared with cisplatin, PA inhibited HSC-3 cell xenograft tumor growth in NOD/SCID mice.
Discussion
We reveal that PA binds to the Fas-FADD complex, inducing caspase-8 activation and triggering extrinsic and intrinsic mitochondria-dependent apoptosis in HSC-3 cells. It also suppresses HSC-3 cell xenograft tumors in NOD/SCID mice. These findings suggest PA as a potential anti-oral cancer agent in the future.
Introduction
With high mortality rates in the human cancer population worldwide, oral squamous cell carcinoma (OSCC), as the 6th major cancer, owns the notoriety of most common malignant tumors in human head and neck.1,2 In 2020, of all new cancer cases, 3% belonged to the oral carcinoma ductal adenocarcinoma, which was responsible for 8% of cancer deaths. 3 Based on the data investigated in 2020 by the Global Cancer Observatory, OSCC had an annual incidence of 377,713 worldwide, and Asia accounts for the vast majority of cases. 4 Thus, OSCC may be the second leading cause of mortality cause of from cancer in developed countries. 5 Clinical treatment for oral cancer includes surgical therapy, radiotherapy, and chemotherapy.6,7 However, side effects are caused by unsatisfactory cure rates in patients. One of the best strategies for testing the compounds is triggering cancer cell apoptosis.
Apoptosis is recognized as programmed cell death, a major molecular mechanism for regulated cell death. Thus, it is referred to the development of cell suicide, which may be employed upon cell damage or stress or cells under stimulation during normal development and morphogenesis. Therefore, the development of cell apoptosis could be triggered through cell surface death receptors like Fas (CD95/APO1), TNF-related apoptosis-inducing ligand (TRAIL) receptors, and tumor necrosis factor-α (TNF-α), which is an extrinsic signaling apoptotic pathway. 8 Another pathway may be through stress that activates caspases (cysteine aspartyl proteases) and permeabilizes the intrinsic mitochondrial membrane for mitochondria dysfunction or leads to apoptotic cell death. 9 Intrinsic stimuli develop apoptosis via mitochondria dysfunction, which depends on the balance of Bcl family protein expression, and it is named the intrinsic mitochondrial signaling pathway.10–12 While the apoptosis signaling occurs, the mitochondrial membrane is destroyed and cytochrome c is released then induces caspase-9 to activate caspase-3, -6, and -7 leading to cell apoptosis. Moreover, the other apoptosis inducer factors, such as Apoptosis-inducing factor (AIF) and Endonuclease G (EndoG) released from mitochondria, will move to the nucleus and directly induce cell apoptosis. 13
Natural products, including compounds isolated or derived from natural plants, have been used against human cancer. Therefore, scientists are committed to finding compounds from natural and synthetic products suitable for treating oral cancer patients. Physalin A is the most widely studied bioactive compound of withanolides extracted from Physalis angulata L. Physalin A is shown to present pharmacological activities in particular, such as anti-fungal, anti-inflammatory, and analgesic 14 and anti-tumor activities. 15 PA induced G2/M phase arrest of the cell cycle which was reported in human lung cancer A549 cells 16 and triggered cell apoptosis and autophagy in human skin cancer A375-S2 cells. 17 PA-activated Fas is associated with the death receptor involved in the extrinsic apoptotic pathways on human fibrosarcoma cells 18 and owns the ability to up-regulate detoxifying enzyme expression via Nuclear factor erythroid 2–related factor 2 (Nrf2) activation in hepatocellular carcinoma HepG2 cells. 19 However, the anticancer activities of PA with its molecular mechanism are still not fully elucidated. The purpose of this study is to explore molecular mechanisms associated with PA-induced cell apoptosis in human oral squamous carcinoma cells in vitro and in vivo.
Materials and methods
Chemicals and reagents
Physalin A (PA) (C28H30O10) was obtained and identified from Physalis angulate L., a natural plant collected at Nantou Country, Taiwan (Figure 1).
20
4',6-diamidino-2-phenylindole (DAPI; D1306), propidium iodide (PI; P1304MP), and trypsin-EDTA (25200056), Dulbecco’s modified Eagle’s medium (DMEM; 12491015), fetal bovine serum (FBS; A5670701), L-glutamine (25030081), and penicillin-streptomycin (15070063) were obtained from Thermo Fisher Scientific (MA, USA). Annexin V-FITC/PI Apoptosis Detection Kit (556547) gained from Becton Dickinson and Company (NJ, USA). All the antibodies used in this study were a commercial product from Cell Signaling Technology (MA, USA) which were listed below: Bid (#8762), Bcl2-associated X protein (Bax) (#2772), Bcl-2 (#15071), Fas (#8023), cytochrome c (#11940), caspase-9 (#9502), caspase-3 (#9662), caspase-8 (#9496), β-actin (#4967) and AIF (#4642). The chemical structure of PA.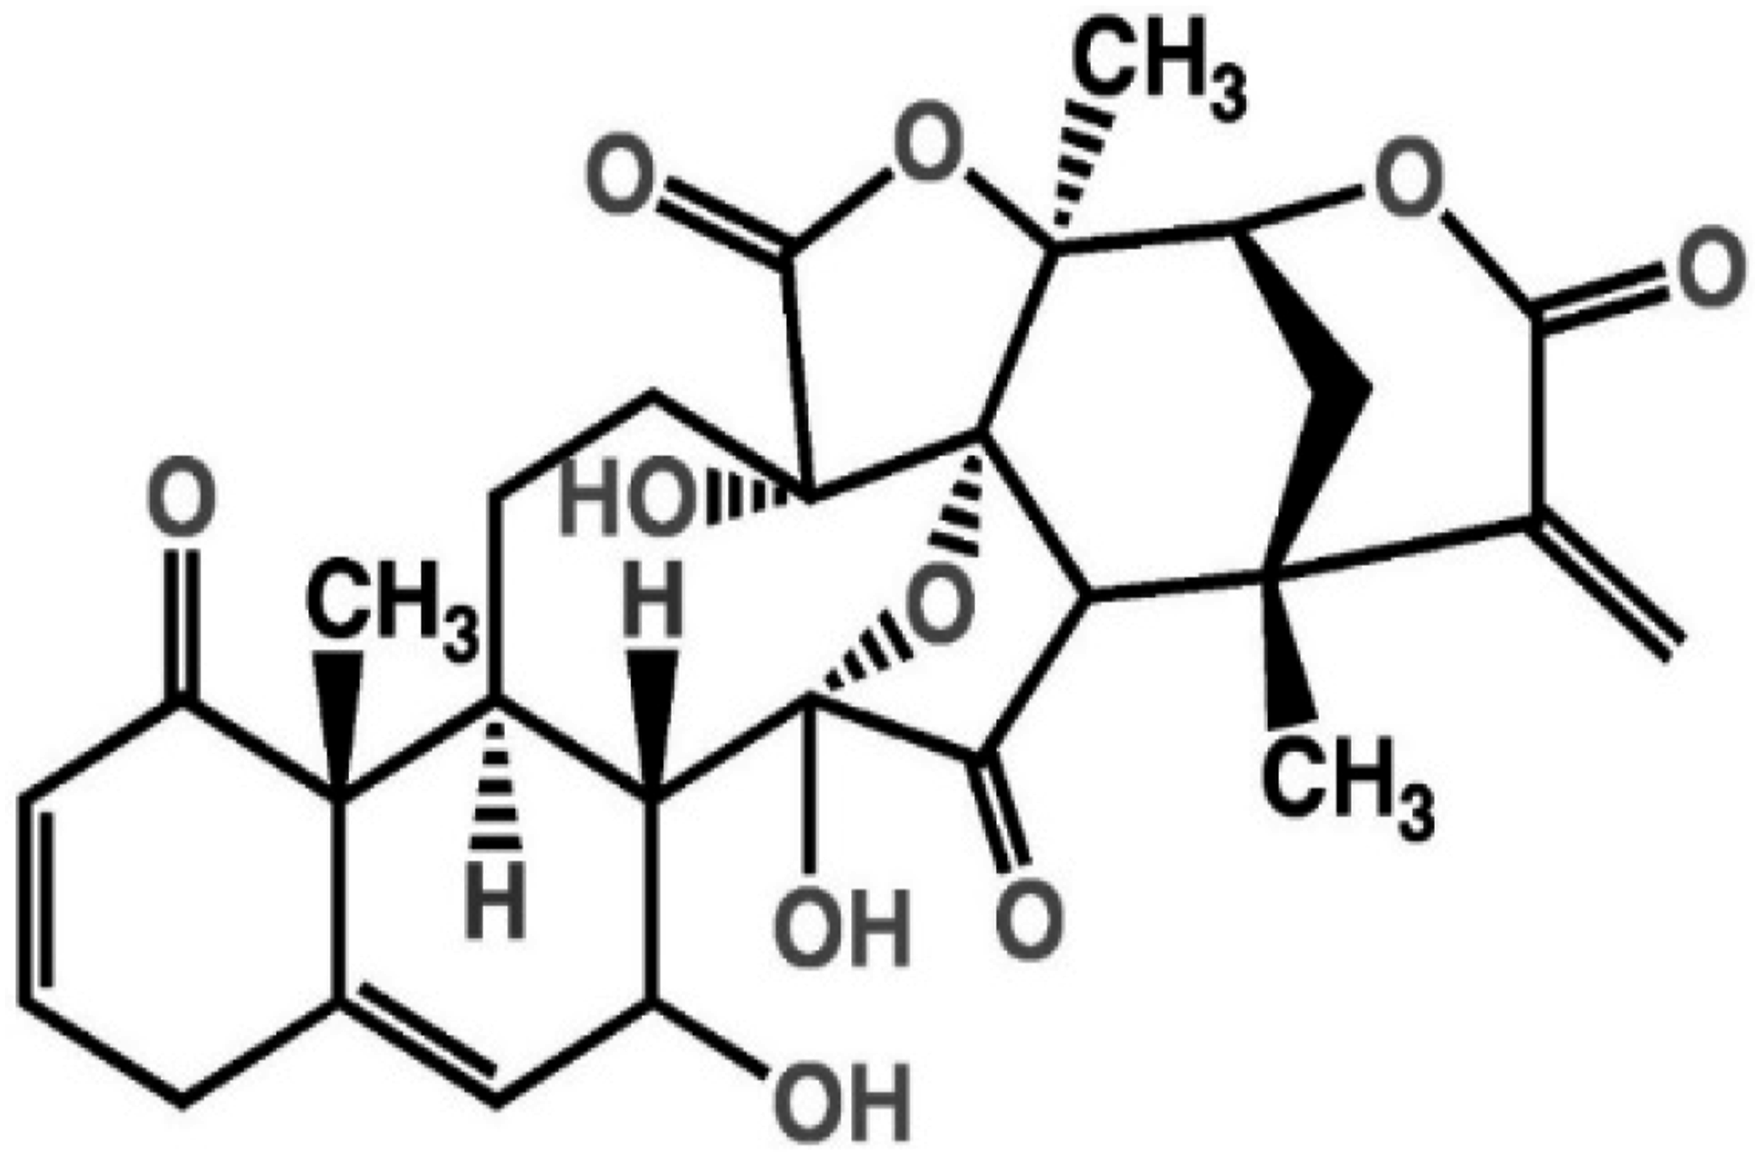
Cell cultures
The HSC-3 cell line was described before. 21 Cells were immediately cultured in flasks with DMEM supplemented with 10% FBS and containing 100 μg/ml streptomycin, 100 units/ml penicillin, and 2 mM L-glutamine, and were kept at 37°C with 5% CO2 and 95% air in a digital incubator chamber. HSC-3 cells are sub-cultured when they reach 80%–90% confluence following the standard protocol, as shown before.22,23
DAPI staining
DAPI staining is used for measuring chromatin condensation (a marker of cell apoptosis) as we have used before. 24 Briefly describe, HSC-3 cells (2 × 10⁵ cells/well) were cultured in 12-well plates and treated with 0, 0.8, 1.6, 3.1, 6.2, and 12.5 μM of PA for 24 h. Samples were collected, washed 3 times with filtered PBS, and then fixed with 3.7% paraformaldehyde for 20 min. After removing and thoroughly washing away any remaining fixative, sufficient 2 μg/mL DAPI stain solution was added individually to cells kept in the dark for 5 min. Then, cells on the plates were monitored and photographed using a fluorescence microscope at 200 × as shown before.22,23
DNA fragmentation assay
HSC-3 cells (1 × 10⁶ cells/well) were seeded in 6-well plates overnight and incubated with PA (0, 1.6, 3.1, 6.2, and 12.5 μM) in medium for 24 h. Samples were processed using DNA lysis buffer for 30 min on ice. DNA lysis buffer was supplemented with proteinase K and RNase A to ensure the integrity and stability of the added samples to cells. Finally, purified DNA was electrophoresed on a 2% agarose gel and photographed under a UV box. 25
Annexin V/PI double staining assay
We previously utilized Annexin V/PI double staining in conjunction with flow cytometry to assess cellular apoptosis before. 26 HSC-3 cells (2 × 10⁵ cells/well) were cultured in the 24-well plates and stimulated with PA (0, 1.6, 3.1, 6.2, and 12.5 μM) for 24 h. After collection, the sample was washed with PBS buffer, suspended in 500 μL of Annexin V binding buffer, and incubated in the dark with 10 μL of Annexin V-FITC/propidium iodide reagent (the original volumes of both were 5 μL respectively) for 5 min. Apoptotic cell death in each sample was analyzed using BD FACSCalibur flow cytometry (Ex = 248 nm; Em = 350 nm) as shown before. 26
Measurement of mitochondria membrane potential (ΔΨm) and [Ca2+] production
The methodology for measuring the production of [Ca2+] and mitochondria membrane potential (MMP, ΔΨm) are similar to those described previously. 27 HSC-3 cells (1 × 10⁵ cells/well) were cultured in 24-well culture plates overnight and treated with 6.2 μM of PA for 0, 3, 6, 12, and 24 h. Testing samples were then washed, detached, and pipetted in Indo-1Acetoxymethyl ester (Indo-1/AM) (3 μg/mL) for Ca2+ detection, while 3,3’-dihexyloxacarbocyanine iodide (DiOC6) 4 nM 15 min was used for ΔΨm measurement with BD FACSCalibur flow cytometry (Ex = 488 nm; Em = 525 nm). All the procedures were processed in the dark with a flow cytometer.
Western blotting
HSC-3 cells (2 × 10⁶ cells/well) were maintained in 10 cm dishes for the further step to incubate with PA (0, 1.6, 3.1, 6.2, and 12.5 μM) for 24 h. When the scheduled time was reached, samples were harvested and lysed, and the total protein was quantitated using the Abcam Protein Extraction Kit (Cambridge, UK). The electrophoresis procedure was run on a 10%–12% Sodium dodecyl-sulfate polyacrylamide gel electrophoresis (SDS-PAGE) and then transferred to a polyvinylidene difluoride (PVDF) membrane, with each sample containing 50 μg of protein. The blocking buffer was composed of 3% albumin in phosphate-buffered saline with Tween20 (PBST) and was used to block the pores on the PVDF membrane. It was further incubated with primary antibodies overnight at 4°C. All primary antibody concentrations were set to parts per thousand. After membranes were soaked in PBST containing peroxidase-labeled secondary antibody at 1:5000 dilution for 1.5 h at room temperature. Protein bands were detected and visualized by a Bio-Rad ChemiDoc™ MP imaging system. 25
Immunofluorescence staining
HSC-3 cells culture formula was progressed on 6 well plates (1.5 × 10⁴ cells/well) with 0, 3.1, and 6.2 μM of PA for 24 h. We applied 4% paraformaldehyde for the fixation for 20 min and further permeabilized with 0.3% PBST for 1 h. Samples were probed and incubated with anti-Bax, -Bcl-2, -AIF, -caspase-3, and -Fas. A secondary antibody with FITC fluorescent was conjugated to the primary body in the dark, and the temperature was controlled at room temperature. The nucleus was lately stained by DAPI, further detected and recorded by a TCS SP2 confocal microscope (Leica, German). 28
Protein-ligand docking
All the docking calculations in this study were executed by the PyRx (v. 0.98) program with Autodock Vina.29,30 The ligand structure of Physalin A was constructed through the Reaxys database (Elsevier, NL). Construction of Fas ligand’s structure (FASL or CD95L, PDB: 3EZQ) is reliable information according to RCSB Protein Data Bank. 31 The molecular docking simulation was performed in settled-up grid box space dimensions (X = 73.07 Å, Y = 87.33 Å, Z = 98.34 Å) while the structures were well-prepared. The docking simulation was conducted with the exhaustiveness parameter set to 50, while the number of modes set to 9. AutoDock Vina can retrieve different conformations of the candidate ligands to predict the optimal binding site. Analyzation of the simulation was based on the binding affinity of a protein-ligand complex. In the meantime, the binding affinity unit was assigned to kcal/mol. PyMOL Molecular Graphics System (v.2.4, Schrödinger, USA) was applied to visualize the outcomes. 32 Interactions between protein and ligand were operated and analyzed by the “LIGPLOT” module in the Ligplot + program (v.2.2). 33
Xenotransplantation of HSC-3 cells in NOD/SCID mice
NOD.CB17-Prkdcscid/NcrCrlVr (NOD/SCID) mice 5 weeks of age were obtained from BioLASCO Taiwan Co., Ltd. (Taipei, Taiwan). The experiments followed the ethical guidelines for animal experiments of the Affidavit of Approval of Animal Use Protocol approved by the Institutional Animal Care and Use Committee (IACUC) of China Medical University (CMUIACUC-2020-174). The animals were housed in specific pathogen-free facility cages with a 12-h light-dark cycle at 22°C to 24°C and 50% humidity. NOD/SCID received 5 × 10⁶ cells HSC-3 cells were suspended in 50 μl serum-free medium and a mixture with 50 μl Matrigel Matrix was injected subcutaneously into the right flank of the mice for 7 days. Use a caliper to measure the mouse tumor volume. Calculate the tumor volume with the following formula: tumor volume (mm3) = L × W2/2 (L is the length and W is the width). When the average tumor volume reached 200–300 mm3, 6–8 animals were randomly divided into the control and experimental groups. Mice were treated orally with PBS per day (as the control group), cisplatin (2 mg/kg/dose) per week, PA 5 mg/kg, and PA 20 mg/kg per day intragastric (IG). After 28 days of drug treatment, all mice were anesthetized with isoflurane and sacrificed, and measured the tumor weights. Compare the tumor growth curves of the control and treatment groups. Mouse xenograft tumors were paraffin-embedded, sectioned, and stained with hematoxylin and eosin (H&E), as previously described. 34
Statistical analysis
All the statistical analyses were performed using SPSS 25.0 software. Student’s t-test or One-way analysis of variance was performed to analyze the significance of differences in continuous variables between groups. Body weight, and organ weight, the significance of differences between the sample and control group was tested after calculating Mean ± SD in each mouse. The data were obtained from at least three independent experiments. p-values < 0.05 were considered statistically significant. *p < 0.05, **p < 0.01, ***p < 0.001.
Results
PA promoted the chromatin condensation in HSC-3 cells
After treatment of different concentrations of PA (0, 0.8, 1.6, 3.1, 6.2, and 12.5 μM) in HSC-3 cells at 37°C for 24 h, samples were further harvested and stained with DAPI solution. Examination and photography were carried out using fluorescence microscopy; the results are shown in Figure 2. Quantification and calculation of fluorescence digital images including drug-treated and control groups were then narrated in Figure 2. Results showed that HSC-3 cells treated with PA own brighter fluorescence than the control group. The effects of PA treatment were up-regulated from 26 to 137% in a concentration-dependent (Figure 2). Bright fluorescence in the cells means the presence of chromatin condensation. PA promotes chromatin condensation in HSC-3. HSC-3 was cultured with PA (0, 0.8, 1.6, 3.1, 6.2, and 12.5 μM) for 24 h, and chromatin was stained by applying a DAPI solution. Images were further captured using a fluorescence microscope. Intensities of blue fluorescent were recorded and output as relative fluorescence intensity of chromatin condensation as described in Materials and Methods. Data represent the mean ± S.D. of three experiments. Significantly different from the control (PA at 0 μM) was showed with *p < 0.05, **p < 0.01, ***p < 0.001.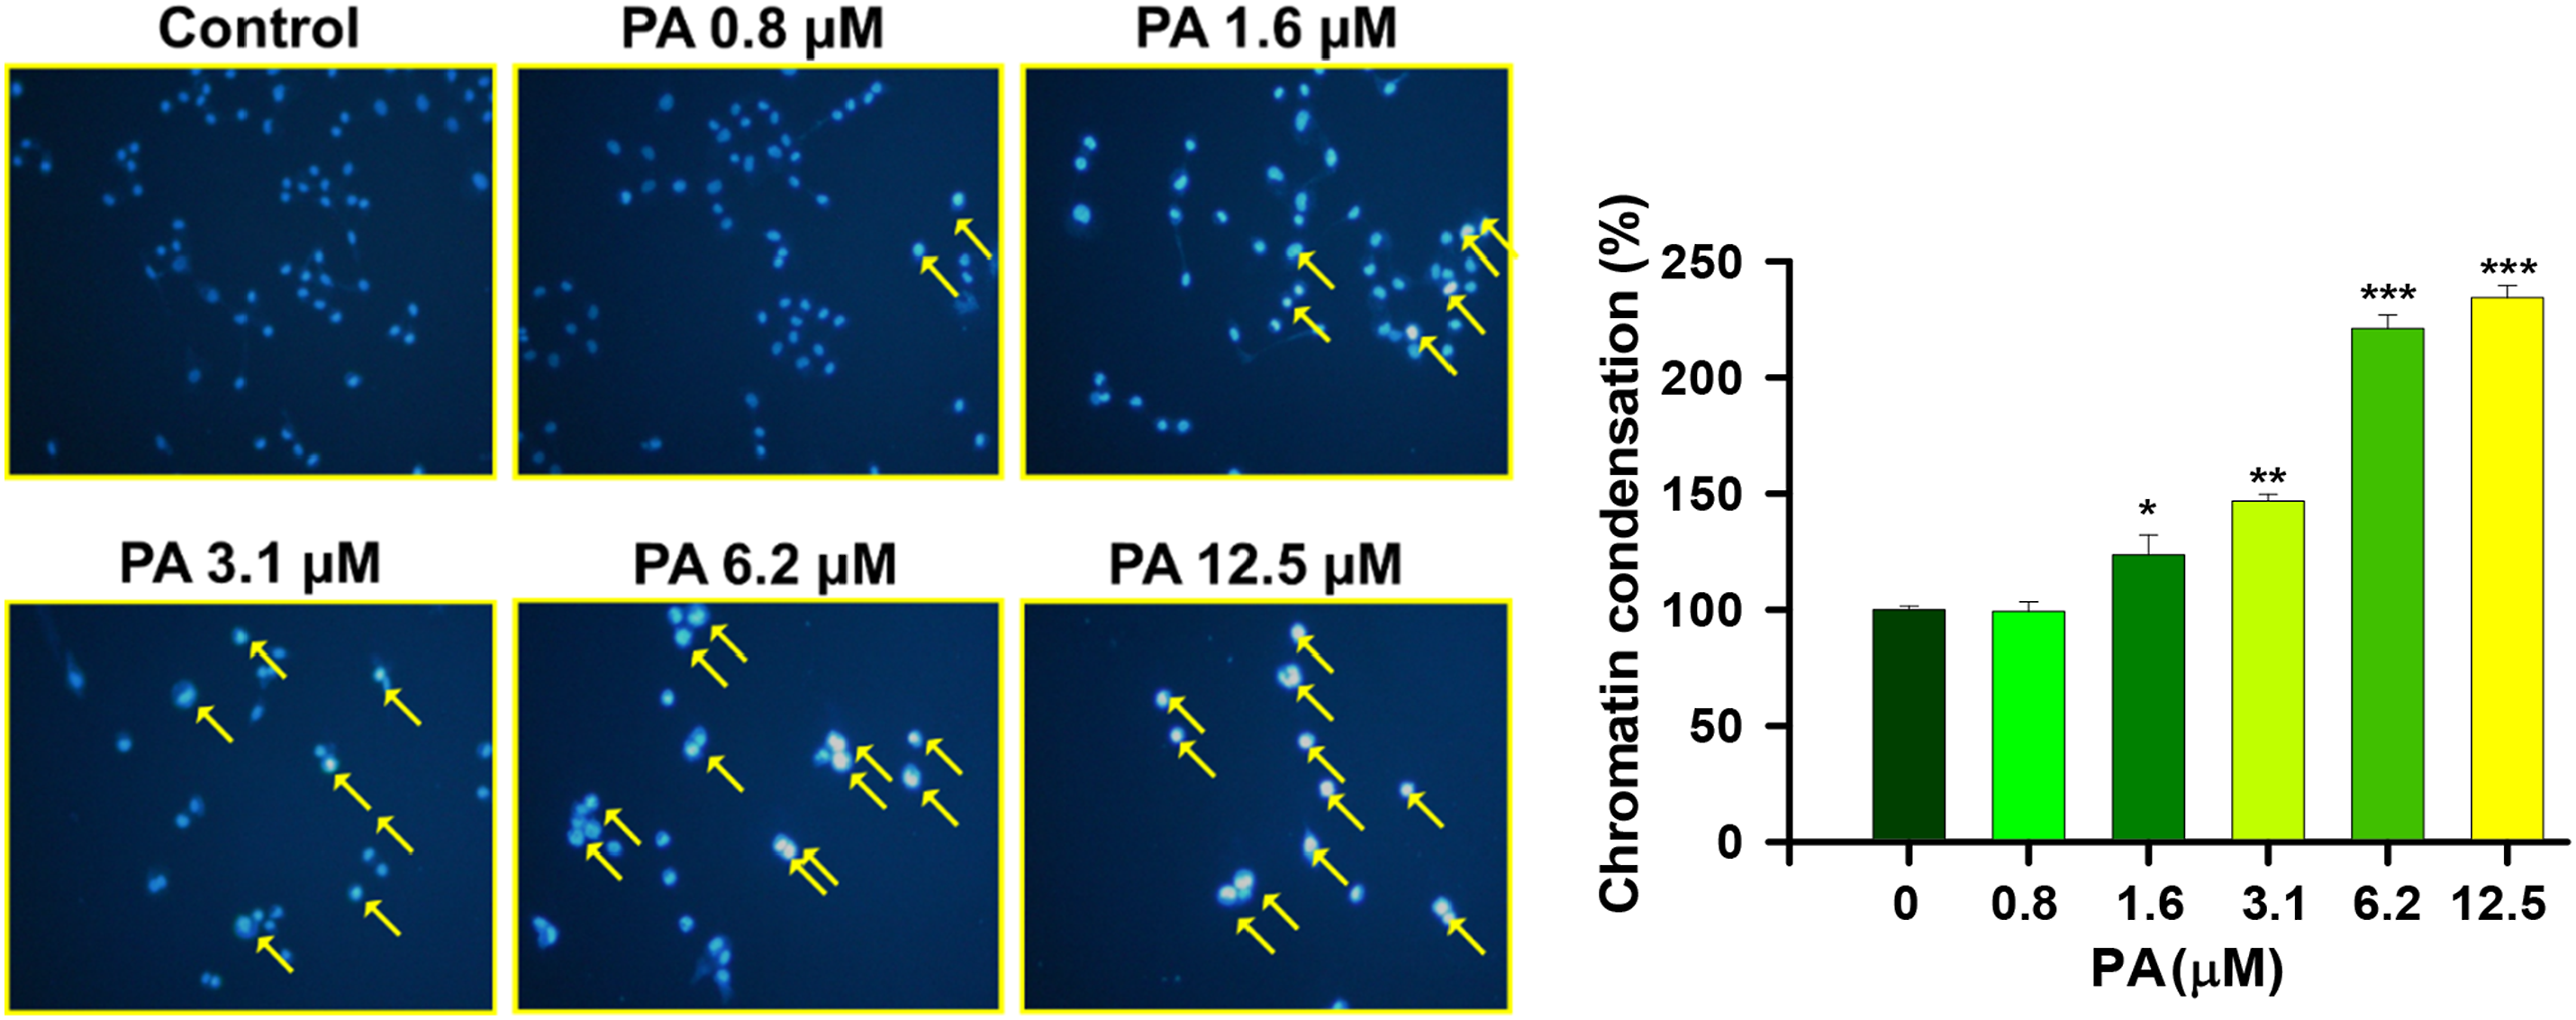
PA induced DNA fragmentation in HSC-3 cells
PA reduced total cell viability and induced chromatin condensation, which may indicate that PA has the potential to induce HSC-3 cell apoptosis. Therefore, we used DNA gel electrophoresis to investigate denatured and damaged DNA in HSC-3 cells after PA (0, 1.6, 3.1, 6.2, and 12.5 μM) treatment. The results are presented in Figure 3, which indicates PA at 6.2 and 12.5 μM significant induced DNA fragmentation. Thus, based on the recognition of DNA fragmentation as a hallmark of cell apoptosis, we speculated that PA induced cell apoptosis in HSC-3 cells. PA induces DNA fragmentation in HSC-3 cells. HSC-3 cells (1 × 10⁶ cells/dish) were placed in 6-well plates and treated with PA (0, 1.6, 3.1, 6.2, and 12.5 μM) for 48 h. Cells were trypsinized, harvested, and treated with DNA lysis buffer on ice for 30 min. DNA solutions were collected and analyzed on DNA gel electrophoresis as described in Materials and Methods.
PA induced apoptotic cell death dose-dependently in HSC-3 cells
Results from DNA gel electrophoresis and high doses of PA promoted HSC-3 DNA fragmentation, which is a typical feature of apoptosis; thus, investigating the situation about apoptotic cell death. Annexin V/PI double staining was applied using a flow cytometer. The results are shown in Figure 4. The data compared to control groups showed. PA increased the amount of apoptotic cell death from 39 to 68% in HSC-3 cells with the dosage of 1.6 to 12.5 μM. These outcomes showed that when it comes to the induction of cell apoptosis, PA appeared concentration-dependent in HSC-3 cells. PA increased apoptotic cell death dose-dependently in HSC-3 cells. Each group of HSC-3 was treated with PA (0, 1.6, 3.1, 6.2, and 12.5 μM) separately for 24 h which that Annexin-V/PI double can be used to visualize the situation of apoptotic cell death. The profiles of flow cytometric assay and the percentage of apoptotic cell death were performed as described in Materials and Methods. Data represent the mean ± S.D. of three experiments. Significantly different from the control (PA at 0 μM) was shown with post-hoc tests: Tukey, Scheffe, and Bonferroni. *p < 0.05, **p < 0.01, ***p < 0.001.
PA altered intracellular [Ca2+] production and ΔΨm in HSC-3 cells
ΔΨm was measured after treatment within 6.2 μM PA a fixed time interval with flow cytometry. Results were presented in Figure 5(A) and (B). Results indicated that PA increased Ca2+ production (Figure 5(A)) at examined periods and decreased ΔΨm after 24 h treatment (Figure 5(B)). It is indicated that PA affects intracellular [Ca2+] production and ΔΨm in HSC-3 cells. PA altered intracellular Ca2+ production and ΔΨm levels in HSC-3 cells. Cells were treated with 6.2 μM of PA at different times (0, 3, 6, 12,18, and 24 h), cells were collected to measure Ca2+ (A) and ΔΨm (B) by using a flow cytometer as described in Materials and Methods. Data represent the mean ± S.D. of three experiments. Significantly different from the control (PA at 0 μM) was according to ANOVA and Tukey, Schaffé, or Bonferroni a posteriori tests, *p < 0.05, **p < 0.01, ***p < 0.001.
PA altered apoptosis-related protein cleavage and expression
To further explore the involvement of the apoptosis-related protein in PA-induced programmed cell death in HSC-3 cells, these target proteins were detected by immunoblotting, and the outcomes were presented in Figure 6(A)–(C). Figure 6(A) showed that PA increased cleaved caspase-8, -3, and -9, this may imply the involvement between the cleavage of the caspase family and the induction of cell apoptosis in PA-treated HSC-3 cells. Figure 6(B) indicates that PA up-regulates pro-apoptotic proteins like Bax and Bid and down-regulates anti-apoptotic protein Bcl-2 expression in HSC-3 cells. Moreover, PA increased other apoptosis-related proteins like Fas, cytochrome c, and AIF (Figure 6(C)). Based on the results mentioned above, we confirmed that PA actively participated in the progression of cell apoptosis in HSC-3 cells. PA altered apoptosis-associated protein expression in HSC-3 cells. Cells were treated with 0, 1.6, 3.1, 6.2, and 12.5 μM of PA for 24 h. Western blotting demonstrated the situation of pro-apoptotic protein expression. (A): caspase-3, cleaved caspase-3, caspase-8, cleaved caspase-8, caspase-9, and cleaved caspase-9. (B): Bax, Bid, Bcl-2. (C): Fas, AIF, cytochrome c (cyto c) as described in Materials and Methods. Data represent the mean ± S.D. of three experiments. Significantly different from the control (PA at 0 μM) was showed with *p < 0.05, **p < 0.01, ***p < 0.001.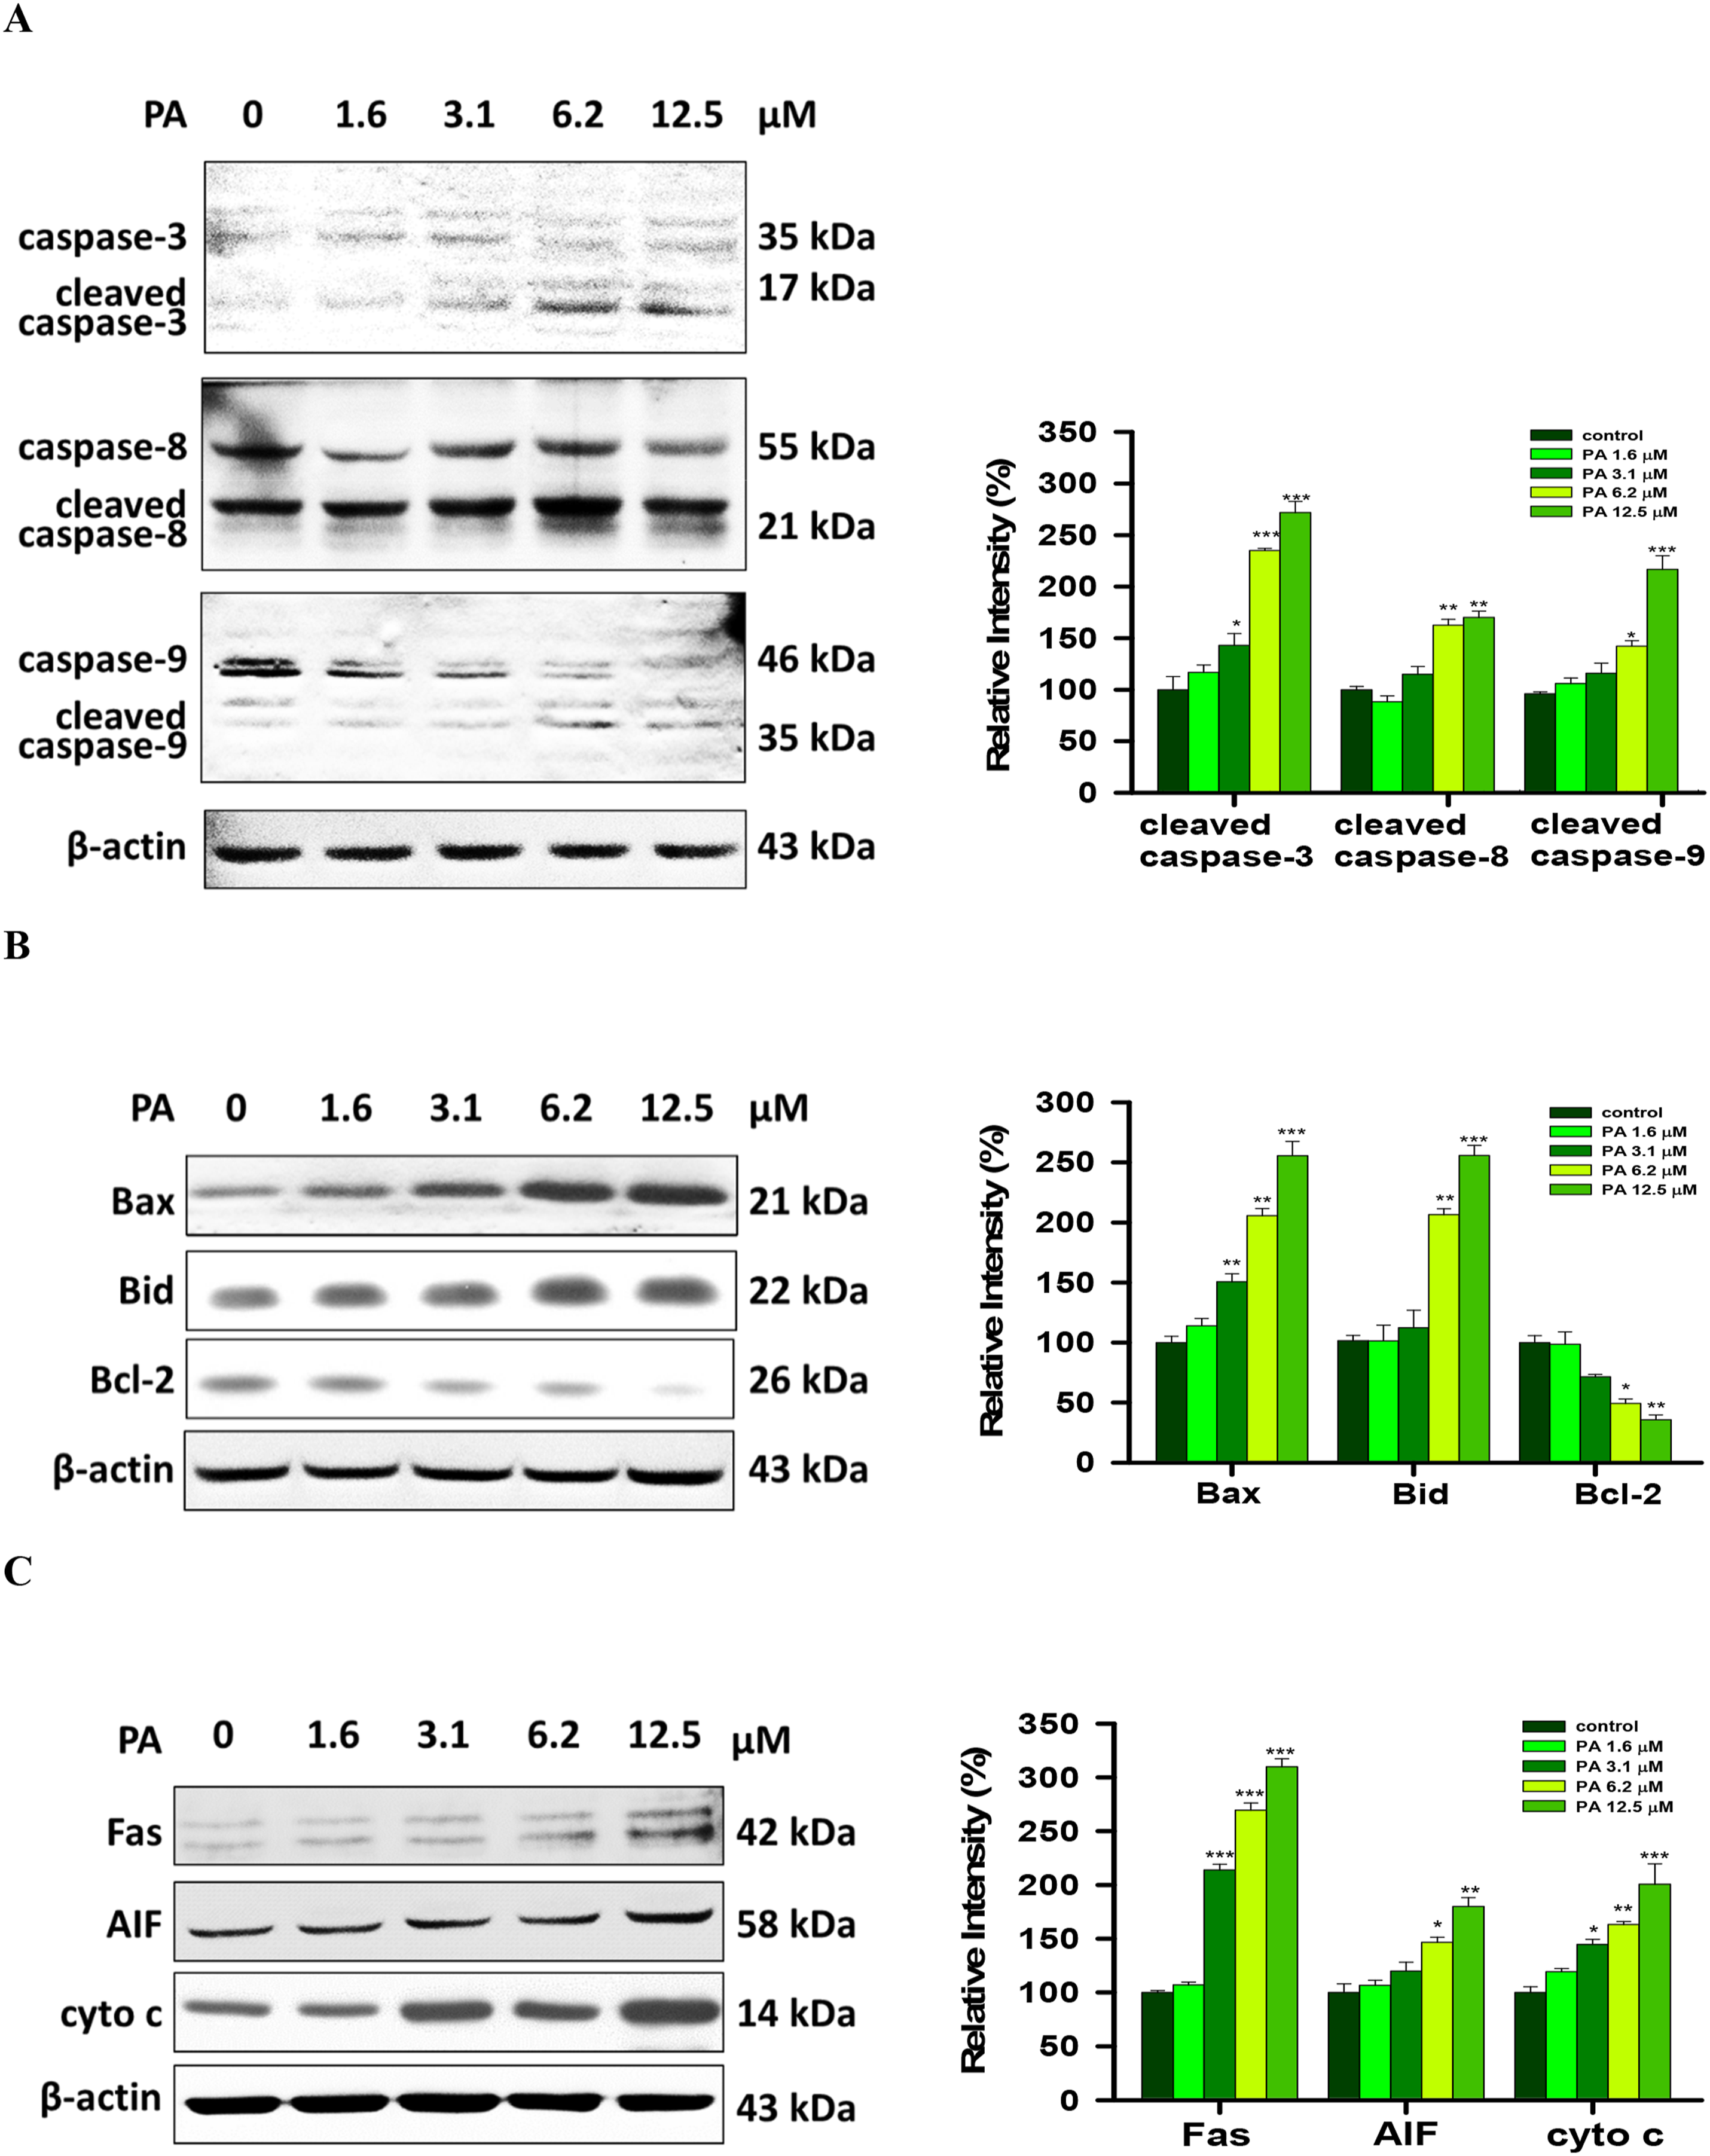
PA transformed the subcellular localization of Fas, Bax, Bcl-2, AIF, and cleaved caspase-3 in HSC-3 cells
HSC-3 cells were stimulated with dosages of 0, 3.1, and 6.2 μM PA for 24 h. To verify the distribution of apoptosis-related protein in PA-stimulated HSC-3 cells, we used immunofluorescence staining to examine the subcellular localization of Fas, Bax, Bcl-2, AIF, and caspase-3 in whole cells with confocal laser microscopy. Fluorescence images were shown in Figure 7(A)–(E). Results indicated that PA increased Bax (Figure 7(A)), AIF (Figure 7(C)), cleaved caspase-3 (Figure 7(D)) and Fas (Figure 7(E)) but decreased Bcl-2 (Figure 7(B)) in the cytoplasm. Our study identified these proteins are associated with programmed cell death (apoptosis) in HSC-3 cells after being treated with PA in vitro. PA transformed the subcellular localization of Bax, Bcl-2, AIF, cleaved caspase-3, and Fas in HSC-3 cells. Samples incubated with different concentration (0, 3.1, and 6.2 μM) of PA for 24 h, and cells were conjugated with primary antibody as follows: Bax (A), Bcl-2 (B), AIF (C), cleaved caspase-3 (D), and Fas (E) and then were stained with secondary antibody (FITC-conjugated goat anti-mouse IgG; green fluorescence) and all cells were stained by DAPI (blue fluorescence) for nucleus double-check examination. After that, fluorescence images were captured by operating a confocal microscope, and the analysis procedure was executed as we described in Materials and Methods. Data represent the mean ± S.D. of three experiments. Significantly different from the control (PA at 0 μM) was shown with *p < 0.05, **p < 0.01, and ***p < 0.001.
PA bound to Fas-FADD complex in Molecular Docking Model Analysis
The molecular docking analysis of PA interacts with Fas-FADD complex to evaluate potential interaction sites is shown with PyRx. The best potential models were expected by the PyRx program, and they are shown in Figure 8(A). The model forecasts that the PA may suit the space between different death domains formed by Fas and FADD complex and interact with Asp106 (2.3 Å), Asn107 (3.0 Å), and Tyr291 (3.1 Å) in FADD complex through hydrogen bonds and hydrophobic interactions (Figure 8(B)). In this model, the calculation output demonstrated that the optimal binding affinity for PA to FAS-FADD complex is −7.9 kcal/mol (Figure 8(B)). Our outcomes may indicate that PA induces apoptosis in human oral cancer cells involving the conjunction and activation of the Fas-FADD complex. PA bound to Fas-FADD complex in Molecular Docking Model Analysis. (A) The comprehensive docking simulation displayed that PA is primarily conjugated to the site between the Fas-FADD inner surface. (B) In the ligand-protein docking model assays, hydrophobic interaction and hydrogen bonds create a stable conjugate status between PA and Fas-FADD complexes. The upper molecular visualization showed the 3D molecular structure of PA binding with Fas-FADD in the Protein-Ligand Docking Models. The right side of molecular visualization showed the LIGPLOT program for the automatic generation of 2D ligand-protein interaction diagrams, red eyebrow-like icons illustrate hydrophobic interactions and the green dash line indicates the hydrogen bond pairing with each other. The detailed experimental forms are described in Materials and Methods.
PA inhibits tumor growth and tumorigenesis in NOD/SCID mice
NOD/SCID mice were xenotransplanted with live HSC-3 tumor cells. As shown in Figure 9, after 4 weeks of drug treatment, the mice were sacrificed and dissected, and the tumors were weighed. No significant in body weight (Figure 9(A)). The volume of inoculated tumors was calculated every 4 days (Figure 9(B)). The gross lesions were observed in the submitted organs of the brain, heart, lung, livers, spleens, and kidneys (Data did not show). PA did not affect the weight of mouse organs, while cisplatin affected the weight of the heart, liver, and kidneys (Table 1). In serum biochemical assays, the experimental results showed that PA did not affect the biochemical values, but cisplatin increased ALT and decreased BUN and creatinine values (Table 2). As shown in Figure 9(C), treatment with PA or cisplatin alone partially inhibited tumor growth and reduced tumor weight compared with the control group. However, it did not affect the body weight of mice. In terms of organ effects, In terms of freehand analysis, cisplatin will increase ALT and creatinine. In H&E satin, tumor masses displayed massive central necrosis and expressed spindle to oval shape with predominant nucleolus (Figure 9(D)). Based above results which indicted PA inhibited tumor growth and tumorigenesis in NOD/SCID mice. PA inhibits tumor growth and tumorigenesis in the Xenograft tumor model in NOD/SCID mice. HSC-3 cells (5 × 10⁶) in matrix-gel mixture were injected subcutaneously into the right flank of the 6-7-week-old NOD/SCID mice. Mice were treated orally with PBS per day (as the control group), cisplatin (2 mg/kg) per week, PA 5 mg/kg, and PA 20 mg/kg per day for 28 days. (A) Body weight was measured per 4 days for 28 days. (B) Tumor volumes were detected per 4 days for 28 days. (C) Tumor morphology after sacrifice at 28 days was recorded. (D) In H&E satin, tumor masses displayed massive central necrosis (N) in the central area (40×), and tumor cells located mainly in the peripheral area of masses (100×, 200×). Tumor cells expressed spindle to oval shape with predominant nucleolus with high mitotic index (arrow) (400×) as described in Materials and Methods. Data represent the mean ± S.D. of three experiments. Significantly different from the control (PA at 0 μM) was showed with *p < 0.05, **p < 0.01, ***p < 0.001. PA influenced organ weight in xenograft tumor NOD/SCID mice. *p < 0.05, **p < 0.01 significantly different from each group by student’s t-test, respectively. PA influenced serum biochemical value in xenograft tumor NOD/SCID mice. Abbreviation: AST: Aspartate Transaminase, ALT: Alanine Transaminase, BUN: Blood urea nitrogen. *p < 0.05, **p < 0.01, ***p < 0.001 Significantly different from each group by Student’s t-test, respectively.


Discussion
HSC-3 cell lines have been widely used for targeted drug delivery research by analyzing the expression of cytokeratin 5.6, E-cadherin, vimentin, chromogranin A, synaptophysin, SSTR2, and NTR1 molecules as the model for anti-oral carcinoma cancer research.23,35 Currently, research has confirmed that some anticancer drugs that induce apoptosis in cancer cells can be obtained from natural products. 36 Many reports showed that people nutritional fruits and vegetables which are documented to be potential candidates for further development as chemotherapeutic agents. 37 However, some of the clinical drugs may induce side effects that threaten the lives quality, and quantity of patients, which may limit their usage in cancer patients. Thus, clinically used drugs from natural products reduce those side effects that may promote the efficacy of treating patients. In this study, PA is chosen to inspect whether it can induce human cancer-programmed cell death. In our earlier outcomes, PA decreases HSC-3 cell viability in vitro; thus, the potential of PA to induce programmed cell death in HSC-3 cells is further investigated.
Therefore, our first experiment is to measure chromatin condensation level in HSC-3 cells after exposure to geometric series dosages of PA for 24 h, and further staining of DAPI solution, the results were shown in Figure 2(A) and (B), which showed PA induce chromatin condensation in HSC-3 cells dose-dependently. It was publicized that DAPI staining is a standard procedure for measuring chromatin condensation, and DNA fragmentation is also recognized to be a marker of cell apoptosis.38,39 Therefore, we further investigated DNA fragmentation (cell apoptosis) using DNA gel electrophoresis for isolated DNA from HSC-3 cells after exposure to PA at 0, 1.6, 3.1, 6.2, and 12.5 μM for 24 h. Electrophoresis results were presented in Figure 3, while the dosage of PA was raised to 6.2 and 12.5 μM, that induction of DNA fragmentation in HSC-3 cells can be significantly observed. Many studies demonstrated that anticancer drugs induced cancer cell apoptosis, which may be proved by using DNA gel electrophoresis to show DNA fragmentation in gel after isolated DNA was electrophoresis. 40 Therefore, our investigation provides evidence that interference of PA leads to the induction of DNA fragmentation in HSC-3 cells to cause cell apoptosis.
Due to the limitations of DNA gel electrophoresis, which can’t be the statistical evaluation of cell apoptosis. Then, Annexin V/PI double staining was applied, partnered with a flow cytometer, and apoptotic cells could be calculated and quantified.26,41 Herein, after cells were exposed to PA at 0, 1.6, 3.1, 6.2, and 12.5 μM for 24 h, HSC-3 cells were collected and analyzed. Qualitative and quantitative results were concreted in Figure 4. These datasets indicated that PA induces cell apoptosis in HSC-3 cells in series concentrations in Figure 4. Our outcomes are in agreement with earlier studies, which reported that PA can induce cell apoptosis in HT1080 human fibrosarcoma 18 and A375-S2 human melanoma. 42
Drug-induced cell apoptosis may occur through the induction of Ca2+ release from ER, and the Ca2+ may move to mitochondria to affect the dependent pathway for cell apoptosis. 43 Mitochondrial dynamics have also been known to be involved with cell death. 44 Therefore, we used a flow cytometer to monitor [Ca2+] production induced by PA (Figure 5(A)) and reduction of ΔΨm (Figure 5(B)) in HSC-3 cells. Mitochondria plays a critical part in the intrinsic pathway of programmed cell death of apoptosis; in particular, the Bax /Bcl-2 protein rate is involved in the imbalance of ΔΨm. 45 Anti-apoptotic proteins (Bcl-2, Bcl-xL, etc.) and pro-apoptotic proteins (Bid, Bak, Bax, etc.) that regulate cell apoptosis were associated with intrinsic/mitochondrial pathways.46,47 Therefore, the Bcl2 family, such as Bcl-w, Bcl-xL, and Bcl-2, associated with apoptosis pathways could be considered as the target for cancer therapy. 48 Bcl-2 is one of the well-known mediators that can turn the tide of cell apoptosis and prevent mitochondria from leaking cytochrome c or via binding to apoptosis-activating factors such as AIF. 49
The proapoptotic protein Bax is mitochondria-associated, one of the death-promoting member proteins named pro-apoptotic proteins. 50 Bcl-xL could close up mitochondrial-related death processes by embargoing oligomerization of pro-apoptotic proteins, inclusive of Bax and Bak.51,52 Induction of Bcl-2 and Bcl-xL can reverse the apoptotic tendency of mitochondria, and alleviate cytochrome c accumulation in cytoplasm, which blockage the permeability of mitochondrial transition pore. 53 Bax is also known to promote leakage of cytochrome c from damaged mitochondria. 54 Therefore, agents could up-regulate the Bax/Bcl-2 expression ratio, cleavage caspase-3/-9, and cleavage PARP can induce cell apoptosis. 55 Whenever either increases Bax or decreases Bcl-2 expression, a small leak will sink the great ship in apoptosis balancing.56,57 Herein, western blotting demonstrates PA increased Bak and Bid and decreased Bcl-2 in HSC-3 cells (Figure 6(B)). These findings were revealed with the previous study, which claimed PA induces HT1080 human fibrosarcoma apoptosis through increasing Bax/Bcl-2 ratio. 18 Therefore, we found that PA breaks the balance between Bax and Bcl-2, and eliminated the levels of ΔΨm, which makes the consequence strong linkage to apoptosis in HSC-3 cells. Herein, PA facilitated the active (cleaved) form of the caspases family such as caspase-8, -9, and -3 in HSC-3 cells (Figure 6(A)). It is well-recognized that the progress of apoptosis is typically manipulated by the activation of Bcl-2 and the caspase family.58,59 Moreover, the pro-apoptotic caspase family has been shown to enhance cell apoptosis, comprehensive of extracellular initiator--caspase-8 and intracellular initiators like caspase-9 and its effector caspase-3.60,61
Caspase-8 holds the reins in the death receptor-mediated apoptotic pathway, it cleaves Bid and translocates its C-terminal to mitochondria, leading to the leakage of cytochrome c from intermembrane space of mitochondria, and further activated caspase-9.62,63 Caspase-9 regulates the intrinsic mitochondria pathway, while caspase-3 manipulates the cleavage of downstream proteins in the cytoplasm resulting in typical morphological changes in cells in which extrinsic mitochondria pathway apoptosis occurs. 57 Results from Figure 6(B) showed that PA promoted Bid and Bax expressions and attenuated Bcl-2 levels in HSC-3 cells. These findings suggest the Bcl-2 protein family, intrinsic mitochondria- and extrinsic mitochondria caspase-signaling pathways that connect with PA induced programmed cell death in HSC-3 cells.
Western blotting also showed PA increased Fas, cytochrome c, and AIF in HSC-3 cells (Figure 6(C)). Therefore, to confirm the subcellular localization of apoptosis-related factors, confocal laser microscopy was applied to detect that PA increased Bax, AIF, cytochrome c, Fas, and cleaved caspase-3 but decreased Bcl-2 in HSC-3 cells (Figure 7(A)–(E)).
PyMOL is a tool software commonly used to visualize the three-dimensional structure of molecules in studies of proteins and protein or small molecule models. It facilitates the identification of potential binding sites by rendering models based on molecular surface characteristics and electrostatic calculations. The Fas-FADD complex, composed of Fas and FADD domains, forms the asymmetric dual tetrameric assembly unit. 64 The docking results indicate that PA is surrounded by hydrophobic interactions provided by the Fas-FADD interface. These interactions involve residues from Fas (chain A) such as His282, Gln283, His285, His287, Tyr291, and residues from FADD (chain B) including Asp106, Asn107, Val108, Gly109, Lys110, and Thr138. Notably, Tyr291, Asp106, and Asn107 contribute to stabilizing the docking complex through hydrogen bonding. 65 The findings demonstrate that PA binds to the interface between Fas and FADD, forming a stable complex through a combination of hydrogen bonds and hydrophobic interactions (Figure 8(A)). In this model, simulated results indicated the finest binding affinity (Figure 8(B)). The modeling outcomes can be supportive to the experimental data we mentioned above to describe the binding affinity between PA to Fas-FADD.
Apoptosis in OSCC often originates from genomic mutations. Nearly 30% of OSCC have Fas and FADD complex overexpression66,67 Cisplatin enhanced the expression of Fas and FasL in all cell lines.54,68 Moreover, cisplatin-induced toxicity in kidney, gut, and bone marrow.
47
Figure 9(A) and (B), treatment with PA (5 and 20 mg/kg) and cisplatin partially inhibited tumor growth and reduced tumor weight compared with the control group. However, PA did not affect the body weight and other organs morphology, while cisplatin affected the weight of the heart, liver, and kidneys. In renal function analysis, Cisplatin increased ALT and creatinine values. According to the results, data show that PA is comparable to cisplatin in inhibiting tumor growth, reducing tumor weight, and has fewer side effects and more safety in tissues of mice with HSC-3 xenograft tumors (Figure 9(C) and (D)). Generally, Figure 10 summarizes the possible apoptosis signaling pathways of PA affecting HSC-3 cells. In our preliminary study, we are the first to find that PA inhibits the growth of OSCC through binding to the Fas domain. To disrupt the study limitation, In vivo studies, we will conduct a variety of OSCC cell lines to explore the mechanism of action, and use research techniques such as siRNA FADD to conduct research and analysis to confirm the effects of PA and Fas-FADD. In vivo studies, we will use nude mice to experiment with drugs that inhibit FADD to verify our theory and break through limitations. Apparently, before PA was used in clinical patients which should be need more experiments for in vitro and in vivo studies. Therefore, the hypothesis of clinical potential of PA should be induced cell apoptosis in OSCC tumors of patients. The possible signaling pathways for PA induced apoptotic cell death in HSC-3 cells. Based on our results showed that PA binding to the Fas-FADD complex induces caspase-8 to activate extrinsic mitochondria-dependent pathway proteins such as cleaved caspase-8 and -3 and intrinsic mitochondria-dependent pathway proteins such as cleaved caspase-8, Bid, Bax, AIF, cyt c, and cleaved caspase-9 to induced cellular apoptosis in human oral squamous carcinoma HSC-3 cells and suppress the xenograft HSC-3 cell tumors in NOD/SCID mice.
Conclusion
In conclusion, our results showed that PA docking to the Fas-FADD complex could dose-dependently induce chromatin condensation, DNA fragmentation, intracellular calcium production, mitochondrial membrane potential, the apoptosis-related protein expression of AIF, Bax, and cleaved caspase-3, -8, -9. Based on these observations indicate that PA exerts its cell-killing activity through trigged on the Fas-FADD complex and induces caspase-8 to activate extrinsic and intrinsic mitochondria-dependent pathways in human oral squamous carcinoma HSC-3 cells and suppress the xenograft HSC-3 cell tumors in NOD/SCID mice. This novel finding explores how PA induces cell apoptosis pathways in human oral squamous carcinoma cells in vitro and in vivo.
Footnotes
Acknowledgments
We sincerely appreciate Prof. Ping-Chiang Lyu and Dr. Yi-Chung Liu from the BP Bioinformatics Core (Hsinchu, Taiwan) for their outstanding support in providing our laboratory with high-quality proteomics and drug simulation analysis facilities and consultation. These facilities are established and operated by the National Core Facility for Biopharmaceuticals (NCFB).
Statements and declarations
Author contributions
Funding
The authors disclosed receipt of the following financial support for the research, authorship, and/or publication of this article: This work was supported in part by grants from the National Science and Technology Council, Taiwan (NSTC 113-2320-B-039-029). This work was financially supported by the “Chinese Medicine Research Center, China Medical University” from The Featured Areas Research Center Program within the framework of the Higher Education Sprout Project by the Ministry of Education (MOE) in Taiwan (CMRC-CHM-4). This work was financially supported by CMU112-TC-08 from China Medical University (Taiwan).
Conflicting interests
The authors declared no potential conflicts of interest with respect to the research, authorship, and/or publication of this article.
Data Availability Statement
Data availability is obtained from the corresponded authors.