
Abstract
Introduction
In this study, we sought to determine the sub-chronic toxicological effects of AEC on zebrafish embryos.
Methods
We utilized fish early life stage (FELS) and fish embryo toxicity (FET) tests, vascular, neurological, and renal transgenic zebrafish lines, and gene expression anal-ysis of the zebrafish tissue.
Results
In the FET tests, AEC caused several abnormalities in the larvae, with the LC50 at 24 hpf being 4.076 ± 0.221 mg/L and 3.296 ± 0.127 mg/L at 96 hpf. In the FELS test, AEC was shown to be lethal following 16 days of exposure at 0.5 mg/L, 1 mg/L and 2 mg/L. Some of the transgenic zebrafish lines exhibited slight changes in fluorescent signaling pat-terns after exposure to AEC at 1 mg/L and 2 mg/L. Notable results of the gene expression analysis revealed: gpx4b and got2 were downregulated in the liver; HIF1a was downregulated at 0.25 mg/L and 0.5 mg/L concentrations, NOTCH1a and fli-1 genes were downregulated at all concentrations, and A2b was upregulated in the vasculature; a1T, ngn1, elavl3, syn2a, mbp, gap43 were down-regulated in the nervous system; and wt1b was downregulated in the kidney.
Discuccion
Altogether, the results of our study indicate the potential for AEC to cause harm to organisms.
Introduction
The production of potable drinking water and the processing of wastewater for the public necessitates the use of disinfection compounds and the subsequent release of some of these compounds and their by-products to the environment. During the water treatment process, disinfection chemicals are added that often react with compounds (organic material) naturally present in the water which can produce disinfection by-products (DBPs). DBPs may pose a risk to ecosystems and humans, with some being considered potential human carcinogens. 1 Previous studies have shown that some DBPs - for which no threshold has been established in drinking water - are cytotoxic, genotoxic1–3 and potentially carcinogenic.4,5
In this study, 3-amino-9-ethylcarbazole (AEC) was selected as the DBP test compound. In immunohistochemistry, AEC is a chemical compound commonly used as a chromogenic substrate 6 ; however, AEC has also been identified in previous studies on the production of DBPs from drinking water samples collected in Budapest, Hungary. For the previous studies, a filtered extract was prepared from Budapest drinking water, the effects of which were examined toxicologically. 7 Because of the potential risks associated with chronic human exposure to DBPs in drinking water, detailed studies on the toxicological risks associated with this com-pound are important. Later, this extract was analyzed with further analytical tests, during which AEC was also detected (Figure S1). The toxicological effects of AEC in drinking water have not yet been examined thoroughly, with limited data being available pertaining to the toxicological safety of AEC. What little toxicological data exists has shown the LC50 in rats as being 144 mg/kg and the LC50 in mice is 150 mg/kg. 8
Initiatives by the National Institutes of Health to rapidly sequence the zebrafish genome have enabled this model system to be fully applicable to the study of vertebrate biology, physiology, and human disease. 9 Currently, a lot of research has shown that that zebrafish genetics, physiology, and pharmacology are remarkably similar to humans. 10 The zebrafish is specially applicable to the study of hematopoiesis and cardiovascular system. The heart of the human embryo is similar to the zebrafish embryonic heart at 3 weeks gestation. The development and function of the zebrafish kidney are very similar to higher vertebrates, thus providing easy access to study the organ. Several other vertebrate-specific developmental processes and other vital organs are being investigated using the zebrafish. 9 Furthermore, most of the genes we examined at the gene expression level (such as got2a, mpx4b, ngn1, mknk2b etc.) are also found in humans.
Zebrafish are one common fish test organism utilized in OECD (Organization for Economic Co-operation and Development) guidelines. Two common OECD tests performed on zebrafish are the fish embryo toxicity (FET) and the fish early-life stage (FELS) tests.11,12 The FET test is used for determining the acute toxicity of chemicals at the fish embryonic stage. The FELS test is used for determining the lethal and sub-lethal effects of chemicals at the early life stages of fish 12 and is the most common sub-chronic fish toxicity test used worldwide for environmental risk assessment. Toxicological data can be broadened by using transgenic zebrafish larvae and/or gene expression analysis of key organs taken from the fish. As toxicological effects can be detected earlier at the molecular level than at the phenotypic level, transgenic lines in which target organs express a fluorescent signal can provide additional information to wild-type studies by enabling the monitoring of malformations or malfunctions of key toxicological organs in vivo. 13 Various transgenic zebrafish lines have been developed and are used in toxicological studies to test environmental samples.13–16
In the Tgfli1:EGFP:GATA-1:dsRed double transgenic zebrafish line, blood cells can be visualized, allowing for the determination of proper blood production in the larvae. 17 In the Tg3.9nestin:RFP:8.4ngn1:gfp line, promoters of neurogenin-1 (involved in the development of the nervous tissue) and nestin (expressed only in the central nervous system at 72 hours post fertilization and marking dividing or regenerating cells) are used to drive the expression of fluorescent proteins in order to determine any neurological effects in the larvae. 18 In the Tg (wt1b:EGFP) transgenic line, the promoter of the Wilms tumor gene, which plays an important role in kidney development, is incorporated. 19 This line was successfully applied in a previous study to objectively quantify morphological abnormalities of the pronephros following drug treatment. 15
In conjunction with the transgenic zebrafish lines, analysis of the molecular expression of genes related to key organ and tissue function is useful. The liver plays an important role in the maintenance of homeostatic processes, especially during stress acclimation to xenobiotics. 20 The metabolic activation of xenobiotics may lead to toxicity within zebrafish embryos.21–23 The expression of six liver associated genes (scd, got2a, ube2h, gpx4b, mknk2b and hsd11b2) known to be involved in oxidative stress 20 were analyzed in this study. Regarding the vascular system, seven genes (A2a.1, A2a.2, A2b, HIF1a, NOTCH1a, fli1, GATA-1) were selected for analysis. Five of those genes, A2a.1, A2a.2, A2b, HIF1a, NOTCH1a, play an important role in embryo development and angiogenesis, 24 while the fli1 gene is expressed in all blood vessels of the zebrafish embryo, 25 and GATA-1 is a transcription factor that is essential for erythroid cell lineage development. 22 Pertaining to the nervous system, 10 genes were selected for analysis. Seven of the genes are known to be expressed in neuronal stem cells and/or in developing neurons: nestin 26, elavl3, 27 shha, 28 nkx2.2a, 29 gap43, 30 α1-tubulin 31, and neurogenin1.18,32 The last three nervous system linked genes were syn2a, a marker of synapse formation, 33 gfap, found in astrocytes, 34 and mbp, a component of the myelin sheath of neurons. 35 According to the results of Yuhei and co-workers (2015), these 10 genes could be useful for the assessment of the neurotoxic effects of chemicals.
In this study, zebrafish FET and FELS toxicological tests were combined with three transgenic zebrafish lines (Tgfli1:EGFP:GATA-1:DsRed, Tg3.9nestin:RFP:8.4ngn1:gfp, Tg (wt1b:EGFP) to assess the relative toxic effects of AEC. The results of the fluorescent protein expressing transgenic zebrafish lines were supplemented with gene expression analysis of several target tissues and organs.
Materials and methods
Experimental animals
In our experiments, wild type (AB line) and transgenic zebrafish embryos were used. All embryos were produced at the Department of Aquaculture, Szent István campus of the Hungarian University of Agriculture and Life Sciences (MATE). Adult fish were maintained at 25 ± 0.5°C, pH 7.0 ± 0.2, conductivity 525 ± 50 μS (system water), 14-h light/10-h dark cycle, in a recirculated zebrafish housing system (Tecniplast Zebtec, Techniplast, Buguggiate, Italy). The stock was fed twice a day with SDS Small Gran granulated feed plus a once-a-day additional feeding with Artemia. Fish were placed in breeding tanks (Tecniplast S. p.A.) late in the afternoon the day before the experiment and allowed to spawn by removing the dividing walls the next morning. The spawning of individual pairs was spread out over time to allow for a continuous supply of 1-cell embryos. The Animal Protocol was approved under CLVIII of the 2011 Hungarian Animal Welfare Law.
Three transgenic lines were also utilized in our studies: Tg3.9nestin:RFP:8.4ngn1:gfp, which is a double-transgenic line in which the promoter of the neurogenin-1 gene is linked to green fluorescent protein (GFP) and the promoter of the nestin gene drives the expression of red fluorescent protein (RFP); Tgfli1:EGFP:GATA-1:DsRed is a double transgenic line in which the transcriptional start site of the fli1 gene drives the expression of GFP and the promoter of the GATA-1 gene drives the expression of RFP; Tg (wt1b:EGFP) is a kidney transgenic line in which the regulatory region of the wt1b gene drives the expression of GFP.
Chemicals
3-amino-9-ethylcharbazole (AEC) was purchased from Sigma-Aldrich with ≤3% impurities. The substance was dissolved in 0.01 % dimethyl-sulfoxide (DMSO, Sigma-Aldrich, Budapest, Hungary) with the use of a sonicator (Branson Digital Sonifier) (26.0°C, 70% amplitude, 2 minutes).
Fish embryo toxicity test (FET)
The Fish Embryo Toxicity Test (FET) was carried out according to OECD guideline 236 (OECD 2013) with some modifications. The FET test was preceded by range-finding, to determine the appropriate concentration range for testing as recommended in standard protocols. 11 The test was performed on newly fertilized zebrafish eggs. The experiments started before the embryos reached the 16-cell stage. The duration of the test was modified to 120 hours. The tests were performed in 24-well plates filled with 2 mL/well of freshly prepared test solution. 20 embryos were placed into the wells and exposed to five increasing concentrations of AEC. The remaining wells were used as internal plate controls. All of the tests included a control and a solvent control plate. The following experimental concentrations of AEC were used: 1 mg/L, 2 mg/L, 2.5 mg/L, 3 mg/L, 3.5 mg/L, 4 mg/L, 4.5 mg/L, 6 mg/L, 8 mg/L. The system water and 0.008 % DMSO was used as a control and solvent control. Fish mortality and abnormalities were determined every 24 hours. Photos were taken of the fish at 72-h using a Leica microscope. At the end of the exposure time, the LC50 and LC10 were determined for the embryos.
Early-life stage toxicity test (FELS)
This test was performed according to OECD guideline 210. Five different concentrations of AEC (0.125 mg/L, 0.25 mg/L, 0.5 mg/L, 1 mg/L, 2 mg/L) were tested. These concentrations were determined using the results of the 96 hrs LC10 value of the FET experiments. The experiment was carried out on newly fertilized zebrafish eggs. After hatching, the test ran for 30 days in a semi-static system. Tests were run in duplicate, with 50 embryos each, and the solution was changed every second day. A control and a solvent control (0.004% DMSO) group were also observed. Mortality and abnormalities were monitored every day. At the end of the experiment the larvae were anesthetized with tricaine methane sulfonate (MS222, 168 mg/L). Larvae can be considered euthanized when their gills did not move for at least 60 seconds. After that, the wet and dry body weights and the standard length of all fish was measured. Prior to microscopic analysis, larvae were anesthetized in 0.02% Tricaine (Tricaine methanesulphonate; CAS. 886-86-2, Sigma-Aldrich). The standard length of the fish was assessed on digital images using the ImageJ software (https://imagej.nih.gov/ij/). The wet and dry weight was too low to be measured individually, so it was measured in groups using a standard laboratory scale with 0.0001 g resolution (Mettler-Toledo AB204-S). Dry weights were determined after a 24 hrs drying process at 60°C in a drying oven.
During the test, samples were taken at 11th day for quantitative real-time PCR.
Treatment of transgenic lines and wild type line to observe toxic effects on organs
All transgenic line examinations were carried out on newly fertilized zebrafish eggs with two treatment concentrations (1 mg/L, 2 mg/L), determined as being below the 96 hrs LC10 of the FET and FELS test results. The duration of the test was 72 hours. At the end of the experiment, images were captured under a fluorescent stereomicroscope ((Leica M205 FA, Leica DFC 425C camera, Leica Application Suite 3.4.2.18368 software, Leica Microsystems GmbH, Germany).
Quantitative real-time PCR
During the FELS test, samples were taken from separate parallel treatment groups. We designed the experiment in such a way that we could take samples at hatching, roughly in the middle and at the end of the test. At 11 days of age, three repetitions of 10 larvae were placed in trizol. Total RNA was isolated from 11 zebrafish embryos by TRI REAGENT (Molecular Research Center, Inc.) and chloroform (Sigma). The RNA was precipitated in isopropanol, then washed in 75% ethanol. The RNA pellet was dissolved in molecular biology grade water (AccuGENE, Lonza). The concentration was measured by a nanophotometer (NanoDrop) and the quality was checked via a 1% agarose gel. Samples were DNase treated (Thermo Science) to remove the DNA contamination, then 1.0 μg from each sample was reverse transcribed by the RevertAid kit (Thermo Science).
Elongation factor 1 alpha (ef1a) was used as a reference gene. Primers (Figure S2) were published previously or designed by using the Primer5 software.
The final volume of the PCR reactions was 20 μL, containing: 5x HOT FIREPol EvaGreen (Solid BioDyne), primers (10 pmol/μL), molecular biology water (AccuGENE, Lonza) and template (200 ng/μL). Reactions were run in a StepOne Plus real-time PCR system of Applied Biosystems: 95°C 10 min, 40 cycles 95°C 10s, 56°C 30s, 75°C 1 min. Data were collected at the annellation stage. Ct values were determined, and the relative expression levels were calculated using double delta Ct analysis. Efficiency was used to correct the values for each gene.
It was not necessary to correct the Ct values, as only those primers with an efficiency of 98% or above were used.
Statistical analyses
Statistical analyses of the FET test results were carried out using the R version 3.2.3 software. The software also determined the LC50 and LC10 values for embryo mortality. GraphPad Prism 6.0 was used to plot the dose-response curves every 24 hours. GraphPad Prism 6.0 was used on the results of the gene expression analysis and to determine the effects of the treatments on the body parameters of the fish using one-way parametric ANOVA followed by using Tukey’s multiple comparisons test and Dunett multiple comparisons test with a confidence limit of 95% (p < .05).
Results
Fish embryo toxicity test
A FET test of AEC was carried out for 120 hours in order to guide the design of the parameters for the long term FELS test. No mortality was observed in the control and solvent control groups. AEC caused several abnormalities (lack of pigmentation, yolk sac edema, hematoma, pericardial edema, tail and head malformations) in larvae, even at the lowest concentration. The pigmentation deficiency was shown to be concentration dependent (Figure 1). After 72 hrs of exposure, fish embryo mortality increased significantly compared to the control group (Figure 1). Figure S3 shows the percentage of symptoms caused by AEC during the FET test. Developmental disorders in 72 hpf embryos caused by AEC during the FET test: PD - pigment deficiency (red arrows show those parts where the lack of pigment is clearly visible), PE – pericardial edema, YE – yolk sac edema, YD – yolk sac deformity, CD - craniofacial deformity, ED - eye deformity, GM – general developmental disorder, SD – swimming border deformity, MS – melted somite, LJ - lower jaw malformations, TD – tail deformity.
The LC50 and LC10 values of AEC were calculated every 24 hours on the basis of dose-response curves (Figure 2(a)). There were no significant differences in the calculated LC values. The LC50 at 24 hpf was 4.076 ± 0.221 mg/L and 3.296 ± 0.127 mg/L at 96 hpf. The LC10 at 24 hpf was 2.199 ± 0.185 mg/L and 2.220 ± 0.188 mg/L at 96 hpf (Figure 2(b)). The results of the FET test show that AEC can adversely affect zebrafish development. Results of the FET test following exposure to AEC. (a) Concentration response curves to AEC for lethality at 24, 48, 72, 96 and 120 hpf. (b) LC50 and LC10 values of AEC (24 to 120 hrs), calculated on the basis of the lethality curves.
Early-life stage test (FELS)
The parameters for the FELS experiments were determined based on the preceding results of the FET tes t. The highest selected concentration was below the 96 hrs LC10.
The FELS experimental results showed that mortality was below 20% in the control and solvent control groups and no deformities were detected in either. After 33 days of exposure, the survival was 69% (0.125 mg/L) and 28% (0.25 mg/L) at the two lowest concentrations. However, even though the test concentrations were below the 96 hrs LC10 (2.206 ± 0.195 mg/L), the three higher concentrations (0.5 mg/L, 1 mg/L and 2 mg/L) were shown to be lethal after 16 days of exposure (Figure 3). Mortality results of the FELS test following AEC exposure. Mortality was below 20 % (n = 100) in the control and solvent control groups during the 33-day study. However, even though the test concentrations were below the 96 hrs LC10 (2.206 ± 0.195 mg/L), the three higher concentrations (0.5 mg/L, 1 mg/L and 2 mg/L) were shown to be lethal after 16 days of exposure, while 69 % and 28 % of the individuals survived in the two lowest (0.125 mg/L, 0.25 mg/L) concentrations.
At the end of the experiment, the average wet weight of the larvae was 0.0087 g in the 0.125 mg/L group and 0.0032 g in the 0.25 mg/L group. The average dry weight of the larvae was 0.00106 g in the 0.25 mg/L group, 0.00025 g in the 0.125 mg/L group and 0.00171 g in the control group (Figure 4(a)). Statistically significant differences were observed in the treated groups compared to the controls (p < .05). Wet and dry weight (a) and total length of embryos (b) measured at the end of the FELS. The average wet and dry weight and total length of AEC exposed larvae was significantly lower than in the control groups. The star indicates a statistically significant difference (p < .05) One star indicates a statistical difference of p > .05. Figure S4. Shows the error of the mean for wet and dry weight as well as total length.
A statistically significant decrease in the measured total length was detected at the end of the FELS test in both treatment groups when compared to control groups (p < .05). The average total length was 7.751 mm in the 0.25 mg/L treatment group and 5.746 mm in the 0.125 mg/L treatment group, while in the control group the average length was 10.473 mm (Figure 4(b)).
Other than the differences in the size of the experimental group fish as compared to the control fish, the only other developmental disorder between treatment groups (0.25 mg/L and 0.125 mg/L) was a pigmentation difference (Figure 5). As the treatment concentrations increased, we observed a difference in pigmentation. The pigmentation process and the formation of the pigmentation pattern is a complicated process that is influenced by several factors. It is difficult to find out what causes changes in pigmentation. The size difference is likely the cause of the difference in the appearance of the pigmentation.
36
Representative images of surviving individuals at the end of the FELS test (33 dpf): As a result of AEC exposure, size differences and pigmentation deficiencies were observed compared to the conrol groups.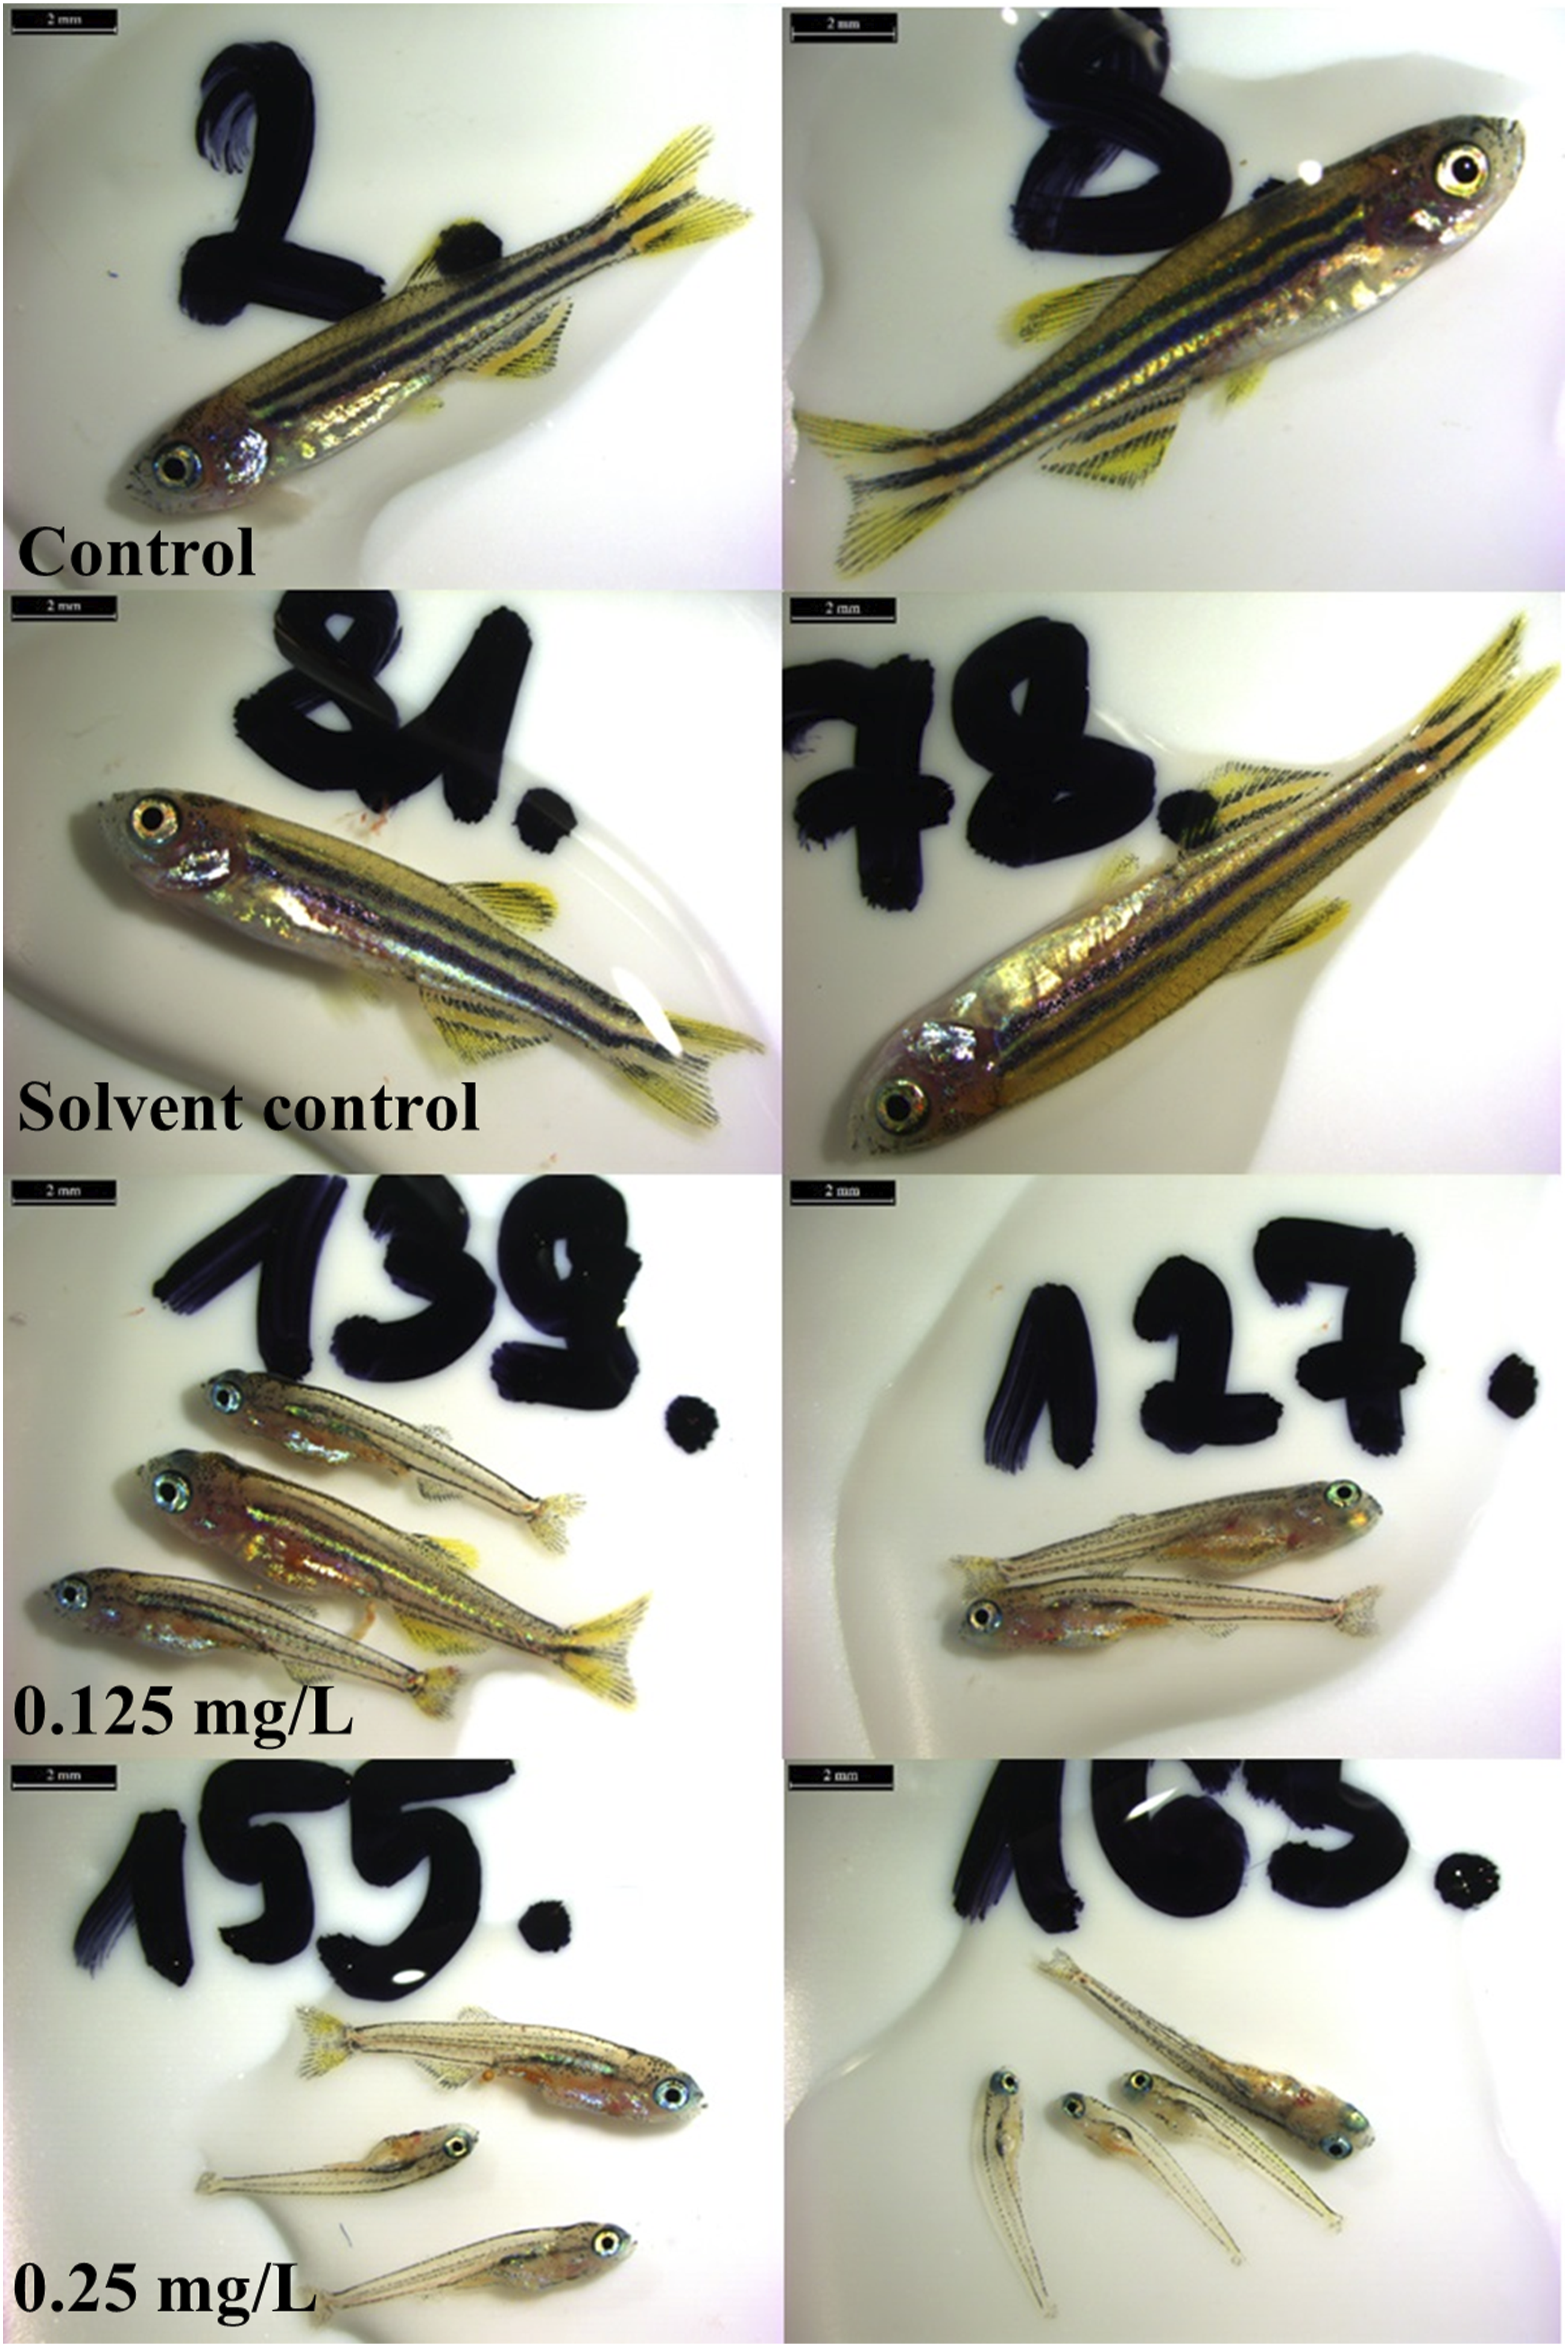
Effect of AEC on the phenotype of examined tissues
The main goal in this exemination was to examine the genes necessary for the proper functioning of the organs, as we wanted to investigate why the individuals in the 3 highest concentrations during the long-term test died so quickly. The use of transgenic lines provides a rapid preliminary response to the effect of a substance. In order to examine tissue abnormalities in vivo, we utilized transgenic zebrafish lines to observe vascular, nervous and kidney disorders following exposure to two concentrations of AEC (1 mg/L and 2 mg/L). The results of the exposure of the Tgfli1:EGFP:GATA-1:dsRed transgenic line to AEC resulted in a part of the blood vessels between the somites not being permeable to the blood cells (Figure 6). Abnormalities detected in the Tgfli1:EGFP:GATA-1:DsRed transgenic line in 72 hpf exposed to AEC. In the Tgfli1:EGFP:GATA-1:DsRed double transgenic larvae, as a result of the treatment (1 mg/L AEC), a part of the the intersegmental vessels (IVS) the somites were not permeable to the blood cells as shown by the arrows in the bottom picture (B:RFP). A decrease in the intensity of the red fluorescent signal in the common cardial vain (CCV) indicates a hematopoietic disorder as the arrow shows in the picture above (A:RFP) (Scale = 500 μm).
The Tg3.9nestin:RFP:8.4ngn1:gfp line results show that AEC did not affect the structure of the central nervous system (CNS), but the red fluorescence signal was intensified in some areas of the brain (Figure 7), suggesting that the CNS can still compensate for the neurotoxic effects of the substance with dividing cells in the nervous tissue. Abnormalities detected in 72 hpf Tg3.9nestin:RFP:8.4ngn1:gfp double transgenic larvae. Treatment (2 mg/L AEC) did not affect the structure of the central nervous system, but the red fluorescent signal indicating olfactory bulb (OB) was intensified in the brain of the central nervous system as shown by the arrow in the picture above (Scale = 500 μm).
In the Tg (wt1b:EGFP) line experiment, the reporter gene was weakly expressed in the pronephros (Figure 8). Additionally, developmental differences were also visually observed between the treated and control embryos. Abnormalities detected in 72 hpf wt1b::GFP transgenic embryos exposed to AEC. Weak expression of the reporter gene could be observed in embryos exposed to 2 mg/L AEC in the pronephros as shown by the arrows in the picture.
Additionally, the liver was examined in wild type embryos after exposure to AEC. Following exposure to 1 mg/L and 2 mg/L of AEC, the shape and color of the liver changed as compared to the control larvae (Figure 9). Abnormalities detected by microscopy in the liver of 72 hpf wild-type embryos exposed to AEC. 1 mg/L and 2 mg/L 3A9EC caused liver malformation and changed the color of the liveras shown by the red circle in the picture. The shape of the liver is highlighted with red.
In summary, AEC caused adverse effects in all examined tissues following exposure to concentrations below LC10.
Quantitative real-time PCR
Tissue samples from the FELS test were subjected to quantitative real-time PCR in order to determine whether the expression of the selected genes changed between treatment groups and whether these gene expression changes could account for the microscopically observed organ malformations. Most of the selected genes are directly related to the proper development of organs, and as we write in the literature review, previous publications also used these genes to determine organ damage. Based on the symptoms, we selected additional genes, which mainly serve to explain the symptoms caused by the hypoxic environment (for example: A2b, HIF1a, NOTCH1a). The hypoxic subsurface affects the circulatory system and can cause the development of various edemas (yolk sac edema, pericardial edema). Therefore, we considered it important to select genes that are not specifically related to the vascular system, but indicate a certain condition. In the case of the liver and nervous system, we can use genes that were previously used in publications to detect the toxic effect on the organs.
No significant differences were detected in the expression of the examined genes in the control and solvent control groups. In the 11 dpf larvae, the expression of several genes was significantly different in all examined organs.
It was found that exposure to AEC changed the expression of four liver associated genes significantly, compared to the control or solvent control. gpx4b and got2a were downregulated while mknk2b and scd were upregulated. The expression of gpx4b and got2a was significantly different in all concentrations compared to the control groups (Figure 10(a) and (b)). However, in the case of scd and mknk2b, statistical analysis showed a significant difference only at the highest concentration (Figure 10). The expression of ube2h and hsd11b2 were not significantly different (Figure S5). Abnormalities detected by gene expression analysis results in 11 dpf embryos ((a), (b), (c), (d)) exposed to got2a, gpx4b were downregulated while mknk2b and scd were upregulated, any significant differences compared to the control groups are marked (*) (p < .05) One star indicates a statistical difference of p < .05.
AEC exposure led to a significant expression change in four of the seven examined vascular system related genes. Statistical analysis revealed that the expression of HIF1a was not changed significantly at the lowest concentration (0.125 mg/L), but was affected in the 0.25 mg/L and 0.5 mg/L treatment groups (Figure 11(b)). The NOTCH1a and fli-1 genes were downregulated in all treatment groups compared to the controls; however, a concentration dependency could not be statistically proved (Figure 11(c) and (d)). A2b was upregulated at the highest concentration, but there was no significant expression change at lower exposure concentrations (Figure 11(a)). The expression of 3 genes (GATA-1, A2a.1, A2a.2) was not significantly affected by the exposure to AEC (Figure S6). Abnormalities detected by gene expression analysis results in 11 dpf ((a), (b), (c), (d)) embryos exposed to AEC. A2b, HIF1a, fli1, and NOTCH1a where significantly downregulated (*) (p < .05) One star indicates a statistical difference of p < .05.
There was a significant difference in the expression of six nervous system related genes (a1T, ngn1, elavl3, syn2a, mbp, gap43) after exposure to AEC. All six of the genes were downregulated after exposure (Figure 12(a)–(f)). The expression of the other four nervous system genes (shhs, nes, nkx2.2a, gfap) was not significantly affected (Figure S7). Abnormalities detected by gene expression analysis results in 11 dpf embryos ((a), (b), (c), (d), (e), (f)) exposed to AEC. syn2a, mbp, elavl3, ngn1, gap43 and α1T were downregulated, significant differences compared to the control are marked (*) (p < .05) One star indicates a statistical difference of p < .05.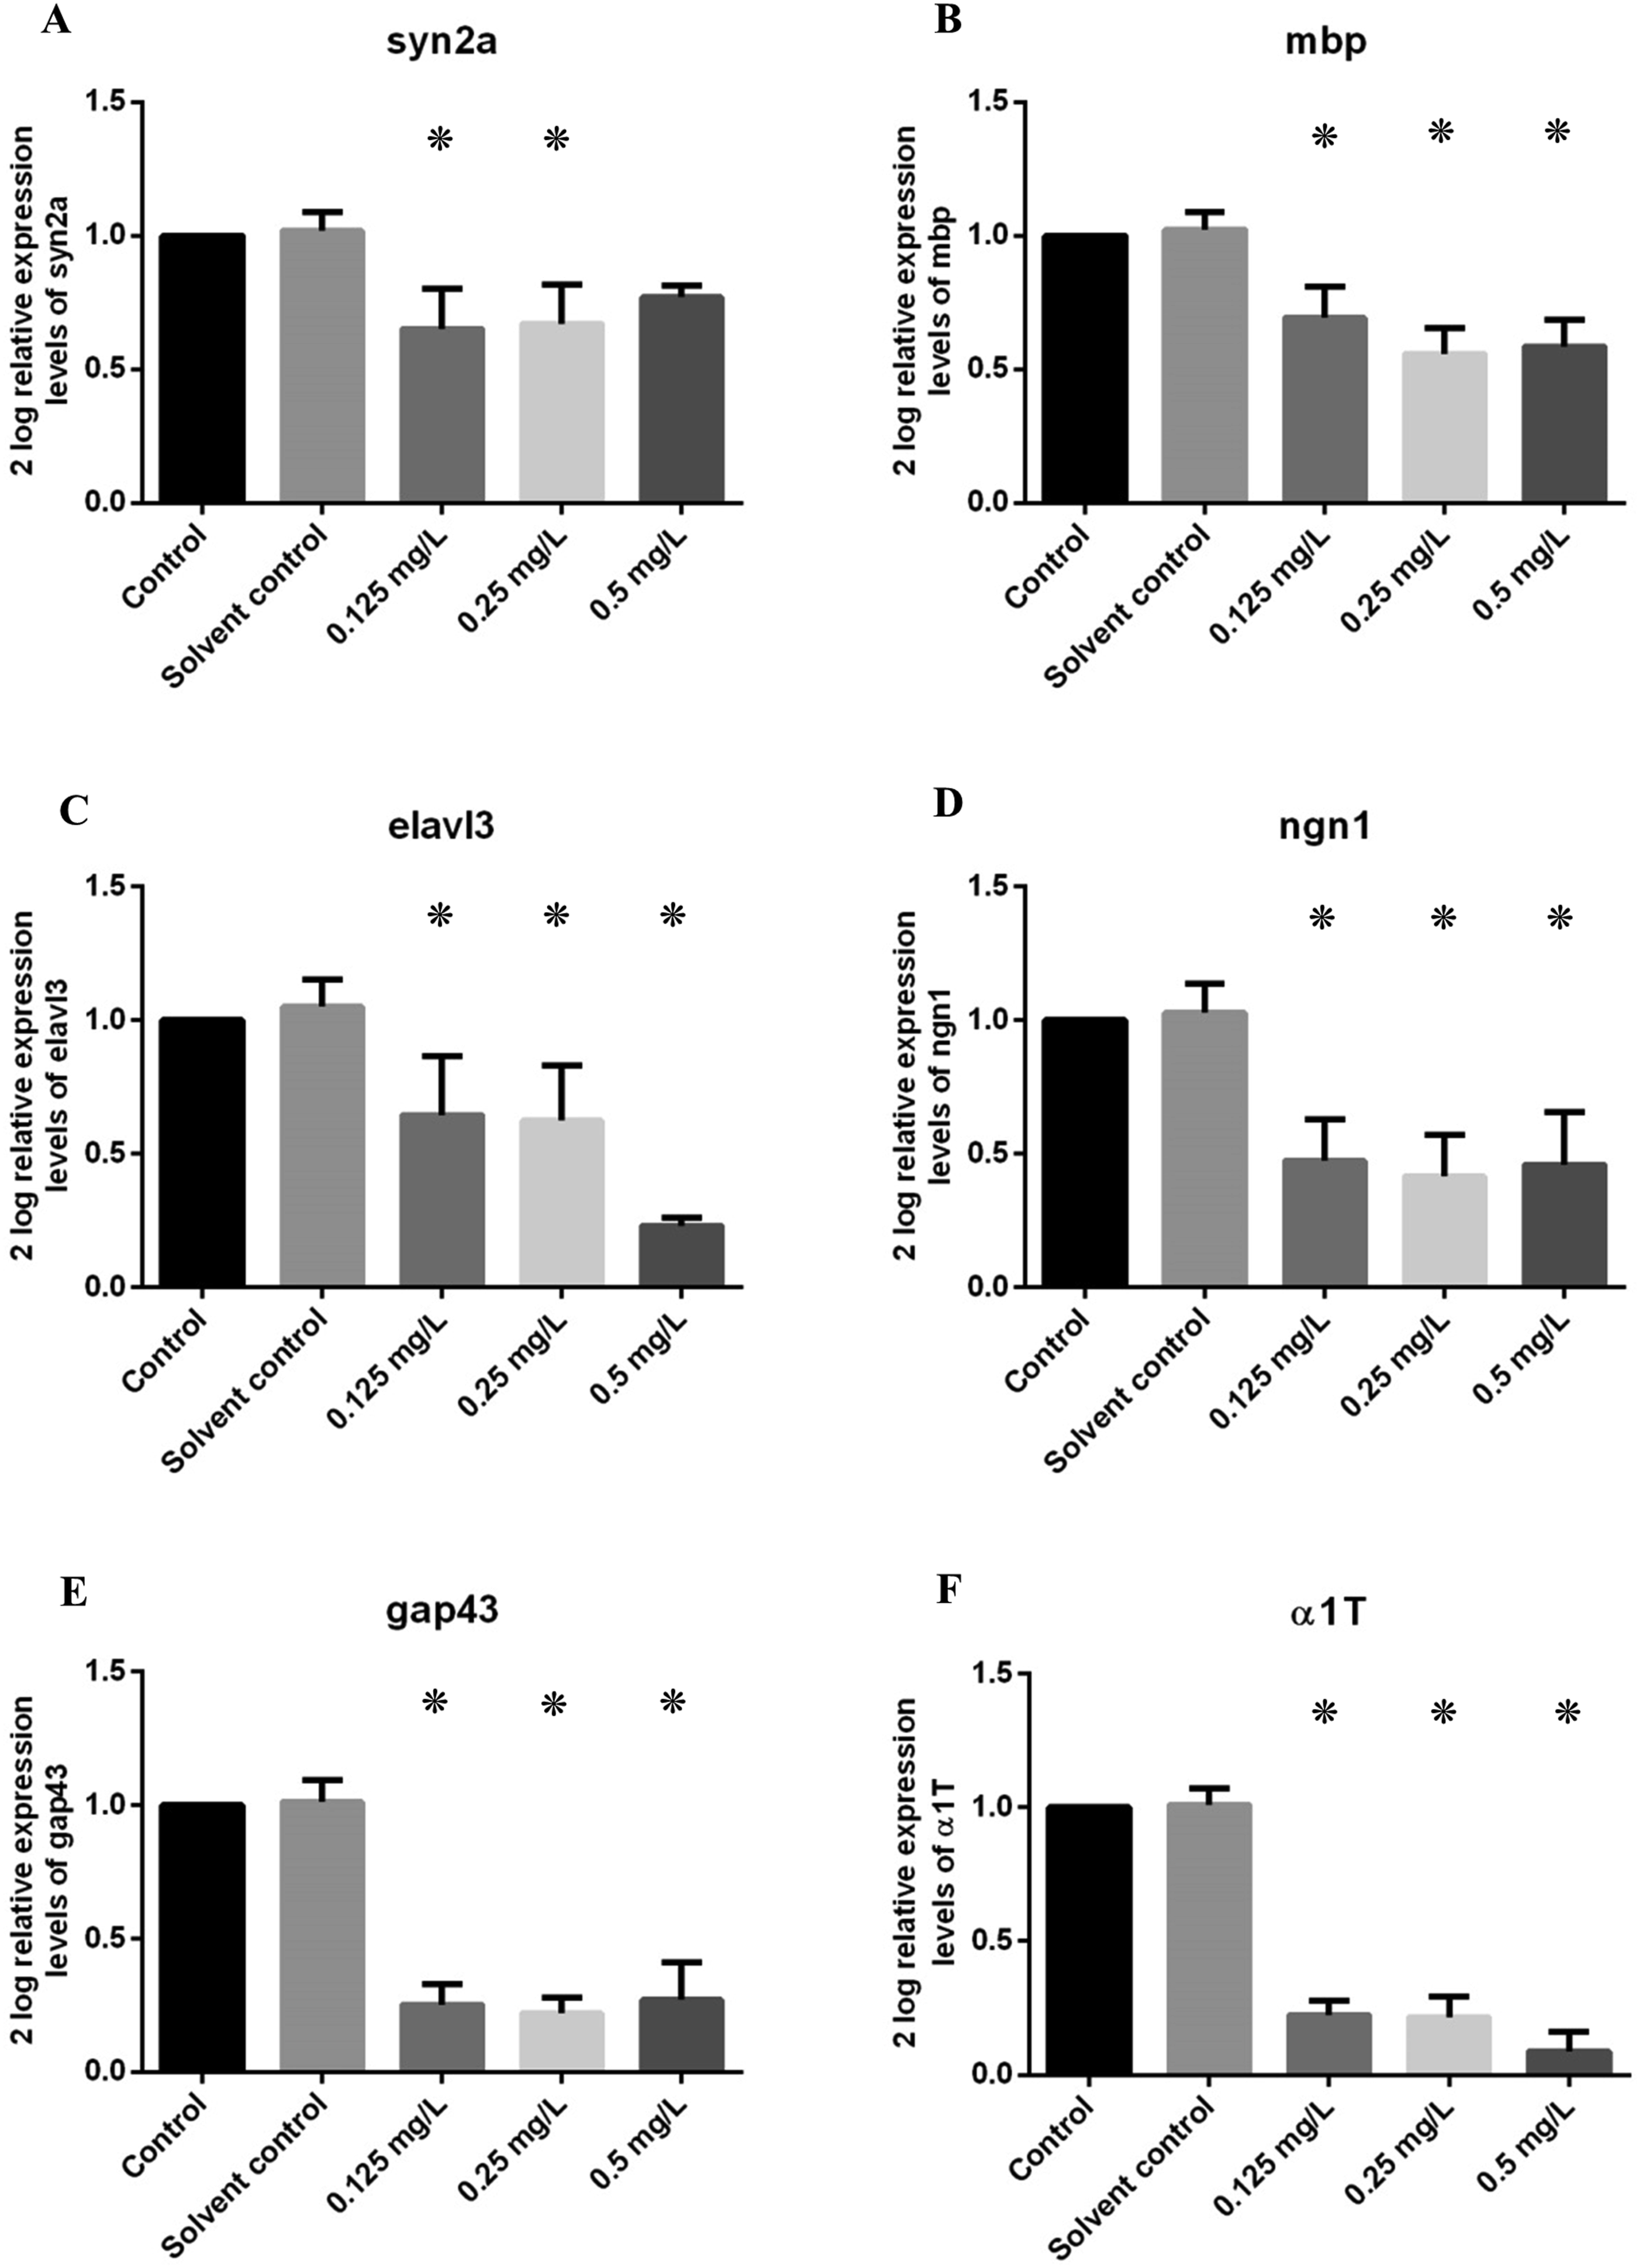
Lastly, the kidney development related Wilms tumor gene (wt1b) was downregulated in all concentrations, supporting the results of our transgenic zebrafish tests (described above) where the fluorescent signal was weakly expressed in the pronephros (Figure 13). Abnormalities detected by 72 gene expression analysis results in 11 dpf embryos exposed to AEC wt1b was downregulated, any significant differences compared to the controls are marked (*) (p < .05) One star indicates a statistical difference of p < .05.
Discussion
The results of our study suggest that AEC has a notable toxic effect on zebrafish embryos, even at low concentrations, demonstrating that DBPs can have toxic effects on organisms1,37, 38 and a thorough investigation of the potential toxicological effects of such DBPs is necessary.
Despite the fact that several sublethal symptoms were observed in the FET test, no other abnormalities (besides alterations in size and pigmentation deficiencies) were detected in the long-term test. In such cases, further investigation (like histological examination) may be required to find out the causes of lethality, but this is not required by the FELS test. 10 Tests could also be performed on transgenic zebrafish lines or gene expression assays could be conducted to explain abnormalities, such as what we showed in this study. Architectural defects in the vasculature can cause general developmental disorders in the embryo, which can affect, among other things, the eyes, brain, heart and pronephric kidney and can also cause hemorrhage.39,40 A separate study observed that in those embryos where the intersegmental vessels developed abnormally, the muscle fiber structure of somites was also damaged, which led to the formation of a curved tail, similar to what was observed in our experiment. 41 The individuals developing with a damaged vascular system were smaller than the controls, which could be due to secondary nutrient supply disturbances and tissue hypoxia. 41 This observation can explain the decrease in the weight and length values obtained in our FELS test.
We noted some organ morphological changes in this study. Notably, the pronephros and the liver. One prior study found that the functional and structural disturbance of the pronephros may contribute to the development of pericardial and yolk edema, 42 which was noted during our FET test. The livers of the fish in our study lost transparency and became darker, brown, or gray, indicating liver degeneration and necrosis. 43 We noted a reduction in the size of the liver, which might indicate oxidative stress, liver inflammation, degeneration, apoptosis-mediated hepatotoxicity, or liver necrosis.44,45 AEC-HCl (3-amino-9-ethylcarbazole hydrochloride) was found to induce hepatocellu-lar carcinoma in rats and mice. 46 The upregulation of mnk1 and mnk2 also supports the proliferation and invasion of carcinoma cells, including hepatocellular carcinoma.47,48 In this study, we have found that AEC induced the upregulation of both scd and mknk2b.
The results of our gene expression analysis identified several genes that correlated with the morphological changes we observed in the transgenic fish experiments. As a result of the treatment with AEC, the changes in the gene expression levels correlated with problems in the proper development of the examined organs, which is supported by our phenotypic tests. In the vascular system, a part of the blood vessels between the somites was not permeable to the blood cells, coinciding with A2b, HIF1a, fli1, and NOTCH1a being significantly downregulated. Changes in the examined genes of the nervous system (syn2a, mbp, elavl3, ngn1, gap43 and α1T) corresponded with the red fluorescence signal in Tg3.9nestin:RFP:8.4ngn1:gfp line increasing in intensity in some areas of the brain of the central nervous system. The kidney development related Wilms tumor gene (wt1b) was downregulated, supporting the results of our transgenic zebrafish tests with Tg (wt1b:EGFP) line where weak expression of the reporter gene could be observed in embryos exposed to 2 mg/L AEC in the pronephros. The color and shape of the liver significantly changed as a result of the treatment with AEC. This correlated with the expression of got2a and gpx4b being downregulated and the expression of mknk2b and scd being upregulated. Studying the expression of the genes targeted in our study in further DBP exposure experiments may help in elucidating the toxicological effects of other compounds.
Conclusions
As a result of well-chosen toxicological studies, we obtained a complex result regarding the toxicity of the tested substance. Tests performed on zebrafish models have long been widely used in toxicology. Our study supports the use of transgenic zebrafish lines and gene expression analysis in understanding the toxicological effects of DBPs. The use of transgenic lines combined with FET tests provides additional information to wild-type examinations and helps with preliminary observations of toxicological damage to organs. As described in the introduction, since the organ system and genetic makeup of the zebrafish are very similar to humans, the results obtained are highly likely to indicate the harmful effects of the substance on the human body. However, further studies involving mammalian animal models are recommended.49–52
All toxicologically active organs have key genes whose expression changes after exposure to toxic compounds. By compiling an appropriate gene list, the potential effect of a substance may be estimated before it appears at the phenotype level. Merging the results of embryo tests and gene expression assays can help in predicting which organ is affected and to what extent by a substance. Moreover, gene expression analyses could reveal effects not detected by a classical toxicological test. Our gene expression analysis results correlated relatively well with the early life stage findings and also help explain the lethality observed in our FELS test.
Overall, the results of our study showed that the presence of DBPs such as AEC in drinking water can pose a serious risk to humans due to long-term exposure and other organisms. As demonstrated by the present study, further toxicological studies on such compounds are important due to the potential risks associated with chronic human exposure to DBP in drinking water.
Supplemental Material
Supplemental Material - The acute and sub-chronic toxicological effects of 3-amino-9-ethylcarbazole (AEC) on zebrafish
Supplemental Material for The acute and sub-chronic toxicological effects of 3-amino-9-ethylcarbazole (AEC) on zebrafish by Erna Vásárhelyi, Gergely Rácz, Béla Urbányi, Balázs P. Szabó, Dóra Szepesi-Bencsik, István Szabó, Illés Bock, Cintia Volner, Jeffrey Daniel Griffitts, Balázs Kriszt, Katalin Bakos, and Zsolt Csenki in Human & Experimental Toxicology
Footnotes
Acknowledgments
The authors thank Fritz-Lipmann -Institut für Alternforschung (Germany) and Dr Christoph Engler for providing us with the Tg(wt1b:EGFP) transgenic line, as well as Nathan D. Lawson and UMass Chan Medical School (USA) , that we could use the Tg(GATA/Fli) transgenic line. Tg(neu:GFP) and Tg(Nestin:RFP) lines were generated by Uwe Strähle, Karlsruhe Institute of Technology (KIT) and obtained from the European Zebrafish Resource Center of the Karlsruhe Institute of Technology (KIT).
Declaration of conflicting interests
The author(s) declared no potential conflicts of interest with respect to the research, authorship, and/or publication of this article.
Funding
The author(s) disclosed receipt of the following financial support for the research, authorship, and/or publication of this article: This research was supported by the Ministry of Innovation and Technology within the framework of the Thematic Excellence Programme 2021, National Defense and Security sub-programme (TKP2021-NVA-22). This work supported by the ÚNKP-23-3 New National Excellence Program of the Ministry for Culture and Innovation from the source of the National Research, Development and Innovation Fund (ÚNKP-23-3-II-MATE/30.) (I.B.). This research was also financed by the Research Excellence Programme (Z.C.) and the Flagship Research Groups Programme (B.U.) of the Hungarian University of Agriculture and Life Sciences.
Animal protection
All experimental procedures involving fish were performed following the International Guiding Principles for Biomedical Research Involving Animals (EU 2010/63) and are in accordance with Hungarian laws on animal safety. An animal experiment license was issued by the Government Office of Pest County (Permit No. PE/EA/349-7/2019). Animal handling was performed with accredited researchers.
Supplemental Material
Supplemental Material for this article is available online.
References
Supplementary Material
Please find the following supplemental material available below.
For Open Access articles published under a Creative Commons License, all supplemental material carries the same license as the article it is associated with.
For non-Open Access articles published, all supplemental material carries a non-exclusive license, and permission requests for re-use of supplemental material or any part of supplemental material shall be sent directly to the copyright owner as specified in the copyright notice associated with the article.