
Abstract
Ethanol exposures have been reported to disrupt the development of the retina and optic nerve which can be considered as part of underlying mechanisms of visual pathway impairments. This study aims to investigate the cellular integrity of the retina and the expression of melatonin receptor (MTNR1A) in the retina when assaulted chronically and simultaneously by ethanol and acetaminophen. Animals were randomly grouped into five groups. Control (normal saline), Alcohol group (25% alcohol in 2% sucrose solution), Acetaminophen group, (100 mg/kg BW for 14 days), Acetaminophen + Alcohol group (25% alcohol in 2% sucrose solution + 100 mg/kg BW of paracetamol). Withdrawal group (25% alcohol in 2% sucrose solution + 100 mg/kg BW of paracetamol). The body weight and rectal temperature of the animals were taking every 2 days and a post mortem study was conducted by quantitatively assessing the markers of oxidative stress. Melatonin level was quantified in the retina tissue and Immunohistochemistry was done via MTNR1A to study the expression of melatonin receptor type 1A in the retina. These results demonstrate that alcohol and acetaminophen significantly reduced the activity of retina rat melatonin (MTNR1A) levels, lowers the SOD and MDA activity. Expression of MTNR1A was reduced in the ganglionic cell layer of Alcohol and acetaminophen group as compared to the control and withdrawal group. It can be inferred that chronic simultaneous intake/consumption of alcohol and acetaminophen altered the melatonin level in the retina and this may implicate the circadian clock and melatonin in Wistar rat visual system.
Introduction
Drug abuse is the intentional misuse of illicit drugs for recreation, perceived necessity, or convenience. Both the use of illicit drugs which includes cocaine, opioid, amphetamine and cannabis, and misuse of illicit drugs have become global public health problems. 1 Abuse of drug can also be described as the use of medication “recreationally,” in larger amounts than prescribed, in greater frequency, for different indications or by different routes, usually resulting in adverse consequences. Drug abuse has been reported to harm a person physically including self-harm, and psychologically including mental disorders and blood-borne bacterial and viral infections. 2
The pain-reliever acetaminophen (also known as paracetamol) is one of the best-selling over-the-counter medications, used by more than 200 million people in the United States each year to treat pain and fever, and it has become one of the most popular ‘over-the-counter’ non-narcotic analgesic agents. 3 Over the coast of Africa, more than half of the heavy-duty workers are involved in both conscious and unconscious chronic abuse and misuse of acetaminophen as a pain reliever. 4 Though, research have shown that excessive use or abuse of paracetamol can damage multiple organs, especially the liver and kidney. 5
Ethanol is a psychoactive medicine which plays an active role in the central nervous system as a depressant. Ethanol provokes sedation and suppresses anxiety; hence it has a high potential of reward, reuse, and abuse. However, the inability to modify drinking action which has always culminated into chronic consumption is a problem of public health concern. 6 Reports have shown that an estimated 1.2 million people are killed in road traffic crashes each year and up to 50 million injured worldwide. 7 Considering the lifestyle of some community drivers in Nigeria and some other part of Africa who drinks Alcohol/alcohol contained solution before embarking on their daily routine, followed by acetaminophen after a long day at work (probably to relieve their pain). However, significant loss of visual function due to chronic intake of alcohol (or drug abuse) will diminish a person’s ability to operate a motor vehicle safely on today’s congested high-speed roadways, which can lead to a road traffic accident.8,9
Melatonin (N-acetyl-5-methoxytryptamine) is a circulating hormone secreted by pinealocytes, an endocrine cell found in the pineal gland, also found in a neuroendocrine cell in the retina, pancreas, and gastrointestinal tract. 10 Research have shown that it can also be produced by immune cells which are non-endocrine cells. Melatonin plays a fundamental role in the regulation of body glucose homeostasis and energy metabolism. It is known as a biology thermostat of seasonal and circadian rhythms; its levels are elevated in the night and reduces in the day. 10 Melatonin regulates many biological functions through the subtypes of its G protein-coupled receptors (GPCRs), MTNR1A (also known as MT1), MTNR1B (also known as MT2), and MTNR1C. 11 MTNR1A and MTNR1B are found in human, because they are encoded by genes on human chromosomes, and it has been found in different tissues of the central nervous system and peripheral nervous system. 12 The fate of these receptors in the central nervous system pathogenesis as not been fully researched. Hence, this study sort to demonstrate the distribution of Melatonin type 1(MTNR1A) receptors in the retina of ethanol and acetaminophen induced oxidative damage.
Materials and methods
Animals
40 male healthy Wistar rats (10–12 weeks old) were purchased from Ekiti State University, Ekiti State, Nigeria. The animals were acclimatized for 2 weeks and housed in well-ventilated cages. The animals were fed with broiler finisher pelletized feeds and tap water was also given to the animal's ad libitum.
Experimental design
40 male healthy Wistar rats weighing between 150–180 g were procured from Ekiti State University, Ekiti State, Nigeria. They were housed in well-ventilated cages, kept, and maintained under laboratory condition of temperature, humidity, and light. They were allowed to acclimatize for 2 weeks and fed with broiler finisher pelletized meal and allowed drinking water ad libitum. After the acclimatization period, they were reweighed and randomly assigned to the five groups of eight rats each. Control group received normal saline throughout the experiment; Alcohol group were exposed to 25% alcohol in 2% sucrose solution for 14 days; Acetaminophen group received paracetamol at a dose of 100 mg/kg bodyweight via oral gavage for 14 days; Acetaminophen + Alcohol group (intervention) received 25% alcohol in 2% sucrose solution + 100 mg/kg BW of paracetamol for 14 days; Withdrawal group rats were exposed to 25% alcohol in 2% sucrose solution + 100 mg/kg BW of paracetamol for 14 days and withdraw for 7 days. The body weight and rectal temperature were recorded every 2 days, and behavioural assessments were made at the end of the treatments.
Weight and rectal temperature of animals
Bodyweight of the animals was taken and recorded weekly with the aid of Gallenhamp Electronic Balance. The Rectal Temperature was taken and recorded using a rodent rectal temperature probe–rectal probe digital thermometer (RET 3). Rectal temperature was recorded by inserting the probe through the rectum into the colon and stable rectal temperature within 3 secs were recorded as described by Frau et al. 13
Behavioural studies
The behavioural study was carried out in a closed area with proper illumination and sound control behavioural analysis. The tests were carried out to assess the vision and memory of the animals. The animals were subjected to the Morris Water Test (MWT) to test memory status and to check the vision of the rats and novel object recognition Test (NORt) to test the memory of the animals. All behavioural tests performance was recorded using a digital video recorder and were later analyzed.
Visual function test
A visible platform Morris water maze was used to determine the visual acuity. This device is based on the principle that rats can instinctively swim and can be trained to escape onto a visible platform. The water maze was a circular galvanized tank with white walls measuring 1.2 m in diameter and 0.6 m in height, divided into four equal quadrants. Water at 25°C was used to fill the tank to a depth of 30 cm. A circular unfixed platform of 10 cm in diameter protruding 1 cm above the water surface was used. A bright cloth was used to cover the protruding part of the platform to make it highly visible. All the rats were submitted to pre-training and training session before visual acuity testing was done. During the pre-training session, each rat would be placed into the water maze and then allowed to swim, locate, and mount the visible platform placed in the centre of one of the four quadrants. The rats were given one or more trials of 60 s time limit. After succeeding in finding and mounting the platform, the rats were trained for 2 days. In the period of training four trials were given to each rat on each day. On each trial, the platform was moved to the centre of a different quadrant, and the rats were released from different starting points and allowed to find and escape onto the platform. After mounting the platform, the rat would be left there for 15 s after which it would be removed. The rats would then be put into a holding cage containing pre-warmed towels for 1 min till the start of the next trial. The rat that would fail to find the platform in 60 s would be guided to reach it, and this trial would be repeated. The time taken for the rat to find and mount the platform for each trial was recorded as the escape latency (in seconds). Testing was done on day 3 during the 1st, 3rd, and 5th week of the experiment. Visual acuity was determined using the mean escape latencies. 14
Novel object recognition test
This was done to measure the non-Spatial working memory in the control and treatment group. Each animal was subjected to two tests T1 and T2 for 3 min each; an inter-time of 30 min was observed between T1 and T2. In T1 the animals were allowed to explore two identical objects for 3 min following which the animals were returned to their cages. The animals spent the inter-trial interval in their cages following which they were returned to the testing area for the second test T2 (3 min). In T2 one of the old objects (familiar object) was replaced by a new object (novel object). The animals explored the object for 3 min while the scientist recorded the time spent exploring the old and new object respectively.

Animal sacrifice
After the last administration and weighting of the animals, the rats from each group were anaesthetized by injecting 0.5 mL of ketamine subcutaneously to induce loss of consciousness. Whole animals were fixed by intracardial perfusion fixation with the use of 10% normal saline to flush out the blood of the animals through their left-ventricle and later with 10% formal saline (9 g of sodium chloride, 900 mL of distilled water, and 100 mL of formaldehyde) for proper fixing of the organs. The brain and the eyes of these animals were excised and transferred immediately to a specimen bottle containing 10% formal saline and another bottle containing Davidson fixative (500 mL of formaldehyde, 750 mL of alcohol, 250 mL of acetic acid and 750 mL of water) and taken for histological analysis. Furthermore, four rats from each of the group were sacrificed through intracardiac perfusion with phosphate buffered solution, their eyes were harvested and transferred into a sample bottle filled with 30% sucrose which was kept in a frozen environment to preserve the tissue for the biochemical analysis.
Histological and immunohistochemical analysis
Immunohistochemical analysis for the distribution of melatonin receptor (MTNR1A) was carried out using the heat method of antigen retrieval. The retina section was baked in an oven at 50°C for 30 min. Slides were treated in xylene for 10 min, dehydrated in ascending grades of alcohol for 10 min each, and then dip in distilled water, followed by antigen retrieval solution (hot citric acid solution at pH of 7.0) heated to 90°C for 20 min. Slides were washed in two changes of PBS for 5 min each. PAP pen was used to mark the area of the tissue followed by incubation in hydrogen peroxide for 30 min at room temperature to block endogenous peroxidase; slides were washed in PBS for 5 min and then protein block solution for 10 min at room temperature. Slides were incubated in rabbit MTNR1A receptor polyclonal antibody from Elabscience (E-AB-12,579) and were later incubated with 2-step plus Poly-HRP Anti Rabbit/Mouse IgG Detection System (with DAB Solution) from Elabscience (E-IR-R213). Slides were counterstained in hematoxylin solution for 10 min. Slides were then dehydrated in ascending order of ethanol for 10 min each. They were later cleared in xylene for 10 min and mounted using DPX mountant.
Biochemical analyses
Biochemical analyses were done to assay the activities of malonaldehyde (MDA), Superoxide dismutase (SOD) and the total melatonin level.
Determination of malonaldehyde (MDA) concentration
2-Thiobarbituric Acid Reactive Substances (TBARS) are naturally present in biological specimens and include lipid hydroperoxides and aldehydes which increase in concentration as a response to oxidative stress. 1, 2 TBARS assay values are usually reported in malondialdehyde (MDA) equivalents, a compound that results from the decomposition of polyunsaturated fatty acid lipid peroxides. The TBARS assay is a well-recognized, established method for quantifying these lipid peroxides, although it has been criticized for its reactivity towards other compounds other than MDA. This kit contains modifications from the traditional TBARS assay to reduce background and the generation of TBA reactive substances to give a straightforward, reproducible, and consistent method for analyzing biological samples for lipid peroxidation products. This assay can be run colourimetrically at 532 nm.
Determination of superoxide dismutase (SOD) level
The SOD activity was determined according to a method previously described by Misra and Fridovich, 1971. The SOD level following the principle of the ability of superoxide dismutase to prevent the auto-oxidation of epinephrine at pH 10.2 with a corresponding increase in absorbance at 480 nm. The reaction serves as a rationale in assaying for SOD.
Quantification of melatonin level
This ELISA kit applies to the in vitro quantitative determination of Rat MT concentrations in serum, plasma, and other biological fluids. The micro ELISA plate provided in this kit has been pre-coated with Rat MT. During the reaction, Rat MT in the sample or standard competes with a fixed amount of Rat MT on the solid phase supporter for sites on the biotinylated Detection Ab specific to Rat MT. Excess conjugate and unbound sample or standard are washed from the plate, and Avidin conjugated to horseradish peroxidase (HRP) are added to each microplate well and incubated. Then a TMB substrate solution is added to each well. The enzyme-substrate reaction is terminated by the addition of stop solution and the colour change is measured spectrophotometrically at a wavelength of 450 nm ± 2 nm. The concentration of Rat MT in the samples is then determined by comparing the optical density (OD) of the samples to the standard curve.
Microscopy analysis
All sections were studied under an OPT-EPU industrial camera light microscope and a computer. Photomicrographs of stained sections were obtained, reported and imported into Image J image analysis software (a National Institute of Health (NIH), USA sponsored software) for analysis.
Statistical analyses
Statistical analysis was done using one-way ANOVA (analysis of variance), differences between groups were evaluated using multiple Turkey’s post hoc tests with the aid of GraphPad Prism V.5.0 (GraphPad Software, La Jolla California USA, www.graphpad.com). The outcomes of the statistical analysis were represented in graphs and bar charts with error bar representing the mean ± SEM (standard error of the mean). The significant level was set at p < 0.05.
Results
Gross morphological observation
The experimental animals showed no changes in the skin and colour of their eyes when compared to those in the control group throughout the administration period. It was observed that the treated groups were relatively more sensitive to their environment and showed more restlessness when compared with the control group.
Body weight
After the 2nd week of administration, a decrease in body weight was observed in the alcohol group, ALc + Acet group and acetaminophen group throughout the experimental animals. (see Figure 1). Graph showing change in body weight of animals during the experiment (p-value = 0.0234: F-value = 3.801). The alcohol group shows a statistically significant decrease in body weight when compared to control group and other experimental groups. *p < 0.05.
Rectal temperature measurement
Rectal probe digital thermometer (RET-3) [Rodent thermometer BIO-TK8851 (BIOSED, USA)] was used to determine the rectal temperature in each mouse (see Figure 2). Graph showing the rectal temperature of animals during the experiment (p-value = 0.4352: F-value = 1.002). There was a statistical increase in the rectal temperature of the Alcohol group when compared with the control and other experimental groups. *p < 0.05.
Visual acuity test
A visible platform Morris water maze was used to determine the visual acuity (see Figure 3). Graph showing the time spent in the visible platform during Morris water maze test used to determine the visual acuity (p-value = 0.3782: F-value = 1.133). The acetaminophen group shows a statistically significant reduction in escape latency when compared to other groups. *p < 0.05.
Biochemical analyses for oxidative stress markers
Malondialdehyde (MDA) activity (see Figure 4) Retina Malondialdehyde (MDA) activity observed in the experimental animal (p-value = 0.0444: F-value = 5.530). The effect of alcohol significantly altered the MDA level compared to the control. *p < 0.05.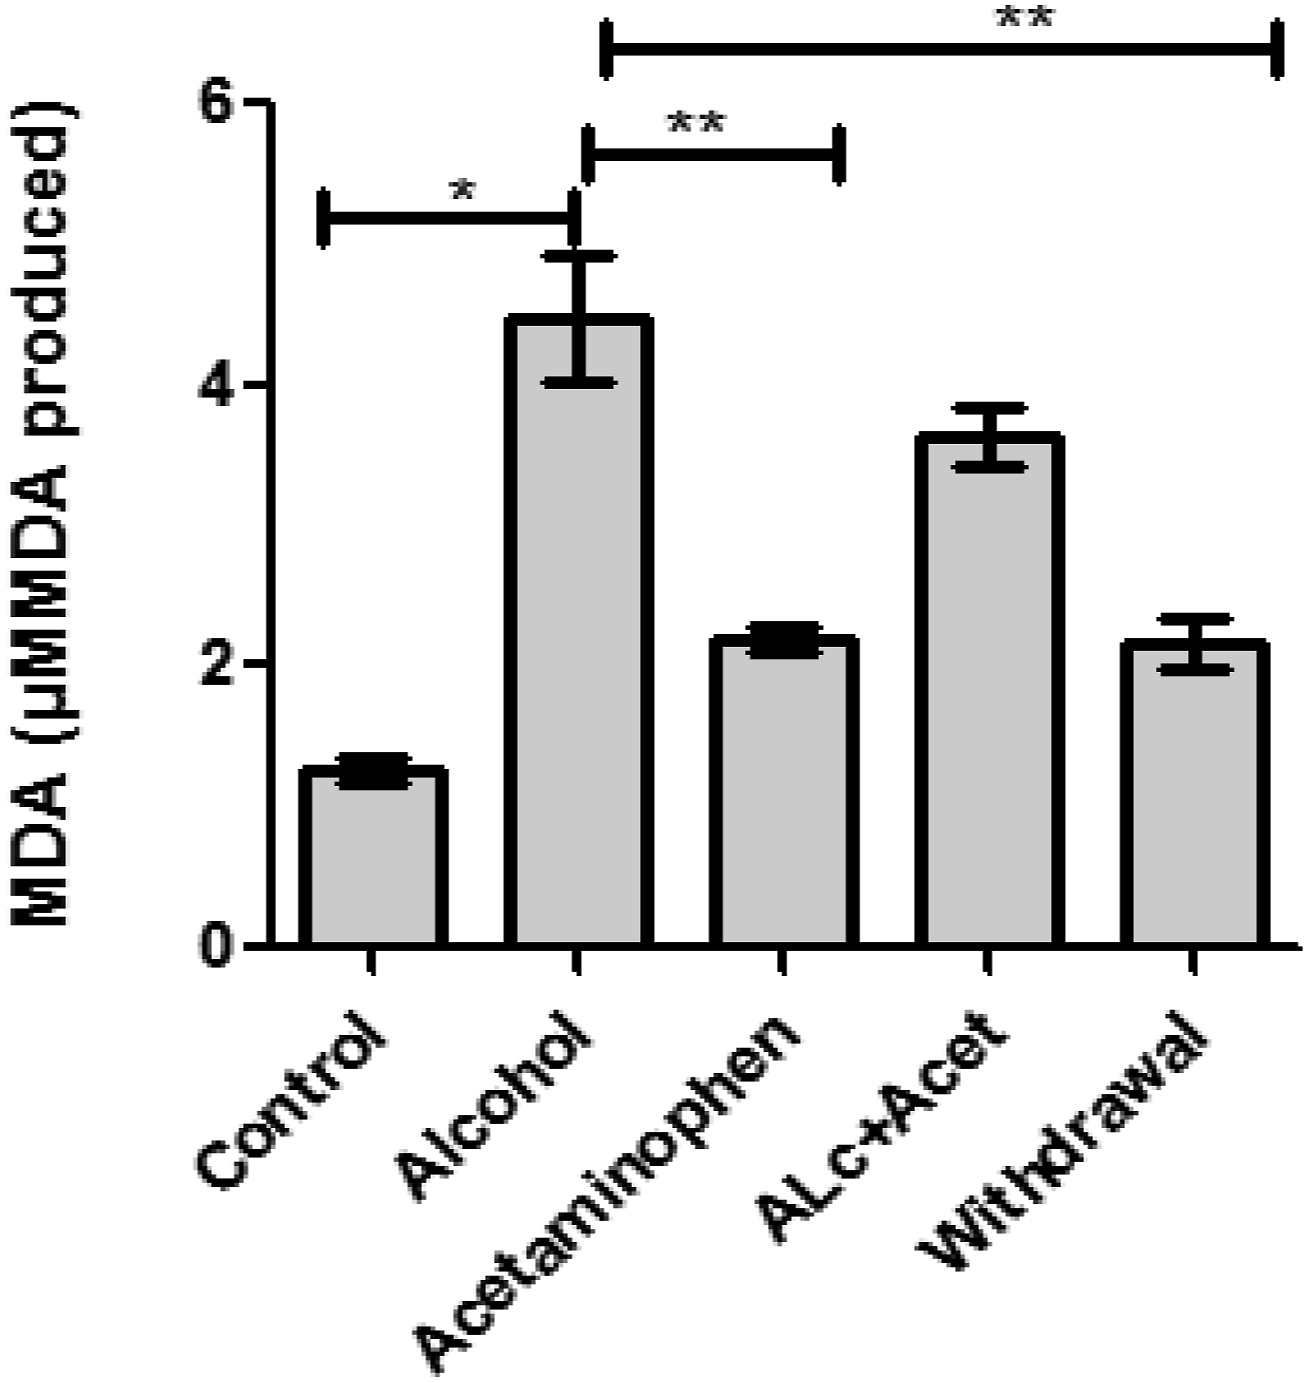
Superoxide Dismutase (SOD) activity (see Figure 5) Retina Superoxide dismutase (SOD) activity observed in the experimental animal (p-value = 0.5109: F-value = 0.9384). The effect of alcohol significantly altered SOD level compared to the control group. *p < 0.05.
Rat MT (Melatonin) activity
This applies to the in vitro quantitative determination of Rat Melatonin concentrations in serum, plasma, and other biological fluids (see Figure 6). Graphical representation of Rat MT (Melatonin) activity observed in the experimental animals (p-value = 0.0040: F-value = 17.21). Alcohol significantly reduced the activity of rat melatonin. *p < 0.05, **p < 0.01.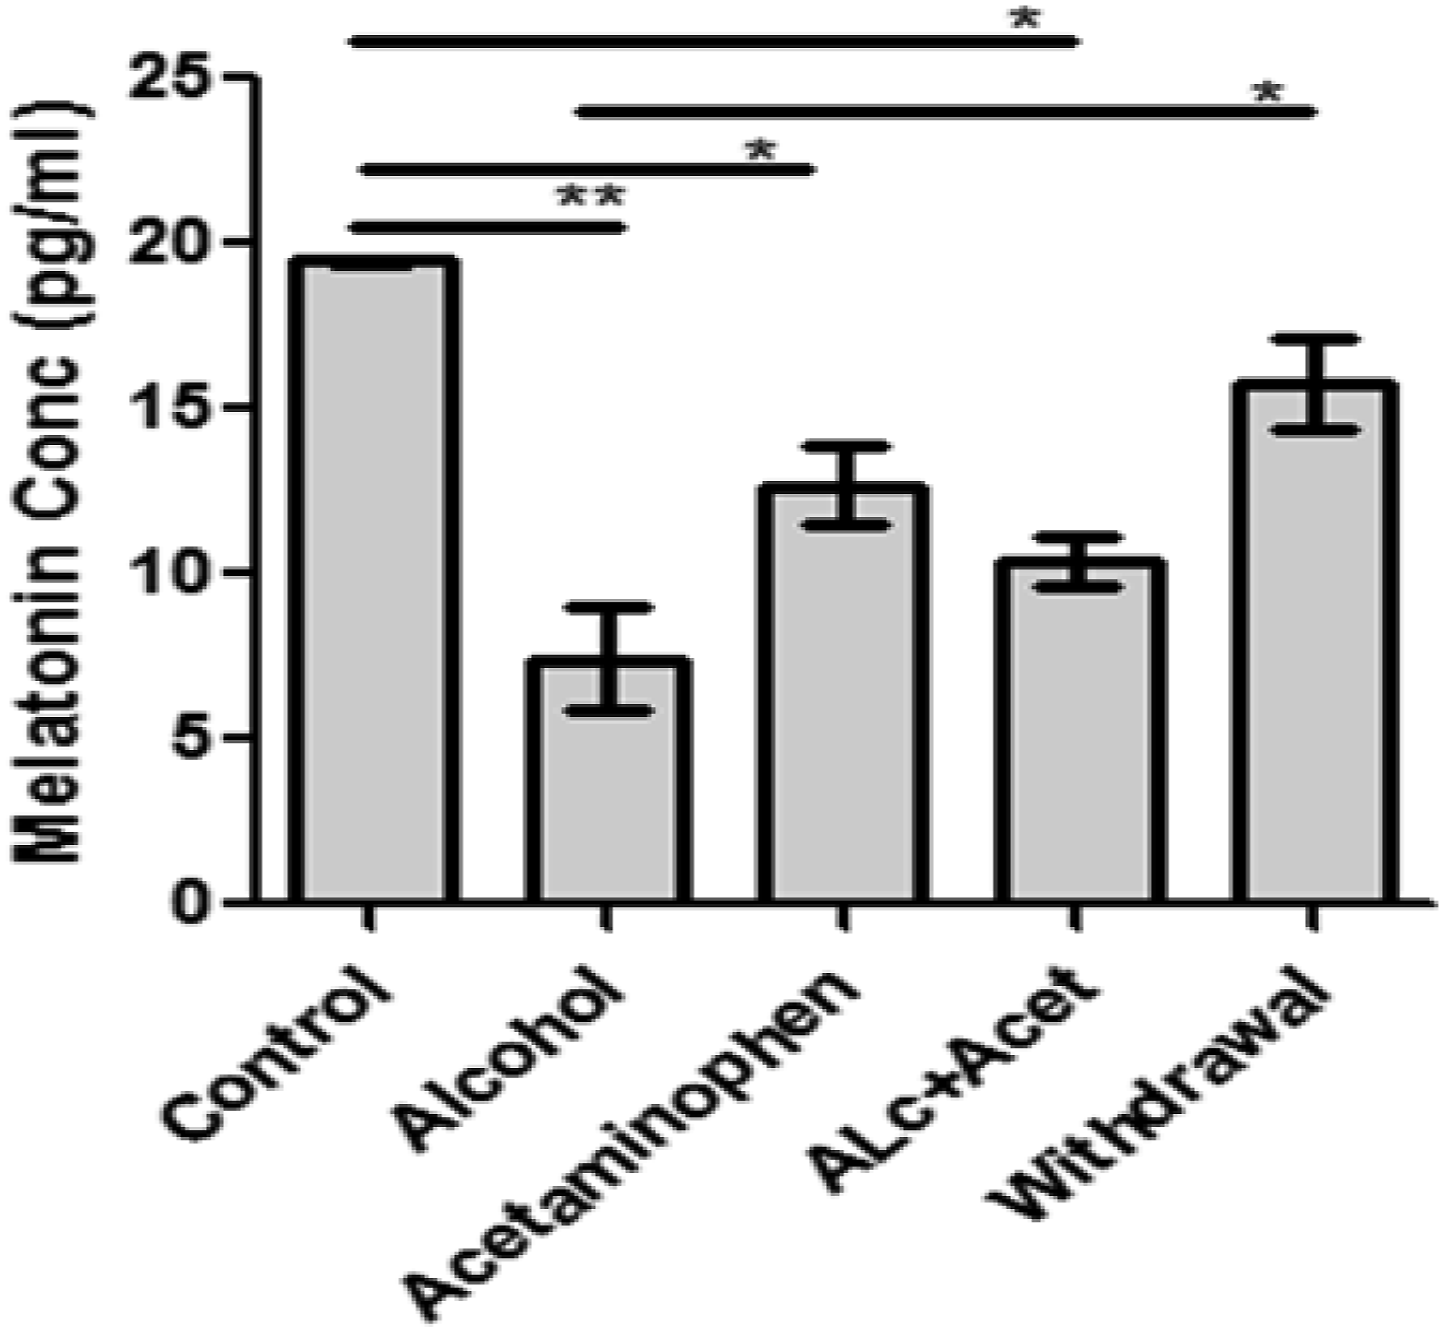
Histological observation
The histological observation was made at magnification ×200and ×800 with the aid of OPT-EPU industrial camera light microscope connected to a computer to determine the cellular architecture and the cell population in the retina using H&E stains (see Figures 7 and 8). Photomicrograph and Bar chart showing morphology and distribution of neurons in the retina ganglion cell layer following acetaminophen and ethanol exposure. Immunohistochemical staining of the retina tissue with antibodies against melatonin MTNR1A receptor. C (Control) revealed Strong MTNR1A receptor IR in the ONL. ALc (Alcohol) revealed Weak MTNR1A receptor IR in ONL. A (Acetaminophen) shows a significant increase in MTNR1A receptor expression in the ONL when compared to the alcohol group. ALc + A (Alcohol + Acetaminophen) revealed more MTNR1A receptor IR in the ONL when compared to the alcohol group. W (withdrawal) revealed Little MTNR1A receptor IR in the ONL. The MTNR1A cells were represented by dark brown precipitate and brown-stained nuclei. ONL: outer nuclear layer; IR: immunoreactivity.

Discussion
In this study, the impact of simultaneous administration of ethanol and acetaminophen on retinal oxidative stress, body weight, rectal temperature, visual acuity test, and distribution of retinal Melatonin type 1(MTNR1A) receptors in adult Wistar rat has been assessed. Heavy alcohol consumption impairs sleep quality at night, and as also interfere daily tasks or reducing daily activity levels that require full visual performance like driving. 15
The impact of chronic simultaneous exposure to ethanol has been reported to affect body weight and food intake in animal models. Existing Studies reported that ethanol suppresses body weight gain and food intake in rodents. 15 In this study, we recorded a pragmatic decrease in the body weight in the ethanol group when compared with the control and other treated groups (***p > 0.0001). This report agrees with Matthews et al. 16 This decrease in body weight in the ethanol exposed rat can be associated with conditioned taste aversion, indicating a reduction of motivation to a food. Excessive alcohol intake can impair the utilization of nutrients by altering their storage and excretion, damaging cells lining the stomach and intestines, and disabling transport of some nutrients into the blood. 17 Co-treatment (alcohol + Acetaminophen) group shows a steady decrease in weight when compared to the control group, but a statistically significant increase when compared to the alcohol group (**p > 0.001). Following the withdrawal of alcohol and acetaminophen, there was a statistically significant increase in body weight in the withdrawal group compared to the Co-treatment (Acetaminophen + alcohol group) (see Figure 1).
Previous studies have described the impact of ethanol exposure on the body and rectal temperatures (RT) of experimental rodents. 18 In the present study, the average RT in the alcohol-exposed group was significantly higher than that recorded in the control and acetaminophen group (*p > 0.05). Co-treatment (alcohol + Acetaminophen) significantly reduced rectal temperature (**p < 0.001) when compared to the alcohol group. Similarly, retal temperature in alcohol withdrawal group was significantly reduced, when compared to alcohol only group (*p > 0.05) (see Figure 1). Hyperthermia is, in fact, one of the known and generally accepted impacts of excessive alcohol absorption, and it has been implicated in decreased melatonin level. Melatonin as a mediator between the thermoregulatory and arousal system, distal heat loss, via increased skin temperature, and closely associated with increased sleepiness and sleep induction. 19
Many models have been used to assess visual testing in animals such as cat, horses, mice, and rat, but the visual water task appears to be more efficient for measuring acuity in rats. 14 In this study, the mean escape latency in the alcohol-exposed group was significantly higher than the control and acetaminophen group (**p > 0.001). Reduction in the mean escape latency is seen in Co-treatment (alcohol + Acetaminophen), and alcohol withdrawal group when compared with the alcohol group, but not statistically significant (see Figure 3).
Exposure to ethanol has been shown to induce oxidative stress, and Continuous regeneration of melatonin in the eye offers a frontier antioxidative defence for both the anterior and posterior eye. 9 Usually, reactive oxygen species (ROS) are metabolized into less toxic molecules by the action of antioxidant enzymes, including, superoxide dismutase, catalase, or glutathione. Malondialdehyde is one of the final products of polyunsaturated fatty acids peroxidation in the cells. 20 It is also known as a marker of oxidative stress and is a potentially mutagenic, highly reactive compound that is not typically observed in pure form and results from lipid peroxidation of polyunsaturated fatty acid. 21 The result of this study reveals the effect of alcohol significantly altered the MDA level compared to the control (**p < 0.001). Acetaminophen decreased the MDA level when compared to the alcohol group (**p < 0.001). Co-treatment (alcohol + Acetaminophen) group shows an increase in MDA level when compared to the control but not statistically significant (see Figure 4). We also recorded a decreased activity of SOD level in the alcohol group when compared with the control and withdrawal group, following simultaneous exposure of alcohol and acetaminophen (*p < 0.05, **p < 0.001 see Figure 4). Withdrawal from alcohol administration produced a significant reduction in MDA levels (*p < 0.05, see Figure 4) and increased levels of SOD (**p < 0.001) (see Figures 4 and 5) in the eye. Thus, chronic, and simultaneous ethanol and acetaminophen consumption lead to an increase in lipid peroxidation products like malondialdehyde (MDA) and a decrease in antioxidant factors, such as Superoxide dismutase (SOD), 22 and these can in return induce apoptosis.
The fact that MT1 transcripts are localized on photoreceptors may suggest that melatonin is involved in the modulation of visual function. Melatonin may also protect photoreceptors and ganglion cells during ageing by acting as an antioxidant as well via its action on MT1 receptors. Indeed, previous studies have shown a possible role for retinal melatonin as a free radical scavenger within photoreceptors. The data obtained from the current study recorded a pragmatic decrease in the alcohol melatonin level when compared with the control (**p > 0.001). Co-treatment (alcohol + Acetaminophen) group shows an increase in melatonin level when compared to the alcohol group, but a statistically significant decrease when compared to the control group (*p > 0.05). Following the withdrawal of alcohol and acetaminophen, there was a statistically significant increase in melatonin level in the withdrawal group compared to the alcohol group (*p > 0.05) (see Figure 6). Melatonin is thought to be involved in the adaptation of the organism to the light-dark cycle of the environment whereby there is a high production of melatonin at night when asleep, but due to sleep deprivation as a result of simultaneous consumption of alcohol and acetaminophen may lead to underproduction of melatonin. 23 These corroborate the existing experimental evidence suggesting a possible influence of melatonin in photoreceptor degeneration. 11
Haematoxylin and eosin staining techniques were used to assess the general histoarchitecture of the visual system with the focus on the retina. The alcohol group revealed strong proliferation and a morphological thickness of the RGC layers when compared to the control. Acetaminophen group revealed a decrease in the RGC thickness when compared to the alcohol group. Co-treatment (alcohol + Acetaminophen) group revealed proliferation and thickness of the RGC when compared with the control group. While the W (Withdrawal) group revealed a normal but poor distribution of RGC. Reports have shown that the toxic effect of alcohol has been ascribed to the increased of free radicals and the growth of oxidative stress. Increment in oxidative stress is as a result of ethanol and its oxidation product which react with antioxidants to cause a depletion of antioxidant substances. 24 The thickness or proliferation detected in the alcohol-treated group can contribute to the morphological damage detected in the retina and this could be linked to oxidative stress toxicity and the cell bodies of the photoreceptor cells.
Previous research on alcohol toxicity has linked alcohol consumption with the circadian rhythm of melatonin (Mel) production. Melatonin is the hormone produced by the pineal gland to regulate the 24 h (sleep and wake cycle) and seasonal biological clock. 10 Alcohol group revealed a significant decrease of MTNR1A immunoreactivity in the outer nuclear layer (ONL) when compared to the control (***p < 0.0001). A (acetaminophen) group shows a significant increase in MTNR1A expression in the ONL when compared to the alcohol group. AL&A (alcohol + acetaminophen) revealed more MTNR1A IR in the ONL when compared to a group alcohol group, while withdrawal revealed Little MTNR1A IR in the ONL (**p > 0.001). Ethanol exposure induces oxidative stress damage to different tissues in the body; however, various studies have shown that melatonin may be useful to prevent oxidative stress reactions due to its antioxidant properties. 12 This finding corroborates the existing work of Schmitz et al. 25 who concluded that alcoholism can cause a sharp decrease or complete cessation of Melatonin synthesis and a single dose of alcohol can induce changes in the circadian rhythm of an organism. Taking together our findings, it can be inferred that chronic simultaneous intake/consumption of alcohol and acetaminophen altered the melatonin level in the retina and this may implicate the circadian clock and melatonin in Wistar rat visual system.
Footnotes
Acknowledgements
The authors wish to acknowledge the assistance of Mr Ishola Azeez and the supported of Miss Kate Nebo and Mr Adetunji Adedeji throughout this research.
Author contributions
Adekeye Adeshina Oloruntoba: Investigation, Conceptualization, Methodology, Writing - review & editing, Supervision. Fafure Adedamola: Methodology, Analysis, Writing - review & editing, Software.
Declaration of conflicting interests
The author(s) declared no potential conflicts of interest with respect to the research, authorship, and/or publication of this article.
Funding
The author(s) received no financial support for the research, authorship, and/or publication of this article.