
Abstract
As a pentacyclic triterpenoid compound, Ursolic acid (UA) broads range of biological effects. CXCL12 is a ligand for CXCR4 and CXCR7 proteins on thyroid cancer cells. Here we examined the effects of UA on the proliferation, migration and invasion of papillary thyroid carcinoma (PTCs) in a dose-manner. In addition, UA can reduce the expression levels of CXCR4 and CXCR7 in PTCs. In addition to this direct anticancer pathway, studies have shown that UA can play an anticancer role by affecting the secretion of CXCL12 in cancer-associated fibroblasts (CAFs). After treated with UA, normal fibroblasts and CAFs culture medium (CM) showed differential CXCL12 expression levels. We prepared fibroblast conditioned medium according to the intervention of UA, then cultured TPC-1 and B-CPAP cells with differential CM, and detected significant differences in the proliferation, migration and invasion of cancer cells. Our findings uncovered an indirect anticancer mechanism of UA. This cancer chemopreventive properties is expected to make UA a clinically useful chemopreventive agent.
Keywords
Introduction
Thyroid cancer (TC) tissues are rich in interstitial components, including a large number of fibroblasts, which constitute TC tissues and are closely related to the growth and development of thyroid cancer cells. Fibroblasts in cancer tissues are called CAFs. CAFs secrete a variety of cytokines into tumor microenvironment. Interstitial CAFs cells of thyroid cancer affect the progress of TC in many ways and regulate its occurrence, development, cell proliferation, metastasis and drug resistance. In the study of TC and CAFs, CAFs cells and TC cells were cultured to simulate the growth environment of TC in vivo, so as to analyze the effect and influence of drugs on TC cells. Laura Fozzatti et al. confirmed the phenotypic changes of NFs in vitro by co-culture technology. NFs obtained CAFs phenotype after contacting with soluble factors secreted by undifferentiated thyroid cancer (ATC) cells. This process is mediated by Src/Akt pathway activation. The conditioned medium obtained from activated fibroblasts promotes the proliferation and invasion of follicular thyroid carcinoma (FTC) cell line FTC-133 cells. 1 The high expression of TGF-β1 was significantly correlated with the level of α-SMA in fibroblasts around cancer cell. 2 PTCV600E has higher expression level of fibroblasts and T-cell related genes and presents more fibrosis. Two-dimensional tissue sections show that tumor cells present infiltrating and proliferating stroma. Both stromal fibroblasts and tumor cells show high proliferation rate in PTCV600E, reflecting the important role of matrix in tumor expansion. The more active fibrotic component indicates the higher efficiency of combined targeted therapy. 3
Thus, drugs that have the ability to reduce expression of chemokines in the PTCs would be a feasible approach to overcome such issues. Ursolic acid (UA, molecular weight: 456.7), is a type of ursane-type pentacyclic triterpenic acid, ubiquitous in a variety of natural medicinal plants with multiple pharmacological properties, including anti-inflammatory, liver-protective, anti-cancer, anti-atherosclerotic, anti-epileptic, and anti-diabetic activities through extensively studying in vitro and in vivo models of experiments. In recent years, it has garnered major attention in the field of cancer research due to its good anti-tumor activity and low toxicity, which especially makes it a candidate for cancer chemotherapy and metastasis. For the first time, G Li et al. showed that UA induces apoptosis in both primary and transformed leukemia cells through association and polarized colocalization of ezrin and Fas, downregulation/dephosphorylation of ezrin, as well as formation of death-inducing signaling complex. 4 UA has been shown to exert inhibitory activity against multiple kinase pathways including activator protein, nuclear factor-κB (NF-κB), ERK1/2 and protein kinase C. Bikul Das et al. found that UA reduces cellular survival during hypoxia by targeting VEGF/Flt1 related ERK1/2 activation. 5 UA inhibited growth of NSCLC cells in a time- and dose-dependent manner and stimulated apoptosis by activation of caspase-3, -9 and Bax, and a decrease in Bcl-2. 6 The effect that UA enhanced the cytotoxicity of oxaliplatin was associated with activation of caspase-3/8/9, down-regulation of Bcl-xL, Bcl-2, survivin, and inhibition of KRAS expression and ERK1/2, MEK1/2, BRAF, IκBα, IKKα, AKT, JNK, p-38, and p65 phosphorylation of the NF-κB, PI3K/AKT, and MAPK signaling pathways. 7 However, the effect of UA treatment on CAFs is not known.
In the present study, the potential of UA as an oral drug preparation is clearly highlighted by several lines of evidence. Our previous studies showed that CXCR4 and CXCR7 were overexpressed in PTC tissues compared with adjacent non-malignant tissues, and there was significant difference in the expression levels of CXCR4 and CXCR7 in tumor tissues and peritumor tissues (p < 0.05). These two receptors were positively correlated with lymph node metastasis and capsule invasion, but there was no significant relationship with gender, age and tumor size. 8 The results show that CXCR4/CXCR7 plays an important role in the invasion and metastasis of PTC, which provides preclinical evidence for CXCR4/CXCR7 to become two potential targets for therapeutic intervention of PTC, and also lays a foundation for the next cell experiment to explore the relationship between CXCL12/CXCR4/CXCR7 axis, PTC and CAFs. Our current study clearly showed that UA robustly down-regulates CXCL12 secreted by CAFs, a strong inflammatory factor that exhibits beneficial effects in PTC. Importantly, the supernatants of UA-treated PTCs supported proliferation, invasion and metastasis of PTC cells, and the effect was obvious. We therefore conclude that UA reduces CXCL12 production by CAFs, thus inhibiting cancer cell growth and proliferation. The contribution of other chemokines factors may also be important, and this would be worthy of further investigations. The chemical components in traditional Chinese medicine are responsible for their therapeutic effects. The aim of this paper is to research the course and the basic mechanism of UA with high application value playing efficacy.
Materials and methods
Chemicals and antibodies
dNTP, Mg2+, Tap enzyme, SYBR Green Ⅰ, ROX, penicillin-streptomycin and fetal bovine serum (FBS) were purchased from Gibco (Invitrogen, NewYork, USA). RPMI-1640 was obtained from Procell (Wuhan, China) and HyClone (Utah, USA). EDTA was received from Solarbio (Beijing, China) was acquired from BIOTOP. Protein-free cryopreservation medium was received from Meilunbio (Dalian, China). Phosphate-buffered saline (PBS), TRIzolTM Reagent were purchased from ThermoFisher (Boston, USA). Primescript RT Master Mix, SYBR premixTap Ⅱ, SYBRMIX were received from Takara (Tokyo, Japan). CXCL12 ELISA kit, Antibodies against PAP-α, α-SMA and Vimentin were purchased from Abcam (Cambridge, UK). Goat anti-mouse IgG (H+L), Goat anti-Rabbit IgG (H&L)-HRP were acquired from Boster (California, USA). BeyoClickTMEdU-488 cell-proliferation assay kit was purchased from Beyotime (Shanghai, China). 4% paraformaldehyde was obtained from Sigma-Aldrich (Missouri, USA). CXCL12 (SDDF-1α) was received from PEPROTECH (Connecticut, USA). Complete fibroblast CM, primary fibroblast culture additive was acquired from iCell (Shanghai, China). UA (25 mg, purity>99.7%) was purchased from TargetMol (Massachusetts, USA), which was dissolved in dimethyl sulfoxide (DMSO; Sigma–Aldrich, St. Louis, Missouri, USA) and stored at 20°C. DMSO concentrations did not exceed 0.1% and had no effect on parameters analyzed.
Cell culture
Human thyroid cancer cells TPC-1 and B-CPAP obtained from Procell Life Science&Technology Co., Ltd. (Wuhan, China) were grown in DMEM containing 1% antibiotic−antimycotic solution, and 10% heat-inactivated FBS. Human primary thyroid fibroblasts and human primary thyroid CAFs obtained from iCell Bioscience lnc (Shanghai, China) were cultivated in fibroblast basic medium containing 1% primary fibroblast culture additive, 1% antibiotic−antimycotic solution, and 10% heat-inactivated FBS. They were maintained at 37°C in a 5% CO2 humidified atmosphere.
Western blot assay
Cells in 6-well plates were digested by EDTA. They were lysed by cell lysis buffer, including RIPA, PMSF, inhibitor and EDTA. The supernatant was removed after centrifugation at 12,000 r/min and 4°C for 15 min. Added one volume of loading buffer into four volumes of protein, boiled and separated for 5 s. Cell protein samples were added to the electric transfer box, and electrophoresed and transferred onto PVDF membranes. The transformed membrane was incubated with primary antibodies at 4°C overnight and blocked for 2 h. After washing three times with TBST buffer it was incubated with anti-mouse or rabbit IgG-horseradish peroxidase (HRP) at room temperature for 1 h. The developer is immersed in SDS-PVDF film and exposed. Scanned X-ray film, compared the gray value of the protein bands, and analyzed the data.
Real-time quantitative PCR
The intervened cells in the well plate were digested into RNase free EP tubes. The cells treated with or without different concentrations of drugs were centrifuged at 5000 r/min for 5 min twice. Cellular was isolated using the TRIzol® in centrifugal tube. Added chloroform and centrifuged at 4°C, 12,000 r/min for 15 min. After adding isopropanol, centrifuged, added 75% ice ethanol to the precipitation and centrifuge again. After absorbing the supernatant, DEPC water dissolved the RNA precipitation. Genomic DNA was removed with master mix, and reverse transcription was performed with primescript RT enzyme mix reverse transcription kit. Real-time PCR was performed using the PCR reaction system according to the manufacturer’s instructions (Gibco, Takara). EXCEL was utilized and Gene relative expression was calculated by log2 of −ΔΔCt values from triplicate of PCR.
ELISA
Supernatants were collected and assayed for CXCL12 by ELISA Kits. The cell supernatant was centrifuged and added to ELISA 96-well plate, then added enzyme labeling reagent. They were incubated at 37°C for 60 min and washed for 5 times. Then added chromogenic agents and termination solution to each well. Detected the absorbance value of each well on the microplate reader.
Flow cytometry
Cells plated in 6-well plates were treated with different concentrations of UA, CXCL12 and conditioned medium. The preheated EDU working solution was added to the cells and incubated for 2–4 h according to the cell speed. After surface-marker staining, cells were resuspended and added to the stationary solution. According to the manufacturer’s instructions, PBS containing 0.3% Triton X-100, click reaction solution and Hoechst solution were added successively. Flow cytometry analysis was performed on flow cytometry.
CCK8
The cells in logarithmic growth stage were inoculated into 96-well plates and incubated in CO2 incubator, following addition of 10% CCK8 serum-free medium for 1 h. At last, the absorption at 450 nm was recorded using microplate reader (Tecan, Männedorf, Switzerland).
Scratch assay
Thyroid cancer at 1 × 10⁵ cells/ml were cultured in triplicates in RPMI 1640 supplemented with 10% FBS in 6-well plates. Cell monolayers were wounded with a sterile 10-mL pipette tip and washed with PBS twice to remove detached cells from the plates. Cells were treated with starvation medium and indicated doses of UA (0 ng/mL, 2 ng/mL, 5 ng/mL) or CXCL12 (0, 100, 500, 1000, 2000 ng/L) or conditioned medium (NFs CM, CAFs CM, NFs (UA) CM, CAFs (UA) CM) and kept in a CO2 incubator. The wound gap was observed after 0, 6 h, 12 h, 24 h, 48 h. The migration area was measured by Image-J, and the migration distance of scratches in each group was counted by Photoshop.
Transwell
In the invasion experiment, the upper chamber surface was covered with artificial base membrane. Added 600 μL starvation medium in the lower chamber, added 100 μL starvation medium to the upper chamber. After 8 h of incubation, the serum-free medium was sucked and discarded. The addition density in the upper chamber of invasion experiment was 1 × 10⁶ cell suspension. The addition density in the upper chamber of the migration experiment was 5 × 10⁵. After 24 h, the cells in the lower chamber were removed, stained with 0.1% crystal violet for 15 min, photographed, calculated and plotted.
Statistical analysis
Statistical analyses were performed using GraphPad Prism six software (GraphPad, La Jolla, CA) and SPSS 6.0 software. We used variance and Student’s t-test to compare the values of the control and test samples. A p-value < 0.05 was considered statistically significant difference. All measurements were conducted in triplicates.
Preparation of conditioned medium
In order not to affect cell growth, the final concentration of DMSO was less than 5%. The control group contained the same amount of CM and DMSO as the experimental group. CAFs and NFs were incubated with complete medium including 2 μg/mL UA for 24 h. CM was replaced with 5 mL serum-free DMEM and cultured for 24 h. NFs cell CM untreated by UA was NFs CM group, CAFs cell CM untreated by UA was CAFs CM group, NFs cell CM treated by UA was NFs (UA) CM group, and CAFs cell CM treated by UA was CAFs (UA) CM group. The conditioned medium was collected, centrifuged at 1000r/min for 3min, and then filtered with a 0.22-μm filter.
Results
Identification of NFs and CAFs and the effect of UA on their phenotypic transformation and properties
The cellular morphology of NFs and CAFs was different
They were both P3 generation cells, which were long spindle in cell morphology, while there were some differences between NFs and CAFs. The growth of NFs was denser and more directional than CAFs. When the density of NFs increases, the cell arrangement was radial and the cell size was roughly similar. CAFs rarely showed overlapping growth, and had weak directionality, few cell processes, irregular nuclei, uneven cell size, irregular morphology and contact inhibition (Figure 1) Differences in cell morphology and proliferation between NFs and CAFs. CAFs cells were more disordered, irregular, longer and less directional than NFs. CCK8 experiment showed that the OD value of CAFs cells increased faster than that of NFs from day 1–7, and the proliferation of CAFs cells was faster than that of NFs cells. NF: normal fibroblasts; CAF: cancer-associated fibroblasts. *p < 0.05, **p < 0.01, ***p < 0.001.
The expression of α-SMA, Vimentin, FAP-α in NFs and CAFs differ significantly
The relative abundance of each band in the gel, denoted by its position in the PVDF membrane. The contents of mRNA and protein in CAFs were higher than those in NFs. (p<0.05) (Figure 2). The content of α-SMA, Vimentin and FAP-α in NFs and CAFs were different. The expression of them in CAFs at gene and protein levels was higher than that of NFs. NF: normal fibroblasts; CAF: cancer-associated fibroblasts. *p < 0.05, **p < 0.01, ***p < 0.001.
UA inhibited the proliferation of NFs and CAFs
NFs and CAFs were cultured in different concentrations of medium with UA (1, 2, 5, 10 and 15 ng/mL). We detected the proliferation ability of NFs and CAFs. The half inhibitory concentration (IC
Effects of different concentrations of UA on proliferation and cell viability of NFs and CAFs. The OD values of NFs and CAFs cells without UA (0 ng/mL) were higher than those of other drug groups at 1–7 days. At the concentrations of 10 ng/mL and 15 ng/mL, the OD values of NFs and CAFs cells changed little from 1 to 7 days. UA at the concentration of more than 10 ng/mL had a significant inhibitory effect on both of them, and the cells showed obvious apoptosis. NF: normal fibroblasts; CAF: cancer-associated fibroblasts; UA: Ursolic acid. *p < 0.05, **p < 0.01, ***p < 0.001. Effect of UA on proliferation of NFs and CAFs. The proportion of CAFs proliferating cells was higher than that of NFs (p < 0.05). UA decreased the proportion of proliferating cells of CAFs (p < 0.01) and NFs. But the difference was not statistically significant in NFs. NF: normal fibroblasts; CAF: cancer-associated fibroblasts; UA: Ursolic acid. *p < 0.05, **p < 0.01, ***p < 0.001.

The morphological and biological changes of NFs and CAFs cells treated with UA were observed. We found that UA inhibited the growth of both groups, the cell growth rate slowed down and the cell morphology was more disordered than before. The higher the concentration of UA, more significant the effect on cells (Figure 5). Effect of UA on cell morphology of normal fibroblasts and cancer-associated fibroblasts. The concentration of UA is IC50. UA: Ursolic acid.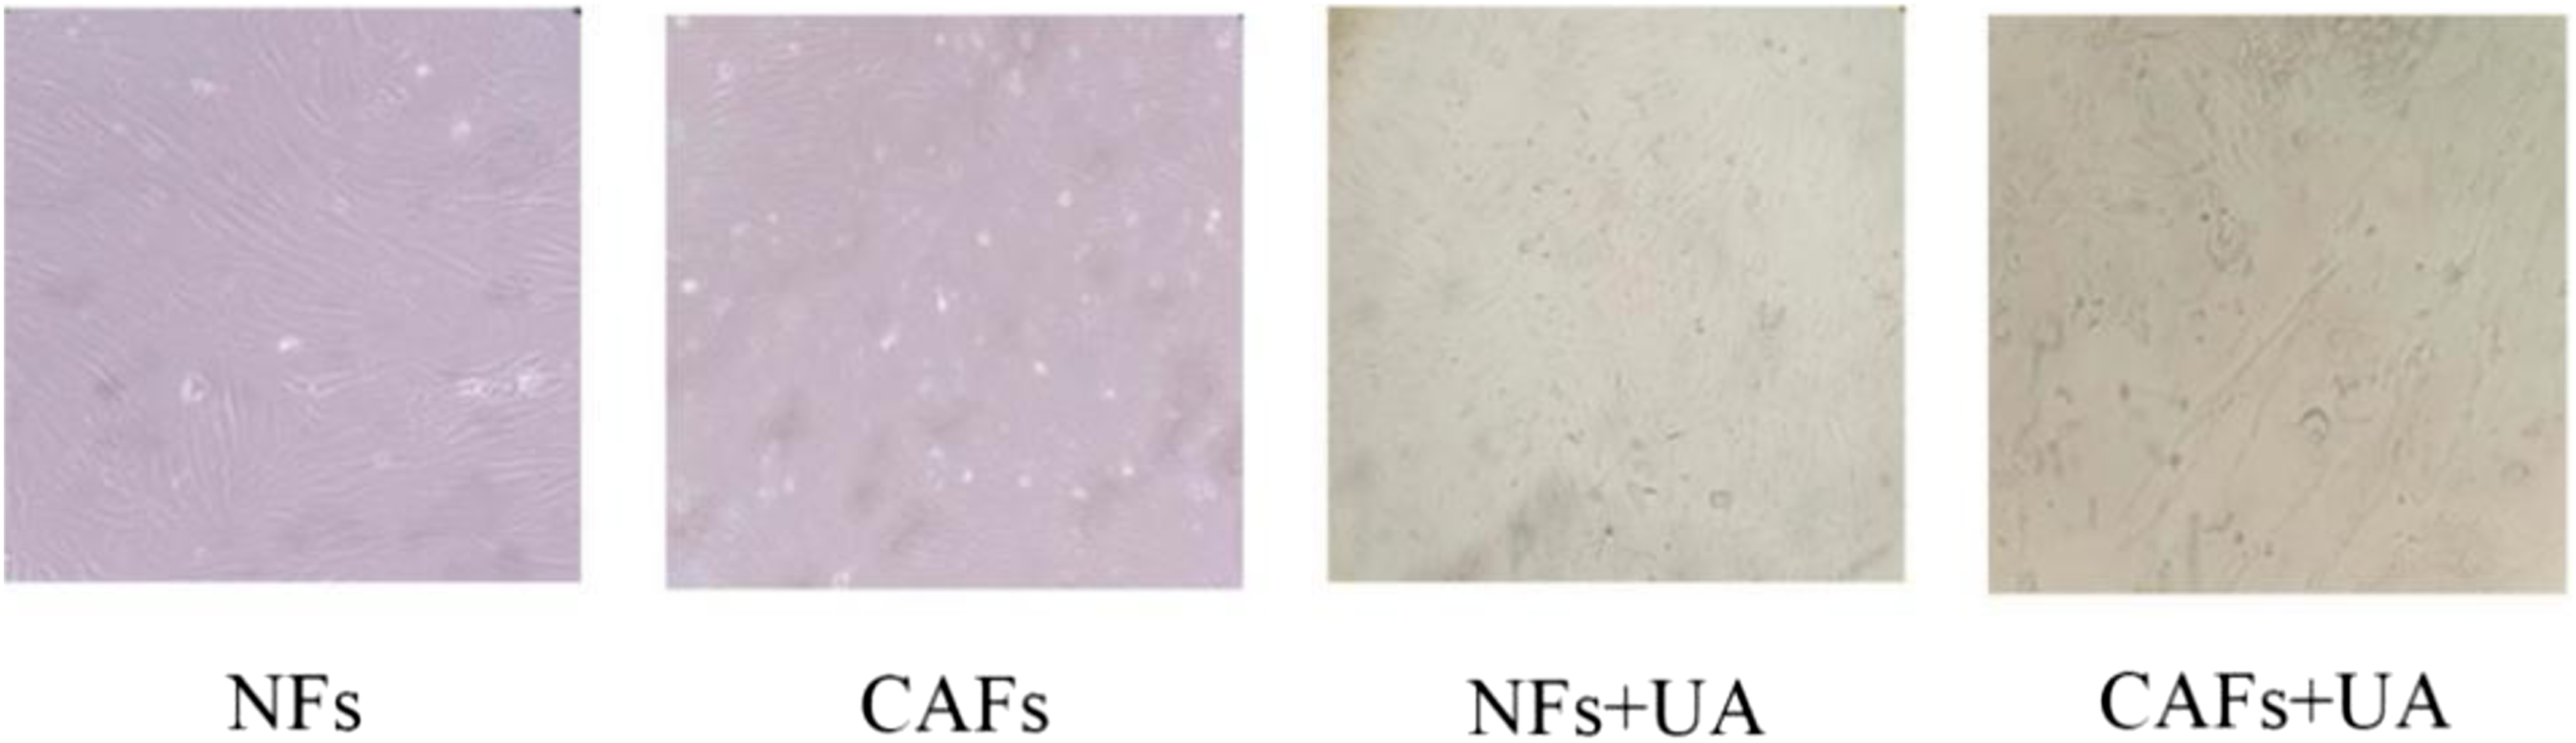
UA inhibited the expression of characteristic proteins of NFs and CAFs
RT-PCR and Western-blot were used to detect the content change of α-SMA, Vimentin, FAP-α in cells with UA treatment in each group. As shown in Figure 6, the contents of them in NFs and CAFs cells decreased, but there was no difference in NFs between them (1:0.71 ± 0.22, 1:0.98 ± 0.28, 1:0.83 ± 0.44, p > 0.05). The three protein decreased significantly in CAFs (4.06 ± 0.27:1.48 ± 0.16, 2.28 ± 0.71:0.79 ± 0.21, 2.38 ± 0.17) and the difference between them was statistically significant (p < 0.05). α-SMA expression was most affected by UA (Figure 6). These results clearly demonstrated the capacities of UA for inhibition of CAFs cells proliferation and function. Effect of UA on the expression of α-SMA, Vimentin and FAP-α. UA decreased the content of α-SMA, Vimentin and FAP-α in cancer-associated fibroblasts at gene and protein levels. The effect of UA on them was not statistically significant in normal fibroblasts, UA: Ursolic acid.*p < 0.05, **p < 0.01, ***p < 0.001.
The content of CXCL12 in the cell CM of the four groups was detected by ELISA. These data showed that UA decreased the content of CXCL12 in the supernatant of NFs and CAFs (Figure 7). While the change of CXCL12 in NFs was not statistically significant (1470.83 ± 66.32:1365.20 ± 111.93, p > 0.05). CXCL12 in CAFs decreased significantly with statistical difference (2475.07 ± 113.13:2000.65± 61.24) (p < 0.01). Effect of UA on CXCL12 secretion by NFs and CAFs. The content of CXCL12 in CAFs supernatant was higher than that in NFs (p< 0.001). There was no significant difference in the content of CXCL12 in cell supernatant after UA (2 ng/mL) intervention (p > 0.05). While the content of CXCL12 in CAFs decreased significantly (p < 0.01). NF: normal fibroblasts; CAF: cancer-associated fibroblasts; UA: Ursolic acid. *p < 0.05, **p < 0.01, ***p < 0.001.
Biological effects of CXCL12/CXCR4/CXCR7 on TPC-1 and B-CPAP cells and direct anticancer effect of UA
CXCL12 promoted the proliferation of TPC-1 and B-CPAP cells
TPC-1 and B-CPAP cells were stimulated with different concentrations of CXCL12 (0, 100, 500, 1000 and 2000 ng/L). The cell proliferation rate increased to a certain degree compared with the PBS-treated control. The OD value increased along with the CXCL12 concentration enhancing, but the OD value of cells at 2000 ng/L concentration was lower than that at 1000 ng/L concentration (Figure 8). By administering different doses, we found that 1000 ng/L of CXCL12 was the optimal concentration. The percentage of proliferating cells before CXCL12 stimulation was 17.1% and 25.7% respectively, and the percentage of proliferating cells after CXCL12 stimulation increased to 32.8% and 36.2%, respectively (p < 0.05) (Figure 9). Difference of proliferation ability between TPC-1 and B-CPAP cells after stimulation with different concentrations of CXCL12. At the same time points, the OD values of TPC-1 and B-CPAP cells increased with the increasing CXCL12 concentration. The OD value will not increase when the concentration of CXCL12 is higher than 1000 ng/L. The OD values of the two cells were the highest at the concentration of 1000 ng/L, which was the optimal dose. *p < 0.05, **p < 0.01, ***p < 0.001. Effect of CXCL12 on the proliferation of TPC-1 and B-CPAP cells. The percentage of proliferating cells increased after TC cells stimulated by CXCL12 (1000 ng/L), indicating that CXCL12 could promote the proliferation of TC cells. TC: Thyroid cancer. *p < 0.05, **p < 0.01, ***p < 0.001.

The stimulation of CXCL12 increased the expression levels of CXCR4 and CXCR7 proteins in TPC-1 and B-CPAP cells. The effect of 1000 ng/L concentration was better than that of other concentrations (Figure 10). Before and after adding CXCL12 to TPC-1, the expression quantity of CXCR4 mRNA was 1:2.57 ± 0.41, and the expression quantity of CXCR7 mRNA was 1:6.95 ± 1.90. Before and after adding CXCL12 to B-CPAP, the expression quantity of CXCR4 and CXCR7mRNA was 1:4.63 ± 0.87 and 1:2.67 ± 0.33, respectively. The difference above was statistically significant (p< 0.05) (Figure 11). Effects of different concentrations of CXCL12 on CXCR4/CXCR7 expression in TPC-1 and B-CPAP cells. Compared with the control group (0 ng/L), CXCL12 increased the expression levels of CXCR4 and CXCR7 proteins in TPC-1 and B-CPAP cells, especially at the concentration of 1000 ng/L. *p < 0.05, **p < 0.01, ***p < 0.001. Effect of CXCL12 (1000 ng/L) on CXCR4/CXCR7 expression in TPC-1, B-CPAP cells. CXCL12 (1000 ng/L) increased the CXCR4/CXCR7 mRNA and protein levels, and the expression difference was statistically significant. *p < 0.05, **p < 0.01, ***p < 0.001.

CXCL12 improved the migration and invasion ability of TPC-1 and B-CPAP cells
The migration and invasion ability of TPC-1 and B-CPAP cells increased in a concentration-dependent manner with a CXCL12 increase. The scratch healing was the most obvious at a concentration of 1000 ng/L. At 24 h and 48 h, the migration rate of TPC-1 cells at the concentration of 1000 ng/L was higher than that at 0 ng/L, 100 ng/L, 500 ng/L and 2000 ng/L (p < 0.05). B-CPAP cells showed the same results (p < 0.05) (Figures 12 to 14). Effects of different concentrations of CXCL12 on the migration ability of TPC-1 cells. Effects of different concentrations of CXCL12 on the migration ability of B-CPAP cells. The scratch healing experiment showed that the migration ability of TPC-1 and B-CPAP cells increased along with the CXCL12 concentration enhancing in the concentration range of 100 ng/L to 1000 ng/L. The cell migration ability at the concentration of 2000 ng/L was lower than that at 1000 ng/L, indicating that 1000 ng/L was the best stimulation concentration. Comparison of TPC-1 and B-CPAP mobility under different concentrations of CXCL12. The results showed that TPC-1 and B-CPAP cells had the highest mobility at the concentration of 1000 ng/L. The results at 24 h and 48 h were the same. *p < 0.05, **p < 0.01, ***p < 0.001.


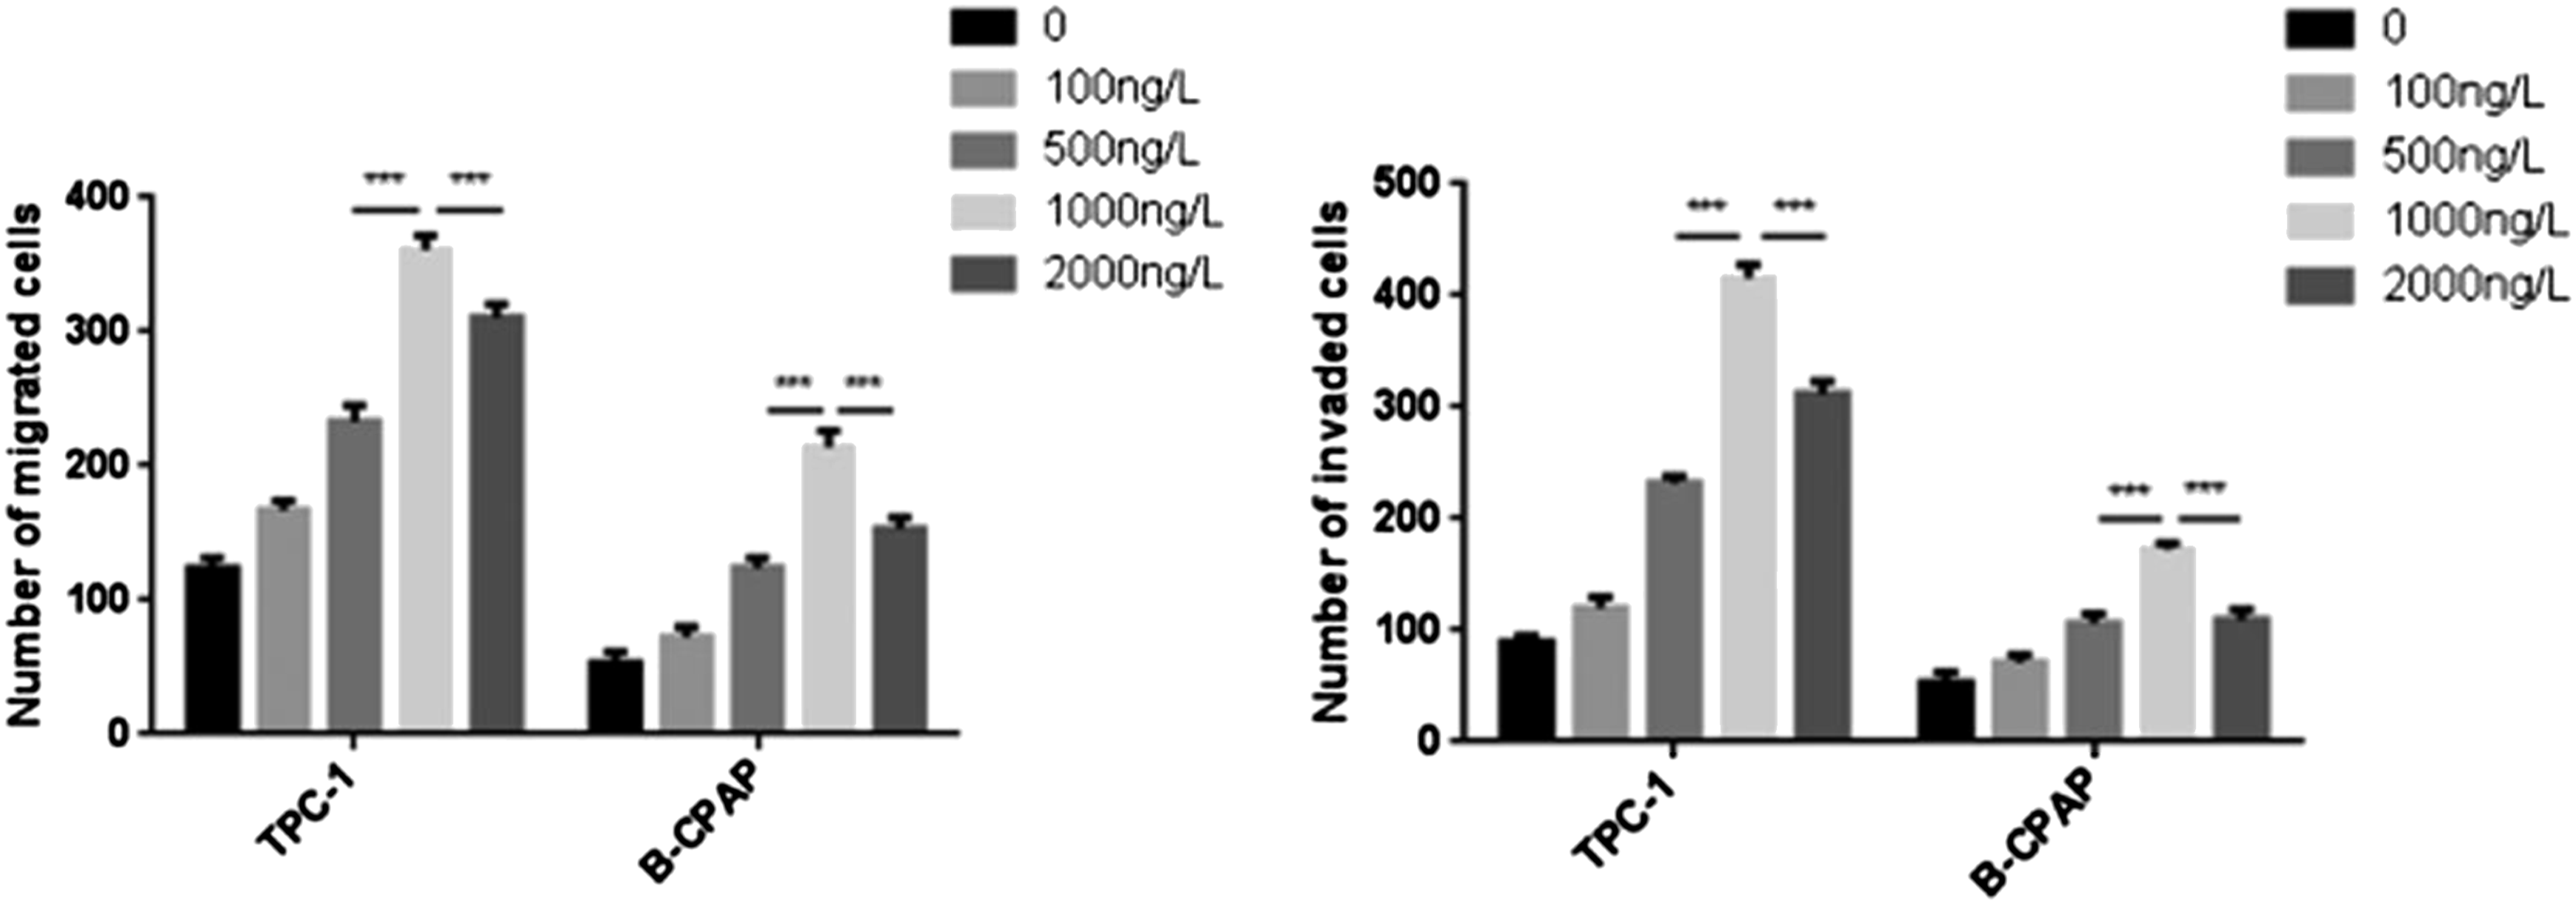
The number of cells migrating to the bottom of the membrane in the experimental group (1000 ng/L) was significantly higher than that in other groups. The results of transwell experiment showed that the number of migrating and invasive cells of TPC-1 cells at the concentration of 1000 ng/L was higher than that at the concentrations of 0 ng/L, 100 ng/L, 500 ng/L and 2000 ng/L. The results of B-CPAP group were the same as those of TPC-1 groups. There were differences among the above experimental groups (p < 0.05) (Figures 15 to 17). Effects of different concentrations of CXCL12 on migration and invasion of TPC-1. Effects of different concentrations of CXCL12 on migration and invasion of B-CPAP.The results of Transwell experiment showd that the number of migrating and invasive cells of TPC-1 and B-CPAP increased with increasing CXCL12 concentration in the range of 100 ng/L to 1000 ng/L. At the concentration of 2000 ng/L, the number of cells migrating and invading was less than that at 1000 ng/L. 1000 ng/L was the optimal concentration. Comparison of the number of migrating cells between TPC-1 and B-CPAP. The number of migrating and invading cells was the largest at a concentration of 1000 ng/L, which was statistically significant compared with that at the concentration of 2000 ng/L. *p < 0.05, **p < 0.01, ***p < 0.001.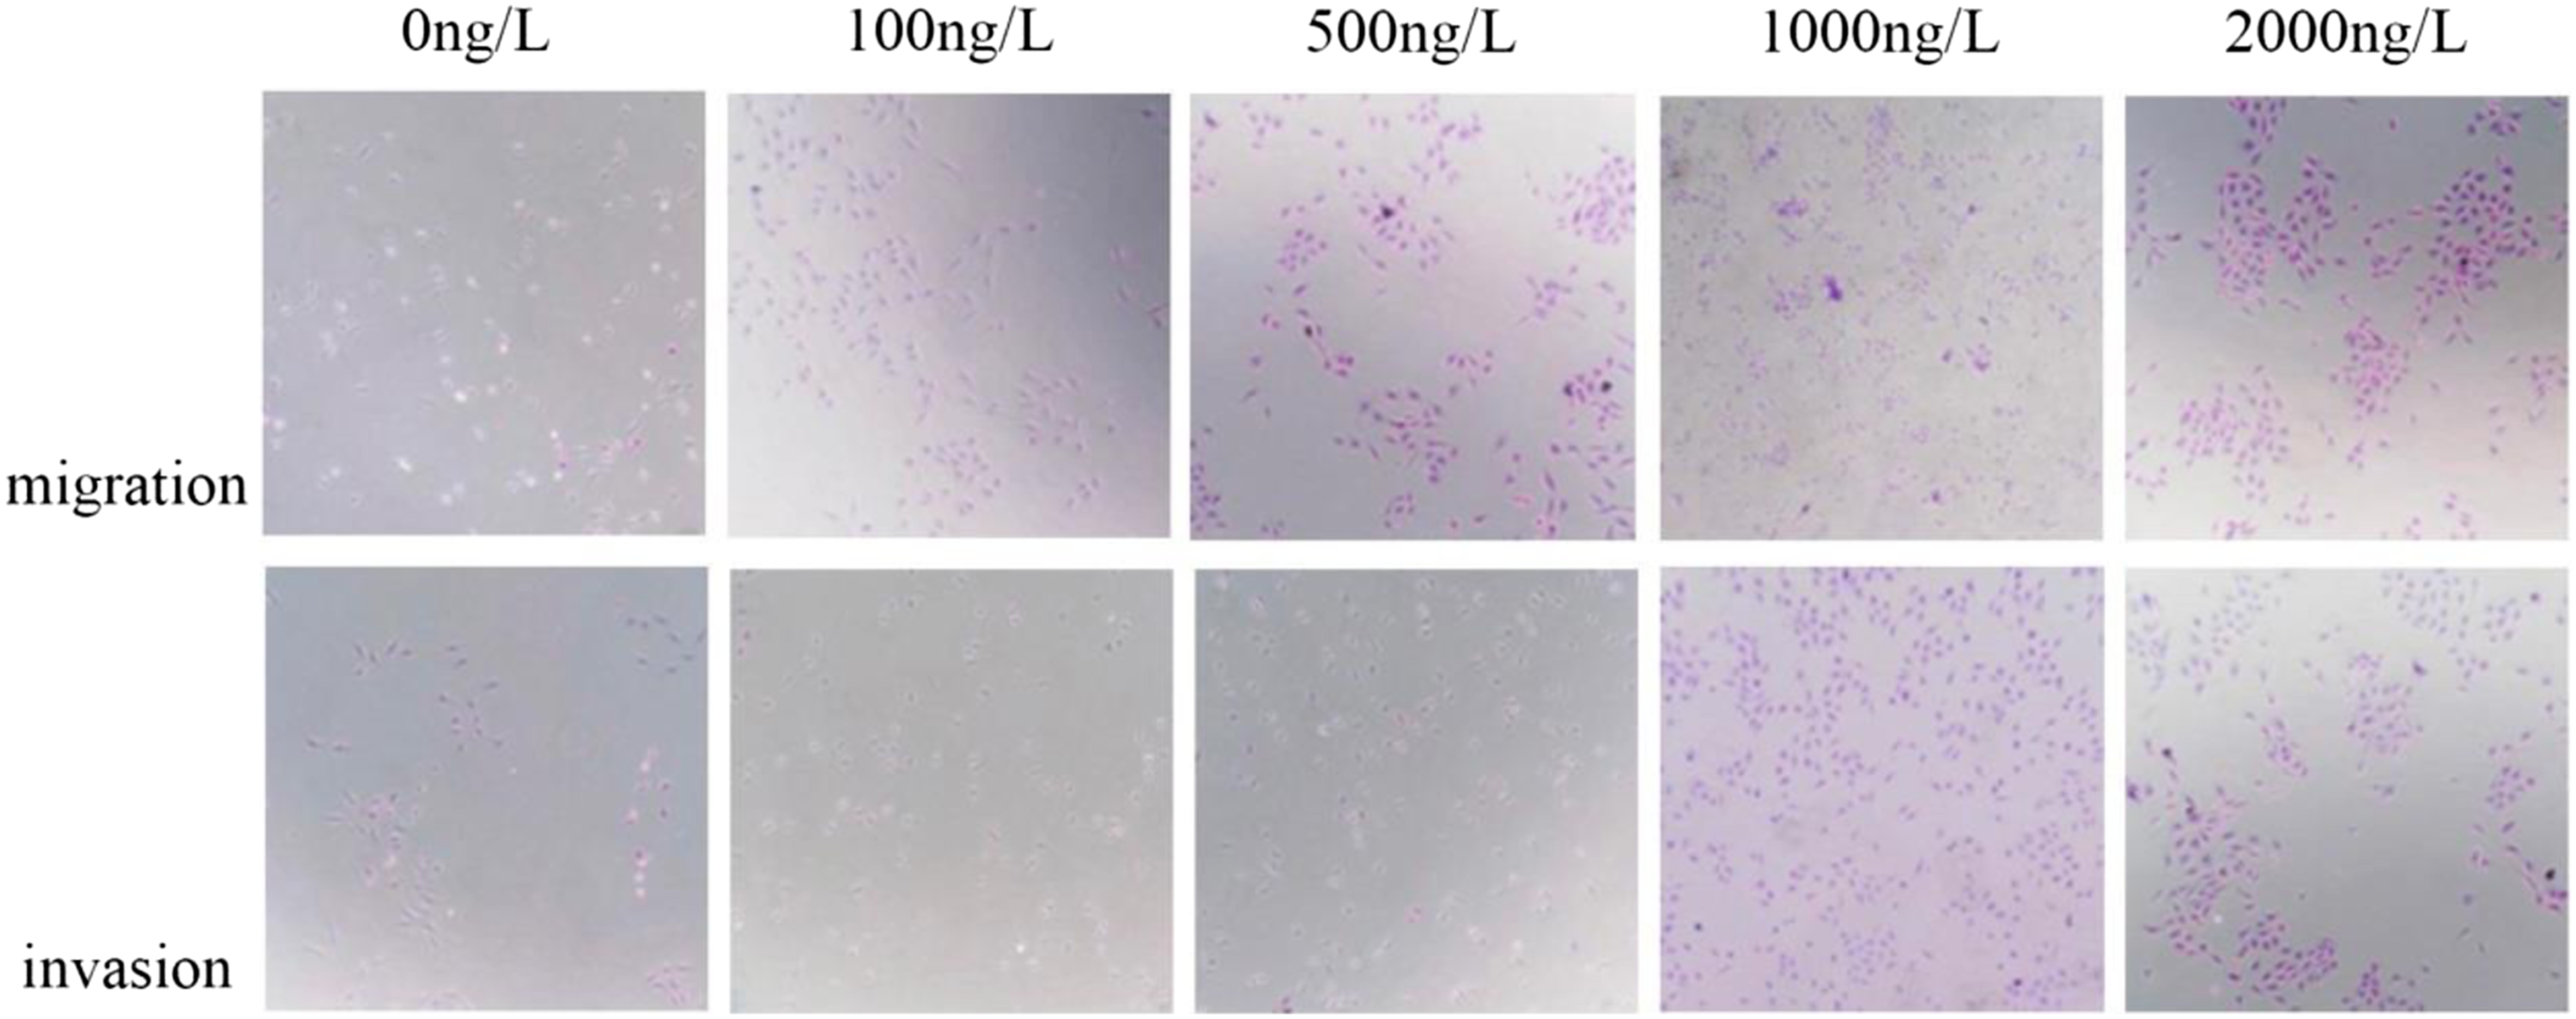

UA promoted the proliferation of TPC-1 and B-CPAP cells
Different concentrations (2, 5, 10, 15, 20, 80, 100 ng/mL) of UA solution were added to TPC-1 and B-CPAP cell CM. IC50 was calculated by CCK8 method, and the maximum drug concentration without effect on cell activity was selected for subsequent experiments. UA inhibited the cell activity to a certain extent in the concentration range of 1–5 ng/mL. When the concentration was above 10 ng/mL, the cells showed obvious apoptosis. The half effective inhibitory concentrations (IC50(24h)) of UA on TPC-1 and B-CPAP were TPC-1 IC50=5.991 ng/mL and B-CPAP IC50=3.925 ng/mL, respectively. 2 ng/mL was the maximum drug concentration that had no effect on the activities of NFs and CAFs (Figure 18). CCK8 and flow cytometry showed that UA reduced the proportion of TPC-1 and B-CPAP proliferating cells. Before UA stimulation, the percentage of proliferating cells was 21.9% and 29.5%, respectively. After UA stimulation, the percentage of proliferating cells was 11.4% and 18.5%, respectively (p < 0.05) (Figures 18 and 19). Comparison of inhibitory effects of different concentrations of UA on the proliferation of TPC-1 and B-CPAP cells. At the same time, the OD values of TPC-1 and B-CPAP cells decreased with the increase of UA concentration. The OD value was close to 0 at the concentration of 10 ng/mL and 15 ng/mL UA. The OD values of the two cells decreased gradually at the concentration of 0–5 ng/mL. The IC50 (24h) of TPC-1 and B-CPAP groups were 5.991 ng/mL and 3.925 ng/mL, respectively. UA: Ursolic acid. *p < 0.05, **p < 0.01, ***p < 0.001. Inhibitory effect of UA on the proliferation of TPC-1 and B-CPAP. The percentage of proliferating cells decreased when stimulated by UA (2 ng/mL), indicating that UA could inhibit the proliferation of thyroid cancer cells. UA: Ursolic acid. *p < 0.05, **p < 0.01, ***p < 0.001.

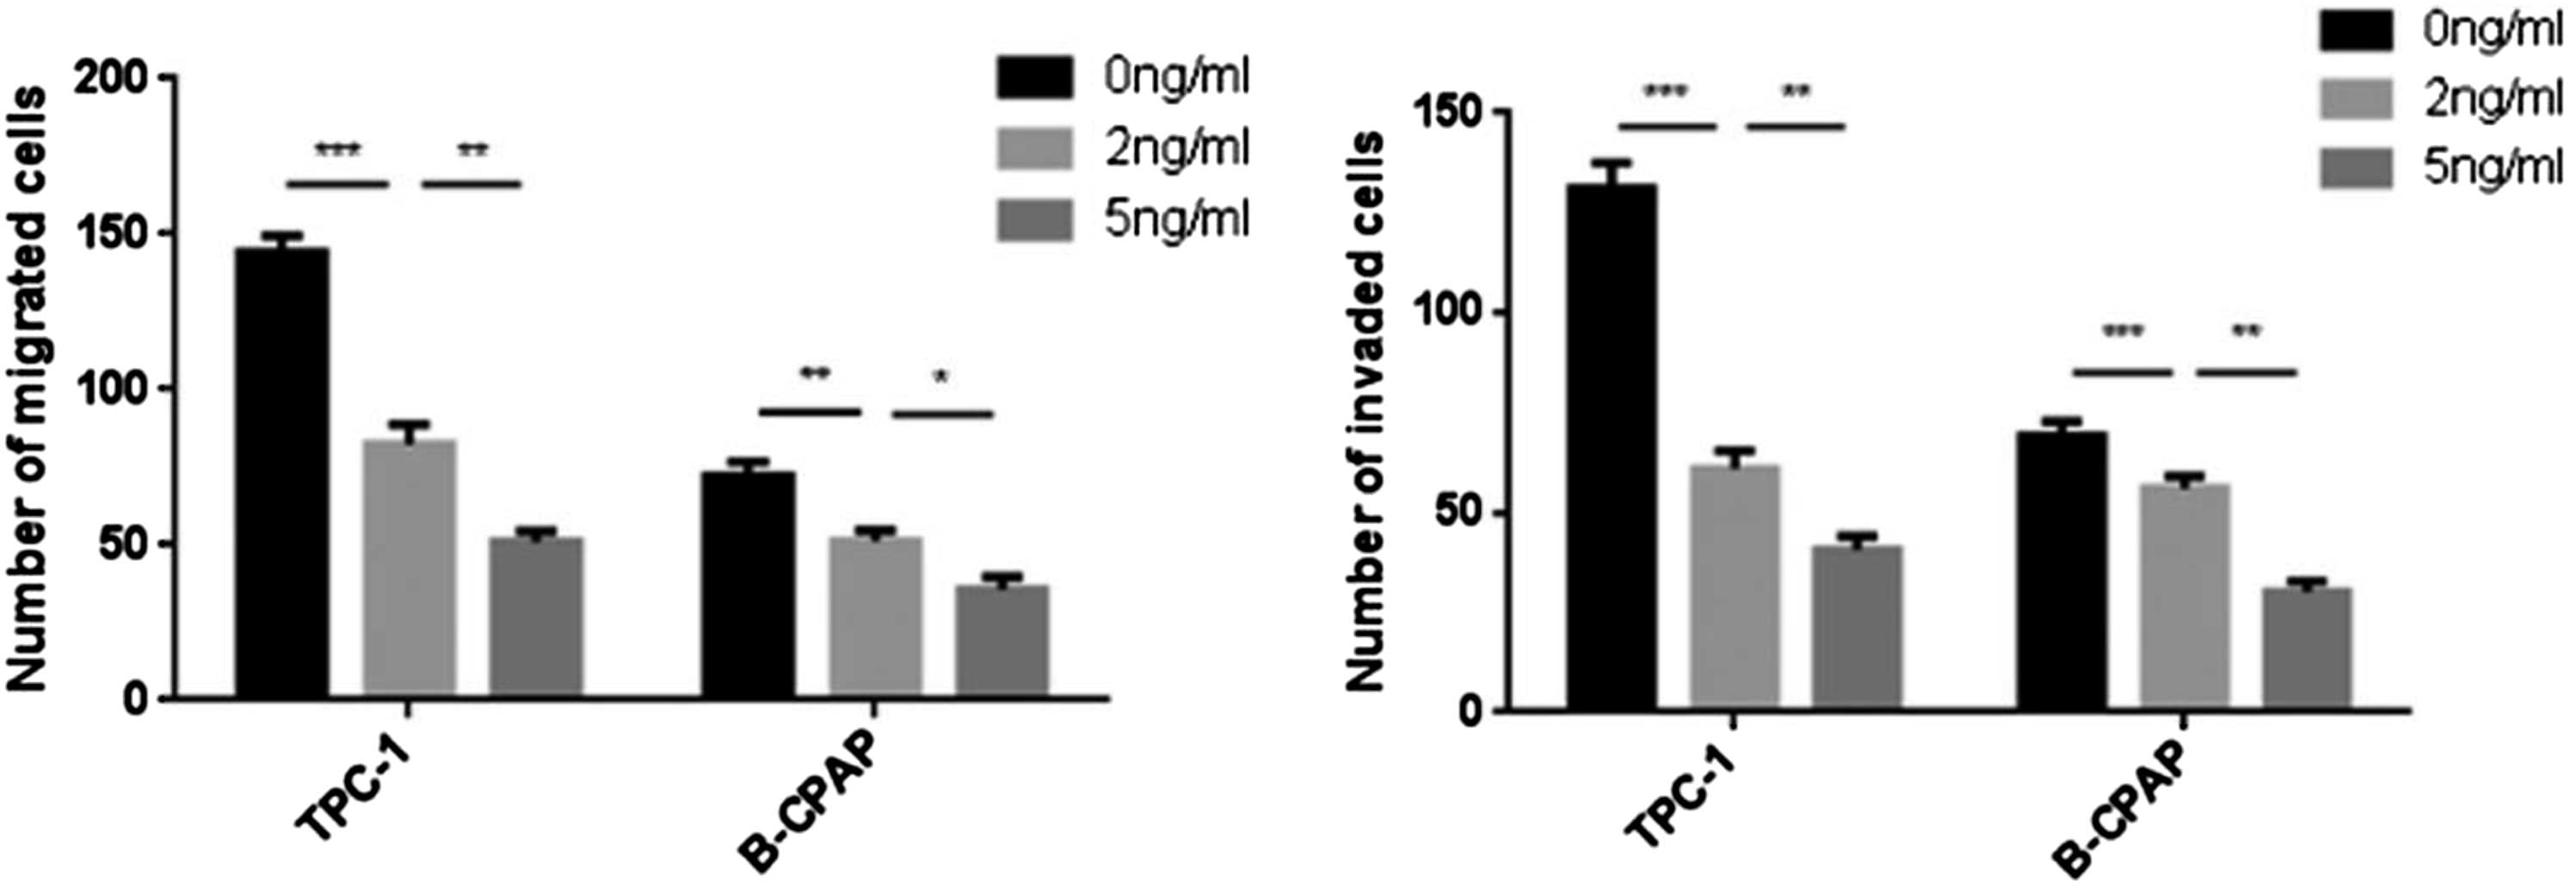
UA decreased the migration and invasion ability of TPC-1 and B-CPAP cells
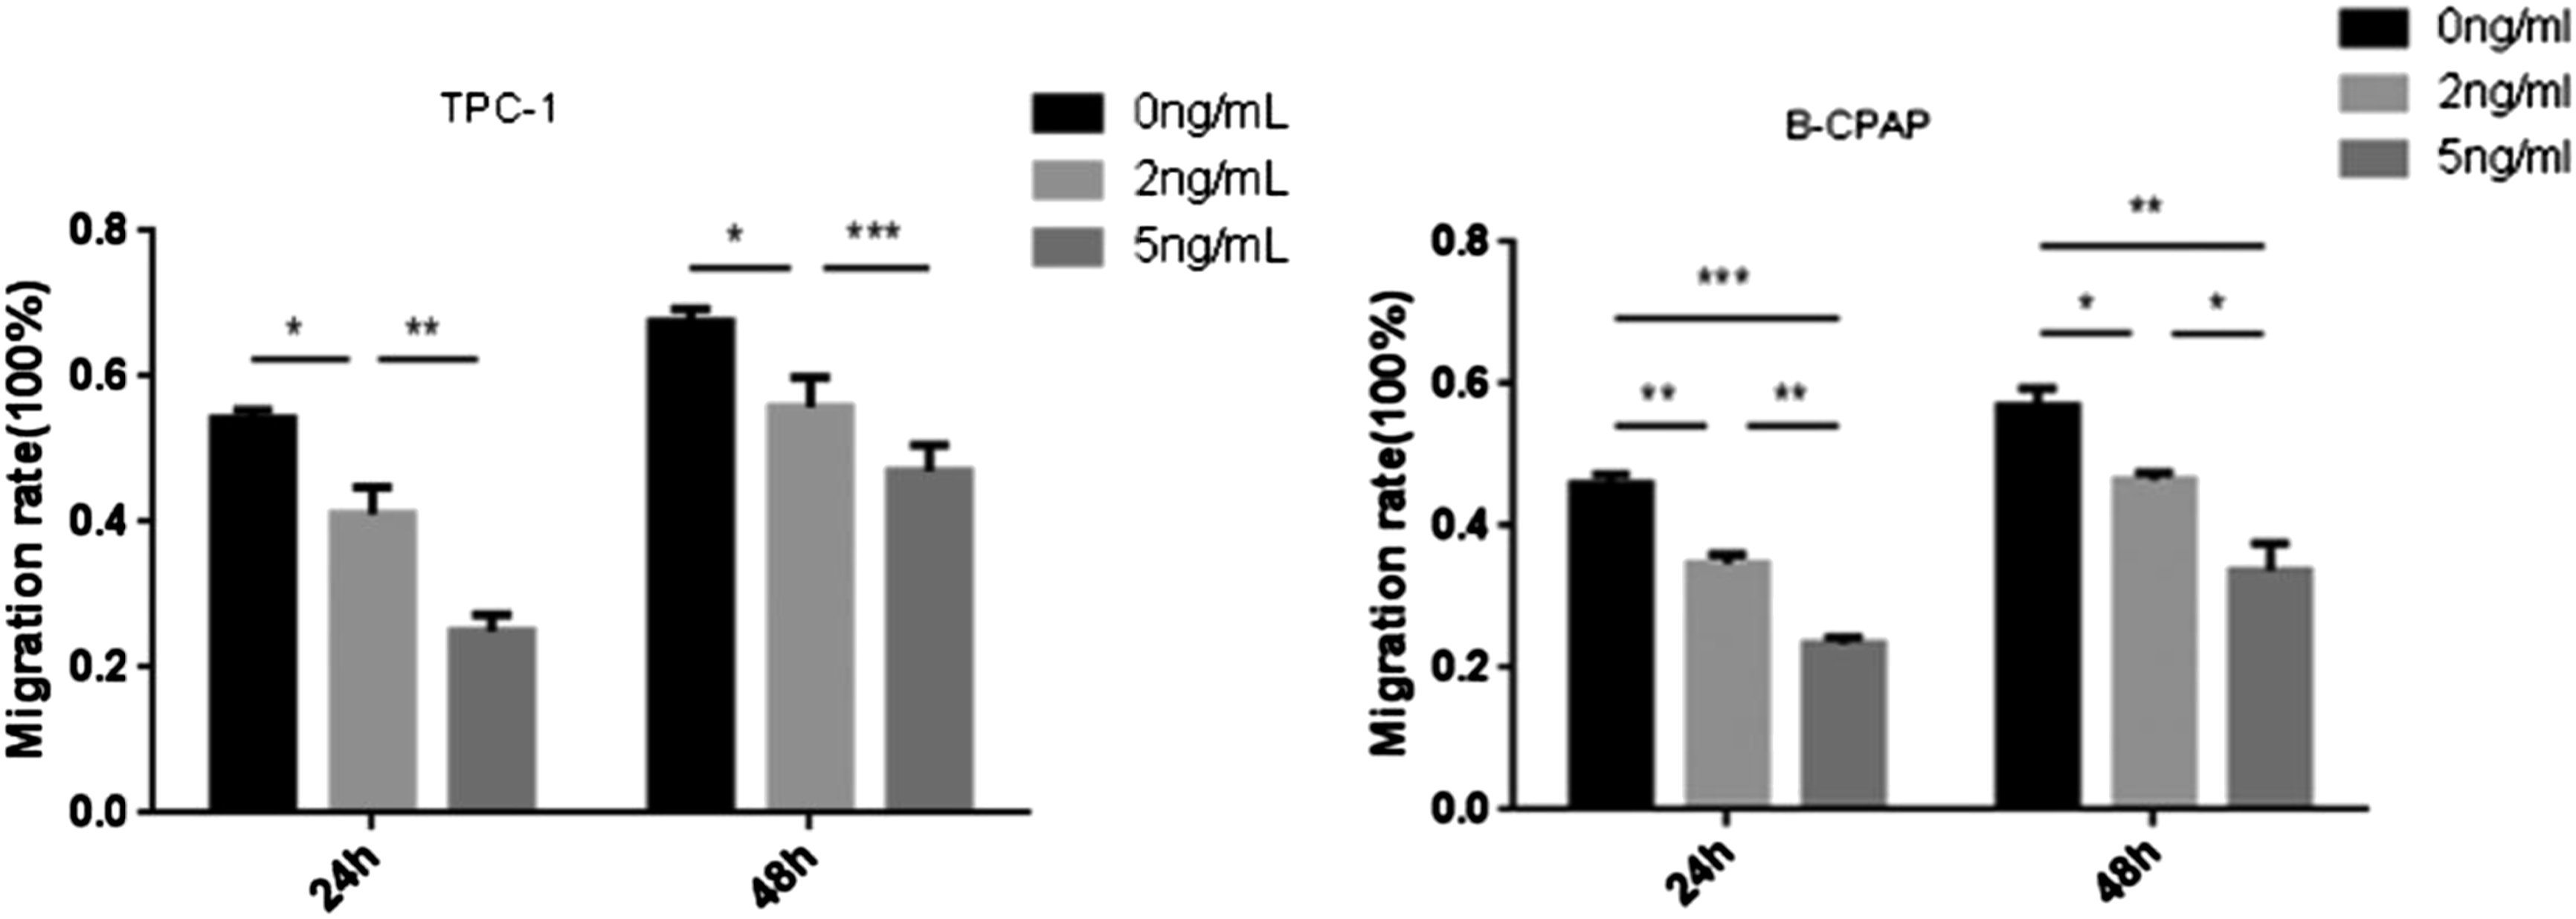
The migration and invasion ability of cells in the two groups decreased along with the UA concentration enhancing. At 24 h, the migration rates of TPC-1 cells at 0 ng/mL, 2n/mL and 5 ng/mL were 0.54 ± 0.01, 0.41 ± 0.04 and 0.25 ± 0.02, respectively. At 48 h, the mobility was 0.67 ± 0.02, 0.56 ± 0.04 and 0.47 ± 0.04, respectively. The migration rates of B-CPAP cells at 24 h were 0.46 ± 0.01, 0.35 ± 0.01 and 0.23 ± 0.01. The migration rates at 48 h were 0.57 ± 0.03, 0.47 ± 0.01 and 0.34 ± 0.04, respectively (p < 0.05) (Figures 20 to 22). Transwell experiment showed that the number of TPC-1 cells migrating at 0 ng/mL, 2 ng/mL and 5 ng/mL were 144.00 ± 5.57, 82.67 ± 6.11 and 51.00 ± 3.60, respectively, and the number of B-CPAP cells was 72.33 ± 4.51, 51.33 ± 3.51 and 35.67 ± 4.04 (p < 0.05). The number of invasive cells of TPC-1 at 0 ng/mL, 2 ng/mL and 5 ng/mL were 131.00 ± 6.56, 61.00 ± 4.58 and 40.67 ± 3.51, respectively, and the number of B-CPAP cells were 69.33 ± 3.51, 56.00 ±3 .00 and 30.33 ± 2.52 (p < 0.05) (Figures 23 to 25). Effects of different concentrations of ursolic acid on the migration ability of TPC-1. Effects of different concentrations of UA on migration ability of B-CPAP. The scratch healing experiment showed that the migration ability of TPC-1 and B-CPAP cells decreased with the increase of UA concentration in the range of 0 ng/mL–5 ng/mL. UA: Ursolic acid. Comparison of TPC-1 and B-CPAP cell migration under different concentrations of UA Effects of different concentrations of ursolic acid on the migration and invasion of TPC-1. Effects of different concentrations of UA on migration and invasion of B-CPAP. The number of migration and invasion cells of TPC-1 and B-CPAP cells decreased with the increasing UA concentration in the range of 0 ng/mL–5 ng/mL. UA: Ursolic acid. *p < 0.05, **p < 0.01, ***p < 0.001. Effects of different concentrations of ursolic acid on the migration and invasion of TPC-1 and B-CPAP. The number of migration and invasion cells of TPC-1 and B-CPAP decreased along with the UA concentration enhancing in the range of 0 ng/mL–5 ng/mL, and the difference between adjacent groups was statistically significant. *p < 0.05, **p < 0.01, ***p < 0.001.


UA decreased CXCR4 and CXCR7 protein expression in TPC-1 and B-CPAP cells
After addition of UA, the mRNA expressions of CXCR4 and CXCR7 decreased in TPC-1 and B-CPAP cells. Before and after addition of UA, the expression of CXCR4 mRNA in TPC-1 was 1:0.30 ± 0.05, and CXCR7 mRNA was 1:0.30 ± 0.12. Similarly, the expression of CXCR4 mRNA was 1:0.24 ± 0.13, and CXCR7 mRNA was 1:0.41±0.06 in B-CPAP (p < 0.05) (Figure 26). Effect of UA on the content of CXCR4/CXCR7 protein in TPC-1 and B-CPAP. The expression levels of CXCR4 and CXCR7 mRNA and protein decreased in both groups after addition of UA (2 ng/mL) to TPC-1 and B-CPAP cells supernatant. The difference was statistically significant before and after intervention (p < 0.05). UA: Ursolic acid. *p < 0.05, **p < 0.01, ***p < 0.001.
Biological effects of CAFs derived CXCL12 on TPC-1 and B-CPAP cells
The proliferation ability of TC cells in different CM was different
The percentage of proliferating TPC-1 cells in NFs CM environment was 24.7%, 30.1% in CAFs CM group, 12.6% in NFs (UA) CM group, and 11.0% in CAFs (UA) CM group. The percentage of proliferating B-CPAP cells showed the similar trend, and the rates were 30.4%, 35.1%, 30.0%, 18.6%, respectively. There was no significant difference in proliferation between NFs CM group and CAFs CM group (p > 0.05). Compared with CAFs CM group, the proliferation of TPC-1 and B-CPAP cells decreased in CAFs (UA) CM group (p < 0.05) (Figure 27). The results of CCK8 showed that the difference of OD value between them gradually became obvious over time, and the effect was the most significant on the third day (Figure 28). UA may affect the secretion of chemokine CXCL12 by CAFs. The content of CXCL12 in CAFs CM decreased. The proliferation ability of TC cells cultured with CAFs CM treated with UA was lower than that in CAFs CM group not stimulated by UA. Comparison of cell proliferation among the four groups. When TPC-1 and B-CPAP cells were cultured in different media, the percentage of proliferating cells was different. The proliferation of TC cells cultured in ursolic acid-treated supernatants was inhibited. *p < 0.05, **p < 0.01, ***p < 0.001. Comparison of cell proliferation among the four groups. The OD values of TPC-1 and B-CPAP cells were different after addition of different CM, and the difference was the most significant on the third day. The OD value of NFs (UA) CM group was lower than that of NFs group (p< 0.05). The OD value of CAFs (UA) CM group was lower than that of CAFs group (p < 0.05). NF: normal fibroblasts; CAF: cancer-associated fibroblasts; UA: Ursolic acid; CM: culture medium. *p < 0.05, **p < 0.01, ***p < 0.001.

The migration and invasion of TC cells were different in different CM
The scratch healing was most obvious in CAFs CM group. CAFs CM promoted the migration of TPC-1 and B-CPAP cells. The migration rates of TPC-1 cells were 0.49 ± 0.01 in NFs CM group, 0.45 ± 0.03 in NFs (UA) CM group, 0.88 ± 0.01 in CAFs CM group and 0.40±0.02 in CAFs (UA) CM group. There was significant difference between CAFs CM group and CAFs (UA) CM group (p < 0.001). At 48 h, the mobility rates of the four groups were 0.66±0.02, 0.61±0.02, 1.00 ± 0.00 and 0.54 ± 0.03 respectively. There was significant difference between CAFs CM group and CAFs (UA) CM group (p < 0.001) (Figure 29). The migration rates of B-CPAP cells in the four groups were 0.47 ± 0.01, 0.32 + 0.03, 0.52 ± 0.04 and 0.33 ± 0.01, respectively. There was significant difference between CAFs CM group and CAFs (UA) CM group (p < 0.01). At 48 h, the mobility of NFs CM group was 0.56 ± 0.02, 0.40 ± 0.04 in NFs (UA) CM group, CAFs CM group was 0.64 ± 0.03, CAFs (UA) CM group was 0.40 ± 0.01, and there was significant difference between NFs and NFs (UA) CM group, CAFs CM and CAFs (UA) CM group (p < 0.01) (Figures 30 and 31). Comparison of TPC-1 cell migration ability among four groups. Comparison of migration ability of B-CPAP cells in four groups. The results of scratch healing showed that CAFs CM group had the strongest migration ability among the four groups of cells. CAFs (UA) CM group had the weakest migration ability. CAF: cancer-associated fibroblasts; UA: Ursolic acid; CM: culture medium. Comparison of migration rates of TPC-1 and B-CPAP in each group. The results of mobility calculation showed that there was no exact difference in the mobility of TPC-1 and B-CPAP cells between NFs CM and NFs (UA) CM groups at 24 h, and the mobility of CAFs CM group was higher than that of CAFs (UA) CM group (p< 0.05). At 48h, the migration rate of TPC-1 and B-CPAP cells in NFs CM group was higher than that in NFs (UA) CM group (p < 0.05). The migration rate in CAFs CM group was higher than that in CAFs (UA) CM group (p < 0.01). NF: normal fibroblasts; CAF: cancer-associated fibroblasts; UA: Ursolic acid; CM: culture medium. *p < 0.05, **p < 0.01, ***p < 0.001.


Transwell results showed that the number of TPC-1 migrating cells under NFs CM was 110.67 ± 8.02, 68.33 ± 4.16 in NFs (UA) CM group, 223.00 ± 9.00 in CAFs CM group and 61.00 ± 11.00 in CAFs (UA) CM group. There were significant differences between NFs CM group and NFs (UA) CM group, CAFs CM group and CAFs (UA) CM group (p < 0.05). The number of migrating cells in B-CPAP were 113.67 ± 7.64, 85.33 ± 7.02, 196.67 ± 10.02 and 72.33 ± 4.73, respectively. The number of TPC-1 invasive cells under NFs CM were 80.00±6.00, 50.67+7.57 in NFs+UA CM group, 170.33 ± 5.50 in CAFs CM group and 45.00 ± 4.00 in CAFs (UA) CM group. There were significant differences between NFs CM group and NFs (UA) CM group, CAFs CM group and CAFs (UA) CM group (p < 0.05). The number of invasive cells in the four groups of B-CPAP were 81.00 ± 5.57, 60.66 ± 5.03, 100.33 ± 7.09 and 69.67 ± 8.50, respectively. The difference was the same as that of TPC-1 cells (Figures 32 to 34). Difference of migration and invasion ability of TPC-1 in four groups. Difference of migration and invasion ability of B-CPAP in four groups. Difference in the number of migration and invasion cells between TPC-1 and B-CPAP cells. The results showed that the number of migrating and invading cancer cells in NFs CM group was higher than that in NFs (UA) CM group, and the number of migrating and invading cells in CAFs CM group was higher than that in CAFs (UA) CM group. NF: normal fibroblasts; CAF: cancer-associated fibroblasts; UA: Ursolic acid; CM: culture medium. *p < 0.05, **p < 0.01, ***p < 0.001.


The expression levels of CXCR4 and CXCR7 were different in cancer cells in different CM
The results showed that the relative expression of CXCR4 mRNA in NFs CM group, CAFs CM group, NFs (UA) CM group and CAFs (UA) CM group was 1:2.85±0.60:1.04±0.25:0.45±0.08 respectively. The relative expression of CXCR4 mRNA in CAFs CM group was higher than that in NFs group (p<0.05), CAFs CM group was higher than that in CAFs (UA) CM group (p < 0.05). There was no significant difference between NFs CM group and NFs (UA) CM group. The relative expression of CXCR7 mRNA in CAFs CM group was higher than that in NFs group (p < 0.05), NFs CM group was lower than that in NFs (UA) CM group (p < 0.001), and CAFs CM group was higher than that in CAFs (UA) CM group (p < 0.01). The relative expression of B-CPAP CXCR4 mRNA in CAFs CM group was higher than that in NFs group (p<0.05), CAFs CM group was higher than that in CAFs (UA) CM group (p < 0.01), and NFs CM group was higher than that in NFs (UA) CM group (p<0.01). The relative expression of CXCR7 mRNA in CAFs CM group was higher than that in NFs group (p < 0.05), CAFs CM group was higher than that in CAFs (UA) CM group (p < 0.01), and NFs CM group was higher than that in NFs (UA) CM group (p < 0.01). The results of Western-blot was the same as that of RT-PCR. It shows that the cytokine CXCL12 in CAFs CM can affect the biological behavior of cancer cells, and UA inhibits the secretion of CXCL12 in CAFs, so as to play an indirect anticancer role (Figure 35). Comparison of CXCR4 and CXCR7 expression levels in cancer cells among four groups. The expression levels of CXCR4 and CXCR7 mRNA and protein were different between TPC-1 and B-CPAP when cultured with different CM. The mRNA and protein expression levels of CXCR4 and CXCR7 decreased in cancer cells cultured with cancer-associated fibroblasts CM treated by UA. But the effect of UA on the expression of CXCR4 and CXCR7 by interfering with the secretion of CXCL12 in normal fibroblasts is not clear. UA: Ursolic acid; CM: culture medium. *p < 0.05, **p < 0.01, ***p < 0.001.
Taken together, our findings provide important insights into the capacities of UA through affecting the secretion of CXCL12 by CAFs in the phase of chemokine system. These studies, together with its low cost and the excellent safety record of UA, pave the way for clinical applications in PTCs, for which there is currently no effective therapy except surgery.
Discussion
In the malignant progression of tumors, CAFs are the main participants in tumor fibrosis and collagen metabolism disorder. CAFs represent a heterogeneous population of fibroblasts that are recruited and activated to accelerate tumor progression in many different solid tumors. CAFs phenotype is characterized by morphological changes of fibroblasts and increased expression of specific markers, such as α-SMA, Vimentin, Fibronectin, FSP-1 and FAP-α, in which the most representative ones are FAP-α, α-SMA and Vimentin.9,10 Disseminated CAFs may promote the formation of initial metastasis and subsequent regeneration in distal tissues and organs. CAFs cells affect the progress of tumor in many ways, which is closely related to its occurrence, development, proliferation, metastasis, drug resistance and poor prognosis.
CAFs are the major producers of ECM components and secrete various other secreted factors in a paracrine dependent manner, including growth factors, cytokines and chemokines, which promote extracellular matrix remodeling, angiogenesis and tumor cell growth, so as to participate in tumor cell invasion, metastasis and chemoresistance. Stromal cell-derived factor-1 (SDF-1, CXCL12) secreted by CAFs is one of six new PTC clinically relevant central genes filtered from integrated database. 11 CXCR4/CXCR7 are G-protein coupled receptors that selectively binds to CXCL12 and drives EMT while up-regulating the expression of cytokines and chemokine receptors. 12 In the tumor immune microenvironment, the blocking of CXCR4 is related to antitumor immunity, which indicates that CXCL12/CXCR4 axis is a therapeutic target for targeted intervention in the immune system. 13 The formation of CXCR4/CXCR7 heterodimer has an effect on the chemotaxis of CXCL12. By binding CXCL12, they can activate multiple signal transduction pathways such as ERK1/2, p38, SAPK/JNK, Akt, mTOR and BTK. Many CXCR4 antagonists are being clinically studies to provide practical evidence and find new strategies for treatment. 14 The expression of CXCR4 in PTC was significantly higher than that in normal tissues and benign thyroid nodules. 15 Knocking out CXCR7 in PTC cells inhibited cell proliferation and invasion, induced S-phase arrest and promoted apoptosis. 16
Current thyroid carcinoma treatment is mainly operation, suppression of TSH and radioactive iodine therapy. Continued screening of novel small molecule compounds is clearly an unmet need. In China, Prunella vulgaris is the most frequently used traditional medicinal plants for the treatment of TC in traditional medicine. P. vulgaris belongs to the genus Prunella in Labiatae. It was first recorded in Shennong Herbal Classic. Three components including UA, quercetin and rutin are the main substance of P. vulgaris to produce the medical efficacy. Modern pharmacological studies show that P. vulgaris extract has the effects of anti-tumor, antihypertensive, hypoglycemic, antibacterial, antioxidant, immune regulation, liver protection and so on. Triterpenic acids in P. vulgaris include UA, oleanolic acid (OA) and maslinic acid, which has long been shown to have anti-vascular proliferation. Among them, the content of OA and UA are the highest. Triterpenic Acids are potent antiangiogenic agents to retard invasion and migration in liver cancer cells. 17 The proliferation of bovine aortic endothelial cell was inhibited by UA and OA effectively in a concentration-dependent manner. 18 In addition, quercetin is one of the effective components in P. vulgaris. Research showed that the treatment with quercetin induced the binding of a protein complex to an oligonucleotide containing the AP-1 consensus binding site. 19
Nano-system has a vast prospect in the new drug-delivery system. Guang Yang et al. encapsulated UA in liposomes modified with folate conjugates, which has better bioavailability and solubility. 20 One study showed that UA forms a stable high drug-loading nanocomposite with PTX through hydrogen bonding and hydrophobic interaction. 21 A new carrier-free small molecule nanodrug delivery system was formed by hydrophobic ursolic acid, paclitaxel (PTX), and amphipathic indocyanine green (ICG), which improve water solubility of UA and PTX. 22 However, the unclear internal metabolism of most nanocarriers and potential toxicity were still a major obstacle for the clinical application.
Preliminary results demonstrated that UA is safe and has beneficial therapeutic effects in select patients. Various studies have shown that UA exhibits growth inhibition properties against various human cancers cell lines. One study showed that UA inhibited DNA binding of NF-κB consisting of p65 and p50. The antitumorigenic and chemosensitizing effects that mediated by UA may relate to inhibition of IκBα kinase and p65 phosphorylation, which leads to the suppression of NF-κB activation induced by various carcinogens. 23 The inhibition of proliferation of different colon cancer cell lines was correlated with reduction of constitutive NF-kB activation and downregulation of cell metastatic (MMP-9, VEGF, and ICAM-1) , proliferative (cyclin D1) and survival (Bcl-xL, Bcl-2, cFLIP, and survivin) proteins, and this effect was enhanced with capecitabine. 24 UA inhibited PMA-mediated activation of p38 mitogen-activated protein kinases protein kinase C, c-Jun N-terminal kinase and extracellular signal-regulated kinase 1/2. 25 The treatment with UA induced the death of R-HepG2 cells, which was found to be mainly through the caspase-independent apoptosis-inducing factor (AIF) signaling pathway. UA treatment caused the nuclear translocation of AIF retained in the mitochondria in untreated R-HepG2 cells. 26 Codrug UA-Met significantly inhibited the migration (∼52.4 ± 1.57%) and invasion (∼55.3 ± 2.74%) of breast cancer MCF-7 and MDA-MB-231 cells in vitro at low concentration of 10 μM 27
UA-liposomes could effectively modulate CD4+ CD25+ Foxp3+ T cells from breast cancer cells 4T1 tumor bearing mouse by inhibiting IL-10 secretion and STAT5 phosphorylation. In vivo, administration of UA-liposomes at 10 mg/kg dose led to reduced numbers of regulatory T cells (Tregs) and myeloid derived suppressor cells (MDSCs) residing in tumor tissues, which signified the correction of the tumor mediated immune-suppressive microenvironment. 28 However, there are few studies on the effects of UA on PTC cells or stromal cells of PTC.
Using multiple in vivo strategies, in the present study we demonstrate that UA, an anti-inflammatory natural triterpenoid, directly inhibit the proliferation, migration and invasion of PTC cells. Importantly, analysis of these cell experiments has shown that this compound inhibited CAFs and affected chemokine system, giving UA the great advantage of being able to exert effects on PTC cells. In addition to the indirect mechanisms through CAFs, we provide compelling evidence indicating that UA directly reduced CXCR4, CXCR7 and CXCL12 expression levels. Together, our findings demonstrate that UA has significant potential as anticancer drug, especially through CAFs, an indirect anticancer pathway. The research offered effective intervention strategies for clinical PTC treatment, and provide new ideas for the research and development of phytochemicals in the future. The molecular mechanism of UA-induced down-regulation of CXCR4 and CXCR7 molecules is still unclear. These mechanisms are not completely understood and continue to be a topic of active investigation.
Footnotes
Acknowledgements
We are indebted with laboratory director Yuan Cao in whose laboratory the main experiments were performed. We also thank Chen Wang for technical assistance, and the staff of the experimental center for their technical support.
Declaration of conflicting interests
The author(s) declared no potential conflicts of interest with respect to the research, authorship, and/or publication of this article.
Funding
The author(s) disclosed receipt of the following financial support for the research, authorship, and/or publication of this article: This study is supported by Natural Science Foundation of Shandong Province (Grant ZR2021MH328) and President Funding of Jinan Military General Hospital of PLA (Grant 2018ZX01).