
Abstract
Introduction
With the growing economy, China has been facing a severe challenge of dealing with air pollutants in recent years. Dust, fossil fuel combustion, transportation, biomass burning, industrial emission, secondary inorganic aerosol, and secondary organic aerosol are the main categories of fine particulate matter (PM2.5) identified in China. 1 Many epidemiological studies have shown that PM2.5 exposure can increase the incidence and mortality of disease in respiratory, cardiovascular, and nervous systems and non-alcoholic fatty liver.2–4 Its toxicological mechanism mainly involves oxidative stress and inflammation. 5 Recent studies have shown that short-term PM2.5 exposure is associated with an increased risk of hospitalization for digestive system diseases, genitourinary system diseases, skin symptoms, and diabetes. 6 However, our understandings of these important associations are still inadequate. The study of PM2.5 systemic toxicity should arouse more attention.
Lipopolysaccharide (LPS), called endotoxin, is the lysing component of cell walls in Gram-negative bacteria. As many Gram-negative bacteria are found distributed on the surface of animals and plants or in the soil, LPS is often present in farms that raise livestock and dust from agricultural production activities and indoor humid air environments. Of note, LPS has been found in atmospheric PM2.5. 7 LPS is the pathogenic factor that seriously threatens human health. Epidemiological population studies have shown that endotoxin of indoor dust is related to asthma and wheezing in children and adults, reducing the lung function of asthma patients.8,9 Animal studies have shown that LPS can cause damage to various organs (heart, lung, liver, kidney, and brain) in mice.10,11 At present, the inflammatory regulation mechanism of lung injury caused by LPS has been well studied. 12 Toxicological studies have shown that LPS regulates the Toll-like receptor’s (TLR4) pathway when it enters the body, 13 and induces the innate immune system through mitogen-activated protein kinase and nuclear factor-κB (NF-κB). As a result, it increases the production of inflammatory mediators and factors,14,15 leading to inflammatory damage to lung tissue. It still needs further study to explore the damaging effect of LPS on multiple tissues.
As we know, the stomach and intestine belong to the digestive system, and the spleen and kidney belong to the immune system and urinary system, respectively. Epidemiological studies have found that PM2.5 exposure is related to gastric cancer and chronic kidney disease.16,17 Toxicological studies have shown that PM2.5 can damage the kidney, spleen, and intestine,18–20 while LPS can damage the spleen, stomach, intestine, and kidney.21–24 As PM2.5 and LPS coexist in the atmospheric environment, their combined toxic effects on other tissues (such as stomach, spleen, intestine, and kidney) beyond the lung should attract our attention. To our knowledge, the studies on the combined effect of PM2.5 and LPS on the toxicological responses of the above four organs are still lacking.
Linfen, Shanxi province, is a typical resource-based city in North China that focuses on coal energy. Six cities, including Linfen, were listed in the most severe PM2.5 and PM10 pollution areas and the first batch of cities with total coal consumption control issued by Shanxi Provincial Department of Ecology and Environment in 2017. The special basin topography and temperature inversion of Linfen in winter make it difficult to diffuse air pollutants, easily causing severe atmospheric PM2.5 pollution. Given this, choosing Linfen city as the research site, we used a novel PM2.5 real-world inhalation exposure model closer to reality than the intratracheal instillation. We utilized an intraperitoneal LPS injection model to investigate the pathological and toxicological effects of PM2.5 plus LPS on multiple organs in mice. Organ damage studies of co-exposure of PM2.5 plus LPS on the stomach, spleen, intestine, and kidney will provide an experimental basis for elucidating the systemic toxicity incurred by two common air pollutants (PM2.5 and LPS) in the environment.
Materials and methods
PM2.5 exposure and lipopolysaccharide injection protocol
This study used a real-world whole-body inhalation exposure system, called the individually ventilated cage (IVC) system (Junsheng Laboratory Animal Equipment Co., Ltd., Jiangsu, China), under the unique controlled condition. We installed three layers of high-efficiency particulate air (HEPA) filters in an aperture in the air filter control chambers to provide a barrier to PM (PM2.5 concentration in the cage was lower than the detection limit, 1 μg/m3). We applied an air supply system to allow ambient air into the clean-air chambers (with the HEPA filters) and PM2.5 exposure chambers (with the special filters). We imported air to the chambers through a plastic pipe, 3 m long and 9 cm diameter. Similar physical conditions were maintained in the chambers, keeping a relatively constant temperature (20–25°C) and humidity (40–60%).
Protocols of animal exposure to PM2.5 plus LPS.

Hematoxylin and eosin analysis of mouse tissues
The weight of each mouse was weighed and recorded after co-exposure. The stomach, spleen, intestine, and kidney were dissected, separated, weighed, and calculated the organ coefficient (%, organ weight/animal weight × 100%).
A small piece (3–4 cm2) of fresh tissue of four organs in different groups was cut and quickly fixed in 10% formalin solution for hematoxylin and eosin (HE) staining analysis. Under light microscopy, the tissue structure in the slice was observed and photographed with 200 × or 400 × magnification.
Measurement of determination of interleukin-6 (IL-6), tumor necrosis factor-α (TNF-α), glutathione (GSH), malondialdehyde (MDA), catalase (CAT), superoxide dismutase (SOD), and kidney injury molecule 1 (KIM-1)
The four tissues of different groups were homogenized in 50 mM PBS (pH = 7.4, about 0.1 g tissue in 1 mL buffer) and centrifuged at 3000 rpm, at 4°C for 15 min. The supernatant was collected to measure four biomarkers, including IL-6 and TNF-α (Shanghai Xitang Biological Technology Co., Ltd., Shanghai, China), GSH, MDA, CAT, SOD (Nanjing Jiancheng Institute of Biological Engineering, Nanjing, China), and KIM-1 (Shanghai Jianglai Biotechnology Co., Ltd., Shanghai, China). The levels of IL-6, TNF-α, GSH, MDA, CAT, SOD and KIM-1 in different groups were detected using commercially available assay kits following the instruction.
Statistical analysis
The experimental data are expressed as mean ± standard deviation (SD). Statistical analyses were performed using one-way analysis of variance using the SPSS 22.0 package of programs for Windows. Post-hoc tests were conducted to determine the difference between groups, followed by Fisher’s least significant difference. p < 0.05 indicated a significant difference.
Results
Changes in body weight and organ coefficients of mice in different groups
Changes in body weight and organ coefficients in mice of different groups.
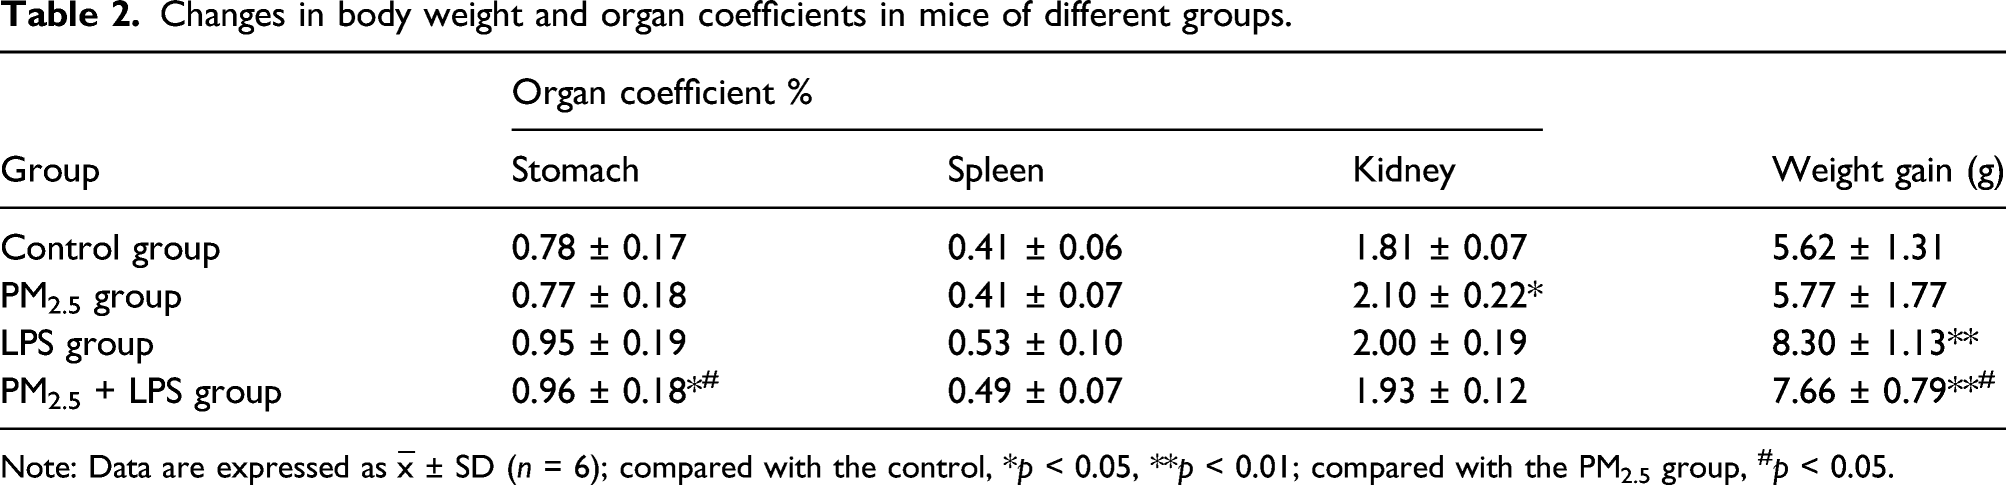
Note: Data are expressed as ‾x ± SD (n = 6); compared with the control, *p < 0.05, **p < 0.01; compared with the PM2.5 group, #p < 0.05.
PM2.5 and lipopolysaccharide caused pathological changes in mice
The HE staining results showed that the stomach structure in the control group was normal (Figure 1(A)). Compared with the control group, no inflammatory cell was found in the stomach in the other three experimental groups. However, in tissue morphology, the mucosal, submucosa, muscle, and serosal layer of the stomach in the PM2.5 group showed slight atrophy (Figure 1(B)). The atrophy is most severe in each layer of the stomach, with vacuoles in the mucosa and gaps between the mucosal layer and the muscular layer in the LPS group (Figure 1(C)). The atrophy of each layer of the stomach was the most serious, the cell arrangement was loose, and the space between the mucosal layer and the muscle layer was enlarged in the PM2.5 + LPS group (Figure 1(D)). Pathological changes of the stomach in different groups of mice ((A–D) are the control group, PM2.5 group, LPS group, and PM2.5 + LPS group; the red circles enclose the muscular layer, and the yellow circles enclose the mucosal layer) (200×).
The borders of the white pulp marginal area of the spleen in the control group were clear, uniform, and densely stained in blue, and the tissues were arranged in an orderly manner. The spleen globules were round or oval, scattered in the red pulp (Figure 2(A)). The red pulp and white pulp of the spleen in the PM2.5 group were not clearly demarcated, the number of lymphocytes in the white and red pulp areas was significantly reduced, the spleen glomeruli were deformed, the mass structure disappeared, and there were inflammatory cells (Figure 2(B)). The splenic glomeruli in the LPS group split into many small masses, with some infiltration of inflammatory cells (Figure 2(C)). The numbers of lymphocytes in the white and red pulp areas of the PM2.5 + LPS group significantly reduced. The mass structure of the spleen glomeruli disappeared, and the overall structure was scattered with inflammatory cells, accompanied by a large amount of congestion and local cavities (Figure 2(D)). Pathological changes of the spleen in different groups of mice ((A–D) are the control group, PM2.5 group, LPS group, and PM2.5 + LPS group; the red arrow points to the inflammatory cells, and the yellow arrow points to the hyperemia) (400×).
In the control group, the intestinal mucosa, submucosa, and muscle layer structures were clear, and there were no apparent abnormalities in each part (Figure 3(A)). The intestinal of the PM2.5 group had a slight infiltration of inflammatory cells, the mucosal layer became thinner, and the muscle layer was loosely arranged and damaged (Figure 3(B)). There were a few focal inflammatory cells in the LPS group, partial congestion of the intestinal mucosa, separation of the mucosal layer from the underlying cells, and gaps in the muscle layer cells (Figure 3(C)). In the PM2.5 + LPS group, a large number of focal inflammatory cells occurred, the mucosal layer almost disappeared, the submucosa became loose, the muscle layer lost viscosity and separated from each other, and the bottom muscle layer was damaged (Figure 3(D)). Pathological changes of the intestine in different groups of mice ((A–D) are the control group, PM2.5 group, LPS group, and PM2.5 + LPS group; the red arrow points to the inflammatory cells) (200×).
The kidney of the control group had no apparent abnormalities, and the curved tube epithelium was arranged in an orderly and tight manner (Figure 4(A)). In the PM2.5 group, there was a small degree of enlargement of the renal capsule space and renal interstitial inflammatory cells. Renal tubular regeneration cells were pleomorphic with a bit of bleeding (Figure 4(B)). In the LPS group, the space between the renal capsules became larger, the renal interstitial inflammatory cells were found, and the local hemorrhage was severe (Figure 4(C)). In the PM2.5 + LPS group, the phenomenon of the enlargement of the renal capsule space was the most serious, the renal capsule cortex became thinner, and renal interstitial inflammatory cells infiltrated, accompanied by massive hemorrhage and vacuoles (Figure 4(D)). Pathological changes of the kidney in different groups of mice ((A–D) are the control group, PM2.5 group, LPS group, and PM2.5 + LPS group; the red arrow points to the inflammatory cells, and the yellow arrow points to the hyperemia) (400×).
The effects of PM2.5 and lipopolysaccharide on the levels of IL-6 and TNF-α in various tissues of mice
Compared with the control group, the levels of IL-6 in the spleen of the other three groups had significantly increased (p < 0.05; p < 0.01) (Figure 5(a)), the level of IL-6 in the kidney of the PM2.5 + LPS group increased significantly (from (111.2 ± 26.3) pg/mg protein to (163.8 ± 45.9) pg/mg protein). However, there was no significant difference in the levels of IL-6 in the stomach and intestine of the three experimental groups. Of note, the level of IL-6 ((18.9 ± 4.5) pg/mg protein) in the spleen of the PM2.5 + LPS group was significantly increased compared with the LPS group. It can be seen from Figure 5(b) that compared with the control group, the TNF-α levels of the spleen and kidney in the PM2.5 + LPS group were increased significantly, and the levels in the intestine of the LPS group were raised markedly. The levels of IL-6 (a) and TNF-α (b) of mouse tissues in different groups (compared with the control, *p < 0.05, **p < 0.01; compared with the LPS group, ▲p < 0.05). Values were expressed as means ± SD.
The levels of IL-6 and TNF-α in the stomach and intestine in the three groups were not significant compared with the control, except that the TNF-α levels in the LPS group were significantly increased relative to the control group.
The effects of PM2.5 and lipopolysaccharide on the levels of GSH, MDA, catalase and superoxide dismutase in various tissues of mice
It can be seen from Figure 6(a) that compared with the control group, the GSH levels in the spleen (from (181.9 ± 31.8) pg/mg protein to (135.8 ± 21.3) pg/mg protein and kidney (from (120.5 ± 19.9) pg/mg protein to (101.8 ± 12.6) pg/mg protein of the PM2.5 + LPS group significantly decreased. There was no significant difference in GSH levels in other groups. As shown in Figure 6(b), compared with the control group, the MDA content in the spleen and kidney of the LPS group and the PM2.5 + LPS group increased significantly, and the content of MDA in the kidney of the PM2.5 group increased significantly (from (1.6 ± 0.4) nmol/mg protein to (2.8 ± 0.7) nmol/mg protein). Compared with the PM2.5 group, the spleen’s MDA content ((3.3 ± 0.8) nmol/mg protein) in the PM2.5 + LPS group increased significantly. As shown in Figure 6(c), compared with the control group, the CAT activities in the spleen (from (100.8 ± 25.1) U/mg protein to (145.7 ± 19.2) U/mg protein) and kidney (from (70.9 ± 14.8) U/mg protein to (107.2 ± 19.2) U/mg protein) of the PM2.5 + LPS group increased extremely significantly, while the activity of CAT in the kidney of the LPS group increased significantly (from (70.9 ± 14.8) U/mg protein to (94.2 ± 16.4) U/mg protein). Interestingly, compared with the PM2.5 group, the CAT levels of the spleen and kidney in the PM2.5 + LPS group increased significantly. Compared with the LPS group, the CAT levels of the spleen in the PM2.5 + LPS group increased significantly. As shown in Figure 6(d), compared with the control group, the SOD activities in the spleen ((97.6 ± 15.7) U/mg protein), intestine ((14.2 ± 3.0) U/mg protein), and kidney ((87.6 ± 8.2)) U/mg protein) of the PM2.5 + LPS group decreased significantly. The SOD activities in the kidney of the LPS group ((100.0 ± 19.9) U/mg protein) were inhibited considerably relative to the control. It’s worth noting that the SOD activities of the kidney in the PM2.5 + LPS group declined significantly compared with the PM2.5 group ((118.3 ± 29.7) U/mg protein). The levels of GSH (a), MDA (b), catalase (c), and superoxide dismutase (d) of mouse tissues in different groups (compared with the control, *p < 0.05, **p < 0.01; compared with the PM2.5 group, #p < 0.05; compared with the LPS group, ▲p < 0.05). Values were expressed as means ± SD.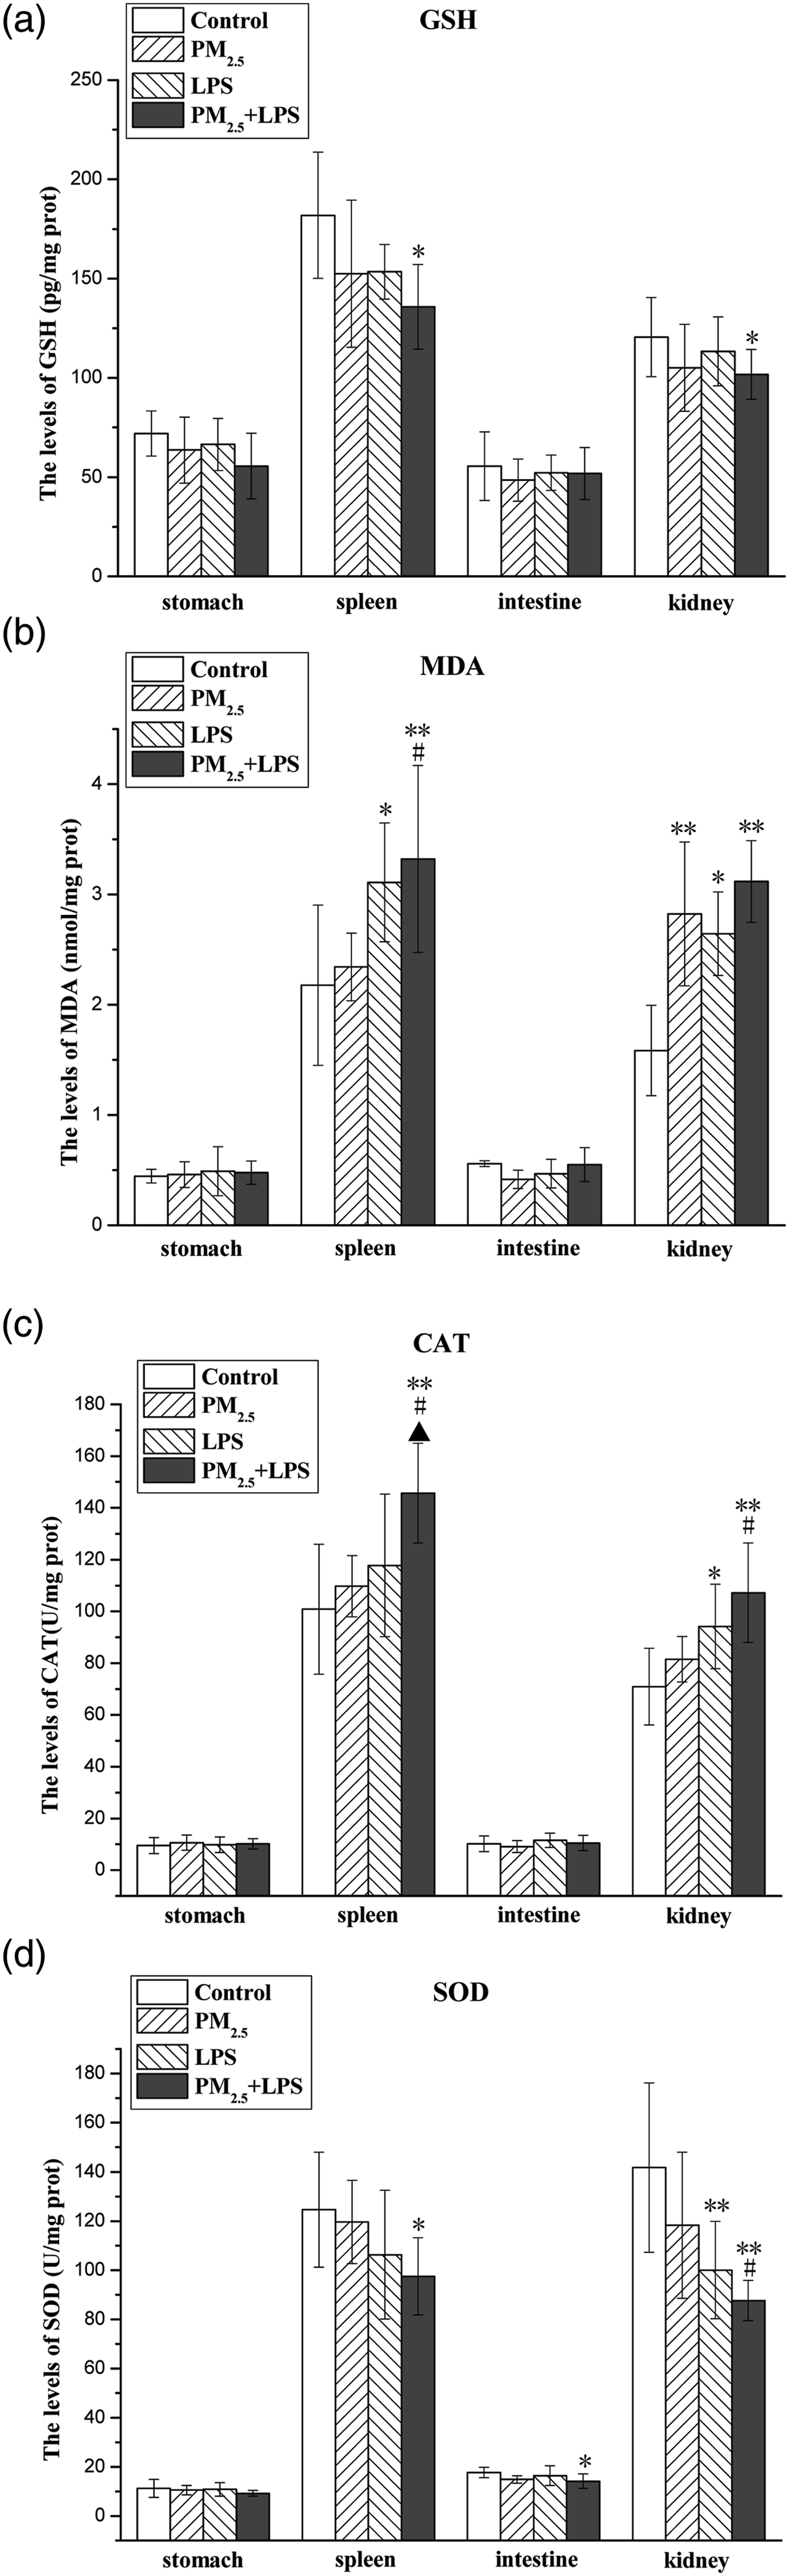
The levels of GSH, MDA, CAT, and SOD in the stomach in the three groups were not significant compared with the control. A similar effect was seen in the intestine, except that the SOD activity in the PM2.5 + LPS group was significantly decreased relative to the control group.
The effects of PM2.5 and lipopolysaccharide on the levels of KIM-1 in the kidney of mice
According to the above research, more severe inflammatory responses and oxidative stress appeared in the kidney of mice exposed to PM2.5 plus LPS. To further explore the damage mechanism, we detected KIM-1 (a biomarker of kidney damage) levels in the kidney of mice in the different groups. As shown in Figure 7, the KIM-1 levels ((53.8 ± 17.0) pg/mg protein) of the LPS group and PM2.5 + LPS group ((54.6 ± 5.3) pg/mg protein) significantly increased compared with those of the control group ((41.9 ± 4.4) pg/mg protein) (p < 0.05). The levels of KIM-1 of kidneys in different groups (compared with the control, *p < 0.05). Values were expressed as means ± SD.
Discussion
We used a novel real-ambient PM2.5 exposure system to expose mice (during the exposure period, the average concentration of PM2.5 in the atmosphere was about 77 μg/m3; the average concentration of PM2.5 in the cage was about 54 μg/m3, which exceeded the standard of annual average PM2.5 concentration of 35 μg/m3 in China). Hasday et al. reported that the dose of inhalable LPS produced by smoking a pack of cigarettes a day is equivalent to having adverse health effects in cotton textile workers. 25 This study, which used an intraperitoneal injection of LPS (0.12 mg/mL, 50 μL, once per week) combined with a PM2.5 chronic inhalation exposure model, explored the pathological damage effects and possible mechanisms of the combined exposure of PM2.5 and LPS on multiple organs in mice.
Firstly, the changes in mouse body weight, organ coefficient, and histopathology in mice after co-exposure of PM2.5 plus LPS were analyzed. We observed that the gain of body weight of the LPS group and the PM2.5 + LPS group increased markedly compared with the control group (p < 0.01) (Table 2). A previous study showed that the LPS injection for 6 weeks significantly caused an increase in the body weight of mice compared with the control group, 26 consistent with our results. This phenomenon may be due to the LPS-promoting adipose metabolism of mice, 27 leading to the body weight gain of mice. Besides, Lars-Georg et al. (2005) reported that LPS might cause obesity by participating in the inflammatory reaction in adipose tissue directly and indirectly. 28
The organ coefficients of the stomach in the PM2.5 + LPS group and the kidney in the PM2.5 group were significantly higher than those in the control group (Table 2), which suggested that there may be pathological phenomena such as congestion, edema, or hypertrophy of the stomach and kidney.
Under chronic exposure conditions (23 weeks), PM2.5 and LPS caused pathological damage to mice’s stomach, spleen, intestine, and kidney (Figures 1–4). In particular, it was found that the combined exposure of PM2.5 and LPS had more severe pathological damage to the four organs than the exposure of PM2.5 or LPS alone. It suggested that the co-existence of PM2.5 and LPS would have adverse effects on the stomach, spleen, intestine, and kidney.
Secondly, we discussed the effects of PM2.5 and LPS on the levels of TNF-α and IL-6 in four organs of mice. Inflammation is a key factor in determining the severity of organ damage and disease. 29 Studies had shown that subchronic exposure to PM2.5 could cause renal dysfunction, abnormal glucose metabolism in mice, and cause chronic kidney disease. 18 PM2.5 exposure can cause splenomegaly and inflammation, which interferes with the immune response. 30 LPS can mediate kidney inflammation in mice by activating the HMGB1/TLRs/NF-κB pathway. 31 LPS can cause inflammatory damage and tissue congestion and edema in rat kidneys, accompanied by increased serum levels of TNF-α and IL-6. LPS can also promote the secretion of more IL-6 and TNF-α in the spleen of mice, causing inflammatory damage to the spleen. 32 The results of this study (Figure 5) showed that the co-exposure of PM2.5 and LPS caused more severe inflammatory damage to the four tissues than the single action. Co-exposure had little effect on the levels of TNF-α and IL-6 in the stomach and intestine, but it significantly increased the levels of TNF-α and IL-6 in the spleen and kidney compared with the control group. It showed that the co-exposure of PM2.5 and LPS had a greater impact on the spleen and kidney. In particular, the level of IL-6 in the spleen tissue after the combined exposure of PM2.5 and LPS was significantly higher than that in the LPS group, suggesting that the spleen is more sensitive to PM2.5 and LPS co-exposure. As an immune organ, the spleen can mediate immune-inflammatory response. 33 We speculate that PM2.5 and LPS can make the spleen secrete more pro-inflammatory cytokines, triggering the inflammatory response.
Thirdly, co-exposure of PM2.5 plus LPS induced oxidative stress in four organs of mice. It has been demonstrated that polycyclic aromatic hydrocarbons, quinones, and transition metals in PM2.5 can cause excessive reactive oxygen species (ROS).34,35 LPS could elevate ROS levels in tubular epithelial cells and the adult mouse cortex.36,37 High levels of ROS are an important cause of triggering oxidative stress with GSH depletion and increased MDA content. 38 SOD and CAT, two anti-oxidative enzymes, can provide a cellular defense mechanism by scavenging ROS. SOD can catalyze the decomposition of O2.− to produce hydrogen peroxide, which is degraded to oxygen and water by CAT. In Figure 6, GSH level decrease and MDA content elevation suggested PM2.5 and LPS induced oxidative stress. Besides, the SOD inhibition indicated a decline of scavenging O2− capacity in the spleen, intestine, and kidney in response to PM2.5 and LPS, potentially resulting in oxidative stress. The elevated CAT activity in the spleen and kidney in the PM2.5 + LPS group reflected an emergency response against high levels of ROS. Notably, the results also illustrated that co-exposure of PM2.5 and LPS caused a more significant impact on the spleen and kidney oxidative stress. Previous studies revealed that PM2.5 exposure could cause pathological damage and oxidative stress in mouse spleen and rat kidney18,19; LPS also could cause pathological damage and oxidative stress in the spleen and kidneys of mice.23,39 These findings supported our results. We speculate that the mice produced more ROS under the stimulation of PM2.5 and LPS, which caused oxidative stress and inflammation in the spleen and kidney, leading to pathological tissue damage.
Interestingly, we found that body weight gain and the stomach organ coefficient in the PM2.5 + LPS group were significantly increased compared with those of the PM2.5 group. SOD activity in the kidney in the PM2.5 + LPS group was markedly inhibited relative to the PM2.5 group. CAT activities in the spleen and kidney were dramatically increased in the PM2.5 + LPS group compared with those of the PM2.5 group, and the CAT activity in the spleen was increased considerably compared with that of the LPS group. The IL-6 levels in the spleen in the PM2.5 + LPS group were remarkably elevated compared with those of the LPS group. Compared with the control, the levels of SOD and CAT in the tissues in the PM2.5 group were not significantly changed, but such alterations were observed in the PM2.5 + LPS group compared to the PM2.5 group. The results suggest that the combined effects of PM2.5 and LPS on oxidative stress and inflammation in the spleen and kidney exceed those induced by PM2.5 or LPS alone.
Finally, the present study found that the kidney was sensitive to PM2.5 and LPS. KIM-1 has proved to be an excellent indicator of kidney injury. 40 KIM-1 is involved in renal disease’s injury and repair process and mediates the phagocytic function of tubule epithelial cells. The level of KIM-1 in the kidney increased after the tissue injury. As shown in Figure 7, KIM-1 levels in the kidney of mice in the PM2.5 + LPS group were significantly increased compared with those of the control. Combining with the histopathological results of the kidney, it suggests that the co-exposure could cause kidney damage and subsequently affect renal function.
Conclusions
Under the current experimental conditions, PM2.5 exposure or LPS exposure alone or together could cause pathological damage to mice’s stomach, spleen, intestine, and kidney to varying degrees. Co-exposure of PM2.5 plus LPS caused more serious pathological, inflammatory injury and oxidative damage than PM2.5 exposure or LPS treatment alone. Although co-exposure of PM2.5 plus LPS caused multiple organ damage, there are tissue differences in such effects. The spleen and kidney were susceptible to the pollutants. The mechanisms may be associated with the increasing pro-inflammatory cytokine levels and the oxidative stress responses induced by the combined effects of PM2.5 and LPS.
A study reported that the mean content of the endotoxin (LPS) in atmospheric PM2.5 in Beijing, China was 0.041 EU/mg particle. 41 Linfen and Beijing are both cities in northern China, and the PM2.5 pollution in the two cities has much in common. It suggests that PM2.5 and LPS coexist in the natural atmospheric environment in Linfen. Future studies will be necessary for exploring the synergistic effects of PM2.5 and LPS in the typical area on multiple organ damage and their molecular mechanisms with the ultimate goal of ameliorating the adverse effects of chronic PM2.5 and LPS exposure.
Footnotes
Declaration of conflicting interests
The author(s) declared no potential conflicts of interest with respect to the research, authorship, and/or publication of this article.
Funding
The author(s) disclosed receipt of the following financial support for the research, authorship, and/or publication of this article: This work was supported by the National Natural Science Foundation of China (91843301) and Project on Social Development by the Shanxi Science and Technology Department (201903D321079).