
Abstract
Hepatocellular carcinoma (HCC) accounts for more than 5% of all human cancers. Diacerein (DIA), an interleukin (IL)-1β inhibitor, is used for the treatment of osteoarthritis. DIA is a potential anticancer drug acting on several protein targets in the process of apoptosis. The present study aimed to explore the molecular mechanisms underlying the effect of DIA in the treatment of trichloroacetic acid (TCA)–induced pre-neoplastic changes in rats. Rats were allocated into 5 groups and treated for 4 weeks. Group 1: control; received vehicle, Group 2: TCA group; received TCA (1 g/kg, orally for 5 days). Group 3: DIA-treated group; received TCA +DIA (50 mg/kg/day, orally, for 4 weeks). Group 4: positive control group; received TCA (1 g/kg, orally, for 5 days) + 5-fluorouracil (5-FU) (75 mg/kg) intraperitoneally (i.p.), for 4 weeks as a standard anticancer drug. Group 5: received TCA (1 g/kg, orally for 5 days) + DIA (50 mg/kg/day, orally, for 4 weeks) + 5-FU (75 mg/kg, i.p., for 4 weeks). Serum liver enzymes, oxidative stress parameters, inflammatory parameter (IL-1β), and angiogenesis marker vascular endothelial growth factor (VEGF) were assessed along with histopathological evaluation. An apoptotic marker as caspase-3 expression was measured by western blot analysis. Immunoexpression of proliferating cell nuclear antigen (PCNA) and hypoxia-inducible factor-1α (HIF-1α) was evaluated. Results and conclusion: The outcomes proved that at histological level, DIA ameliorated hepatic precancerous lesion via modulation of IL-1β–HIF-1α–VEGF pathway.
Conclusion
IL-1β mediates angiogenesis indirectly, as it has been shown to induce hypoxia-inducible factor-1α (HIF-1α) which upregulates VEGF.
Keywords
Introduction
Hepatocellular carcinoma (HCC) is one of the most common malignancies worldwide. 1 It accounts for 80–90% of primary liver cancer and causes approximately one million deaths every year. 2 The prognosis of HCC is generally poor due to the high recurrence rate; half of the HCC patients suffer recurrence following curative treatment, including surgical resection and ablation.3–4 Moreover, the current HCC chemotherapy is quite challenging due to its extreme chemoresistance and usually being an advanced disease at the time of diagnosis. Thus, there is a pressing need for a better understanding of the molecular pathogenesis of HCC and the development of novel and effective molecular target-based agents for the treatment.
In rat experimental models, foci of cellular alterations (FCAs) have been designated to play a precursor role in the process of hepatocarcinogenesis as they represent a localized proliferation of hepatocytes that are phenotypically different from the surrounding liver. These foci have been described in several animal models and are considered as precursor lesions of HCC; 5 most of these FCAs progress to neoplasia, while some may regress. 6 Thus, detecting and guiding such hepatic pre-neoplastic growth back to normal hepatocytes would be of great clinical importance. Trichloroacetic acid (TCA) is a representative chemical carcinogen with the potential to cause experimental multistage hepatocarcinogenesis; 7 it produces pre-neoplastic lesions after a short period in the form of dysplastic tissue changes, vascular congestion, hepatocyte ballooning, and liver cell foci with extensive vacuolation.8–9 The results of previous studies have clarified the underlying mechanisms that contributed to the induction and invasion of cancer by this substance, which involves an increase in oxidative stress and inflammation, 9 DNA hypomethylation, 10 and its upregulatory effect on proteolytic enzymes. 9
One essential molecular event, which is responsible for the formation and progression of the tumor, is the overexpression of cytokine-specific receptors. 2 Cytokines lead to the induction of tumor survival, progression, proliferation, and metastasis by activating several molecular pathways. 11 This view could be of valuable interest in the treatment of HCC. Diacerein (DIA) is a clinically prescribed drug for the treatment of osteoarthritis. Its anti-osteoarthritis effect is due to its inhibitory action on the stimulation of the pro-inflammatory cytokine, IL-1β production, which leads to degeneration of the cartilage.12,13 Also, DIA inhibits proliferation and enhances the apoptosis process in breast cancer cells. 14 DIA, as a potential anticancer drug, acts on several protein targets in the process of apoptosis. Many studies have reported that DIA could stimulate caspase-1, -3, -8, -9, and -12. Caspase-3 plays a major role in cellular apoptosis. 15
One basic element that determines a tumor cell proliferative potential is the expression of the proliferating cell nuclear antigen (PCNA). It is an essential proliferating agent that plays a major role in inducing and maintaining the pre-neoplastic and malignant changes in different organs. Previous studies have discussed that a high level of PCNA expression is accompanied by poor prognosis in many tumors.16–18 Hypoxia-inducible factor-α (HIF-1α)–vascular endothelial growth factor (VEGF) pathway is also a critical pathway in tumor induction and progression. 19 HIF-1α is a key regulator of oxygen balance that plays an important role in tumor angiogenesis. 20 HIF-1α degenerates under normoxia and stabilizes under hypoxia. 21 VEGF is a group of crucial molecules in tumor metastasis. VEGF-A is a glycosylated mitogen act on endothelial cells. It increases vascular permeability, stimulates angiogenesis, endothelial cell growth, promotes cell migration, and inhibits apoptosis. 22 DIA has an inhibitory effect on HIF-1α and VEGF signaling pathway in previous studies explaining its anti-tumor activity. 15
Given the earlier findings related to the anti-tumor efficacy of DIA, the current study was conducted to investigate its possible effect against TCA-induced pre-neoplastic hepatic lesions in rats, giving a particular attention to its molecular effects on the key players including IL-1β, PCNA, VEGF-A, and HIF-1α.
Material and methods
Drugs, chemicals, and antibodies
Alanine transaminase (ALT) Kit (Catalog# GPT113100) (Biomed, Egypt), hydrochloric acid (BDH Chemicals Ltd, England), sodium chloride, Trichloroacetic acid (El-Nasr Pharmaceutical Co., Egypt), sodium hydroxide (Biochrom Ltd, England), Tris buffer (Fluka Co., Switzerland), DIA powder from (Eva Pharma Co., Egypt), 5-fluorouracil vial (5-FU) (Utoral), rat IL-1β ELISA kits (catalog # E-EL-R0012), rat VEGF ELISA kits (catalog # E-EL-R260396T) (Elabscience, Biotech Co. Ltd, Wuhan, China), total antioxidant capacity (TAC) colorimetric kit (catalog # TA02), (Oxford Biomedical Research CO), mouse anti-β-actin antibody (catalog
Animals
The present experiment was conducted on adult male Wistar albino rats weighing 170–200 gm and obtained from the National Research Center (Giza, Egypt). They were housed in cages (3 rats/cage) and supplied with pellets of feed and drinking water ad libitum (El-Nasr Co., Cairo, Egypt). They were maintained for 2 weeks before the start of the experiment for acclimatization to the laboratory environment. The facilities were maintained at 24 ± 2°C with a 12 h dark: light. The animal procedures were following the ARRIVE ethical guidelines and the NIH Guide for taking care and use of laboratory animals. They are approved (council #242: 7/2019) by the board of the Faculty of Medicine, Minia University, Egypt.
Experimental design
Animals were randomly divided into five groups consisting of eight rats in each group and subjected to the following treatments:
Group 1 (control group): Normal control group received vehicle; 1% carboxymethylcellulose (CMC) p.o. once daily and saline p.o. once daily for 5 days.
Group 2 (TCA group) received TCA (0.5 g/kg/day) p.o. once daily for 5 days 9 and received 1% CMC p.o. once daily for 4 weeks.
Group 3 (TCA + DIA group) received both TCA (0.5 g/kg/day) p.o. once daily 9 for 5 days and DIA (starting 24 h from last TCA dose) in a dose of (50 mg/kg/day) p.o. once daily 23 for 4 weeks.
Group 4 (TCA + 5-FU group) received both TCA (0.5 g/kg/day) p.o. once daily 9 for 5 days and 5-FU (starting 24 h from the last TCA dose) in a dose of (75 mg/kg) intraperitoneally (i.p.), once weekly 9 for 4 weeks.
Group 5 (TCA + DIA + 5-FU group) received both TCA (0.5 g/kg/day) p.o. once daily 9 for 5 days and a combination (starting 24 h from last TCA dose) of DIA (50 mg/kg/day) p.o. once daily 23 and 5-FU (75 mg/kg) i.p., once weekly 9 for 4 weeks.
At the end of the period of the experiment, animals were weighed and anesthetized with ether. Blood samples were collected from the jugular neck vein. Blood samples were centrifuged (centrifuge Jantezki, T30, Germany), at 5000 rpm for 10 min for collection of the sera. 24 Sera were aspirated and kept at −20°C until the assessment of various parameters.
The liver of each animal was rapidly dissected, cleaned by saline, and weighed. Liver lobes from each rat were divided into three parts; one part was kept in formalin (10%) for histopathological examinations; the second part was stored at −80°C for the western blot experiment; and the third part was homogenized in phosphate buffer solution (10% homogenate) and stored at −80°C for further biochemical measurements.
Measurements
Assessment of serum alanine transaminase
ALT level in serum was determined by colorimetric kit (BioMed-GPT) (catalog # GPT113100) and was used as stated by the manufacturer. The procedure was based on the method of Murray et al., 1984. 25
Histopathological assessment
Parts of liver tissues were processed by standard histological methods: fixation in 10% buffered formalin (24 h), embedding in paraffin, and sectioning through 5 μm thick paraffin sections. Three sections were prepared for each rat liver on glass slides and then routinely stained with hematoxylin and eosin (H&E) dyes. Stained slides were microscopically analyzed using light microscopy (Olympus CX 23L).
A blinded pathological assessment of hepatic histopathological changes was done to liver tissues for each group.
Immunohistochemical study
For immunohistochemical staining, a streptavidin-biotin immunoperoxidase complex procedure was applied.
5-μm thick sections were transferred to adhesive slides from representative formalin-fixed, paraffin-embedded blocks. The sections were deparaffinized in xylene and dehydrated through a series of graded alcohols. Endogenous peroxidase activity was blocked by incubation with 0.3% hydrogen peroxide in methanol for 30 min. Antigen retrieval was done by microwave treatment in sodium citrate buffer, pH 6, for both PCNA and HIF-1α for 15 min.
Tissue sections were then incubated with rabbit anti-PCNA (Santa Cruz, 1:30 dilution) and rabbit anti-HIF1-α (Abcam, 1:100 dilution) for 30 min at room temperature. This was followed by incubation with a biotinylated anti-rabbit secondary antibody for 30 min at room temperature. The reaction was then visualized with an avidin-biotin complex immunoperoxidase system using 3,3′ diaminobenzidine (DAB) as a chromogen. Sections were then counterstained with hematoxylin, dehydrated, cleared, and mounted with distyrene, plasticizer, and xylene (DPX).
Evaluation of immunostaining
For PCNA, nuclear staining was considered positive. Six microscopic fields of ×400 magnification was selected which included two representative fields each of considerable, medium, and a few positive cells. Immunostaining was evaluated using Labeling Index (LI), which is determined by calculating the number of immune-stained positive cells per 1000 cells, multiplied by [(PCNA-positive cells/1000 cells) × 100)]
For HIF-1α, cytoplasmic staining was considered positive. semi-quantitative assessment (immunoreactive score IRS) was done by multiplying the score of percentage of positively stained cells and the score of staining intensity. The percentage of positive cells was rated as follows: no positive cells (0); <10% cells positive (1); 10–50% cells positive (2); 51–80% cells positive (3); and > 80% cells positive (4). Staining intensity was scored as negative (0), mild (1), moderate (2), and intense (3). The immunoreactive score (IRS) gives a range of (0–12) and was calculated as follow: 0–1 = negative, 2–3 = Mild staining, 4–8 = moderate staining, 9–12 = strong staining.
Western blot analysis of caspase-3 expression
For estimation of caspase-3 expression, western blotting was performed as previously described. 26 Briefly, hepatic tissue was homogenized, total protein was estimated, and then an equal amount of protein from each liver homogenate was loaded per lane and separated by 10% sodium dodecyl sulfate (SDS)-Tris-glycine polyacrylamide gel electrophoresis (PAGE). Protein bands were transferred to a nitrocellulose membrane; the blot was subsequently blocked with a TBS-T buffer containing 5% skim milk powder for 1 h at room temperature. The blot was probed overnight at 4°C with mouse anti-caspase-3 antibody (catalog #sc-8432) (Santa Cruz Co., Germany) or mouse anti- β-actin antibody (catalog #sc-373730) (Santa Cruz Co., Germany). Subsequently, incubation with alkaline phosphatase (AP)–tagged anti-mouse antibody (Sigma-Aldrich Co., USA) was performed for 1 h at room temperature. Blots were finally analyzed using the 5-bromo-4-chloro-3-indolyphosphate (BCIP)/nitro-blue tetrazolium (NBT) colorimetric detection method. Protein bands on the blots were analyzed using Image-J (Image J 1.48V, Wayne Rasband National Institutes of Health, USA) and GraphPad Prism-6 (San Diego, USA) software.
Determination of hepatic oxidative stress parameters
Assessment of malondialdehyde in hepatic tissues
The tissue content of malondialdehyde (MDA) was determined using the thiobarbituric acid (26 mmol/L thiobarbituric acid, 0.92 mol/L TCA in 0.25 mol/L HCl) method as previously described. 27 This method measures the concentration of thiobarbituric acid reactive substances and provides the MDA concentration. The absorbance of the sample was determined at 535 nm against a blank by using Bechman DU-64 spectrophotometer, USA. Tissue MDA concentrations were calculated from a standard MDA curve and expressed as nmol/gm tissue.
Measurement of hepatic-reduced glutathione content
Hepatic-reduced glutathione (GSH) was measured as previously measured depending on the reduction of Elman’s reagent. 28 The yellow color developed was measured at 412 nm spectrophotometrically. Results were calculated from a GSH standard curve and expressed as μmol/g tissue).
Assessment of serum total antioxidant capacity
Total antioxidant capacity (TAC) in serum was determined by a colorimetric kit (Oxford Biomedical Research) (catalog # TA02) and used as stated by the manufacturer. Total antioxidant capacity was determined by the reaction of antioxidants in the sample with a defined amount of exogenously provide hydrogen peroxide (H2O2). The residual H2O2 in the sample was assessed by an enzymatic reaction that involved the conversion of 3, 5, dichloro–2–hydroxybenzenesulphonate to a colored product, which was detected at 505 nm. 29
Measurement of the hepatic level of interleukin-1β and VEGF-A
Determination of IL-1β and VEGF-A were done by rat ELISA Kits (catalog # E-EL-R0012) (Elabscience, Biotech Co. Ltd, Wuhan, China) and (catalog # E-EL-R260396 T) (Elabscience, Biotech Co. Ltd, Wuhan, China), respectively.
Statistical analysis
Data were analyzed by one-way ANOVA followed by Tukey multiple comparison test. The values were represented as means ± SEM. Statistical analysis was done using GraphPad Prism software (version 5). The differences were considered significant when the calculated p value is less than 0.05.
Results
Effect on serum alanine transaminase in different experimental groups
To investigate the effect of IL-1β inhibitor (DIA), rats were challenged with TCA followed by DIA administration. The indicator of liver function was determined at the end of the experimental period.
Administration of TCA produced a remarkable (p< 0.01) increase in the serum level of ALT as compared to the control group (13.74 ± 1.42 and 20.21 ± 0.45, respectively). Co-administration of DIA with TCA significantly (p< 0.001) decreased serum ALT level (13.19 ± 0.95) compared to the TCA-intoxicated group (Figure 1). Effect on serum alanine transaminase in different experimental groups. Values represent the mean ± SEM (n = 5–8). Results are considered significantly different when p < 0.05. * Significantly different from the control group. # Significantly different from TCA-intoxicated group. $ Significantly different from the 5-FU group. C = control group, TCA = trichloroacetic acid (0.5 g/kg/day) for 5 days, TCA + DIA = trichloroacetic acid (0.5 g/kg/day) for 5 days + diacerein (50 mg/kg/day) for 4 weeks, TCA + 5-FU = trichloroacetic acid (0.5 g/kg/day) for 5 days + 5-fluorouracil (75 mg/kg) i.p. once/week for 4 weeks, and finally TCA + DIA + 5-FU = trichloroacetic acid (0.5 g/kg/day) + diacerein (50 mg/kg/day) + 5-fluorouracil (75 mg/kg) i.p. once/week for 4 weeks. **, ##, $$ and ***, ###, $$$ significant difference at p < 0.01 and p < 0.001.
Co-administration of 5-FU with TCA caused a non-significant decrease in serum ALT level compared to TCA-intoxicated group.
The combination between DIA and 5-FU with TCA caused a non-significant decrease in serum ALT level compared to the TCA-intoxicated group.
Effects on hepatic histopathological features induced by TCA intoxication in different experimental groups
Histological examination of liver sections from the control group showed a normal liver structure with central vein and radiating cords of polyhedral hepatocytes separated by blood sinusoids (Figure 2 (a)). The hepatocytes are polyhedral in shape with acidophilic granulated cytoplasm and rounded centrally located nuclei with prominent nucleoli. Photomicrograph of liver section stained with hematoxylin and eosin in the control group and trichloroacetic acid-intoxicated group. Liver tissue from normal control group showing normal liver structure with central vein and radiating cords of polyhedral hepatocytes separated by blood sinusoids (2A ×200). Liver tissue from TCA-intoxicated group, showing central vein congestion (thick arrow) with dilatation and congestion of blood sinusoids (thin arrow) (2B, 200×). Kupffer cell hyperplasia (arrow) (2C, 200×) and multinucleated hypertrophied Kupffer cell (arrow) (2D, 400×). Some necrotic hepatocytes with pyknotic nuclei and inflammatory cells infiltration (thick arrow), in addition, some cells show karyocytomegaly (thin arrow) (2E, 200×). Foci of clear cell changes (2F, 200× and 2G, 400×) with some eosinophilic cells (arrow) in between (2H, 200×), Eosinophilic focus (arrow) of cellular alteration (2I, 200×).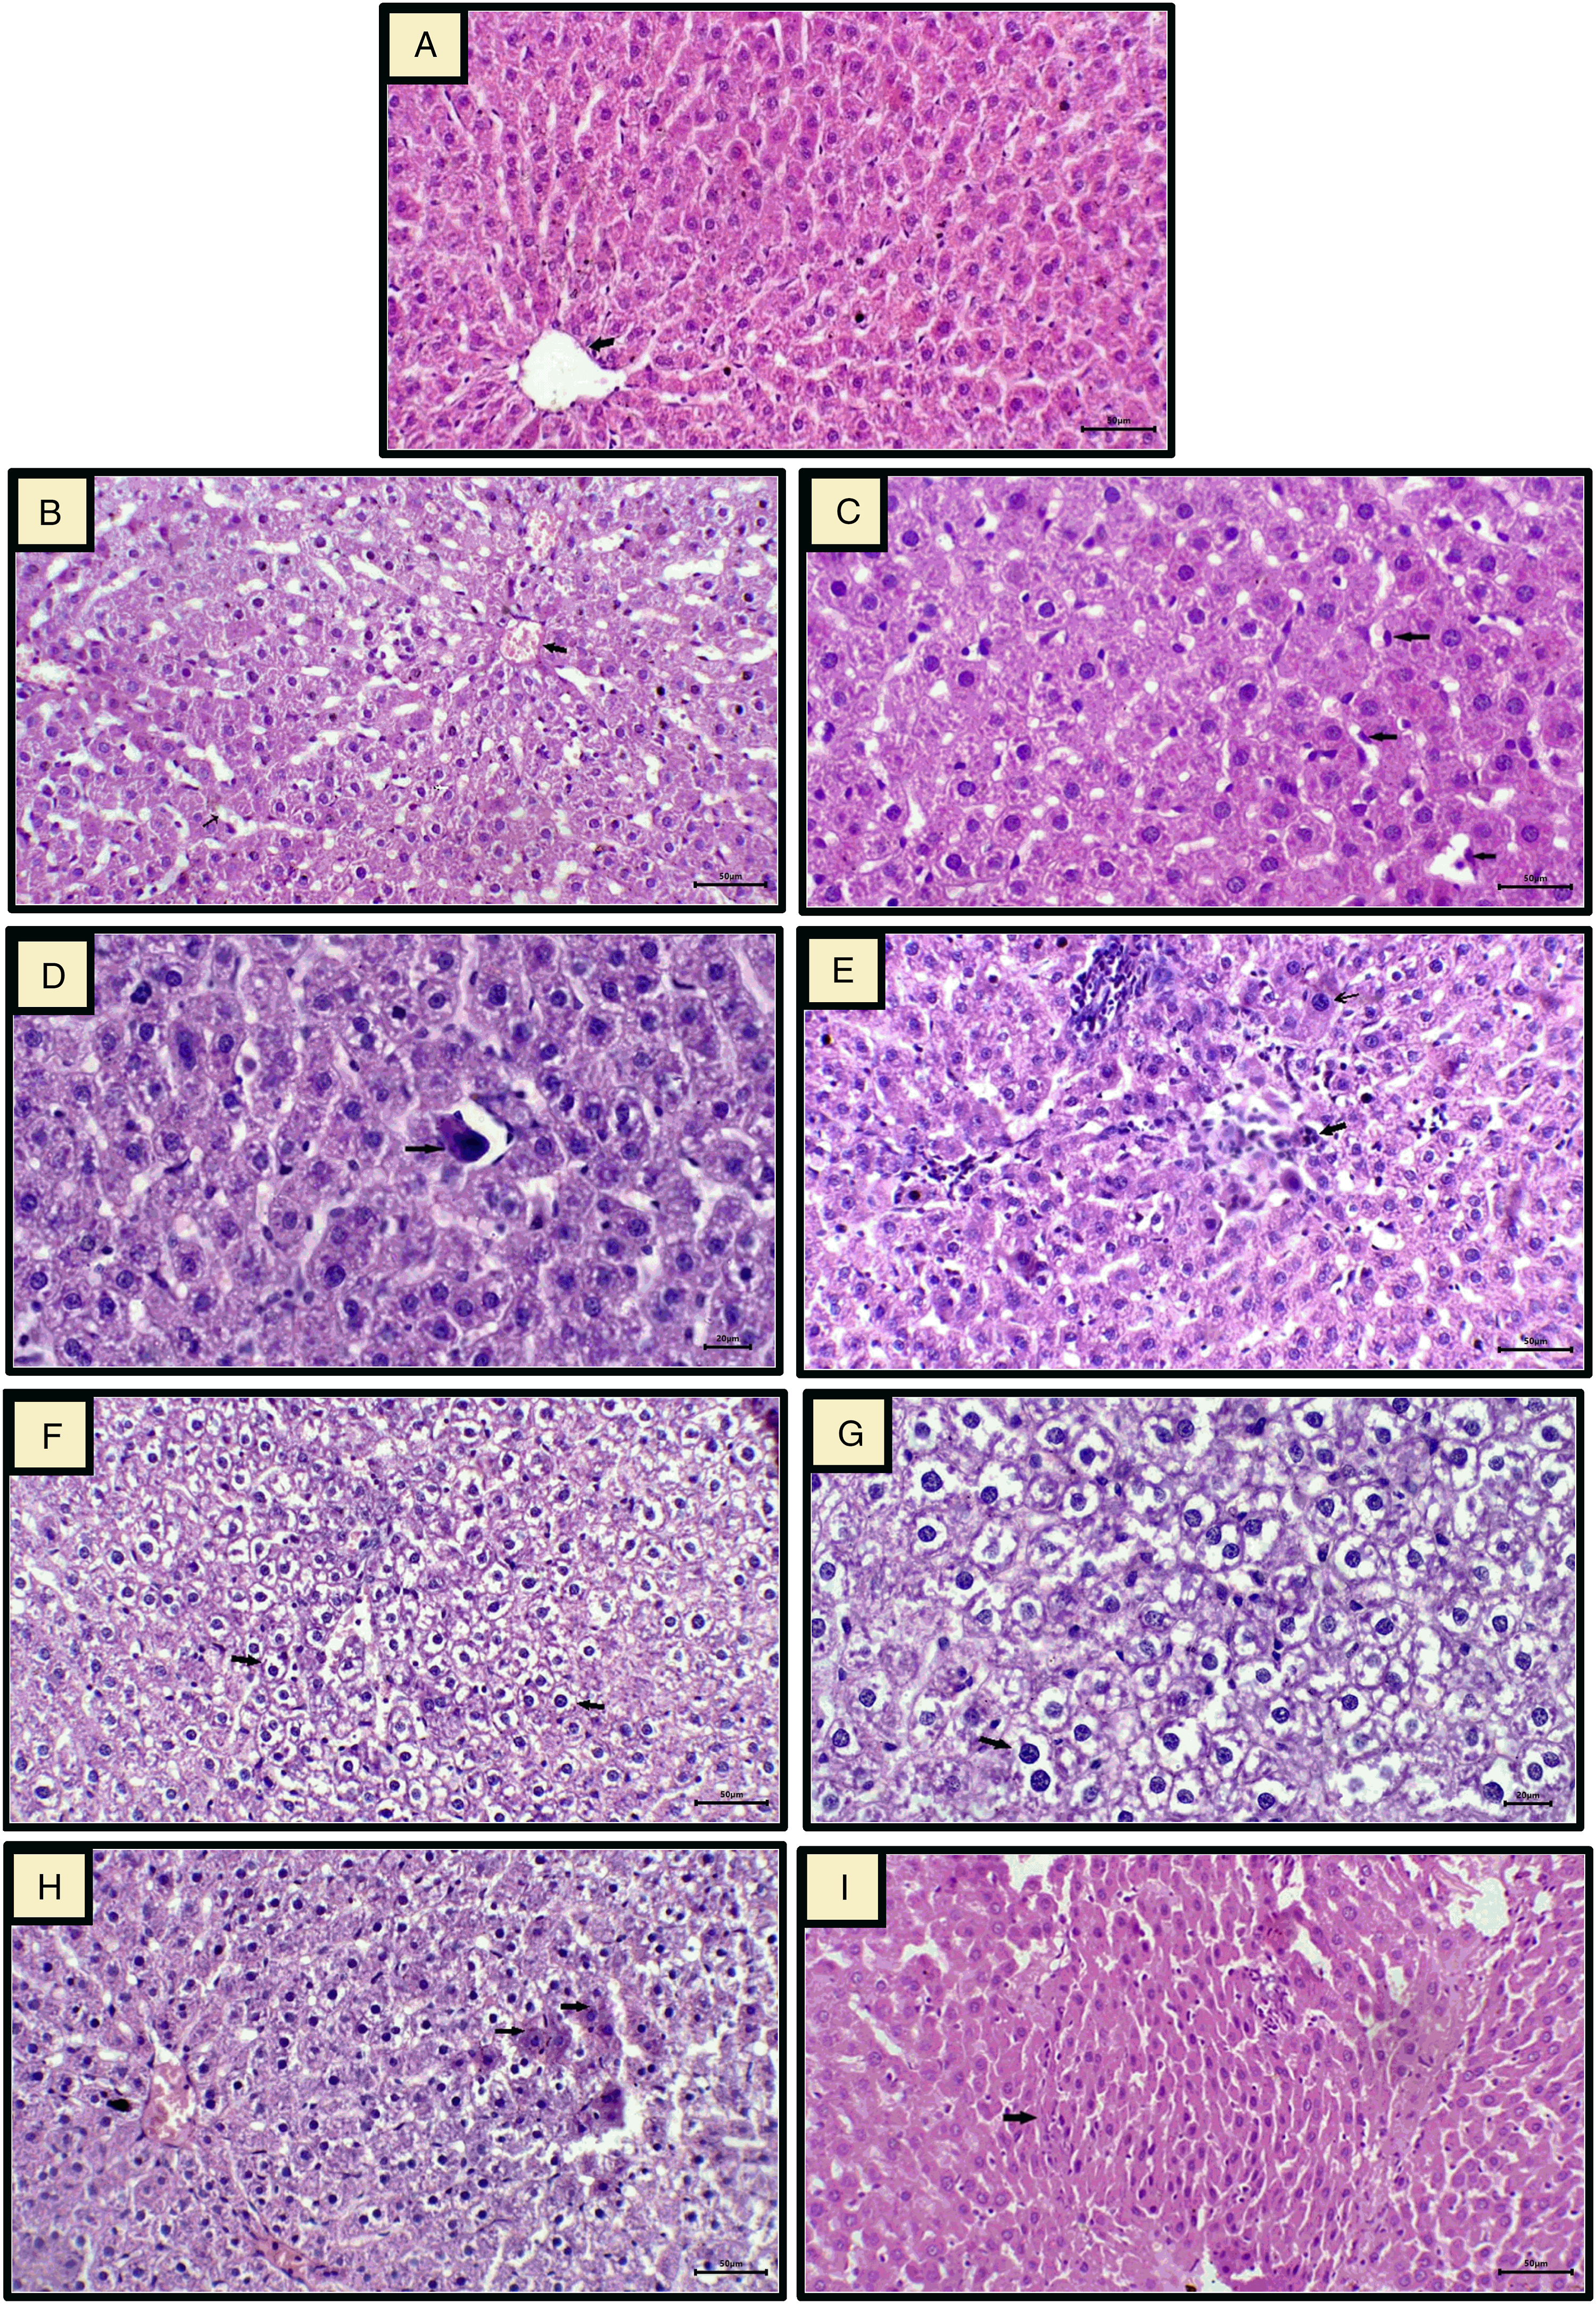
The TCA-intoxicated group developed significant hepatic damage as compared to the control group. The liver sections of the TCA-intoxicated group showed a wide range of pathological changes, including central vein congestion with dilatation and congestion of blood sinusoids (Figure 2(b)), hyperplastic and multinucleated hypertrophied Kupffer cells (Figure 2(c) and (d). In addition, there are some necrotic hepatocytes with pyknotic nuclei associated with inflammatory cell infiltration and some hepatocytes exhibit karyocytomegaly (Figure 2(e)). Moreover, scattered foci of transformed liver cells (foci with cellular alteration) were distinguishable from the surrounding normal parenchyma. Some foci represent clear cell changes (Figures 2(f) and (g)) that are characterized by groups of hepatocytes with prominent cell membranes and distinct cytoplasmic clear spaces surrounding a densely stained centrally located nucleus; some eosinophilic cells (Figure 2(h)) are occasionally present within clear cell foci. Few other foci are in the form of eosinophilic foci (Figure 2(i)).
Histological examination of liver sections from TCA-intoxicated groups treated with DIA and a combination of DIA and 5-FU, revealed an obvious improvement of most of the pathological changes, in which a marked improvement was demonstrated in DIA-treated group with the disappearance of most of the clear cell foci and the hepatocyte nuclei appeared normal, indicating the recovery of the liver tissues as shown in (Figures 3(a) and (b)). In addition, a moderate improvement was identified in the group treated with the combination of DIA and 5-FU (Figures 3(c) and (d)) as compared to a relatively less improvement which was also noticed in the group treated with 5-FU alone (Figures 3(e) and (f)). Photomicrographs of liver sections in trichloroacetic acid–intoxicated groups treated with DIA, and 5-FU as well as a combination of DIA and 5-FU. Liver tissue from the treated group with DIA returned to normal histological architecture with normally appeared nuclei of the hepatocytes (arrow) and the disappearance of most of foci of hepatocytic vacuolation and clearing, (3A ×200, 3B ×400). Good repair, and a moderate improvement of liver tissue, and the disappearance of many pathological changes were noticed in treated groups with a combination of DIA and 5-FU (3C ×200, 3D ×400) as compared to the groups treated only with FU in which there is a preservation of some areas of clear cell changes (3E ×200, 3F ×400).
Effects on proliferating cell nuclear antigen labeling index (LI) in different experimental groups
Figure (4) shows the immunohistochemical expression of PCNA in liver sections among various groups. PCNA staining was confined to the nuclei. Although the nuclear staining varied in intensity, all identifiable staining was considered positive. In the normal control group, a few PCNA-positive cells were found and distributed in a single or focal pattern (Figure 4(a)). Contrastingly, a significant increase in PCNA-positive hepatocyte expression was observed in the TCA-intoxicated groups (Figures 4(b) and (c)), whereas animal groups treated with DIA and a combination of DIA and 5-FU as well as 5-FU showed significant decrease in PCNA levels, with the most significant decrease in PCNA-positive cells seen in DIA-treated group (Figure 4(d–f)). Figure 4(g) represents the quantitative analysis of PCNA immunohistochemical data among different studied groups, which shows a significant elevation in the frequency of PCNA-positive hepatocytes (PCNA LI) in the TCA-intoxicated group compared with the normal control group. In comparison with the TCA-intoxicated group, DIA treatment and the combination of DIA and 5-FU as well as 5-FU had shown a significant decrease of the number of PCNA-positive cells with the lowest PCNA-positive cells were seen in DIA-treated group. Immunohistochemical staining of proliferating cell nuclear antigen in liver tissue among various studied groups. Normal liver tissue showing the focal presence of PCNA staining (4A, 200×). Liver tissue of TCA-intoxicated group, showing a marked increase in PCNA immunostaining (4B ×200, 4C ×400). Liver tissue from animal groups treated with DIA (4D ×200) and a combination of DIA and 5-FU (Figure 4e, ×200) as well as FU (Figure 4f ×200) showing less frequent immunostaining of PCNA, with the least positive expression seen in the DIA-treated group. The quantitative analysis of PCNA immunohistochemical data among different studied groups (Figure 4(g)) showed a significant elevation in the frequency of PCNA-positive hepatocytes (PCNA LI) in the TCA-intoxicated group when compared with the normal control group. In comparison with the TCA-intoxicated group, DIA treatment and the combination of DIA and 5-FU, as well as the 5-FU showed a significant decrease in the number of PCNA-positive cells, with the lowest PCNA-positive cells were detected in the DIA-treated group. **, ##, $$ and ***, ###, $$$ significant difference at p < 0.01 and p < 0.001.
Effect on cleaved caspase-3 expression by western blot analysis in different experimental groups
Administration of TCA produced a significant (p < 0.001) decrease in caspase-3 expression compared to the control group. Co-administration of DIA with TCA significantly (p < 0.01) increased caspase-3 expression compared to the TCA-intoxicated group.
Co-administration of 5-FU with TCA caused a non-significant increase in caspase-3 expression compared to the TCA-intoxicated group.
Co-administration of both DIA and 5-FU with TCA significantly (p < 0.001) increased caspase-3 expression compared to the TCA-intoxicated group (Figure 5). Effect on cleaved caspase-3 expression by western blot analysis in different experimental groups. Values represent the mean ± SEM (n = 5–8). Results are considered significantly different when p < 0.05. * Significantly different from the control group. # Significantly different from the TCA-intoxicated group. $ Significantly different from the 5-FU group. C = control group, TCA = trichloroacetic acid (0.5 g/kg/day) for 5 days, TCA + DIA = trichloroacetic acid (0.5 g/kg/day) for 5 days + diacerein (50 mg/kg/day) for 4 weeks, TCA+ 5-FU = trichloroacetic acid (0.5 g/kg/day) for 5 days + 5-fluorouracil (75 mg/kg) i.p. once/week for 4 weeks and finally TCA + DIA + 5-FU = trichloroacetic acid (0.5 g/kg/day) + diacerein (50 mg/kg/day) + 5-fluorouracil (75 mg/kg) i.p. once/week for 4 weeks. *, #, $ and ***, ###, $$$ significant difference at p < 0.05 and p < 0.001.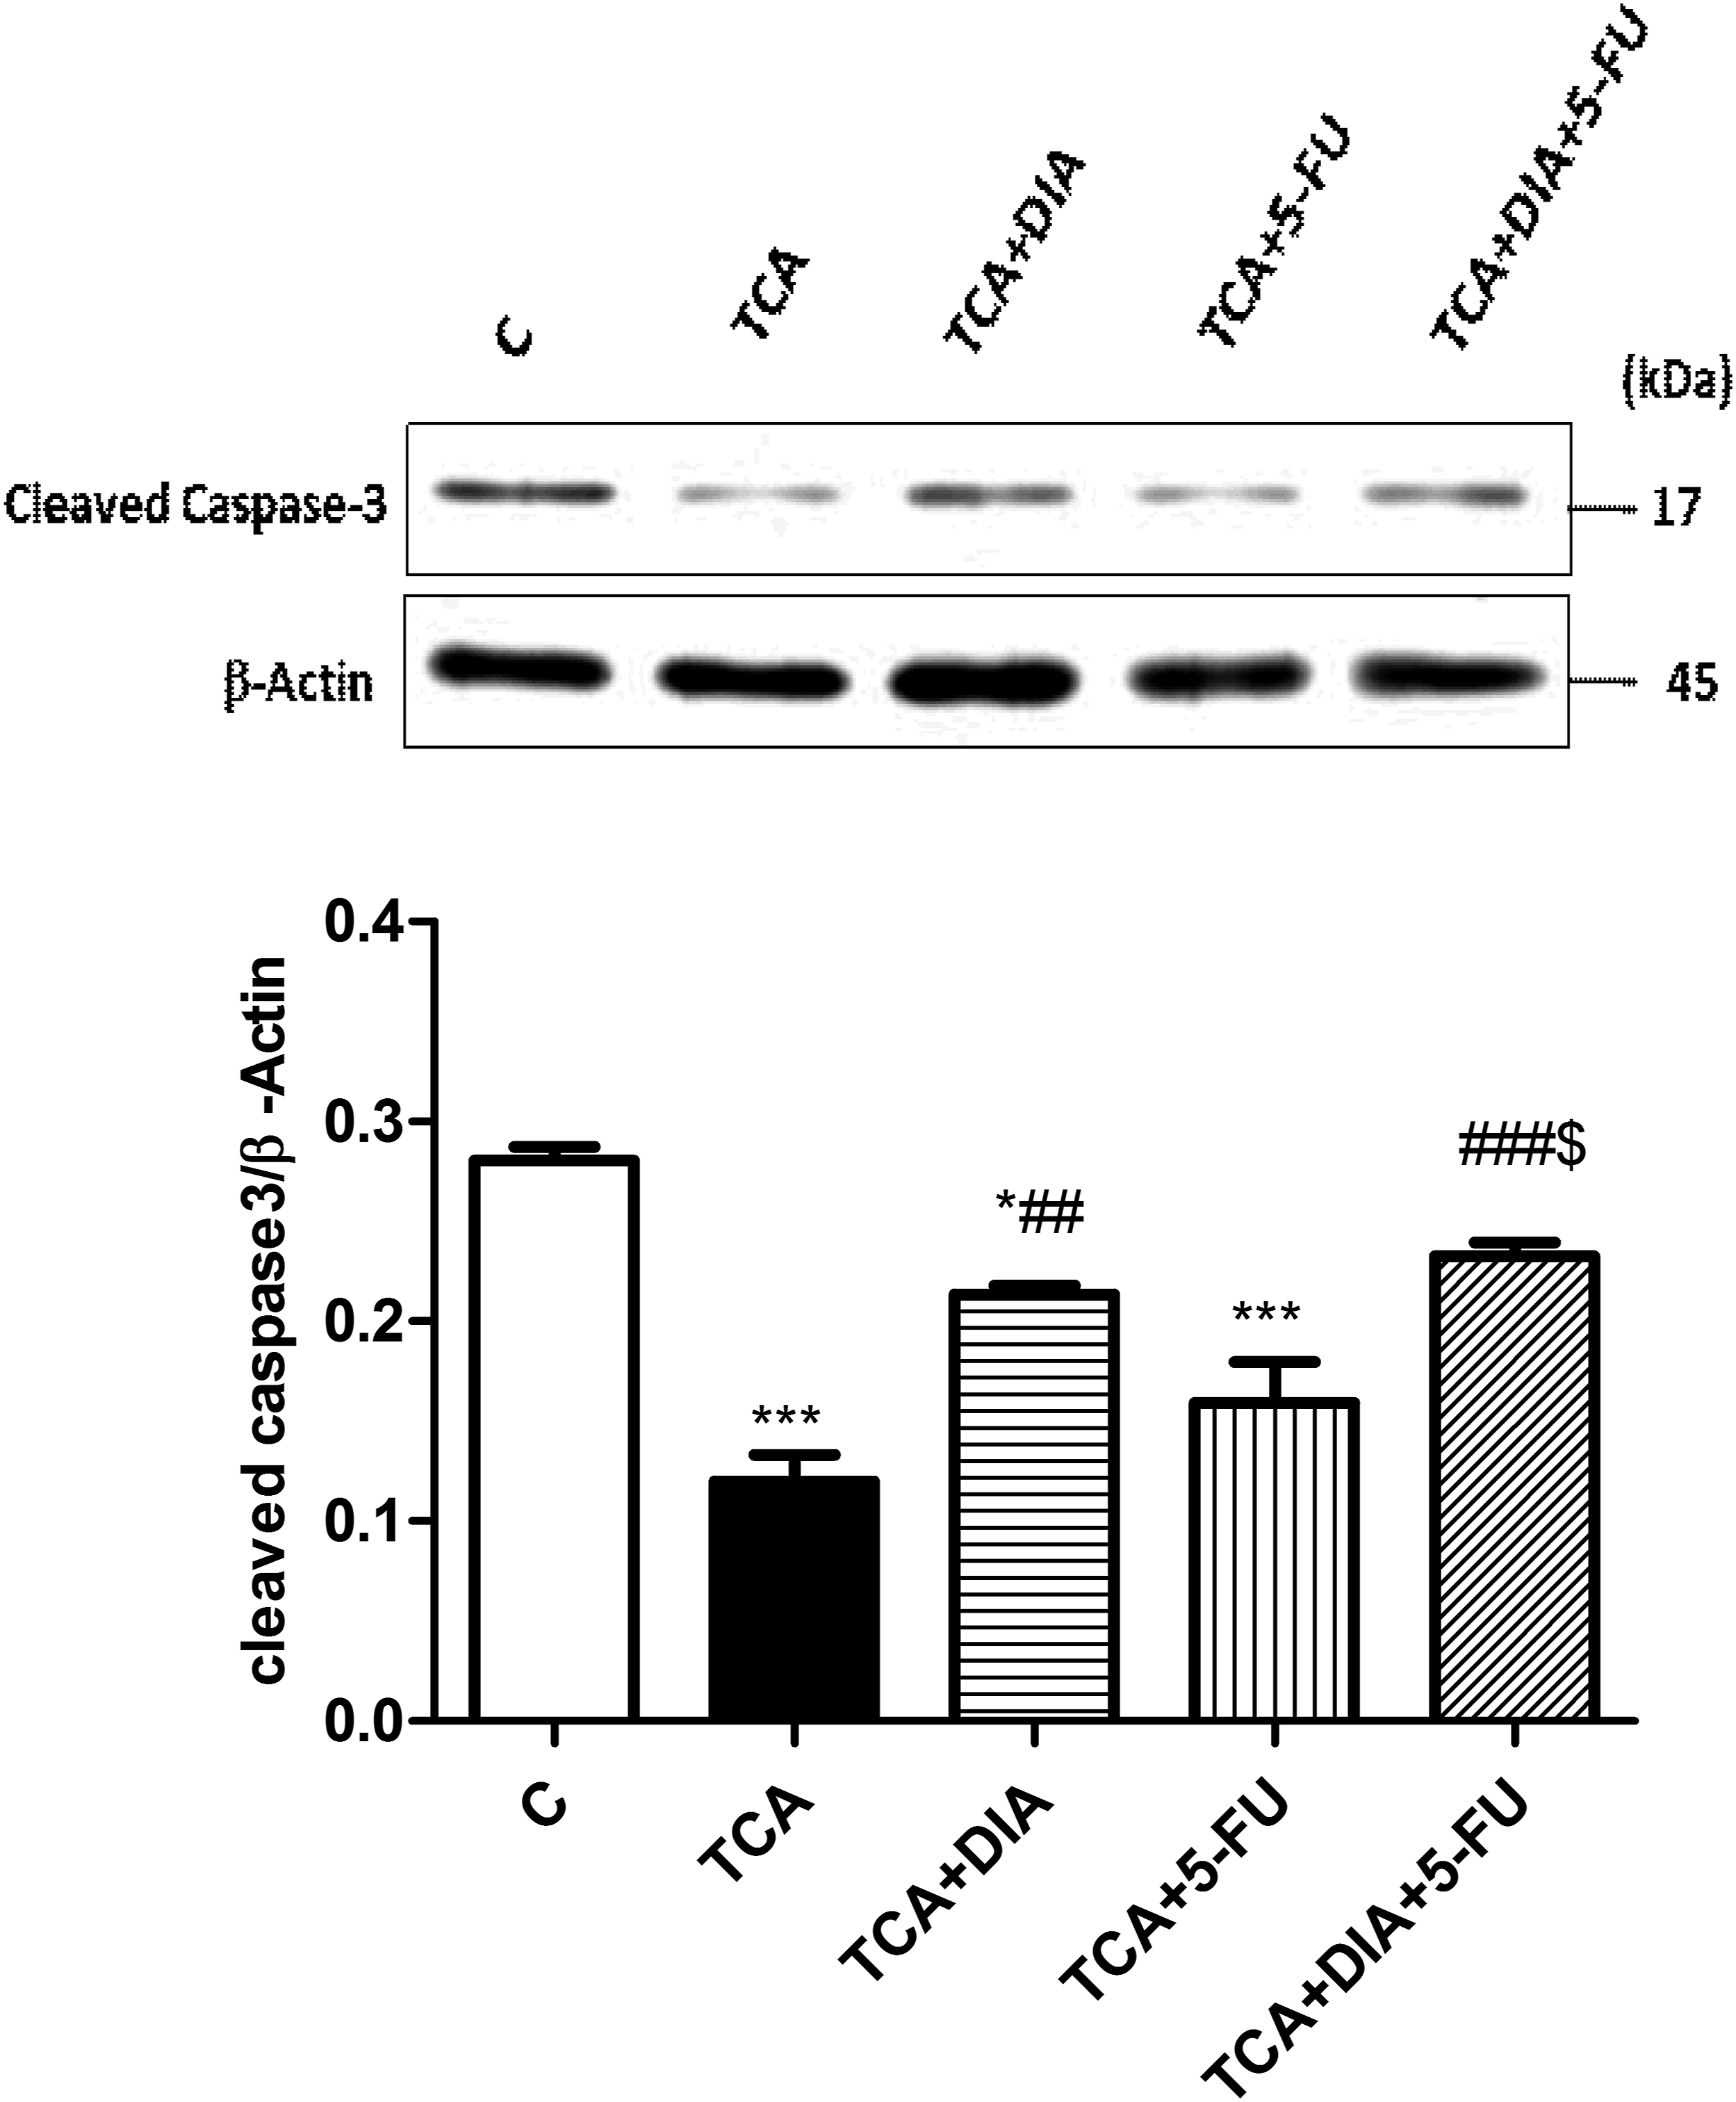
This indicates that the combination between DIA and 5-FU increased the efficiency of 5-FU to upregulate the caspase-3 expression in the TCA-intoxicated group.
Effect on oxidative stress parameters among different studied groups
Effect on oxidative stress parameters.

Data were analyzed with one-way ANOVA followed by Tukey–Kramer test for multiple comparisons post-test. Values represent the mean ± SEM (n = 5–8). Results are considered significantly different when p < 0.05. * Significantly different from the control group. # Significantly different from TCA-intoxicated group. $ Significantly different from the 5-FU group. C = control group, TCA = trichloroacetic acid (0.5 g/kg/day) for 5 days, TCA+DIA = trichloroacetic acid (0.5 g/kg/day) for 5 days + diacerein (50 mg/kg/day) for 4 weeks, TCA+ 5-FU = trichloroacetic acid (0.5 g/kg/day) for 5 days + 5-fluorouracil (75 mg/kg) i.p. once/week for 4 weeks, and finally TCA + DIA + 5-FU = trichloroacetic acid (0.5 g/kg/day) + diacerein (50 mg/kg/day) + 5-fluorouracil (75 mg/kg) i.p. once/week for 4 weeks. *, #, $ and ***, ###, $$$ significant difference at p < 0.05 and p < 0.001.
Co-administration of DIA with TCA significantly (p < 0.001) decreased hepatic MDA level up to normal control values and significantly (p < 0.05) increased hepatic GSH level and serum TAC (p < 0.001) compared to the TCA-intoxicated group.
Co-administration of 5-FU with TCA significantly (p < 0.05) decreased hepatic MDA level compared to the TCA-intoxicated group. On the other hand, it did not significantly increase hepatic GSH level, while its co-administration significantly (p < 0.001) increased serum TAC compared to the TCA-intoxicated group.
Co-administration of both DIA and 5-FU with TCA normalized (p < 0.001) the elevated hepatic MDA level compared to the TCA-intoxicated group and significantly (p < 0.05) increased both hepatic GSH level and serum TAC (p < 0.001) compared to the TCA-intoxicated group (Table 1).
So, combination between DIA and 5-FU produced a more profound decrease in hepatic MDA, while it increased the capacity of 5-FU to restore the disturbed antioxidant balance in the TCA-intoxicated rats.
Effect on interleukin-1 β and vascular endothelial growth factor-A level in liver among different studied groups
Administration of TCA produced a significant (p < 0.001) increase in hepatic IL-1β and VEGF-A levels compared to the control group.
Co-administration of DIA with TCA significantly (p < 0.001) decreased hepatic IL-1β and VEGF-A levels compared to the TCA-intoxicated group.
Co-administration of 5-FU with TCA caused non-significant decrease in hepatic IL-1β and VEGF-A levels compared to the TCA-intoxicated group.
Effect on the level of interleukin-1β and vascular endothelial growth factor-A level in the liver.

Data were analyzed with one-way ANOVA followed by Tukey–Kramer test for multiple comparisons post-test. Values represent the mean ± SEM (n = 5–8). Results are considered significantly different when p < 0.05. * Significantly different from the control group. # Significantly different from TCA-intoxicated group. $ Significantly different from the 5-FU group. C = control group, TCA = trichloroacetic acid (0.5 g/kg/day) for 5 days, TCA+DIA = trichloroacetic acid (0.5 g/kg/day) for 5 days + diacerein (50 mg/kg/day) for 4 weeks, TCA+ 5-FU = trichloroacetic acid (0.5 g/kg/day) for 5 days + 5-fluorouracil (75 mg/kg) i.p. once/week for 4 weeks, and finally TCA + DIA + 5-FU= trichloroacetic acid (0.5 g/kg/day) + diacerein (50 mg/kg/day) + 5-fluorouracil (75 mg/kg) i.p. once/week for 4 weeks. ***, ###, $$$ significant difference at p < 0.001.
This means that the combination between DIA and 5-FU is better than the administration of 5-FU alone.
Effects of on hypoxia-inducible factor-α immunoreaction in the liver tissue among studied groups
Immunohistochemical staining confirmed positive expression of HIF-1α as clear and brown particles, mainly located in the cytoplasm and cell membrane (Figure 6). A significant HIF-1α positive expression was seen in the TCA-intoxicated group that showing areas of degeneration and pre-neoplastic changes than in the normal control (Figure 6(a–c)). Also, positive staining was seen located in the border of hepatic terminal portal venules or near the central veins in TCA-intoxicated group (Figure 6(b)), whereas animal groups treated with DIA and a combination of DIA and 5-FU as well as 5-FU showed a significant decrease in HIF-1α positive expression, in which the lowest expression was seen in the DIA-treated group (Figure 6(d–F)). Figure 6 G represents a semi-quantitative analysis of HIF-1α immunohistochemical data among different studied groups, which shows significant HIF-1α positive expression in the TCA-intoxicated group compared with the normal control group. For groups treated with DIA and a combination of DIA and 5-FU as well as 5-FU, a significant decrease in HIF-1α positive expression was demonstrated as compared to the TCA-intoxicated group, in which the lowest positivity rate was seen in DIA-treated group. Immunohistochemical staining of hypoxia-inducible factor-α in liver tissue among various studied groups. Negative immunoreaction in the Control group (6 A ×200); marked immune-positive reaction in hepatocytes in the TCA-intoxicated group (6B ×200 and 6C ×200); significant weak immune-positive reaction seen in groups treated with DIA (6D ×200) and a combination of DIA and 5-FU (6E ×200) as compared to less weak immune-positive reaction seen in 5-FU–treated group (6F ×200). Semi-quantitative analysis of hypoxia-inducible factor-α immunohistochemical data among different studied groups (Figure 6(g)) showed a significant HIF-1α positive expression in the TCA-intoxicated group compared with the normal control group. For groups treated with DIA and a combination of DIA and 5-FU as well as 5-FU, a significant decrease in HIF-1α positive expression was detected as compared to the TCA-intoxicated group, in which the lowest positivity rate was seen in the DIA-treated group. ##, $$ and ***, ###, $$$ significant difference at p < 0.01 and p < 0.001.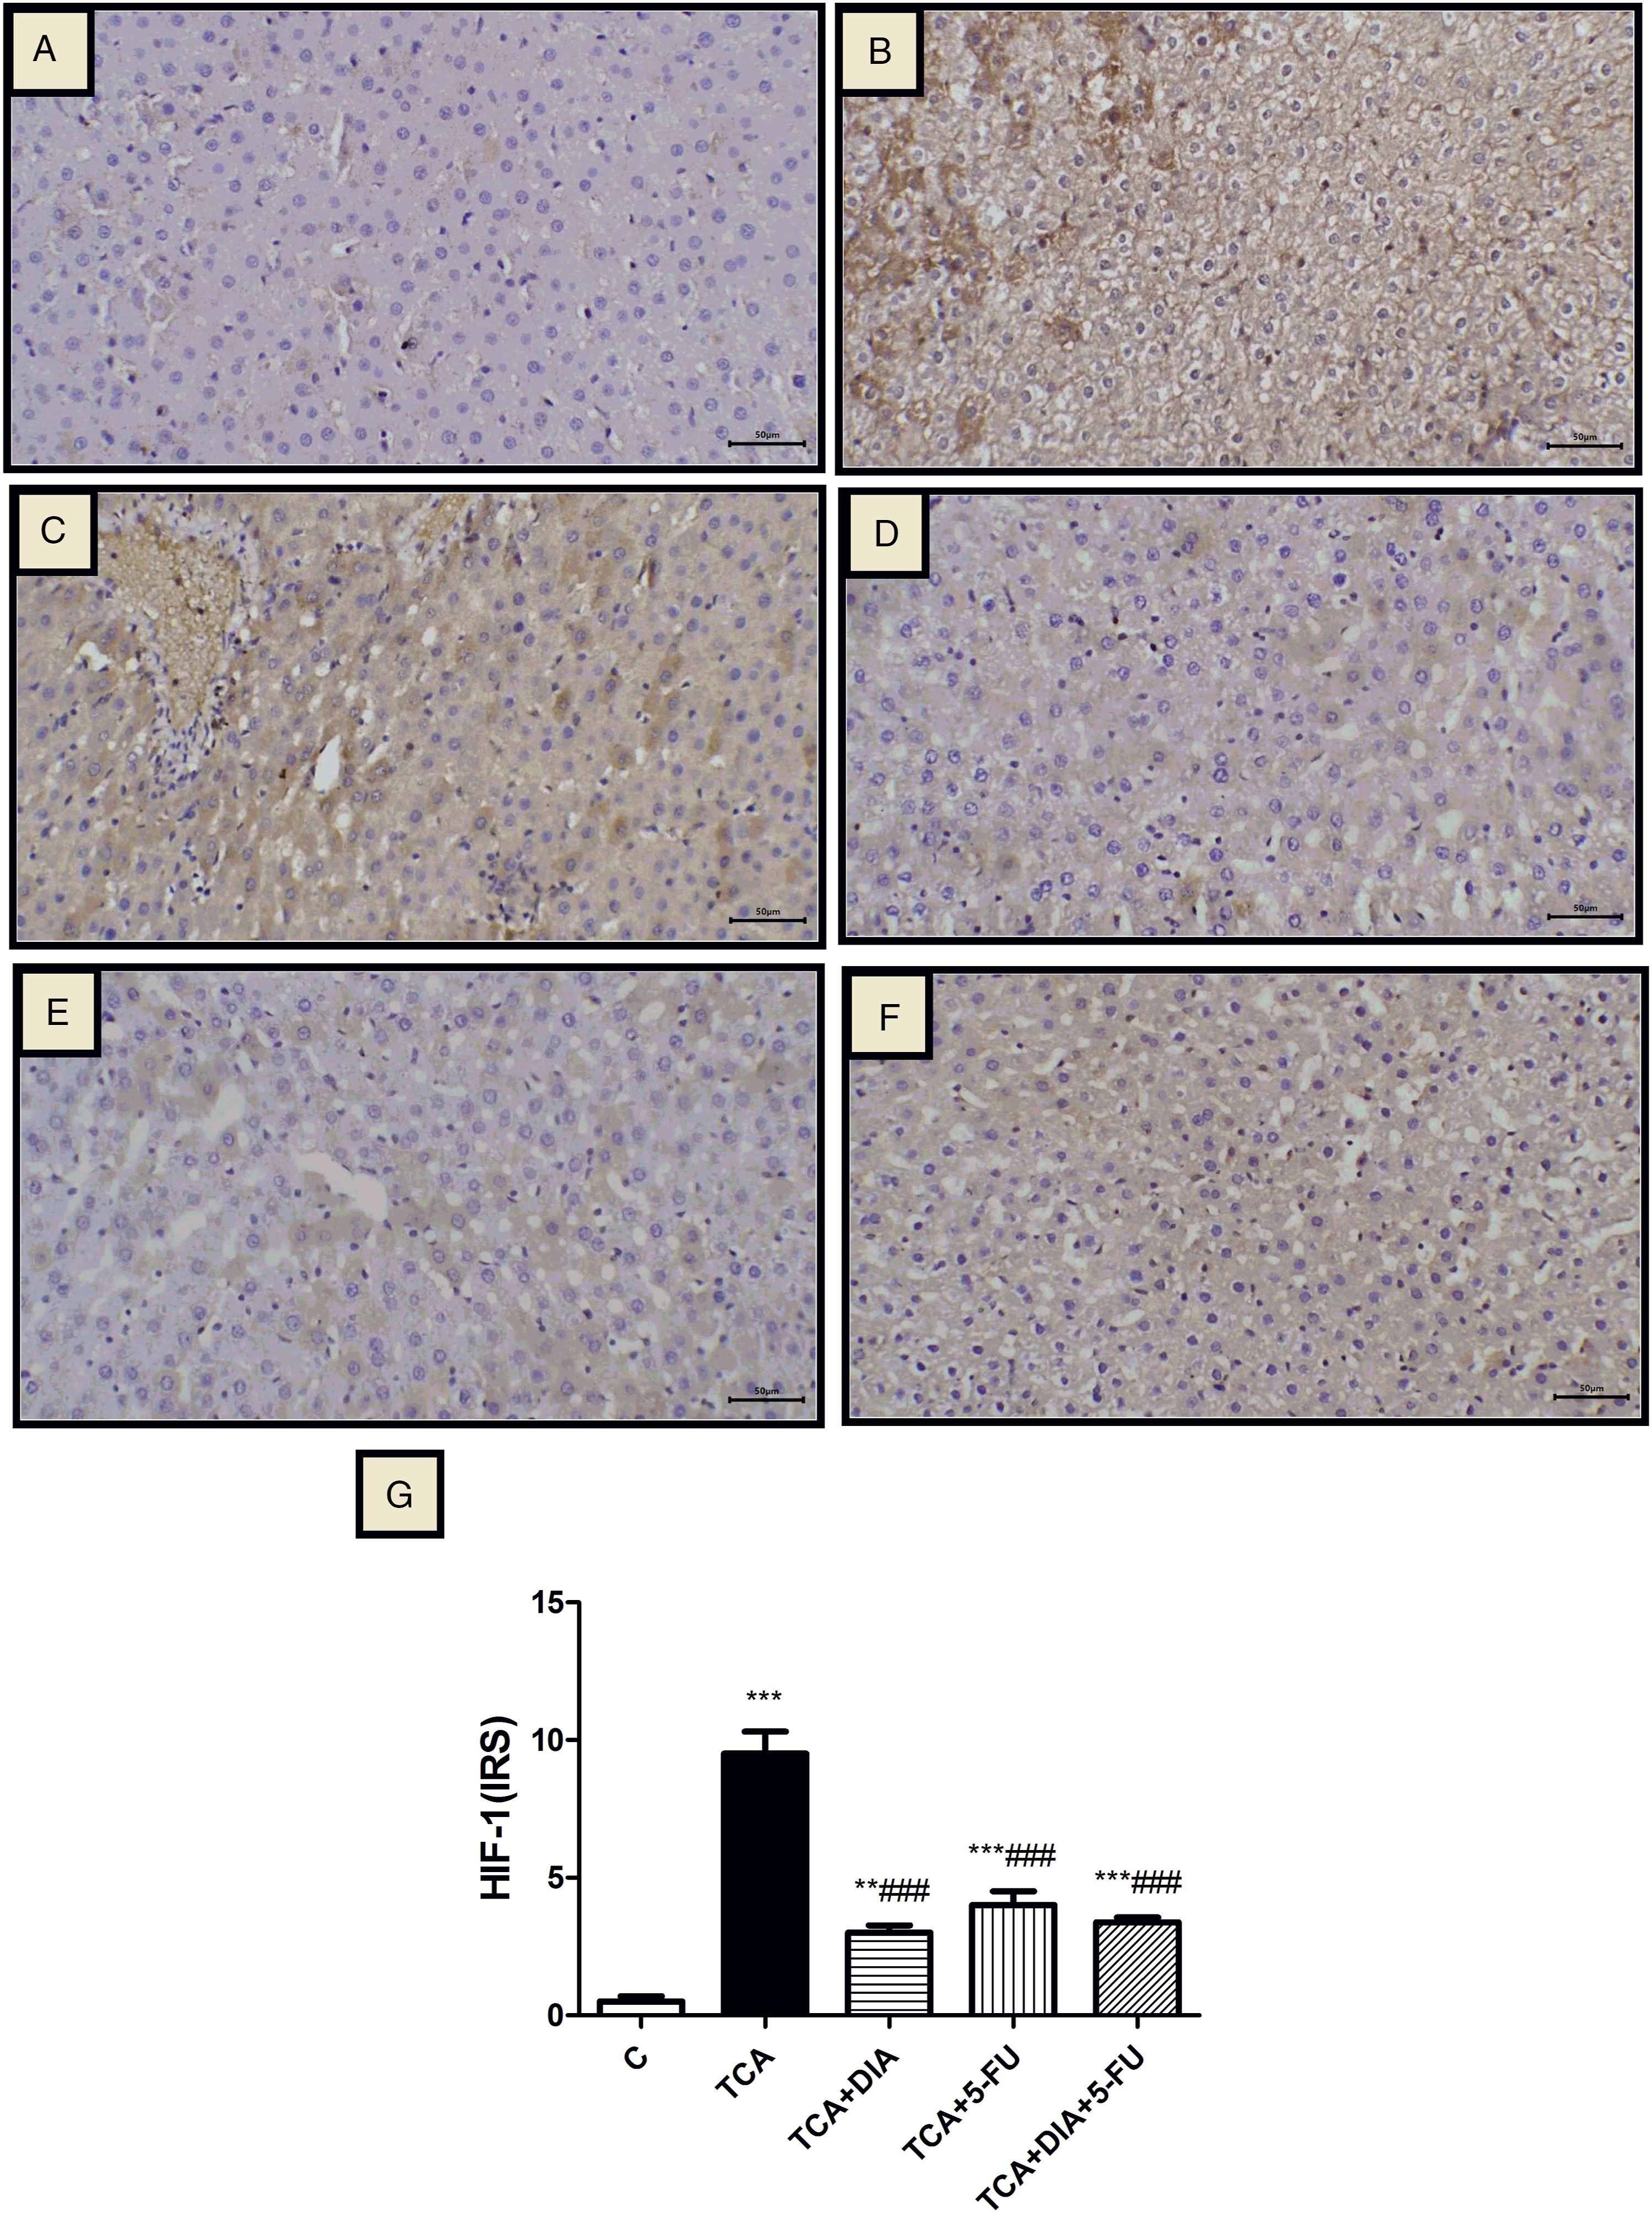
Discussion
HCC is reported to be the fifth common cancer. Most of the patients with HCC are frequently diagnosed at an advanced stage, so that the 5-year survival rate of HCC is estimated to be less than 20%. 30 The present study aimed to diagnose the premalignant stage and study the role of DIA in pre-neoplasia. We investigated the effect of IL-1β on the HIF-1α/VEGF pathway and the role of an IL-1β inhibitor, DIA, on such pathway in a rat model of hepatic pre-neoplastic lesion induced by TCA.
Induction of hepatic dysplasia was detected in the current study by a significant elevation of liver function enzymes as ALT, histopathological changes, and immunohistochemical expression of PCNA compared to control group. This is accompanied by a significant elevation of hepatic IL-1β, induction of HIF-1α and VEGF pathway, a decrease in the apoptotic markers as caspase-3, and finally, an elevation of oxidative stress parameters as MDA and a decrease in serum TAC as well as hepatic GSH levels.
ALT is the most specific and sensitive biomarker for liver injury since it is mostly found in liver tissue, localized to the hepatocyte cytosol. Although ALT isoenzymes are expressed in many tissues, elevated serum ALT activity is considered the “gold standard” clinical marker for liver injury. 31 Liver diseases identified by an ALT screening can be successfully treated indicated by the prevention of development of several clinical endpoints. 32 It also has important clinical significance in the prognosis of cancer. 33 An increase in the ALT is a predictor of HCC development; 34 previous researches demonstrated that patients with HCV-associated cirrhosis with a sustained high serum ALT level were at high risk for HCC development and those with a low ALT level were at low rate of development of HCC.35–36
Induction of membrane lipid peroxidation by the released free radicals and stimulation of inflammation is followed by hepatic cell damage and excessive release of ALT. 37 Furthermore, tumor progression causes the insufficient blood flow in the portal circulation to the liver.38,39 This is in line with the present findings that showed significant ALT elevation with the TCA group.
The histopathological findings of the current data confirm the occurrence of hepatic damage with pre-neoplastic FCAs. Indeed, pre-neoplastic clear cell foci are considered as one of the most common types of foci of cellular alteration which is consisted of normal or enlarged groups of cells with prominent cell membranes and distinct cytoplasmic clear spaces surrounding a densely stained centrally located nucleus. Some eosinophilic or basophilic cells were occasionally present within clear cell foci. These foci could play a role in liver tumor formation through metabolic changes in carbohydrate metabolism. 6 The results of the present study approved the development of such lesions in agreement with various studies. 9
Cellular proliferation plays a principal role in the multistep carcinogenesis process, including initiation, promotion, and progression, and has emerged as an important mechanism for HCC. PCNA, a cofactor of DNA polymerase, is directly implicated in DNA replication and represents an important marker for estimating proliferation during hepatocarcinogenesis. In addition, it is usually used as a reliable marker for assessment of tumor progression and clinical prognosis of patients with different malignancies. 40 It plays a major role in controlling the replication of eukaryotic DNA. With the increasing stages of lesions during tumor progression, there is a parallel increase in the proliferative activity as shown by PCNA immune-reactivity. 41 The current results demonstrated a high PCNA expression and labeling index (LI) in liver sections of the TCA-intoxicated group as previously reported 32 in the early phase of rat liver tumorigenesis.
Cell apoptosis is an ordered programmed cell death to maintain homeostasis, which is controlled by serial genes. The onset of apoptosis is controlled by numerous interrelating processes, including the receptor-mediated extrinsic pathway, the mitochondrial-mediated intrinsic pathway, and the cytotoxic granule component-mediated pathway. The extrinsic pathway is mainly mediated by the TNF receptor family members, such as TNFR1 and Fas. The intrinsic pathway is primarily activated by non-receptor stimuli, such as DNA damage, ER stress, metabolic stress, UV radiation, or growth factor deprivation. However, the final activation of the effector caspases, such as caspase-3, results in apoptosis whether in the extrinsic pathway or the intrinsic pathway; 15 cleaved caspase-3 is the active form of caspase-3 which is the main cleavage enzyme to stimulate apoptosis.42,43
The data of the present study showed decreased caspase-3 expression in the TCA-intoxicated group. This is consistent with Motohashi et al., 1999, and Walgren et al., 2005.44,45
Induction of various inflammatory processes and oxidative stress during the premalignant and malignant stages can damage cellular structures through lipid peroxidation of cell membranes. O2− interacts with lipid to compose lipid peroxides followed by β‐oxidation to form MDA. 46 MDA has been proved to be mutagenic and could be involved in tumorigenesis; it is the most reliable indicator for estimating oxidative stress.47,48 The current study reveals that TCA significantly increased the hepatic MDA level compared to the control group; this is in agreement with previous studies. 49 Also, Ayaz, et al., 2017, 50 showed increased hepatic MDA levels in TCA-induced oxidative stress in mice.
GSH is the most critical non-enzymatic intracellular antioxidant; it acts as a regulator of cellular redox state to protect cells from the damage of lipid peroxides, ROS, and xenobiotics. GSH causes maintenance of healthy levels of ROS; however, the increased ROS levels in some tumor cells are commonly associated with decreased expression of cellular antioxidant systems as GSH.51,52 The current study shows a significant decrease in hepatic GSH level in the TCA-intoxicated group as previously detected by Hassoun and Cearfoss (2014). 53 That is mostly due to the excessive release of harmful free radicals.
The estimation of the total oxidant/antioxidant status might be performed by measurement of serum TAC. This is considered to be the cumulative action of all antioxidant enzymes in the body. The capacity of those antioxidants is evaluated via the detection of TAC reflecting the balance between oxidants and antioxidants.54,55 The present data showed that TCA decreased the serum TAC level; this is in agreement with Fouad et al., 2017. 56
Cytokines especially IL-1 are so important in initiation and the progression of hepatic carcinogenesis. 57 IL-1β is a critical inflammatory cytokine and is responsible for the mediation of inflammation inside tissues. It is a regulatory cytokine produced by tumor and immune cells. Moreover, it promotes liver tumorigenesis and HCC metastasis by enhancing the transcription of oncogenes such as hypoxia-inducible factor-1α (HIF-1α).58,59 That supports the findings of the present study which confirm the essential role of IL1β in the mediation of hepatic pre-neoplastic lesions. The current data demonstrated an increase in the IL-1 β level in the TCA-intoxicated group when compared to the control group; this is in agreement with Zekri et al., 2018, and Jia et al., 2012.58,60
The activation of HIF-1α gene transcription may participate in the signal transmission of cancer development. 61 The pre-neoplastic hepatic lesions showed increased levels of HIF-1α. This strongly suggests that HIF-1α contributes to the development of HCC. The expression of HIF-1α, along with histological changes, is significantly higher in pre-neoplastic tissues if compared to the control group. 61 The currently discussed immunohistochemical findings are consistent with Yao et al. 61
Another important parameter is the VEGF expression, which is crucial for angiogenesis and critical for the growth and development of HCC. 62 The binding of VEGF-A to its receptor stimulates a phosphorylation cascade which triggers many downstream cellular pathways, resulting in endothelial cells proliferation, migration, formation, and branching of newer vessels that are necessary for rapid tumor growth.63,64
There is an association between high tumor micro-vessels density and increased VEGF level with rapid disease progression and reduced survival; 65 this provides that the evaluation of VEGF-pathway–directed therapies is a promising approach for HCC treatment. 66
The current study showed that TCA caused a significant increase in VEGF protein level as compared to the normal control group, which was previously reported. 67
IL-1 induces HIF-1α protein which stimulates angiogenesis through its target gene. Moreover, early reports proved that IL-1β drives transcription of VEGF and its receptor VEGF-receptor 261,68–70 which indicates that IL-1 signaling has an important role in potentiating VEGF biology and increases its expression.71,72 That results in the facilitation of cell migration, formation of capillary blood vessels, more formation, and progression of cancer cells. 73
Co-administration of DIA significantly decreased serum ALT level compared to the TCA-intoxicated group as discussed by Bu et al., 2018. 74 This decrease is probably due to its antioxidant properties which prevent lipid peroxidation and keep the cell membrane integrity resulting in a reduction in ALT level. The antioxidant properties of DIA were confirmed in the form of a decrease in the hepatic MDA level, restoration of the hepatic GSH, and normalization of oxidant–antioxidant capacity by elevation of serum TAC level compared to the TCA-intoxicated group as previously reported.23,75–77
DIA as a potential anticancer agent can act on multiple protein targets in the apoptosis process. 15 The present data revealed that DIA increased caspase-3 expression; thus, it has an apoptotic effect which was previously described in a breast cancer model. 14
The main mechanism of action of DIA is by inhibition of the IL-1β system and the related downstream signaling.78–80 Thus, that it is expected that the co-administration of DIA to the TCA rats could decrease the IL-1β, VEGF level as suggested previously81–82 as well as HIF-1α expression. This explains the ability of DIA to suppress IL-1β–HIF-1α–VEGF pathway and its effective anti-dysplastic effect. This is supported in the present study by the improvement of the histopathological findings as previously reported 23 and the immunohistochemical expression of PCNA as the present data demonstrated that DIA significantly decreased the number of PCNA-positive hepatocytes and consequently PCNA LI.
So collectively, the current study provides DIA as a potential anti-tumor agent through its inhibitory effect on IL1-β, which subsequently inhibits HIF-1α and VEGF.
Furthermore, a recent study has explained the specific molecular mechanism of action of DIA that resulted in its anti-tumor effects against non-small-cell lung cancer. 83 Moreover, female cervical hyperkeratosis and endometrial hyperplasia was prevented by using DIA (50 mg/kg/day) and improved all the detected abnormal parameters by its antioxidant, anti-inflammatory, and apoptotic effects. 23
Conclusion
The current results provided new evidence that DIA ameliorates TCA-induced pre-neoplastic lesion by inhibiting HIF-1α–VEGF-A pathway through IL-1β suppression; approving its anticancer effect.
Footnotes
Acknowledgments
The authors greatly appreciate the Faculty of Medicine, Minia University for their permissions, facilities, and infrastructure that allowed conducting their research.
Declaration of conflicting interests
The author(s) declared no potential conflicts of interest with respect to the research, authorship, and/or publication of this article.
Funding
The author(s) received no financial support for the research, authorship, and/or publication of this article.