
Abstract
Colorectal carcinoma (CRC) is a leading malignant disease in most developed countries. In advanced stages it presents with metastatic dissemination and significant chemoresistance. Despite intensive studies, no convincing evidence has been published concerning the association of cadherins and epithelial-mesenchymal transition (EMT) as a direct cause of acquired chemoresistance in CRC. The present study was designed to investigate the role of E-cadherin in EMT and its associated chemosensitivity/chemoresistance in four immortalized CRC cell lines representing various stages of CRC development (i.e. HT29 and Caco-2—early, SW480 and SW620 late). The expression of E-cadherin gene CDH1 was downregulated by the specific siRNA. Cell proliferation and chemosensitivity to irinotecan (IT) and oxaliplatin (OPT) were detected using WST-1 and x-CELLigence Real Time analysis. Expression of selected EMT markers were tested and compared using RT-PCR and western blot analysis in both variants (E-cadherin silenced and non-silenced) of each cell line. We have discovered that downregulation of E-cadherin expression has a diverse effect on both cell proliferation as well as the expression of EMT markers in individual tested CRC cell lines, with Caco-2 cells being the most responsive. On the other hand, reduced E-cadherin expression resulted in increased sensitivity of all cell lines to IT and mostly to OPT which might be related to changes in intracellular metabolism of these drugs. These results suggest dichotomy of E-cadherin involvement in the phenotypic EMT spectrum of CRC and warrants further mechanistic studies.
Keywords
Introduction
Epithelial-to-mesenchymal transition (EMT) represents a reversible biological adaptive mechanism whereby upon physiological as well as pathological conditions epithelial cells transform into cells with the mesenchymal phenotype. Molecularly, individual cell populations undergoing EMT upregulate the expression of several genes such as those encoding certain transcription factors (i.e. Snail, Slug, ZEB 1/2, Twist1/2) which in turn influence expression of epithelial markers (i.e. suppression of E-cadherin or claudins) while supporting the expression of markers of mesenchymal differentiation, such as N-cadherin and vimentin. 1 This process occurs at certain stages of embryonic development and during wound healing where it helps in physiological programming of tissues and maintenance of their homeostasis. On the other hand, EMT may be induced during degenerative processes such as fibrosis and, in particular, in carcinogenesis where it remains an area of intensive research. 2
Activation of EMT is nowadays considered to occur at certain stage of tumor evolution whereby EMT-competent malignant cells acquire migratory and invasive abilities which constitute a prerequisite for successful systemic tumor dissemination. 3 In addition, EMT in malignant cells results an increased biological aggressiveness including changes in chemosensitivity. 4 Particular reasons concerning the relationship between EMT and chemosensitivity/chemoresistance remain incompletely defined. In different tumor types, it seems likely that the process is driven by context-dependent factors (f.e.morphological changes, increased cell motility or variable expressions of genes involved in EMT response) and individual sets of tumor cells. 5
Colorectal carcinoma (CRC) is one of the most frequent types of malignancy, namely in developed countries. At later stages the CRC cell show an enhanced chemoresistance associated with systemic dissemination. 6 EMT is a critical early event involved in invasion and metastasis of CRC where it is reported to be associated with changes in resistance to systemic treatment too. 7 Accordingly, several studies demonstrated the relationship between expression of cadherins and their clinical significance in CRC. The lower level of E-cadherin and higher level of N-cadherin in tumor tissue correlated significantly with local infiltration depth, tumor stage, vascular invasion, tumor grade and CA19-9 blood level. Moreover, N-cadherin overexpression was associated with advanced TNM stage, lymph node metastasis and distant metastasis in CRC patients. 8 Finally, reduced expression of E-cadherin was shown as a negative prognostic factor in several studies of colon adenocarcinoma.9–11
Despite these reports, no convincing evidence regarding the association of cadherins and EMT as a direct cause of acquired chemoresistance in CRC has been published so far. Therefore, the present study was focused on the role of E-cadherin in EMT and its associated chemosensitivity/chemoresistance in four immortalized CRC cell lines representing various stages of CRC development (i.e. HT29 and Caco-2—early, SW480 and SW620 late). In these cell lines, the expression of E-cadherin gene CDH1 was silenced using siRNA technology. Next, cell proliferation, EMT markers expressions and chemosensitivity to irinotecan (IT) and oxaliplatin (OPT) were tested and compared in both variants (E-cadherin expression silenced and non-silenced) of each cell line. Moreover, the accumulation of IT, its metabolites and OPT in these cell lines, were measured as well.
Materials and methods
Cell lines
Human epithelial CRC cell lines Caco-2, HT29, SW480 and SW620 were purchased from ATCC (LGC Standard, Poland). Cells were multiplied in three passages, frozen in aliquots and stored in liquid nitrogen. The absence of mycoplasma in all samples was periodically checked using PCR analysis. For every set of experiments new storage cells were retrieved. Cell lines were authenticated using STR profile DNA fragmentation analysis (Generi Biotech, Czech Republic). SW480, SW620 and HT29 cells were cultivated in DMEM supplemented with 10% FBS and 0.5% penicillin/streptomycin. Caco-2 cell line was cultured in EMEM supplemented with 10% FBS, 1% non-essential amino acids, 1% glutamine and 0.5% penicillin/streptomycin. Cells were grown in T-75cm2 culture flasks in a humidified atmosphere containing 5%CO2 at 37°C.
Cell transfection
The E-cadherin (CDH1) siRNA (Silencer® Pre-designed siRNA CDH1; Life technologies—AmbionAM16708) and control siRNA transfections (SignalSilence® Control siRNA (Fluorescein Conjugate) #6201) were performed using X-treme gene transfection reagent (Roche) in Opti-MEM (Invitrogen, USA) according to the manufacturer’s protocol with a final siRNA concentration 10, 20 or 50 nM for siCDH1 and 100 nM for control siRNA transfection. The cells were cultivated in 96-well plates, 6-well plates or Petri dishes for 24 h up to 70–80% confluency. The cell density of seeded cells depended on the growth and proliferation of each cell type. SW620 and SW480 were seeded at the concentration of 60,000 cells/ml; Caco-2 cells were seeded at the concentration of 50,000 cells/ml and HT29 were seeded at the concentration of 75,000 cells/ml. The transfection reagent was removed after 48 h incubation and the cells were seeded for various assays or analyses with or without the exposure to IT or OPT.
Cell proliferation assay
Proliferation of all cell lines was tested using x-CELLigence real time cell analysis system. This non-invasive approach allows detection of cell adherence, morphology and/or viability without any additional labeling or potentially destructive manipulation with cells. The detection in real time is enabled by interdigitated microelectrodes integrated at the bottom of tissue culture E-plates and the relative differences between cells are displayed as arbitrary units called cell index. First, 90 µl of cultivation medium was added into each well of E-plate and the background value was determined. Then, 110 µl of cell suspension of siCDH1 treated (20 nM concentration) or control siRNA (100 nM concentration) treated cells (SW480 and SW620 at 60,000 cells/ml; Caco-2 at 50,000 cells/ml and HT29 at 75,000 cells/ml) was transferred into an E-plate and incubated for 30 min (5%CO2, 37°C). The plate was then inserted into the device and impedance was measured each 1 h for 99 h. Each sample was assayed in quadruplicate and three independent experiments were conducted. Based on acquired cell index, data were expressed as % of untreated control (100% = siCDH1 untreated cells after 99 h measurement).
Cell viability assay
Cell viability of untreated and siCDH treated colon cancer cells (Caco-2, HT29, SW480 and SW620) alone or exposed to IT and OPT was evaluated using WST-1 assay (Roche) 48 h post transfection. This end-point detection assay quantifies cell viability by measuring intracellular activity of mitochondrial enzymes. Cells (SW480, Sw620, Caco-2 and HT29) were plated in 96-well plates and after 24 h cultivation were treated with siCDH1 or with control siRNA for further 48 h. In case of drug exposure, siCDH1 treated (20 nM concentration) or control siRNA (100 nM concentration) treated cells were exposed to various concentrations of IT (500; 250; 100; 50; 25, 10 µg/ml) and OPT (500; 250; 100; 50; 25, 10 µg/ml) for further 48 h. At the end, cells were rinsed with 100 µl of PBS and then 100 µl of WST-1 solution (1:20 final dilution) was added. Finally, the absorbance was measured after 2 h incubation (5% CO2, 37°C) at 450 nm with 650 nm by Tecan Infinite M200 spectrophotometer (Tecan, Switzerland).
Reverse transcriptase-polymerase chain reaction (RT-PCR) analysis
Total RNA was isolated from siCDH1 treated and untreated cells using Direct-zol RNA MiniPrep kit according to the manufacturer’s instructions (ZymoResearch, Irvine, CA, USA). RNA concentration and purity were determined spectrophotometrically using NanoDrop 2000 (Thermo Fisher Scientific). All samples had absorption ratio A260/A280 greater than 1.8. RNA integrity was checked using Agilent 2100 Bioanalyzer and samples with RIN higher than 9.0 were used for further analysis. First strand cDNA synthesis and qPCR analysis were performed in Corbett Rotor-Gene Q 5plex HRM (Corbett Research) or LightCycler® 96 Instrument (Roche Life Science) as described in Skarkova et al. study. 12 Primers were designed manually, and their sequences are attached as a supplementary file (Supplementary S1_table_primer sequences). Calculations were based on delta-delta Cq method 13 and expressed as fold change of the treated groups relative to the control. Glyceraldehyde 3-phosphate dehydrogenase (GAPDH) and beta-2-microglobulin (B2M) were used as reference genes for mRNA analysis and miR-16 was used as reference gene for miRNA analysis.
Western blot analysis
siCDH1 treated cells and untreated controls (Caco-2, HT29, SW480 and SW620) were exposed to IT and OPT at the concentration corresponding to IC75 value for 48 h. Then, the cells were washed with PBS and harvested in ice-cold lysis buffer. Amount of protein was determined in cell lysates using BCA assay. Detailed description of SDS- PAGE of diluted cell lysates (30 µg/well), protein transfer to PVDF membrane antibodies incubation and protein detection is summarized in Hanusova et al study. 14 The following primary antibodies from Cell signaling technology were used: polyclonal rabbit anti-E-cadherin 1:2,000; polyclonal rabbit anti-N-cadherin 1:1,500; polyclonal rabbit anti-vimentin, 1:2,000; monoclonal rabbit anti-CD44, 1:2,000. Monoclonal mouse β-actin, 1:10,000 was from Sigma Aldrich.
Mass spectrometry analysis
siCDH1 treated cells and untreated controls (Caco-2, HT29, SW480 and SW620) were plated in 6-well plates at density of 150,000 cells/ml and cultivated in medium containing 20 µg/ml of IT or 50 µg/ml concentration of OPT for 4 and 8 h. The concentration of DMSO in medium was 0.1%. The cells were collected into 500 µl of sterile distilled water. The amount of total proteins in the homogenates from the cell suspension was measured using a bicinchoninic acid (BCA) assay (Sigma Aldrich) according to the manufacturer’s protocol.
Detection of IT and its metabolite SN-38 was performed on the Agilent 1290 Infinity II UHPLC system coupled to the Agilent 6470 QqQ mass spectrometer. Chromatographic conditions were maintained at gradient elution of 0.4 ml/min by 0.1% formic acid in water and methanol (0–0.1 90:10, 0.1–3.0 gradient to 70:30, 3.0–4.0 10:90, 4.0–5.0 90:10), thermostated autosampler set to 15°C and column thermostat equipped with the Zorbax Eclipse plus RRHD C18 2.1 × 50 mm, 1.8 µm (PN 959757-902) column kept to 30°C. MS source parameters were set to the following: drying gas 260°C at 8 l/min, sheath gas 400°C at 12 l/min, nebulizer pressure 25 psi, capillary voltage 4000 V and nozzle voltage 300 V. Transitions of [M+H]+ ions m/z were detected with setting of dwell time 20 ms, cell acceleration 4 V, fragmentor 172 V for 587→195, 167, 124 and 110 (collision energy—CE 32, 48, 40 and 40 V).
Detection of OPT was performed on the Agilent 1290 Infinity II UHPLC system coupled to the Agilent 6470 QqQ mass spectrometer. Chromatographic conditions were maintained at gradient elution of 0.4 ml/min by 0.1% formic acid in water and methanol (0–0.5 95:5, 0.5–3.0 gradient to 5:95, 3.0–4.0 5:95, 4.0–5.0 95:5), thermostated autosampler set to 15°C and column thermostat equipped with the Zorbax Eclipse plus RRHD C18 2.1 × 50 mm, 1.8 µm (PN 959757-902) column kept to 30°C. MS source parameters were set to the following: drying gas 200°C at 6 l/min, sheath gas 400°C at 10 l/min, nebulizer pressure 35 psi, capillary voltage 3000 V, nozzle voltage 300 V. Transitions of [M+H]+ ions m/z were detected with setting of dwell time 160 ms, cell acceleration 4 V and fragmentor 105 V for 398→306, 96 and 79 (collision energy—CE 24, 40 and 60 V).
Statistical analysis
Data are expressed as the mean ± SD of averages from at least two experiments. Statistical analysis was carried out using two way analysis of variance (ANOVA) followed by Sidak´s multiple comparison test significant at a level of p < 0.05. Data analysis was performed using GraphPad Prism 6.0. The concentration of selective inhibitor causing a 50% decrease in cell viability (IC50) was determined by GraphPad Prism 6.0.
Results
Four different cell lines representing diverse stages of CRC; i.e. Caco-2, HT29, SW480 and SW620, were selected for RNA silencing of E-cadherin (CDH1). The effect of silencing was determined and compared on mRNA level (Figure 1) using RT-PCR analysis and on protein level (Figure 5) using western blot analysis, respectively. First, silencing efficiency of the three different concentrations CDH1-specific siRNA (10 nM, 20 nM and 50 nM) were compared, with the 20 nM concentration being chosen as the most effective (data not shown). As shown in Figure 1, there were rather significant differences in CDH1 mRNA levels between all tested cell lines, with the highest level observed in Caco-2 cells while the lowest one being detected in SW620 cells. The efficiency of silencing was successful in all tested cell lines both on mRNA (Figure 1) and protein levels (Figure 5). The overall CDH1 silencing efficiency was as follows: CDH1 in SW480 was downregulated most successfully to 18% (mRNA level), resp. 0% (protein level) of the original expression, whereas CDH1 in Caco-2 and HT29 cells were both reduced to about 40% (mRNA and protein levels) of the original expression. The expression of E-cadherin in SW620 cells was decreased up to 24% (mRNA level), resp. 0% (protein level).
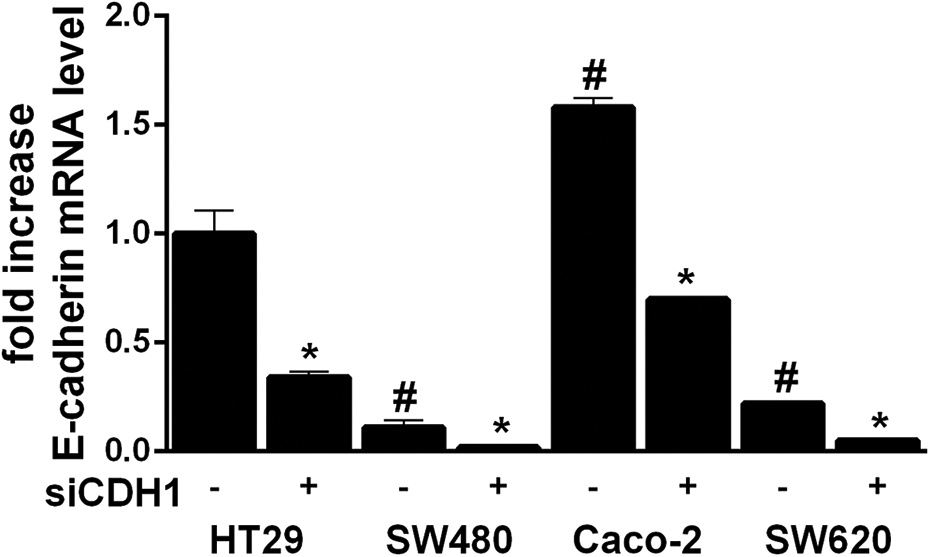
The effect of RNA silencing of E-cadherin (CDH1) expression in colon cancer cells HT 29, SW480, Caco-2 and SW620. The cells were treated using control siRNA (100 nM final concentration) or siCDH1 (20 nM final concentration) for 48 h. E-cadherin expression was determined using RT-PCR analysis. GAPDH was used as a reference gene. *p < 0.05 siCDH1 treated vs untreated cells; #p < 0.05 vs untreated cells.
Next, the influence of siCDH1 silencing on cell viability and proliferation in tested CRC cell lines was determined and compared. Cell viability was evaluated after 48 h following siCDH1 transfection with help of WST-1 assay (Figure 2(A)). Viability of HT29, SW480 and SW620 cells with or without downregulated E-cadherin expression remained very similar. Conversely, a significantly higher viability was found in siCDH1 treated Caco-2 cells which corresponded to their markedly higher proliferation 60 h post transfection too (Figure 2(C)). On the other hand, siCDH1 treated SW480 cells showed a significantly lower proliferation although at a very late time interval (80 h post transfection). Proliferation of other two tested cell lines, i.e. HT29 and SW620, showed no difference irrespective of their E-cadherin expression (Figure 2(C)).

The effect of CDH1 silencing on cell (A) viability after 48 h,(B)chemosensitivity to IT and OPT after 48 h treatment (IC50 value) and (C) proliferation after 99 h of HT 29, SW480, Caco-2 and SW620 CRC cell lines (siCDH1 treated or untreated). The cells were treated using control siRNA (100 nM final concentration) or siCDH1 (20 nM final concentration) for 48 h. The determination of cell viability was performed using WST-1 assay and cell proliferation was measured using X-CELLigence real time cell analysis system. *p < 0.05 siCDH1 treated vs untreated cells.
Since E-cadherin and its loss are associated with EMT, the effect of siCDH1 silencing on expression of selected EMT markers was detected using first RT-PCR 48 h post transfection. Of all targeted EMT markers, the most significant differences in their mRNA levels were found in Caco-2 cells wheresiCDH1 silencing increased the expression of almost all molecules including N-cadherin, ZEB1, ZEB2, MMP2, MMP9, CD44 and vimentin. In SW620 cells, siCDH1 silencing elevated ZEB1, miR-2, CD44 and vimentin expression while the expression of ZEB2, MMP2 and MMP9 significantly decreased. In SW480 cells, siCDH1 silencing markedly enhanced the expression of miR-21, ZEB-1 and vimentin. Finally, HT-29 cells proved to be the least influenced by E-cadherin downregulation which resulted in a significantly reduced MMP-2 expression only (Figure 3).

Comparison of expression of selected EMT markers (N-cadherin, ZEB1, ZEB2, MMP2, MMP9, CD44 and vimentin) on mRNA level and related microRNA (miR-21, miR200a) in HT 29, SW480, Caco-2 and SW620 cell lines (siCDH1 treated or untreated). The cells were treated using control siRNA (100 nM final concentration) or siCDH1 (20 nM final concentration) for 48 h. Relative quantification of EMT markers was performed using RT-PCR analysis. GAPDH was used as a reference gene. *p < 0.05 siCDH1 treated vs untreated cells.
Due to the reported influence of E-cadherin expression and associated EMT on chemoresistance of CRC cells to cytostatics, employed HT29, SW480, Caco-2 and SW620 cell lines (siCDH1 treated and siCDH1 untreated) were exposed to IT and OPT and their IC50 values determined with WST-1 assay. A significantly lower IC50 values were observed in all siCDH1 transfected cells, compared to untreated ones after 48 h of IT treatment. On the other hand, OPT treatment produced the similar effect in HT29 and SW620 cells only (Figure 2 (B)).
Based on discovered differences in chemosensitivities of the employed CRC cell lines with normal or reduced E-cadherin expression, we sought to determine the expressions of selected EMT markers following the treatment with IT and OPT. In CDH1 silenced variants of all tested CRC cell lines except SW620, a significant elevation of CD44 and vimentin protein abundance was detected.
Effects of IT and OPT on individual EMT markers expression upon E-cadherin silencing showed considerable variability in particular cell lines. Thus, the protein level of CD44 was significantly reduced after IT and OPT treatment in HT29 CDH1 silenced cells, compared to HT29 with normal E-cadherin expression. On the other hand, in siCDH1 untreated SW480 cells CD44 protein levels significantly increased after OPT treatment, while in siCDH1 treated cells neither of two cytostatics proved to be effective. In Caco-2 cells, both IT and OPT increased CD44 protein levels (cells with normal E-cadherin expression) while similar effect was observed after IT exposure only in case of cells with dowregulated E-cadherin expression. In SW620 cells no effects on CD44 protein expression were observed irrespective of employed cytostatics or E-cadherin expression silencing. Concerning vimentin expression patterns, generally in all cell lines, IT and or OPT tended to increase vimentin protein levels (more than in siCDH1 variants) although an opposite (HT-29 cells) or no effect (SW480 cells) was noted too. Finally, N-cadherin protein levels did not change upon all the employed treatment schemes in all tested cell lines save in case of HT-29 cells (normal E-cadherin expression) exposed to IT (Figure 4).

The effect of irinotecan (IT) or oxaliplatin (OPT) treatment on protein expression of selected markers (E-cadherin, N-cadherin, CD44, vimentin) in HT29, SW480, Caco-2 and SW620 cell lines (siCDH1 treated or untreated). The cells were treated using control siRNA (100 nM final concentration) or siCDH1 (20 nM final concentration) for 48 h. Relative quantification was performed using western blot analysis. β-actin was used as a reference protein. *p < 0.05 siCDH1 treated vs untreated cells; #p < 0.05 vs untreated cells.
Further, we were interested about the amount of IT and its main active metabolite SN-38, as well as OPT inside the cells (siCDH1 treated or untreated) during two-time intervals (4 h and 8 h). The accumulation of IT and OPT inside SW480, SW620, HT29 and Caco-2 cells and its CDH1 silenced variant was measured using LC-MS analysis and compared. Higher amount of OPT was detected in a silenced variant of the SW480 cells at both time intervalswith an overall time-dependent increasing accumulation. Elevated accumulation of OPT inside HT29 and SW480 cells was shown in 8 h time interval only (Figure 5). Significant increase in intracellular IT and SN-38 accumulation between siCDH1 treated and untreated variant was observed in SW480 cells after 8 h treatment. Conversely, decreased amount of IT and SN-38 was found in SW620 in siCDH1 variant after 4 h treatment only (Figure 6).

MS analysis of oxaliplatin (OPT) in colon cancer cells SW480, SW620, HT29 and Caco-2 and its corresponding CDH1 silenced cells. The cells were treated using control siRNA (100 nM final concentration) or siCDH1 (20 nM final concentration) for 48 h, followed by 4 h, resp. 8 h treatment of OPT. The data are expressed as percentage of OPT inside the cells per mg of protein. Amount of both drugs was determined by MS/MS analysis. Measurements were performed in two independent experiments. *p < 0.05 siCDH1 treated vs untreated cells; #p < 0.05 8 h time interval vs 4 h time interval.
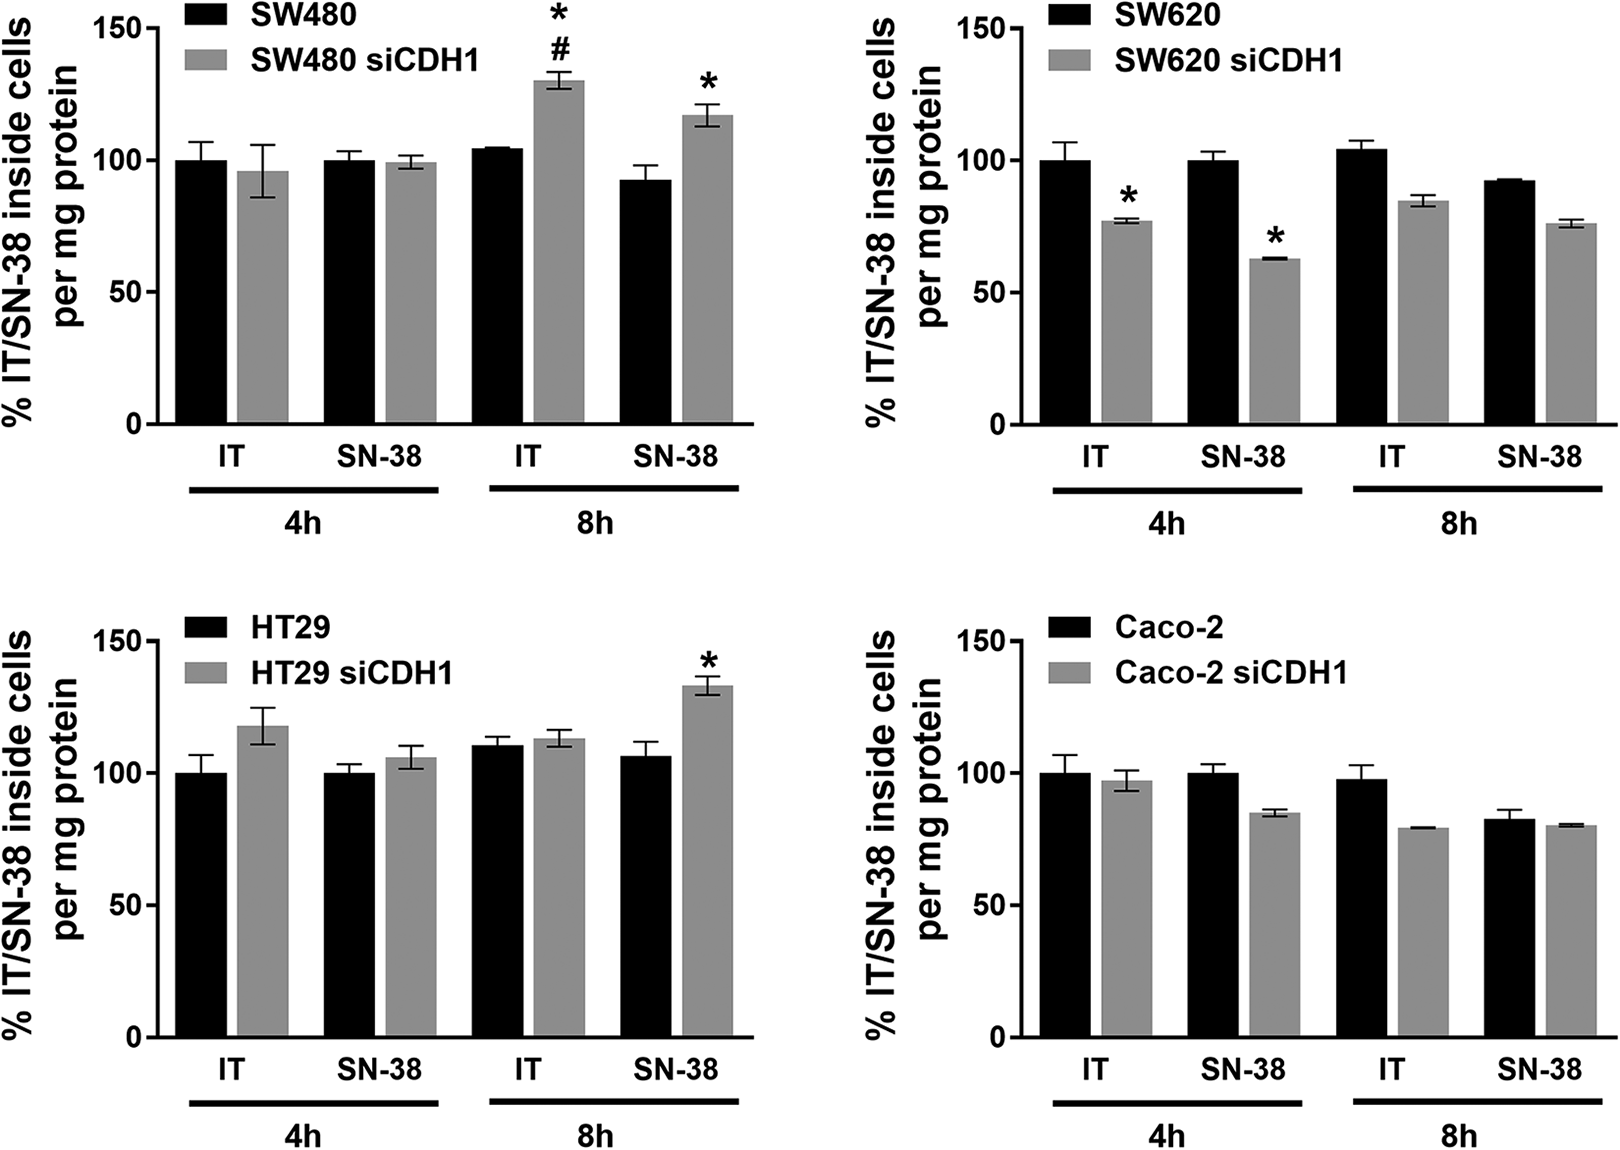
MS analysis of irinotecan (IT) and its main metabolite SN-38 in colon cancer cells SW480, SW620, HT29 and Caco-2 and its corresponding CDH1 silenced cells. The cells were treated using control siRNA (100 nM final concentration) or siCDH1 (20 nM final concentration) for 48 h, followed by 4 h, resp. 8 h treatment of IT. The data are expressed as percentage of IT or SN-38 inside the cells per mg of protein. Amount of both drugs was determined by MS/MS analysis. Measurements were performed in two independent experiments. *p < 0.05 siCDH1 treated vs untreated cells; #p < 0.05 8 h time interval vs 4 h time interval.
Discussion
One of the key hallmarks of EMT is a loss of E-cadherin expression, in particular in the cell membrane. It has been reported that E-cadherin expression could be altered by several genetic as well as epigenetic mechanisms. These include somatic or germ-line mutations in CDH1 gene or CpG-island hypermethylation of the CDH1 gene promoter, as seen in several types of human malignancies (lobular breast carcinoma, diffuse gastric carcinoma). Based on the available literature, however, the most frequent event leading to the E-cadherin loss appears to be silencing of CDH1 gene expression by specific transcription factors. These transcriptional repressors interact with E-boxes located in the proximal CDH1 gene promoter and include the basic helix-loop-helix (bHLH) family members twist and the E2A gen product E12/47, members of the Snail family; e.g. Snail1 and Snail2, and members of the zinc finger homeobox family of repressors, ZEB1 and ZEB2.15,16 Furthermore, some of these transcriptional repressors (ZEB1 and ZEB2) may simultaneously suppress the expression of some members of miR-200 family, which support E-cadherin production and epithelial differentiation. 17
Due to the fact that EMT and its dependent loss of E-cadherin occur early in CRC evolution, we attempted to gain more mechanistic details over the relationship between E-cadherin loss and development of chemoresistance. We used four established CRC cell lines (HT29, CaCo-2, SW480 and SW620) which represent different stages of CRC development with corresponding differences in their E-cadherin expression. We successfully silenced this expression using gene knockdown approach and in these manipulated cells we measured various parameters including cell viability and proliferation, expression of characteristic EMT markers as well as an overall cellular sensitivity/resistance to cytostatics IT and OPT. Our data suggest that upon silencing of E-cadherin expression, individual cell lines reacted distinctly irrespective of the level of their original E-cadherin expression or CRC stage. The most responsive proved to be the CaCo-2 cells which upregulated expression of most determined EMT markers both on mRNA and protein levels and these changes were associated with an elevated cell proliferation rate. On the other hand, in SW620 cells where downregulated E-cadherin expression resulted in a significant appearance of the several followed EMT markers too, albeit only on mRNA level, similar changes in proliferation were not noted. The remaining two cell lines (HT29 and SW480) responded to knockdown of E-cadherin expression at the lowest value and with a high degree of variability in EMT markers appearance as well as with proliferation rates. All those results seem to suggest that loss of E-cadherin expression induces a variable extent of EMT in particular CRC cell lines which is in accordance with modern view of EMT process itself which is understood as a continuum rather than an obligatory terminal event.3,18,19 Secondly, the suppressed presence of E-cadherin in CRC cells had a differing impact on their proliferation, with both increase, decrease or absence of effect being present. We do not have any specific explanation for this observation which was clearly not linked to the efficiency of silencing process itself. Still, a varying overall presence of E-cadherin in the cell could have exerted some influence.Since one possible factor may have been the total amount of E-cadherin protein present, its subcellular localization and intracellular signaling.
The second objective of the present study was to evaluate the effect of CDH1 silencing on the appearance of EMT markers in the tested cell lines exposed to chemotherapy (IT and OPT) while determining their individual responsiveness to the used compounds. In some of our cell lines with silenced CDH1, both IT and OPT significantly influenced the protein expression of vimentin (increase) and/or CD44 (decrease) but not N-cadherin. This finding thus emphasizes the differential response of individual molecules involved in EMT to cytostatics exposure in individual cell lines. Also, it does not fully confirm earlier observations of cytostatics-dependent stimulation of EMT in CRC.20,21 E-cadherin is a transmembrane junctional protein responsible for intercellular adhesion. In addition, it has been labeled as tumor suppressor as well as chemoprotectant as presented and discussed previously. 22 This view is, however, contradicted by the accepted EMT paradigm, which links the loss of E-cadherin (epithelial programming) to increased chemoresistance.21,23 Here our results clearly indicate that markedly lower expression of E-cadherin protein in the employed CRC cell lines positively correlates with their responsiveness to either IT or OPT. A very recently published work, which examined the same phenomenon in primary CRC lines, showed the same conclusion. The authors hypothesized that relocation of residual E-cadherin protein from the cell membrane to cytoplasm or nucleus might be related to chemosensitivity. 24 While it remains an interesting possibility to be explored in the future, we believe that at least in our model other mechanisms were likely activated such drug-dependent changes in their intracellular drug metabolism or efflux. Our data from MS analysis showed significant elevation of OPT inside the cells (SW480, SW620 and HT29) in 8-h time interval in cell lines with silenced CDH1, which is in consistent with IC50 values, where these cell lines were more chemosensitive to OPT. On the other hand, IT and its main metabolite SN-38 confirmed this trend just in SW480 cell line. Time intervals 4 h and 8 h were chosen for drug accumulation inside the cells for our experiments as they give enough information about drug level and cell lines were did not show evidence of cell death. The amount of the drugs inside the cells further increased in time, but longer intervals caused cell death and thus drug leaching outside the cells.Thus the impact of E-cadherin loss on cytostatics intracellular management in CRC cells needs to be determined in future studies as well as the potential involvement of related autophagy given its role in CRC chemoresistance.25,26
Conclusions
Our experimental study shows that silencing of E-cadherin expression in various CRC cell lines results in a variable extent of EMT as well as of proliferation rate. Thus, manipulated cells are mostly more sensitive to IT and OPT which might be partially linked to changes in intracellular management of these drugs.
Supplemental Material
Supplemental Material, sj-pdf-1-het-10.1177_09603271211021479 - Silencing of E-cadherin expression leads to increased chemosensitivity to irinotecan and oxaliplatin in colorectal cancer cell lines
Supplemental Material, sj-pdf-1-het-10.1177_09603271211021479 for Silencing of E-cadherin expression leads to increased chemosensitivity to irinotecan and oxaliplatin in colorectal cancer cell lines by Veronika Skarkova, Adam Skarka, Monika Manethova, Afroditi A Stefanidi and Emil Rudolf in Human & Experimental Toxicology
Footnotes
Author contributions
Conceptualization, V.S. and E.R.; Methodology, V.S., M.M. and A.S.; Software, V.S.; Validation, V.S. and A.S.; Formal Analysis, V.S. and M.M.; Investigation, V.S.; Resources, V.S.; Writing—Original Draft Preparation, V.S.; Writing—Review & Editing, E.R.; Visualization, A.S.; Supervision, E.R.; Project Administration, V.S.; Funding Acquisition, E.R.
Declaration of conflicting interests
The author(s) declared no potential conflicts of interest with respect to the research, authorship, and/or publication of this article.
Funding
The author(s) disclosed receipt of the following financial support for the research, authorship, and/or publication of this article: This work was supported by Grant agency of Czech Republic (17-0331S), by the Charles University (program PROGRES Q40/01) and by the University of Hradec Kralove (Faculty of Science, VT2021).
Supplemental Material
Supplemental material for this article is available online.
References
Supplementary Material
Please find the following supplemental material available below.
For Open Access articles published under a Creative Commons License, all supplemental material carries the same license as the article it is associated with.
For non-Open Access articles published, all supplemental material carries a non-exclusive license, and permission requests for re-use of supplemental material or any part of supplemental material shall be sent directly to the copyright owner as specified in the copyright notice associated with the article.