
Abstract
Lead is a ubiquitous heavy metal toxin of significant public health concern. Every individual varies in their response to lead’s toxic effects due to underlying genetic variations in lead metabolizing enzymes or proteins distributed in the population. Earlier studies, including our lab, have attributed the influence of ALAD (δ-Aminolevulinate dehydratase) polymorphism on blood lead retention and ALAD activity. The present study aimed to investigate the influence of VDR (Vitamin D receptor) and HFE (Hemochromatosis) polymorphisms in modulating blood lead levels (BLLs) of occupationally exposed workers. 164 lead-exposed subjects involved in lead alloy manufacturing and battery breaking and recycling processes and 160 unexposed controls with BLLs below 10 µg/dL recruited in the study. Blood lead levels, along with a battery of biochemical assays and genotyping, were performed. Regression analysis revealed a negative influence of BLLs on ALAD activity (p < 0.0001) and a positive influence on smokeless tobacco use (p < 0.001) in lead-exposed subjects. A predicted haplotype of the three VDR polymorphisms computed from genotyping data revealed that T-A-A haplotype increased the BLLs by 0.93 units (p ≤ 0.05) and C-C-A haplotype decreased the BLLs by 7.25 units (p ≤ 0.05). Further analysis revealed that the wild-type CC genotype of HFE H63D presented a higher median BLL, indicating that variant C allele may have a role in increasing the concentration of lead. Hence, the polymorphism of genes associated with lead metabolism might aid in predicting genetic predisposition to lead and its associated effects.
Introduction
Lead poisoning is a public health issue in India and worldwide, affecting both young and aging populations. Exposure to lead can occur via environmental and occupational means virtually affecting every organ system in the body. 1 Lead exposure occurs via inhalation, ingestion, and dermal contact. The most common lead poisoning symptoms include headache, lack of appetite, weight loss, muscle weakness, joint pain, lethargy, insomnia, irritability, unusual taste in the mouth, decreased libido, and personality changes. 2,3 The half-life of lead in blood is about 35 days, while in soft tissues (renal cortex, liver, lung, brain, teeth), it is 40 days, and in the bone, it is 20–30 years. 4 About 99% of lead bind to erythrocytes, of which 80% binds to ALAD and the remaining 1% to plasma. 5,6 Environmental sources are the major contributors to elevated BLLs among the general population; hence, exposure can occur via multiple sources such as contaminated food and drinking water, house dust, paint, gasoline, cosmetics, and lead-glazed ceramics. 7 The National Health and Nutrition Examination Survey has shown that the average adult BLLs of the leaded gasoline era declined from 15 to 1–2 µg/dL. 8 –11 However, pockets of high exposure, i.e. industries involved in lead-based activities such as smelting and refining, reclaiming and manufacturing of acid-storage batteries, steel welding or cutting operations, flame soldering, and production of rubber products, plastics, printing ink, and ammunition, continue to persist contributing more than 80% of elevated BLLs in the workplace despite following safety guidelines. 12,13 The U.S. Department of Health and Human Services has established 10 µg/dL as the permissible BLL in adults while the Occupational Safety and Health Administration (OSHA) has set 40 µg/dL the highest BLL acceptable for lead-exposed workers. 14,15
Lead exhibits an ion mimicking property since it shares similar divalent characteristics with essential metal ions such as iron, magnesium, calcium, and monovalent ion sodium; hence, interfering with cellular metabolism. 16 Several studies have attributed BLLs to genetic markers such as ALAD, VDR, and HFE. 17 A previous study from our lab showed that lead-exposed ALAD 1-2 carriers were significantly predisposed to high BLLs compared to ALAD 1-1 carriers. 18 Similarly, other studies have reported the influence of calcium and iron regulatory genetic markers on BLLs. One such genetic marker is VDR, which is chiefly associated with calcium metabolism and bone biology. 19 Lead interferes with calcium levels by binding to calbindin-D, regulated by VDR; hence, making calbindin-D unavailable for calcium and enhancing tissue and bone lead burden. 17 Earlier studies have identified VDR single nucleotide polymorphisms (SNPs) spanning the 5’ UTR, promoter, and 3’ UTR regions of the gene. In the present study, three VDR polymorphisms—rs1544410 and rs7975232—both located at intron 8, and rs731236 located at exon 9 in the 3’ UTR region were selected, as earlier studies have reported a strong linkage disequilibrium (LD) between them compared to SNPs found in other regions of the gene. 20,21 Several epidemiological studies on lead-exposed subjects have reported that circulating levels of lead could be under the genetic control of VDR. 22 Hence, VDR polymorphism may influence the toxicokinetics of lead. Likewise, SNPs of the hemochromatosis (HFE) are of interest in lead exposure studies since iron influences the gastrointestinal absorption, transfer, and storage of lead. 23 HFE is a major histocompatibility complex class-I like integral membrane protein, which regulates intestinal iron absorption. Studies have shown that body iron burden is negatively associated with lead absorption; hence, HFE polymorphisms may modify body lead burden. 24 Among these, H63D and C282Y polymorphisms modify the structure of HFE, thereby altering the regulation of iron levels. Since lead also shares similar divalent characteristics with iron, the HFE polymorphism may influence lead toxicokinetics. Hence, such studies will help identify individuals susceptible to lead toxicity. The current study investigated whether VDR (rs1544410, rs7975232, and rs731236) and HFE (rs1799945 and rs1800562) polymorphisms modified the BLLs in lead-exposed subjects compared to unexposed controls.
Materials and methods
Ethical statement
The Institutional Ethics Committee of Kasturba Medical College, Manipal, India (Registration No. ECR/146/Inst/KA/2013) approved the study. The experimental procedure, according to the Declaration of Helsinki, 1964, was followed. The present study is a cross-sectional involving simple random sampling of 164 lead-exposed subjects actively involved in lead alloy manufacturing and battery breaking and recycling processes, and 160 unexposed controls with BLLs below 10 µg/dL of both genders in the age group between 18 and 65 years. Subjects from Mangaluru taluk of Dakshina Kannada district, Karnataka, India, were selected. All the study participants were interviewed through a structured proforma and written informed consent, and their blood samples were collected. The proforma included information about occupation, use of personal protective equipment, the period of employment, mode of contact with lead, personal hygiene and status of smoking, tobacco chewing, and alcohol intake.
Inclusion and exclusion criteria of study participants
Individuals involved in lead-based activities were selected for the study and considered as lead-exposed subjects. Exposed subjects excluded from the study are those undergoing chelation therapy. Individuals with no involvement in lead-based activities, living away from contaminated lead-based industrial sites, and BLLs below CDC acceptable levels of 10 µg/dL were considered controls. Control individuals excluded from the study included those with BLLs above the acceptable range and undergoing chelation or other treatments.
Sample collection
About 9 mL of venous blood into three sterile vacuum tubes was collected. The activity of ALAD was determined using heparinized blood. The blood lead concentration, complete hematogram, and extraction of genomic DNA performed using EDTA blood. Serum was collected to estimate the total protein and function of hepatic enzymes, such as serum glutamate oxaloacetate transaminase (SGOT/ EC # 2.6.1.1) and serum glutamate pyruvate transaminase (SGPT/ EC # 2.6.1.2).
Biochemical assessments
Determination of BLL and other clinical parameters
The blood lead concentration was determined by differential pulse anodic stripping voltammetry (DPASV) using the ESA model 3010B Lead Analyzer (ESA, Inc., Chelmsford, MA, USA). Hematological parameters including total RBC and WBC count, hematocrit, hemoglobin, mean corpuscular volume (MCV), mean corpuscular hemoglobin (MCH) and mean corpuscular hemoglobin concentration (MCHC) was measured using the Fully Automated Hematology Analyzer Sysmex XP100 (ERBA Mannheim GmbH Group, Germany). Total protein and hepatic enzyme function tests (SGOT/ SGPT) performed using the Automated Random Access Clinical Chemistry Analyzer EM200 (ERBA Mannheim GmbH Group, Germany).
Erythrocyte ALAD activity
The procedure for estimation of erythrocyte ALAD activity followed according to Tomokuni 25 and the formula used to measure the activity is,
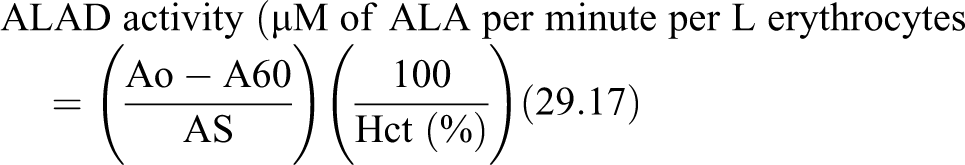
where Ao = Absorbance of blank, A60 = Absorbance of test, As = Absorbance of ALA standard (0.1 mM/L), 29.17 = dilution factor (0.1 × 3.5/0.2 × 1000 × 1/60), Hct = Hematocrit of the sample.
Genetic analyses
Genomic DNA was isolated from lymphocytes by following the standard phenol-chloroform method and stored at −20°C until processed. 26 The isolated DNA was subjected to polymerase chain reaction-restriction fragment length polymorphism (PCR-RFLP) to determine selected VDR and HFE SNPs’ genotype. The sequence containing the single nucleotide change obtained from dbSNP (https://www.ncbi.nlm.nih.gov/projects/SNP/) was selected to design primers using Primer3 Input version 0.4.0 (http://bioinfo.ut.ee/primer3-0.4.0/). The amplification was optimized using in-silico PCR (https://genome.ucsc.edu/cgi-bin/hgPcr). The presence of the restriction site was confirmed using neb cutter (http://nc2.neb.com/NEBcutter2/). The restriction enzymes for VDR (rs1544410, rs7975232, and rs731236) and HFE (rs1799945 and rs1800562) were selected as previously described. 27 –29 Table S1 (Supplementary material) represents the dbSNP ID, primer sequence, restriction enzyme, annealing temperatures, and restriction pattern of the respective polymorphisms. The polymerase chain reaction performed in a 25 µL reaction volume contained genomic DNA, 4 mM dNTP, 10X PCR buffer, 25 mM MgCl2, forward, and reverse primers of 100 ng/µL each, and Taq polymerase under the following cycling parameters: initial denaturation at 95°C for 5 minutes, 35 cycles of 95°C for 30 seconds, annealing at 56°C for 30 seconds for VDR: rs1544410, VDR: rs7975232, VDR: rs731236 and HFE: rs1799945 SNPs/60°C for 30 seconds for HFE: rs1800562, elongation at 72°C for 30 seconds followed by a final extension of 72°C for 10 minutes. The amplified products were resolved on a 1.5% agarose gel, digested with the respective restriction enzyme, and resolved on 2% agarose gel. The genotype identified is represented in Figure S1 (Supplementary material).
Statistical analysis
The data were analyzed using statistical tools—GraphPad Prism 7.0 (GraphPad Software, Inc., San Diego, CA) and STATA 13.0 (StataCorp LP, College Station, TX). The sample size of the study was calculated based on multiple linear regression. 30 The comparison of means of all continuous variables between exposed subjects and controls performed using an independent sample t-test. D’Agostino-Pearson’s normality test assessed the normality of variables. The normally distributed variables are those with a p-value greater than 0.05. The median BLLs by age, gender, smoking, and tobacco chewing status, alcohol intake, duration of exposure, occupation, and genotype between exposed subjects and controls performed using Mann Whitney/Kruskal-Wallis test and Dunn’s multiple comparison tests. Spearman’s correlation analyzed the association of BLLs with all clinical variables among exposed subjects. Univariable linear and quantile regression was performed with BLL as the outcome variable and covariates (both continuous and categorical data, including genotypes) as independent variables for lead-exposed and control groups. From the analysis, covariates with a p-value of less than 0.2 fitted a multiple regression model to identify the significant predictors of BLL. Hardy Weinberg equilibrium (HWE) tested the genetic analysis between exposed subjects and controls using Michael H. Court’s (2005–2008) online calculator. The common major allele is a reference for the heterozygous and homozygous minor allele. Chi-square and Fisher’s exact test statistically analyzed the allelic frequency and genotypic distribution. Odds ratio with a 95% confidence interval and a p-value less than or equal to 0.05 was considered statistically significant.
Further, gene interaction, haplotype, and LD analysis were determined by the expectation-maximization algorithm using the online software tool, SHEsisPlus (http://shesisplus.bio-x.cn/SHEsis.html). 31 The SHEsisPlus quantitative trait data set, including BLLs and genotype data, was incorporated in the analysis. Haplotypes, with the lowest frequency threshold of 0.03, was applied in the analysis. The possible VDR haplotypes obtained above the threshold were C-C-A, C-C-G, C-A-A, T-C-A, T-C-G, and T-A-A.
Results
Demographic characteristics and BLL
Total 164 lead-exposed subjects and 160 controls with mean ± SD age of 30.2 ± 9.5 and 32.8 ± 11.4 years were screened. Table 1 presents the clinical characteristics of the study population. About 35.4% of the lead-exposed subjects (n = 58) in the study complained of symptoms such as headache (10.3%), abdominal colic (32.8%), knee and joint pain (29.3%), skin allergy (19%), insomnia (8.6%), respiratory problems (6.9%), and a metallic taste in the mouth (1.7%). The mean ± SD blood lead concentration of exposed subjects and controls was 54.4 ± 22.3 and 4.0 ± 2.5 µg/dL, respectively (p-value ≤ 0.0001). Biochemical tests revealed a significant difference in ALAD activity (p ≤ 0.0001), total protein (p ≤ 0.05), total RBC count (p ≤ 0.001), MCV (p ≤ 0.0001), MCH (p ≤ 0.01), and MCHC (p ≤ 0.05) between the groups (Table 1). However, the total protein, RBC count, MCV, MCH, and MCHC were normal. A combined (n = 324) correlation analysis revealed a negative association between BLL and ALAD activity (r = −0.76, p < 0.001), indicating marked inhibition of ALAD by lead, as shown in Figure S2 (Supplementary material). Table 2 presents the median BLL of exposed subjects and controls by age, gender, smoking, and tobacco chewing status, alcohol intake, duration of exposure, occupation, and genotype. The normality test revealed that BLLs categorized by age, gender, smoking, and tobacco chewing status, alcohol intake, duration of exposure, occupation, and genotypes were distributed normally in the lead-exposed group (p > 0.05). In contrast, BLLs of age groups between 41–50 and 51–65 years, older adults (age > 55), smokers, and alcohol consumers were distributed normally in controls (p > 0.05). Lead-exposed middle-aged adults and subjects between the ages of 31–40 and 41–50 years presented higher median BLL of 57.8, 64.7, and 66.5 µg/dL, respectively, compared to other age groups (Table 2). The exposed subjects comprised of 98% males and 2% females. Male workers (n = 160) were directly exposed to lead via activities such as smelting and refining, rotary furnace operations, breaking and recycling old batteries, and lead effluent treatment plant while females (n = 4) were exposed indirectly via administration and maintenance activities. Hence, males presented a higher median BLL of 57.2 µg/dL than females with a median BLL of 18.7 µg/dL (p ≤ 0.01) (Table 2). A high proportion of exposed subjects were involved in rotary furnace operations (n = 55) and presented a median BLL of 66.3 µg/dL. Further, individuals working in the effluent treatment plant presented a higher median BLL of 80.9 µg/dL compared to other units indicating a higher possibility of lead contact via ingestion, inhalation, and dermal absorption in the treatment plant; however, no difference in BLLs was observed by units due to few samples (Table 2). In the lead-exposed group, the majority of the subjects consumed alcohol (41%) than those who smoked (23%) or chewed tobacco (15%) (Table 2). Lead-exposed subjects who smoked presented a higher median BLL of 62.8 µg/dL than non-smokers. Similarly, exposed subjects who consumed alcohol presented a higher median BLL of 57.8 µg/dL than non-alcohol consumers (Table 2). However, exposed subjects who chewed tobacco presented a higher median BLL of 71 µg/dL than non-tobacco users (p-value ≤ 0.001) (Table 2). Spearman’s analysis of all clinical variables in the exposed group revealed a positive correlation of BLL with total WBC count, and a negative correlation with ALAD activity, hematocrit, hemoglobin, MCV, and MCH (Table 3).
Clinical characteristics of lead-exposed subjects (n = 164) and unexposed controls (n = 160).
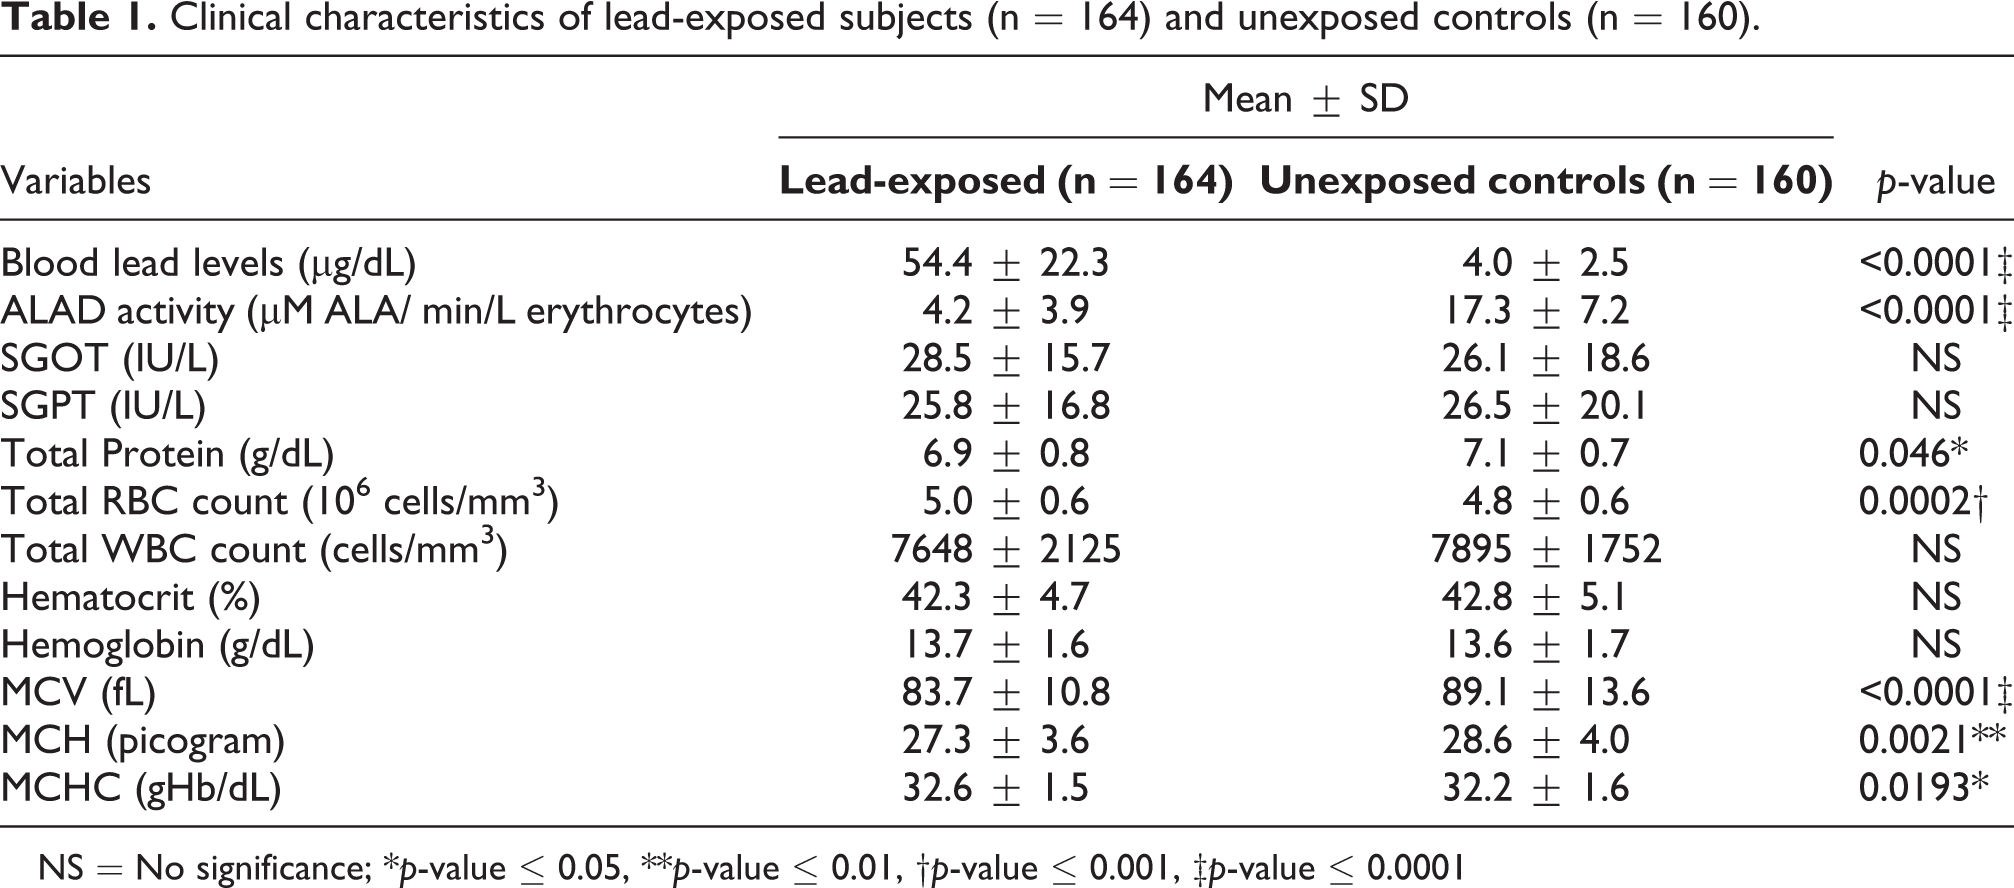
NS = No significance; *p-value ≤ 0.05, **p-value ≤ 0.01, †p-value ≤ 0.001, ‡p-value ≤ 0.0001
Comparison of median blood lead levels (µg/dL) between lead-exposed subjects (n = 164) and unexposed controls (n = 160).

aAge categorized with a difference of 9 years.
b Age classified according to the type of adult.
NS = no significance, *p-value ≤ 0.05, **p-value ≤ 0.01, †p-value ≤ 0.001, ‡p-value ≤ 0.0001.
Spearman’s correlation of blood lead levels and all clinical variables among lead-exposed subjects (n = 164).

* p-value ≤ 0.05, ** p-value ≤ 0.01, † p-value ≤ 0.001, ‡ p-value ≤ 0.0001.
VDR genotype and BLL
Table 2 presents the median BLL of exposed subjects and controls according to VDR genotypes. No difference in median BLL was observed by genotype for the three polymorphisms in both groups. However, in lead-exposed, it was observed that mutant TT of rs1544410, mutant AA of rs7975232, and wild-type AA of rs731236 polymorphisms presented higher median BLL compared to other genotypes. Table 4 summarizes the distribution of allelic and genotypic frequencies of the three VDR polymorphisms. The allele C and genotype CT of rs1544410, allele C and genotype CC of rs7975232, and allele A and genotype AG of rs731236 were predominant alleles and genotypes in both groups, respectively. All the selected VDR SNP’s fitted within HWE (p > 0.05). There was no difference in allelic and genotypic frequency between exposed subjects and controls. However, when compared to the SAS (South Asian) population of the 1000 genome project phase 3, it was observed that the allelic frequency of rs7975232 was significantly different in exposed (p ≤ 0.05), control (p ≤ 0.0001), and combined (p ≤ 0.0001) groups as shown in Table S2 (Supplementary material).
Statistical analysis of VDR (rs1544410, rs7975232, rs731236) and HFE (rs1799945, rs1800562) genotypic and allelic frequency data in lead-exposed subjects and unexposed controls.

(a)χ2 = chi-squared test for Hardy-Weinberg equilibrium; p-value <0.05 is not consistent with HWE.
(b)χ2 = Fishers exact test to compare the distribution of allele and genotype frequencies between lead-exposed and unexposed control.
NS = no significance, * p-value ≤ 0.05, ** p-value ≤ 0.01, †p-value ≤ 0.001, ‡ p-value ≤ 0.0001.
HFE genotype and BLL
Table 2 presents the median BLL of exposed subjects and control by HFE genotypes. HFE genotypes observed no difference in median BLL in both groups. Table 4 summarizes the distribution of allelic and genotypic frequencies of the two HFE polymorphisms. The allele C and genotype CC of rs1799945 (HFE H63D), and allele G and genotype GG of rs1800562 (HFE C282Y) were predominant alleles and genotypes of in both groups respectively. The HFE H63D polymorphism deviated from HWE in control (p < 0.05) but not in the lead-exposed group (p > 0.05). In contrast, due to the absence of the HFE C282Y variant in the study population, no HWE analysis was performed. Further, chi-square analysis of HFE H63D revealed a significant difference between allele frequencies of lead-exposed (C, 93%; G, 7.0%) and controls (C, 82.8%; G, 17.2%) with a χ2 of 15.84 and p ≤ 0.001 (Table 4). Similarly, the genotypic frequencies in lead-exposed (CC, 86.0%; CG, 14%; GG, 0%) was found to be significantly different compared to controls (CC, 72.5%; CG, 20.6%; GG, 6.9%) with a χ2 of 15.17 and p-value ≤ 0.0001 (Table 4). When compared to the SAS population of the 1000 genome project phase 3, the allelic and genotypic frequency of exposed subjects were similar; however, was different for controls (both p ≤ 0.0001) and combined (p ≤ 0.0001; p ≤ 0.001) group as shown in Table S2 (Supplementary material).
Effect of covariates on BLL by regression
Regression analysis tested the effect of covariates on BLLs in the lead-exposed and control groups. The normal distribution of BLLs in the lead-exposed group resulted in linear regression analysis, while the BLLs of the control group not distributed normally resulted in quantile regression analysis. Univariable linear regression analysis of lead-exposed group obtained variables such as the period of exposure, gender, smoking and tobacco chewing status, ALAD activity, SGOT, total WBC count, hematocrit, hemoglobin, MCH, and MCHC with p-value <0.2 as shown in Table 5. These factors further adjusted for multiple linear regression observed that ALAD activity increased when BLLs dropped by 2.9 units (p < 0.0001), and the use of smokeless tobacco increased BLLs by 11 units (p < 0.001), as shown in Table 6. The univariable quantile regression analysis in controls obtained variables such as alcohol intake and MCHC with p-value <0.2 (Table 7) and further observed no association with BLLs when adjusted for multiple quantile regression (Table 8).
Univariable linear regression analysis of various parameters against blood lead levels in lead-exposed subjects.

Blood lead levels are taken as constant. aDuration of exposure categories; 1—1 month to 1 year, 2—1.1 year to 5 years, 3—5.1 to 10 years, 4—≥10.1 years *p-value <0.2 was considered significant and further fitted for multiple regression.
Multivariable linear regression analysis for association of independent predictors and blood lead levels in lead-exposed subjects.

Blood lead levels are taken as constant.
a Duration of exposure categories; 1—1 month to 1 year, 2—1.1 year to 5 years, 3—5.1 to 10 years, 4—≥10.1 years.
NS = No significance, *p-value <0.05, **p-value <0.01, †p-value <0.001, ‡p-value <0.0001.
Univariable quantile regression analysis of various parameters against blood lead levels in unexposed controls.
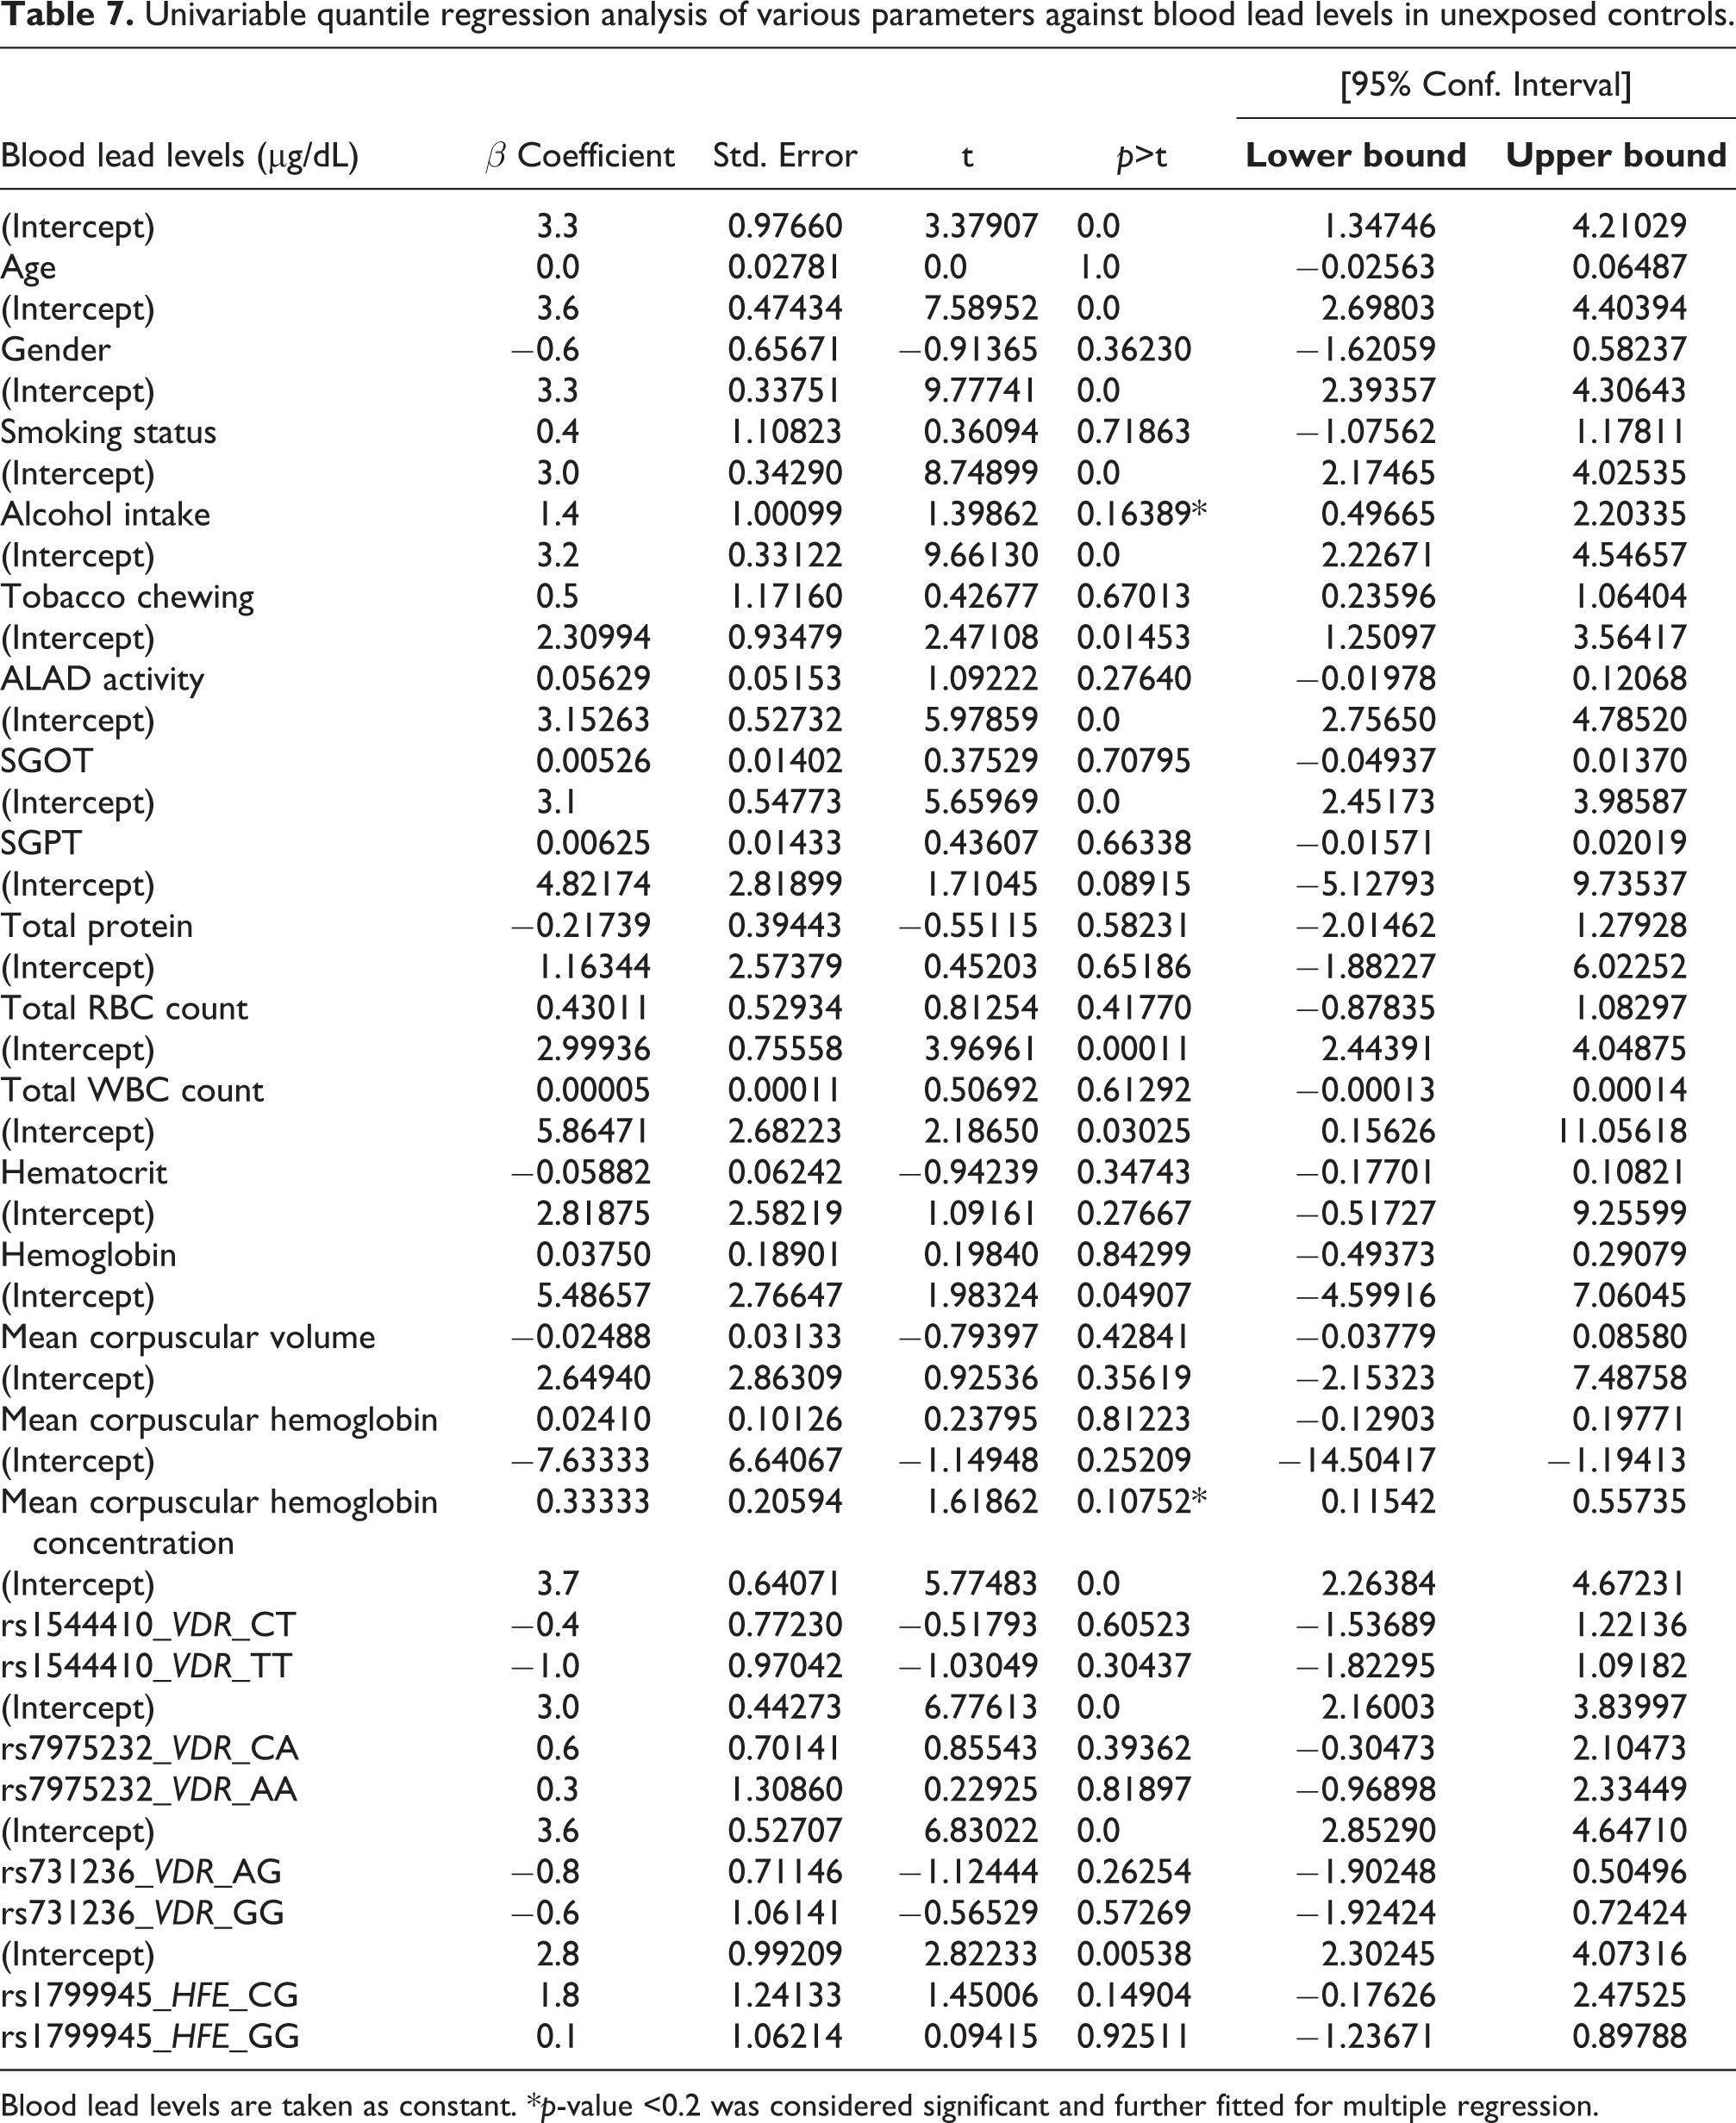
Blood lead levels are taken as constant. *p-value <0.2 was considered significant and further fitted for multiple regression.
Multivariable quantile regression analysis for the association of independent predictors and blood lead levels in unexposed controls.

Blood lead levels are taken as constant.
NS = No significance, *p-value <0.05, **p-value <0.01, †p-value <0.001, ‡p-value <0.0001.
VDR haplotype inference
The frequency of VDR haplotypes of the three SNPs—rs1544410, rs7975232, and rs731236 was C-C-A (0.09), C-C-G (0.19), C-A-A (0.24), T-C-A (0.20), T-C-G (0.17), and T-A-A (0.10) in lead-exposed and C-C-A (0.19), C-C-G (0.22), C-A-A (0.09), T-C-A (0.20), T-C-G (0.09), and T-A-A (0.18) in control groups, respectively as shown in Table 9. Figure 1 represents the overall distribution of BLLs of each haplotype. The median BLL of C-C-A, C-C-G, C-A-A, T-C-A, T-C-G, and T-A-A haplotypes was found to be 50.6 (n = 92), 56.8 (n = 21), 65.9 (n = 16), 63.4 (n = 31), 66.6 (n = 1), and 62.2 (n = 3) µg/dL in lead-exposed respectively, and 3.4 (n = 98), 3.0 (n = 13), 2.6 (n = 11), 3.1 (n = 37), 0 (n = 0), and 3.8 (n = 1) µg/dL in control groups respectively. SHEsisPlus was used to assess the two-way to three-way interaction between three loci of VDR to BLLs. Haplotype analysis revealed that T-A-A haplotype increased the BLLs by 0.93 units (p ≤ 0.05) in controls, and C-C-A haplotype decreased the BLLs by 7.25 units (p ≤ 0.05) when combined. Single locus and gene interaction analysis further revealed a strong interaction between rs1544410 and rs7975232 (p ≤ 0.001; p ≤ 0.01 after FDR correction) in controls, as shown in Table 10. Further, combined group analysis revealed an interaction between rs7975232 and rs731236 (p ≤ 0.05); however, there was no significance after FDR correction. Figure 2 depicts the pairwise LD patterns in exposed, control, and combined groups. LD plots (D > 0.9) showed strongest LD between rs7975232 and rs731236 (D = 0.97 is exposed, D = 0.93 in control, and D = 0.95 in combined).
Haplotype analysis of selected VDR loci (rs1544410, rs7975232, and rs731236).

*p-value ≤ 0.05, **p-value ≤ 0.01, †p-value ≤ 0.001, ‡p-value ≤ 0.0001 aSidak SS: Sidak single-step adjusted p-values for strong control of the family-wise Type I error rate (FWER) bFDR-BH: adjusted p-values for the Benjamini & Hochberg (1995) step-up FDR controlling procedure.
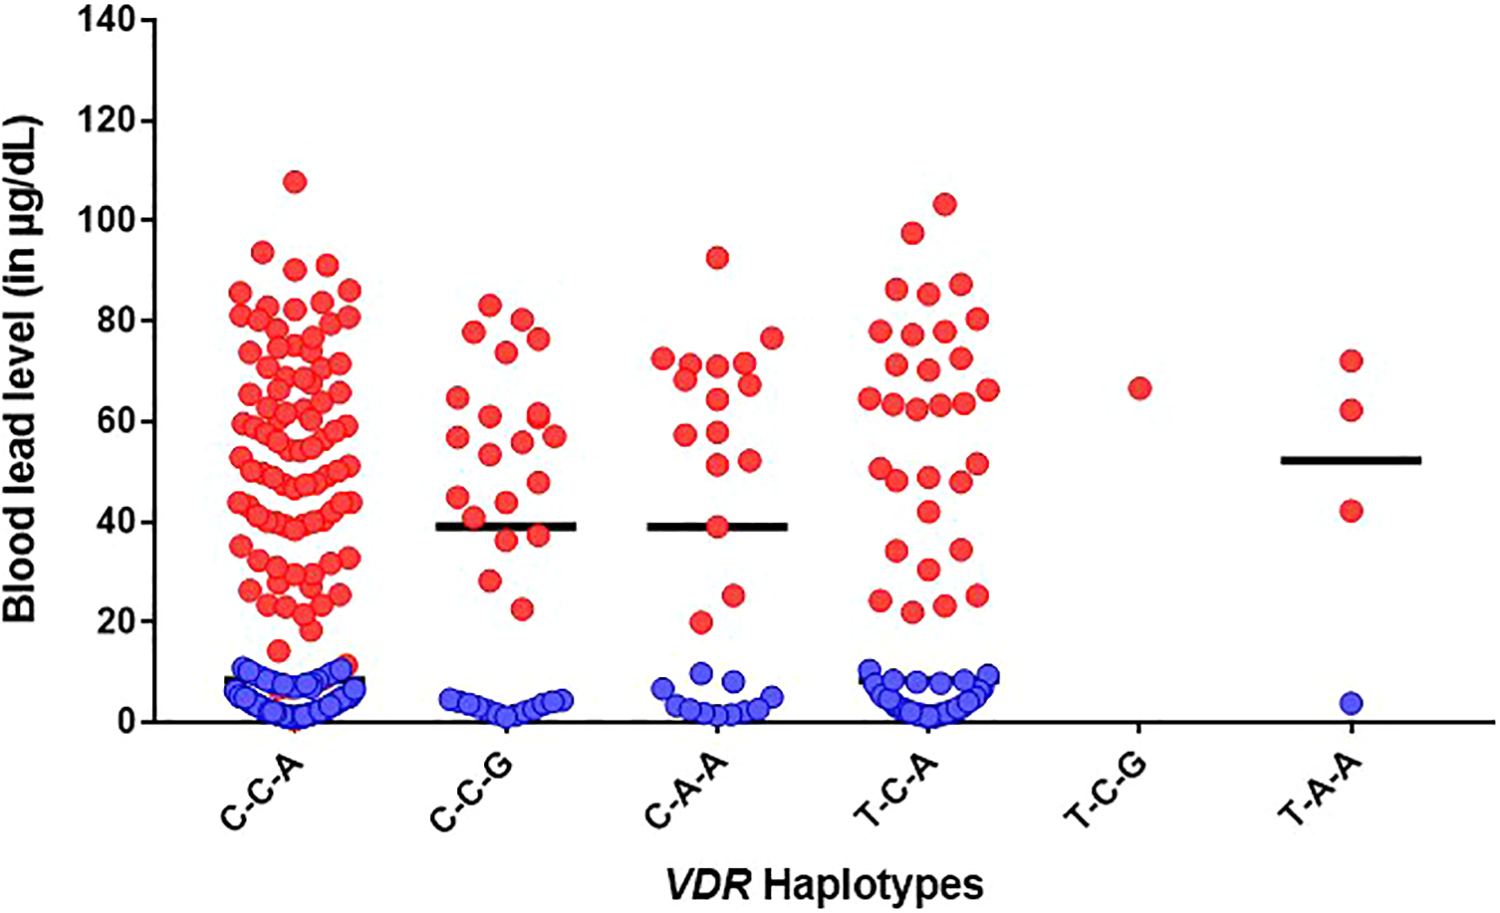
Distribution of blood lead levels between lead-exposed subjects and unexposed controls by VDR haplotype groups. The bar shows the median blood lead value.

Linkage disequilibrium analysis of VDR SNPs (rs1544410, rs7975232, and rs731236) between lead-exposed subjects and unexposed controls. (a) lead-exposed (b) unexposed controls (c) combined. Strong recombination between rs7975232 and rs731236 was observed in all groups.
Single locus and
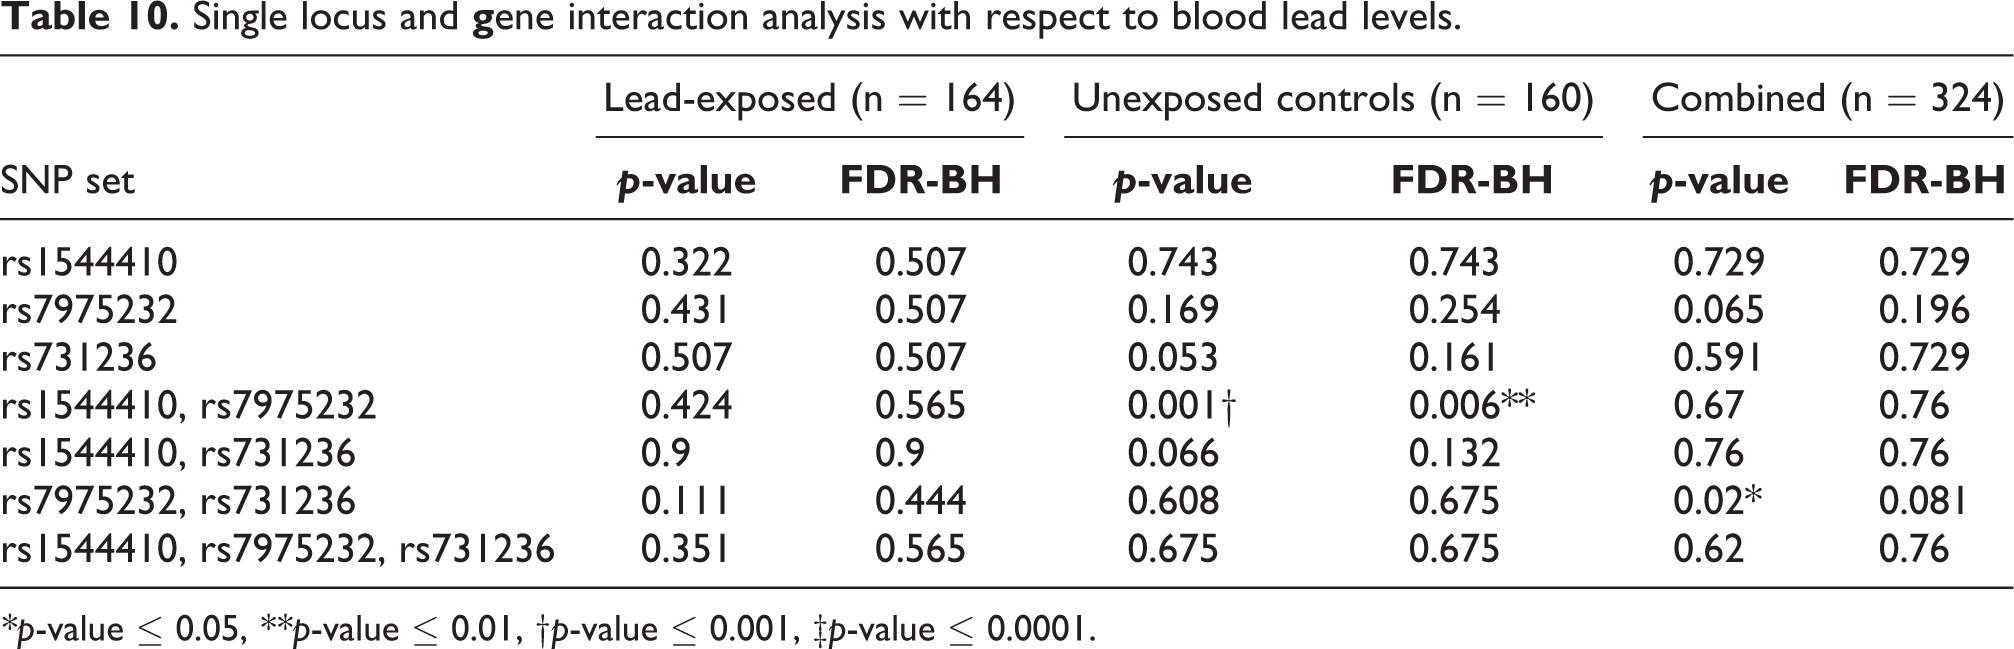
*p-value ≤ 0.05, **p-value ≤ 0.01, †p-value ≤ 0.001, ‡p-value ≤ 0.0001.
Discussion
Lead poisoning is a serious threat, particularly to occupationally exposed workers. Occupational exposure usually occurs in developing countries where workers are not aware of the dangers involved. 32 Among them, India is still struggling to spread the awareness of lead as potential neuro-psycho-poison. 33 Lead toxicity is affected by several factors such as age, gender, lifestyle, ethnicity, and degree of exposure including the dose, route, duration, and formulation. Clinical evaluation of lead-exposed subjects in the present study revealed inhibition of ALAD activity, reduced total serum protein content, increased total RBC count, and low blood cell index (MCV, MCH, and MCHC). Previous studies have shown that lead-exposed subjects exhibited low total protein levels than controls. 34,35 Most proteins have prosthetic groups composed of calcium and zinc, making them susceptible to interaction with lead, thereby affecting the level of specific proteins such as enzymes, albumin, hormones, drug/metal-binding proteins, and the cellular processes involved. 36 Further, several studies have reported the influence of high BLLs on hematological impairment. 37 –39 Lead poisoning is often associated with microcytic hypochromic anemia, characterized by the small size of RBCs indicated by low MCV and MCHC, as seen in the present study. However, anemia is not common among lead poisoning cases unless it is severe or associated with iron deficiency.
Regression analysis of the present study revealed the activity of ALAD and smokeless tobacco use as predictors of BLLs in lead-exposed subjects. ALAD is cytosolic and the second enzyme involved in heme synthesis. It is sensitive to lead, thus gets inhibited, disrupting heme synthesis. The BLLs determine the activity of ALAD. The present study showed a negative correlation between BLLs and ALAD activity, as previously reported. 7,18 Cigarette smoke and smokeless tobacco products are well known acquired factors for the elevation of BLLs. 40 WHO estimated that a smoker inhales typically about 2–6% of lead, which is equivalent to 1–5 µg lead after smoking 20 cigarettes per day. 41 The National Health and Nutrition Examination Survey reported that smokeless tobacco users had higher blood lead concentrations than non-tobacco users. 42 A recent study showed that lead-exposed workers who smoked presented slightly higher BLLs compared to exposed non-smokers. 43 Hence, the use of tobacco can influence the risk of high BLLs.
In addition to the factors mentioned earlier, lead toxicity is also affected by genetically determined differences in uptake and elimination of lead due to genetic variations in lead metabolizing enzymes or proteins. ALAD codes for the enzyme δ-aminolevulinate dehydratase, widely studied in association with lead toxicity.6,18,44 –48 However, studies on the influence of VDR haplotypes and HFE polymorphisms on BLLs of occupationally exposed subjects are limited. In the present study, the mutant TT genotype of rs1544410, mutant AA genotype of rs7975232, and wild-type AA genotype of rs731236 polymorphisms presented a higher median BLL compared to other genotypes in the lead-exposed group. In a study of Korean lead workers, Schwartz et al. 22 reported that mutant T carriers of VDR: rs1544410 had significantly higher mean BLLs, chelatable lead, and tibia lead than wild-type C allele carriers. Rezende et al. 49 reported significantly low BLL levels and plasma lead levels in wild-type CC carriers of rs1544410 and wild-type CC carriers of rs7975232, respectively. Chuang et al. 28 showed that lead-exposed mutant AA carriers of rs7975232 had higher BLL levels and index of cumulative blood lead than wild-type. Pawlas et al. 50 identified that carriers of the mutant T allele of rs1544410, the mutant G allele of rs731236, and wild-type C allele of FokI polymorphism were associated with impaired pure-tone audiometry along with increasing lead concentration in children. A recent study showed that mutant A allele of rs7975232 and probably the mutant G allele of rs731236 carriers might be susceptible to lead toxicity. 51 In contrast to these observations, Wananukula et al. 27 reported low BLLs in lead-exposed mutant TT carriers of rs1544410 and mutant GG carriers of rs731236. Similarly, several studies have focused on the influence of VDR SNPs on BLLs individually, but studies associating haplotypes with BLLs are limited. Three VDR SNPs—rs1544410, rs7975232, and rs731236, located close to the regulatory 3’UTR region have a strong LD. 20 The 3’UTR region is typically involved in mRNA stability and degradation, hence, these SNPs may alter the VDR mRNA levels, which may subsequently induce disturbances in the gene expression. The present study showed that the T-A-A haplotype of VDR might be a potential marker to alter the stability and regulation of VDR mRNA, thus altering calcium homeostasis and elevating BLLs. Very few groups have studied the influence of VDR haplotype on BLL retention. A recent haplotype study by Rezende et al. 49 reported that wild-type allele combinations of rs7975232 and rs1544410 VDR SNPs were associated with lower plasma lead, BLLs, and percentage ratio of plasma lead and BLLs than those found in other haplotype groups, which is consistent with our results. Another study on children of the Han population of China revealed that T-C-A and T-C-G haplotypes corresponding to rs1544410, rs7975232, and rs731236 polymorphisms of VDR significantly increased in lead poisoning groups. 52 Further, our LD analysis revealed a strong linkage between rs7975232 and rs731236 SNPs, followed by rs1544410 and rs731236, and rs1544410 and rs7975232 SNPs, a similar trend as reported by Colombini et al. 53 Similarly, several association studies of VDR polymorphism with BLLs or the risk of developing lead poisoning produced varying results due to differences in ethnicity of the population. Although VDR analysis was consistent with HWE and 1000GPP3, there was no association between VDR genotype and BLLs, which could be due to low frequency of observed genotypes in the study.
The HFE polymorphisms, H63D, and C282Y, are shown to induce susceptibility to increased absorption of lead since iron and lead share similar divalent characteristics. In the present study, HFE H63D and HFE C282Y polymorphism were absent in lead-exposed subjects. Our findings revealed that exposed HFE H63D wild-type CC carriers are at risk of higher BLLs than mutant GG carriers, indicating that wild-type C allele may be a risk allele for lead exposure. Wright et al. 54 reported the association of HFE H63D mutant G carriers to low bone and BLLs than wild-type carriers after adjusting age and iron levels. In contrast to this, in a study involving Chinese lead-exposed workers, Fan et al. 23 observed that higher body iron content was associated with higher BLLs in workers with H63D mutant than the wild-type. Szymańska-Chabowska et al. 24 reported that the HFE H63D mutant G allele was significantly associated with higher BLLs. Similarly, an investigation by Chen et al. 55 suggested that CCHD carriers (wild-type HFE C282Y and heterozygous HFE H63D) negatively influenced the mean corpuscular volume when the BLLs were high. Hence, the reported genetic variants may alter the expression of VDR and HFE and increase the absorption of lead in exposed individuals, which could be further validated by expression studies.
Conclusion
In conclusion, the present study showed that lead exposure affected the total protein levels, ALAD activity, and blood cell index compared to control. High BLLs in lead-exposed subjects negatively influenced ALAD activity and was positively influenced by smokeless tobacco use. Genotype analysis showed that VDR haplotype, T-A-A, and HFE H63D wild-type C allele might have a toxicogenic implication on BLLs. Therefore, such studies may help identify individuals at higher risk of lead poisoning either from an environmental or occupational setting.
Supplemental material
Supplemental Material, Supplementary_Tables_and_Figures_revised - Influence of VDR and HFE polymorphisms on blood lead levels of occupationally exposed workers
Supplemental Material, Supplementary_Tables_and_Figures_revised for Influence of VDR and HFE polymorphisms on blood lead levels of occupationally exposed workers by Monica Shirley Mani, Amitha Puranik, Shama Prasada Kabekkodu, Manjunath B Joshi and Herman Sunil Dsouza in Human & Experimental Toxicology
Footnotes
Abbreviations
ALAD, δ-aminolevulinate dehydratase, BLLs, Blood lead levels, HFE, Hemochromatosis, HWE, Hardy Weinberg equilibrium, LD, Linkage disequilibrium, SNP, Single nucleotide polymorphism, VDR, Vitamin D
Acknowledgments
The authors acknowledge TIFAC-CORE, Government of India and Manipal Academy of Higher Education for the infrastructure. We thank Prof. K Satyamoorthy, Director, Manipal School of Life Sciences, Manipal Academy of Higher Education, Manipal, India, for the valuable support and encouragement. We are grateful to the participants of the study for allowing us to collect their blood samples. We also thank the phlebotomists of Kasturba Medical College, Attavara, Mangalore for assisting us in the blood sample collection. We would also like to thank Mr. A R. Kini (B.Sc. DMLT) for analyzing the complete hematogram, total serum protein, and SGOT/SGPT levels. Dr. Monica Shirley Mani was provided with a fellowship from Dr. T.M.A. Pai Foundation, Manipal Academy of Higher Education (131700103) and Directorate of Minorities (Award no. DOM/FELLOWSHIP/CR-84/2017-18).
Declaration of conflicting interests
The author(s) declared no potential conflicts of interest with respect to the research, authorship, and/or publication of this article.
Funding
The author(s) received no financial support for the research, authorship, and/or publication of this article.
Supplemental material
Supplemental material for this article is available online.
References
Supplementary Material
Please find the following supplemental material available below.
For Open Access articles published under a Creative Commons License, all supplemental material carries the same license as the article it is associated with.
For non-Open Access articles published, all supplemental material carries a non-exclusive license, and permission requests for re-use of supplemental material or any part of supplemental material shall be sent directly to the copyright owner as specified in the copyright notice associated with the article.