
Abstract
Background:
The purpose of this study was to examine the effects of exposure to imatinib in the prenatal period on testis development in rats.
Methods:
Although all the study groups received intraperitoneal imatinib on prenatal days 1–8, no pregnancy occurred in the Imatinib-80 group. Immunohistochemical analysis, TUNEL, c-kit and PDGF staining revealed no difference between the groups in terms of positivity scoring.
Results:
A significant decrease was detected in total sperm counts in the Imatinib-20 group compared to the control group, but the sperm count was higher in the Imatinib-60 group than in the Imatinib-20 group. At biochemical measurements, the drug increased oxidative stress in the testis and serum in the Imatinib-20 group, but caused a decrease in tissue in the Imatinib-60 group. Thiol measurements revealed a decrease in the testis and serum in the Imatinib-60 group, while an increase in serum measurements was observed in the Imatinib-40 group. Analysis revealed no difference between the groups in terms of protamine and histone gene expression levels in testis tissue exposed to imatinib.
Conclusion:
Our findings show that prenatal exposure to imatinib can lead to histopathological and biochemical changes in testis tissue, but that no adverse effect occurs in nuclear maturation of germ cells during spermiogenesis.
Introduction
Many male and female chronic myeloid leukemia (CML) patients of reproductive age experience an increased desire for parenthood. 1 The reported prevalence of CML during pregnancy is 0.6–3/100,000. 2 This also raises the concern that drug use during pregnancy among women of reproductive age receiving treatment may lead to teratogenic effects on the fetus. 2 Imatinib, now considered a first-generation tyrosine kinase inhibitor (TKI), causes a significant and prolonged decrease in CML cell numbers in the chronic phase and has raised 10-year survival rates from under 20% to approximately 83%. 3 It is also used in the treatment of CML and gastrointestinal tumors by targeting c-kit and PDGFR kinases. 4,5
The c-kit ligand stem cell factor (SCF) is involved in events such as chemotaxis, proliferation, differentiation and even survival by activating numerous pathways. 6 Previous studies reported that c-kit is expressed in primordial germ cells and by various cells during germ cell migration and that it can serve as a marker through involvement in cell selection and preservation during migration. 7 The SCF/c-kit system affects survival and apoptosis through expression in the male and female reproductive systems under both healthy and oncological conditions. 8
Platelet-derived growth factor (PDGF) and its ligands are released in both the fetal and adult testis. 9 Previous studies reported that PDGF-A is involved in the development of adult Leydig cells and that these cells arise from PDGFR-α progenitors. 10 PDGFR-β, a PDGF receptor, has also been shown to play an important role in the germ cell development pathway in the early postnatal period. 11 PDGFs have also been reported to play a role in the development stages, not only of the testis, but also of the epididymis. 9
Imatinib is a BCL-ABL, PDGF, and c-kit TKI, receptors with known involvement in both the male and female reproductive systems. 12 Two-year imatinib administration has been reported to cause no testis dysfunction in adolescent patients, while application caused no inhibitory effects on TKIs in juvenile rats. 13 More recent studies have reported similar levels of imatinib to those in plasma in male CML patients treated with imatinib, and that imatinib, therefore, crosses the blood-testis barrier. However, no change has been observed in the reproductive organs or in the levels of growth hormones such as testosterone. 14 In addition to these effects, children started on imatinib in the prepubertal period have been shown to exhibit growth delay compared to peers by the time they reach puberty, although growth was achieved in the post-pubertal period. 15 Studies have also investigated the effects of imatinib on the male reproductive system, but we encountered no previous studies involving the effects on testis tissue of imatinib exposure in the prenatal period.
Material and method
Animal experiment and drug administration
Approval for this study was received from the Recep Tayyip Erdoğan University (RTEU) Animal Experiments Local Ethical Committee (No. 2017/22). The study was supported by the RTEU Scientific Research Projects Coordination Units (project code no. TDK-2017-825). All experimental animals used in the study were procured from the RTEU Experimental Animals Application and Research Center. Fifteen adult female rats weighing 230–260 g exhibiting regular estrous cycles and identified as being in the estrous phase by means of vaginal smear were allowed to mate with male rats. Female rats with sperm observed in smear specimens the following day were regarded as being on day 1 of pregnancy and were randomly assigned into five groups. Injections then commenced. Imatinib (İmavec, Koçak Farma, Turkey) was administered fresh every day at the same time via the intraperitoneal (i.p.) route in a pyrogen-free sterile water solution. No procedure was performed on the animals in Group 1 (control group). In Group 2, (Imatinib-20) 20 mg/kg imatinib was administered i.p. between days 1 and 8 of pregnancy. 16 In Group 3, (Imatinib-40) 40 mg/kg imatinib was administered i.p. on the same days. 17 In Group 4, (Imatinib-60) 60 mg/kg imatinib was also administered i.p. between days 1 and 8 of pregnancy. 17 In Group 5, (Imatinib-80) 80 mg/kg imatinib was administered i.p. on the same days of pregnancy. No procedure was performed after the injections, and pregnancy was monitored. No pregnancy was observed in the animals receiving 80 mg/kg imatinib, and the experiment was repeated, but no pregnancy again occurred. The rat pups were randomly assigned into four groups of eight animals each. Since no pregnancy occurred, the rats in the Imatibib-80 group were sacrificed under anesthesia on postnatal day 60.
Histological analysis
Testis tissue specimens were trimmed to a volume of 1.5 cm3 for histological analysis and fixed for 24 h in Bouin’s solution (Merck GmbH, Darmstadt, Germany). Following the fixation procedure, these specimens were dehydrated by being passed through increasing ethanol series (Merck GmbH, Darmstadt, Germany), and were then cleared with xylol solution (Merck GmbH, Darmstadt, Germany). After clearing, testis tissues were placed into soft paraffin (Merck GmbH, Darmstadt, Germany) for 1-h and then embedded in hard paraffin blocks (Merck GmbH, Darmstadt, Germany). A rotary microtome (Leica, RM2525, Germany) was then used to take 4–5 µm sections from the paraffin blocks. After deparaffinization, the testis tissue sections were stained with hematoxylin (Harris hematoxylin, Merck GmbH, Darmstadt, Germany) and eosin (Eosin G, Merck GmbH, Darmstadt, Germany).
Johnsen scoring was applied to 20 random, distinct areas on H&E-stained sections from each rat by two histopathologists blinded to the study groups (Table 1).
Histopathological testis damage scores.

The ductus epididymis was subjected to physical dissection for sperm count calculation, and these specimens were kept in a stove at 37°C in Petri dishes containing 1 ml PBS. Following liquefaction, 5 µl was taken from the sperm-containing PBS and dropped into a Makler counting chamber (Sefi-Medical Instruments, Haifa, Israel), when counting took place. Sperm counts were recorded as million/ml. 18
Immunohistochemical staining protocol
For immunohistochemical analyses, testis tissue sections were trimmed at a volume of 1.5 cm3 and fixed by storage for 36 h in 10% neutral formalin (Merck GmbH, Darmstadt, Germany) solution. Following fixation, testis tissue specimens were dehydrated by being passed through increasing ethanol series (Merck GmbH, Darmstadt, Germany) and then cleared in xylol solution (Merck GmbH, Darmstadt, Germany). After clearing, testis tissues were placed into soft paraffin (Merck GmbH, Darmstadt, Germany) for 1-h and then embedded in hard paraffin blocks (Merck GmbH, Darmstadt, Germany). A rotary microtome (Leica, RM2525, Germany) was then used to take 1–3 µm sections from the paraffin blocks, which were placed onto positively-charged slides (Patolab, PRC). Following deparaffinization, a Mouse and Rabbit Specific HRP/DAB (ABC) Detection IHC Kit (ab64264, Abcam, USA) was used for IHC staining of the testis tissue sections obtained. Following paraffin removal and dehydration, the sections were subjected to hydrogen peroxide blocking, antigen retrieval (as recommended by the antibody manufacturer), protein block, primary antibody incubation, secondary antibody incubation, Biotinylated Goat Anti-Polyvalent, and streptavidin peroxidase application, counterstaining with DAB chromogen and hematoxylin, dehydration and xylene, and were then covered with entellan. Anti-PDGF antibody (ab198874, Abcam, USA), Anti c-kit antibody (ab115801, Abcam, USA) and Anti-8OHdG (ab10802) antibodies were used at appropriate solutions as recommended by the manufacturer in the primary antibody stage.
Twenty-five randomly selected areas of testis tissue sections exposed to primary antibodies were scored by two histopathologists blinded to the study groups, as shown in Table 2.
Immunohistochemical positivity grading method.

The terminal deoxynucleotide transferase dUTP nick end labeling (TUNEL) method
An Abcam in situ apoptosis detection kit (ab206386, Abcam, USA) was used for the TUNEL method. The kit protocol was applied following the removal of paraffin and dehydration. Counterstaining with methyl green was performed after incubation with DAB chromogen.
Biochemical analysis protocols
Tissue homogenization: A 7.4 pH homogenization buffer was prepared using 20 mM 1 L sodium phosphate and 140 mM potassium chloride pH for use in tissue homogenization. Briefly, 1 ml of this buffer was added to 100 mg tissue from each specimen and was centrifuged for 10 min at 800 g at 4°C. 19
TBARS assay: The TBARS assay was performed as described by Ohkawa et al. For each specimen used, 200 µl testis tissue supernatant, 50 µl 8.1% sodium dodecyl sulfate (SDS), 375 µl 20% acetic acid (v/v), and 375 µl 0.8 pH 3.5 thiobarbituric acid (TBA) were placed into Eppendorf tubes. 20 A mixture involving the specified amounts was prepared from all solutions and vortexed. Tissue specimens in Eppendorf tubes were incubated for 1 h in a hot water bath (95°C). Next, following cooling in iced water, specimens were centrifuged at 750 g for 10 min. The cooled specimens were finally pipetted onto 96-well plates and read at a wavelength of 532 nm on a spectrophotometer. TBARS concentrations were calculated as nmol/wet tissue. 19
Standard solution preparation: 1,1,3,3-tetra methoxy propane was used for a standard solution for standard curve production. A solution was then obtained by mixing 82.5 µL 1,1,3,3-tetra methoxy propane and 0.01 M 50 mL HCl, and was left to incubate for 1 h at 50°C. Standard 20, 10, 5, 2.5, 1.25, and 0.625 nmol/mL solutions were prepared from this main stock solution. 19
Thiol analysis protocol: The Ellman method was employed for the thiol assay in testis tissue. 21 The sulfhydryl groups were determined in tissue using an Ellman separator: 4 mg dithiobis 2 nitrobenzoic acids (DTNB) was dissolved in 1% sodium citrate solution for this analysis. Next, 1000 µL 3 M Na2HPO4 and 250 µL DTNB solution were added to 250 µL tissue supernatant and read at a wavelength of 412 nm on a spectrophotometer. A standard chart was produced using a data range of 1000 µM–62.5 µM, and the results were expressed as nmol/wet tissue.
Statistical analysis: SPSS software (SPSS Statistics, IBM, Armonk, NY, USA) was used for statistical analyses. The post-hoc-ANOVA test was applied to biochemical findings, and the Kruskal Wallis/Tamhane T2 tests were used in the calculation of semi-quantitative analysis results and histopathological damage scoring. The post-hoc-ANOVA Tukey HSD test was used for molecular analyses.
Molecular analyses
mRNA isolation: A Macherey Nagel mRNA isolation kit (740955.50) was used for mRNA isolation from testis tissue placed into sterile RNAse/DNAse-free Eppendorf tubes. The mRNA isolated in line with the kit protocol was stored at −80°C.
cDNA synthesis: The mRNA specimens obtained were processed in line with the GoScriptTM Reverse Transcription System (A5000, Promega, USA) kit protocol. cDNA synthesis was performed, and specimens were stored under appropriate conditions.
Real-Time PCR: Rpl 19 was used as a housekeeping gene in the normalization of gene expression (Rn00821265, Applied Bioscience, USA). Real-time PCR was performed as described below using histone (Hist1A1, Rn00561384, Applied Bioscience, USA) and protamine (Prm1, Rn02345725, Applied Bioscience, USA) primers are nuclear-quality markers Light Cycler 480 II Roche (LightCycler®480 Instrument II): 50°C 2 min, 95°C 10 min, 40 cycles 95°C 15 s 60°C 1 min and 72°C 1 s, 40°C 30 s. The calculation was performed using the formula 2^−(ΔΔct).
Results
Histological results
H&E staining analysis revealed a normal testis tissue seminiferous tubule architecture and spermatogenic germ cell cycle among the control group histopathological findings. Myoid cells around the tubule exhibited a flat nucleus, while heterochromatin materials were present in the Sertoli cell nucleus, and distinct nucleoli were observed. The eosinophilic cytoplasm in Leydig cells in the interstitial space was normal in appearance. Spermatogonia, primary spermatocytes, spermatids, and spermatozoon cell series at various stages inside the tubule also exhibited normal courses (Figure 1(a) and (b); Table 3). Edematous areas in the seminiferous tubule germinal epithelium were observed in the Imatinib-20, Imatinib-40 and Imatinib-60 groups, and a slight increase in the germinal epithelium was detected in the Imatinib-20 group (Figure 1(c) to (h); Table 3).

Representative light microscopic images of testis tissue sections stained with H+E. Spermatogonia (ok). Primary spermatocytes (tailed arrow). Spermatozoa (arrowhead). Sertoli cell (spiral arrow). Leydig cell (curly arrow). (a (×20) and b (×40)) Normal spermatogenic cells and Sertoli cells (spiral arrow) in the seminiferous tubule in control group testis tissue sections, and normal Leydig cells (curly arrow) in the intertubular spaces (Johnsen score: 10 (9–10)). (c (×20) and d (×40)) Numerous Sertoli cells, Leydig cells and spermatogenic cells can be seen in the seminiferous tubules in testis tissue sections from the Imatinib-20 group. A slight decrease in the germinal epithelium of the seminiferous tubule and disorganization-associated edematous areas can also be seen (Johnsen score: 9 (9–9.5)). (e (×20) and f (×40)) Numerous spermatogonia (arrow), spermatozoa (arrowhead), primary spermatocytes (tailed arrow), and Sertoli cells (spiral arrow) in testis tissue sections from the Imatinib-40 group. A few edematous areas can also be seen in the germinal epithelium. Leydig cells (curly arrow)(Johnsen score: 9 (8.5–9)). (g (×20) and h (×40)) Numerous spermatogenetic cells and Sertoli cells (spiral arrow) can be seen in testis tissue sections from the Imatinib-60 group, together with occasional edematous areas in the germinal epithelium. Leydig cells (curly arrow) (Johnsen score: 8.5 (8–9)).
Biochemical, histomorphometric and sperm analyses results.

ap = 0.014: Imatinib-20 group compared to the control group.
bp = 0.005: Imatinib-20 group compared to the Imatinib-40 group.
cp = 0.000: Imatinib-20 group compared to the Imatinib-60 group.
dp = 0.027: Imatinib-60 group compared to the control group.
ep = 0.031: Imatinib-40 group compared to the Imatinib-60 group.
fp = 0.003: Imatinib-20 group compared to the control group.
gp = 0.003: Imatinib-20 group compared to the Imatinib-40 group.
hp = 0.003: Imatinib-20 group compared to the Imatinib-60 group.
ip = 0.037: Imatinib-20 group compared to the Imatinib-40 group.
kp = 0.000: Imatinib-20 group compared to the Imatinib-60 group.
lp = 0.05: Imatinib-40 group compared to the control group.
mp = 0.000: Imatinib-40 group compared to the Imatinib-60 group.
np = 0.005: Imatinib-60 group compared to the control group.
One-way ANOVA/Tukey HSD test.
* Kruskal Wallis/Tamhane T2 test.
A marked decrease in total sperm counts was observed in the Imatinib-20 group compared to the control group, but no difference was observed in the Imatinib-40 and Imatinib-60 groups (Table 4).
Total sperm counts in the control and imatinib treated groups.a

a One way-ANOVA post-hoc Tukey T2 test.
Immunohistochemical findings
The positivity scores of testis tissue stained with the DNA damage marker 8-OhDG antibody were 0 in all groups (Figure 2; Table 5). Anti-PDGF antibody exhibited no staining in various cells in the tubule in the control, Imatinib-20, Imatinib-40, and Imatinib-60 groups, although intense staining was observed in Leydig cell and connective tissue cytoplasm in the interstitial space and vascular structure cells. No significant difference was found in PDGF staining positivity scores among the groups (Figure 3; Table 5).

Representative light microscopic images of sections from testis tissue exposed to 8-OHdG primary antibody with the IHC method. Spermatogonia (arrow). Primary spermatocytes (tailed arrow). Spermatozoa (arrowhead). Sertoli cell (spiral arrow). Leydig cell (curly arrow). (a (×20) and b (×40)) Normal spermatogenetic cells in seminiferous tubules from control group testis tissue sections, Sertoli cells (spiral arrow), and normal Leydig cells (curly arrow) in intertubular areas (8-OHdG positivity score: 0 (0–0)). (c (×20) and d (×40)) Immune negative spermatogenetic cells in seminiferous tubules in Imatinib-20 group testis tissue sections, and Sertoli and Leydig cells (8-OHdG positivity score: 0 (0–0.5)). (e (×20) and f (×40)) Numerous spermatogonia in epithelial cells in seminiferous tubules from Imatinib-40 group testis tissue sections (arrow); no immunopositivity appears in primary spermatocytes (tailed arrow), spermatozoa (arrowhead) and Sertoli cells (spiral arrow). Leydig cells (curly arrow; 8-OHdG positivity score: 0 (0–1)). (g (×20) and h (×40)) 8-OHdG-immunonegative Sertoli cells (spiral arrow) and Leydig cells in testis tissue sections from the Imatinib-60 group (8-OHdG positivity score: 0 (0–1)).

Representative light microscopic images of testis tissues exposed to PDGF primary antibody with the IHC method. Spermatogonia (arrow). Primary spermatocytes (tailed arrow). Spermatozoa (arrowhead). Sertoli cell (spiral arrow). Leydig cell (curly arrow). (a (×20) and b (×40)) Normal spermatogenetic and Sertoli (spiral arrow) cells in the seminiferous tubule in testis tissue sections from the control group. PDGF positivity can also be seen in Leydig cells (blue curly arrow) and myoepithelial cells in intertubular areas (PDGF positivity score: 1 (1–1)). (c (×20) and d (×40)) PDGF positivity in Leydig cells (blue curly arrow) and myoepithelial cells in testis tissue sections from the Imatinib-20 group (PDGF positivity score: 1 (1–1)). (e (×20) and f (×40)) No immunopositivity in numerous spermatogonia (arrow), primary spermatocytes (tailed arrow), spermatozoa (arrowhead) and Sertoli cells (spiral arrow) in testis tissue sections from the Imatinib-40 group. PDGF positivity can be seen in Leydig cells (curly arrow) (PDGF positivity score: 1 (0.5–1)). (g (×20) and h (×40)) PDGF immunoreactivity in the germinal epithelium in testis tissue sections from the Imatinib-60 group, with PDGF positivity in Sertoli cells (spiral arrow) and Leydig cells (PDGF positivity score: 1 (1–2)).
Semiquantitative analysis results (median (25%–75% interquartile range)).a

a Kurskal Wallis/Tamhane T2 test.
Anti-c-kit antibody applied to tissues revealed intense expression in round and elongated spermatids and spermatozoa (Figure 4; Table 5). No significant difference in positivity scoring was determined in the Imatinib-20, Imatinib-40 and Imatinib-60 groups compared to the control group.

Representative light microscopic images of testis tissue sections administered c-Kit primary antibody using the IHC method. Spermatogonia (arrow). Primary spermatocytes (tailed arrow). Spermatozoa (arrowhead). Sertoli cell (spiral arrow). Leydig cell (curly arrow). (a (×20) and b (×40)) c-Kit negative spermatogonia (arrow), primary spermatocytes (tailed arrow), spermatozoa (arrowhead), and Sertoli cells (spiral arrow) in normal seminiferous tubules in control group testis tissue sections. c-Kit negative Leydig cells (curly arrow) can also be seen in intertubular areas (c-Kit positivity score: 0 (0–0.5)). (c (×20) and d (×40)) Immunonegative spermatogonia (arrow), primary spermatocytes (tailed arrow), and Sertoli cells (spiral arrow) in seminiferous tubules in testis tissue sections from the Imatinib-20 group. In contrast, there is no c-Kit positivity in spermatozoa (blue arrowhead) (c-Kit positivity score: 2 (1.5–2)). (e (×20) and f (×40)) Ic-Kit immunopositivity in spermatozoa in seminiferous tubules in testis tissue sections from the Imatinib-40 group, but no immunopositivity in germinal epithelial cells or Leydig cells (c-Kit positivity score: 2 (2–2)). (g (×20) and h (×40)) Intense c-Kit positivity in numerous spermatozoa and little positivity in spermatogonia can be seen in seminiferous tubules in testis tissue sections from the Imatinib-60 group. In contrast, no positivity can be seen in Sertoli cells (spiral arrow) or Leydig cells (tailed arrow) (c-Kit positivity score: 2 (2–3)).
TUNEL analysis findings
No stain was observed in negatively stained tissues from groups exposed to the TUNEL method, while staining was regarded as positive in the control, Imatinib-20, Imatinib-40, and Imatinib-60 groups. However, no significant differences were observed between the control, Imatinib-20, Imatinib-40 and Imatinib-60 groups (Figure 5; Table 5).

Representative light microscopic images of the TUNEL method employed to identify apoptotic cells in testis tissue sections. (a (×20)) Control group testis tissue seminiferous tubule epithelial cells exhibit a normal appearance, and a few apoptotic germinal epithelial cells can be seen (TUNEL positivity score: 0 (0–0.5)). (b (×40)) Seminiferous tubule epithelial cells in the Imatinib-20 group exhibit a typical architecture, and very few apoptotic germinal epithelial cells can be seen (TUNEL positivity score: 0 (0–0)). (c (×40)) Seminiferous tubule epithelial cells in the Imatinib-40 group exhibit a typical architecture (TUNEL positivity score: 0 (0–0)). (d (×40)) TUNEL-negative germinal epithelial cells, Sertoli cells (spiral arrow) and Leydig cells in testis tissue sections from the Imatinib-60 group (TUNEL positivity score: 0 (0–0)).
Biochemical analysis findings
TBARS analysis results showed a significant increase in testis tissues in the Imatinib-20 group compared to the control group, while a significant decrease was determined in the Imatinib-60 group, although no statistically significant difference was found in the Imatinib-40 group (Table 3). Values decreased significantly in the Imatinib-40 and Imatinib-60 groups compared to the Imatinib-20 group (Table 3). Serum TBARS analysis revealed a significant increase in the Imatinib-20 group compared to the control group, but no statistically significant difference was observed in the Imatinib-40 and Imatinib-60 group values, although the increase in the Imatinib-20 group was significantly greater than in the other groups (Table 3).
Thiol group analysis results showed that values decreased in testis tissue from the Imatinib-20, Imatinib-40 and Imatinib-60 groups compared to the control group, although this decrease was not statistically significant. Serum thiol levels decreased significantly in the Imatinib-60 group compared to the control group, while the Imatinib-40 group exhibited an increase compared to the control group. The decrease in the Imatinib-20 group compared to the control group was not statistically significant (Table 3).
Real-time analysis results
Molecular analyses revealed an increase in protamine gene expression in the Imatinib-20 and Imatinib-60 groups compared to the control group, but no change was observed in the Imatinib-40 group (Figure 6). No difference was observed in histone expression in the other groups compared to the control group, but the expression in the Imatinib-60 group was higher than that in the Imatinib-40 group (Figure 7). No difference was determined between the groups in terms of protamine and histone gene expression levels in testicular tissue exposed to imatinib.

Expression of the protamine (PRM1) gene in control and imatinib-20, imatinib-40, imatinib-60 group rats. Expression of the protamine (PRM1) gene in control and imatinib-20, imatinib-40, imatinib-60 groups rats. The p value was 0.003 between the control and imatinib-20 groups. The p value between the control group and imatinib-60 group was 0.036 (ANOVA, post-hoc Tukey HSD test).
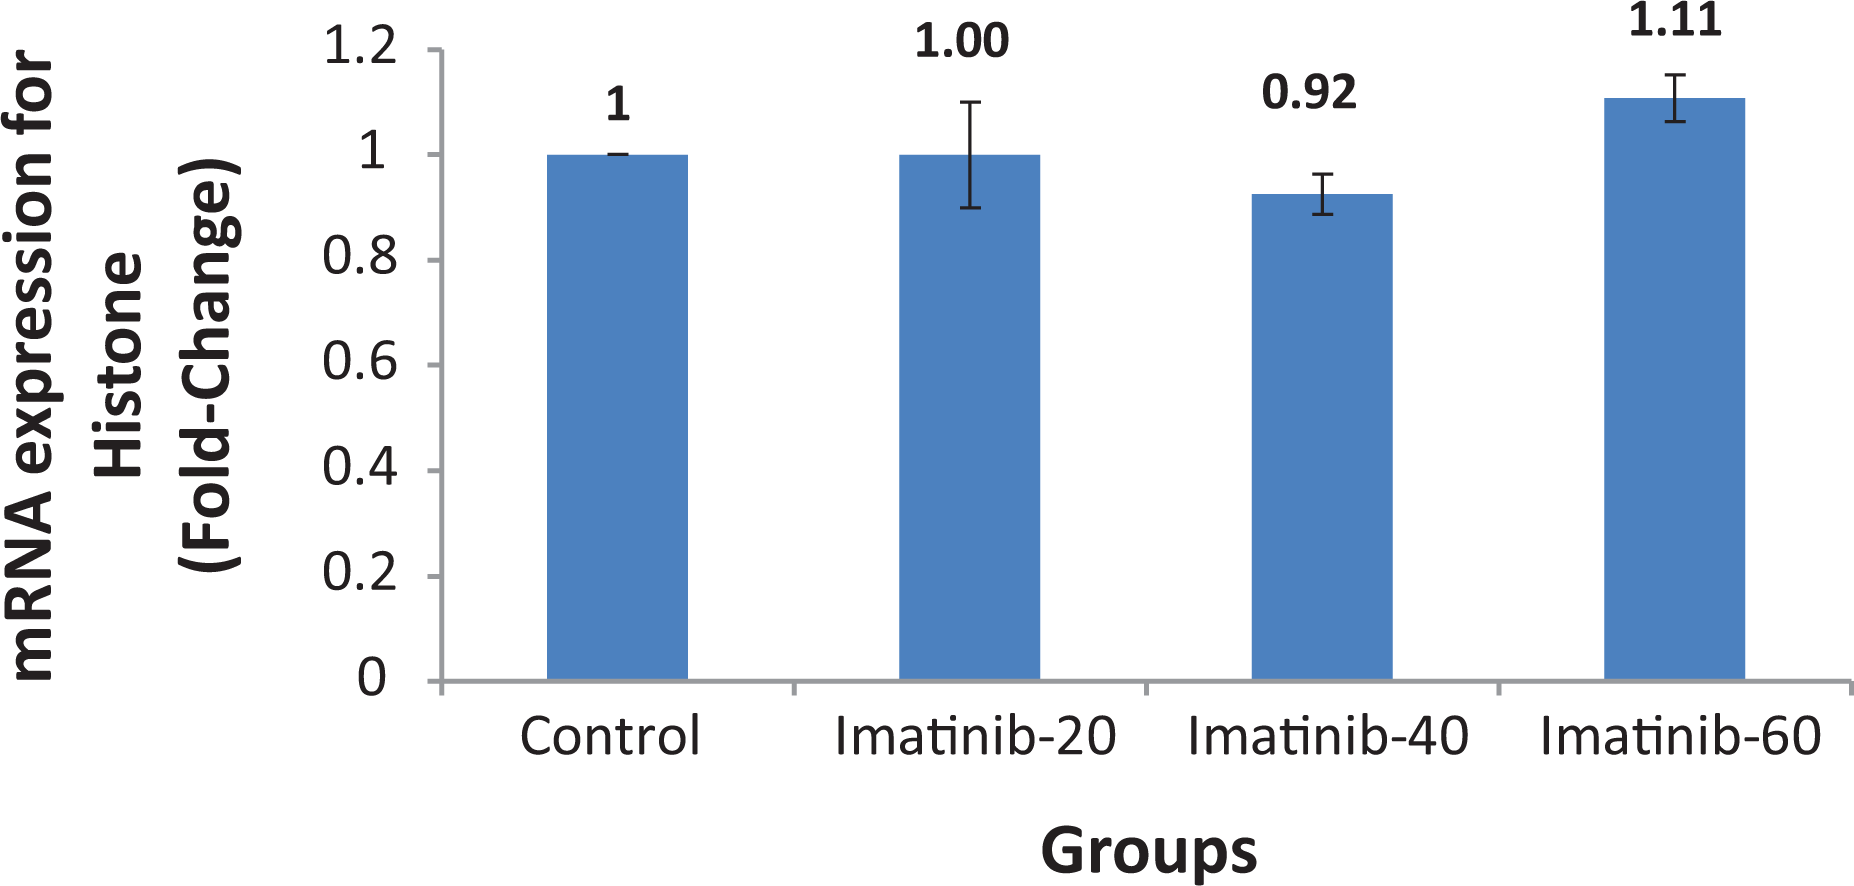
Expression of the histone (sHist1A1) gene in control and imatinib-20, imatinib-40, imatinib-60 group rats. Expression of histone (sHist1A1) gene in control and imatinib-20, imatinib-40, imatinib-60 groups rats. The p value was 0.02 between the imatinib-40 and imatinib-60 groups (ANOVA, post-hoc Tukey HSD test).
Discussion
The concern that drug use in pregnant patients in the prenatal period may lead to teratogenic effects in the fetus is an important consideration in the treatment of most diseases. Different effects have been reported in the literature concerning the use of imatinib in the prenatal period. Jain et al. reported that a woman using long-term imatinib, including throughout pregnancy, experienced an ectopic pregnancy in her first pregnancy, but that the baby boy born at 35 weeks in the second pregnancy exhibited such teratogenic effects as right external ear malformation, preauricular tag, absence of the angular oris muscle, imperforate anus, spina bifida occulta, absence of the right kidney, and ectopic left kidney. 22 In another case report, a woman using 400 mg imatinib a day discontinued the medication when she realized she was 6 weeks pregnant, but the fetus, diagnosed with meningocele, was stillborn. 23 Carlier et al. encountered cardiopathy, and renal and urinary system anomalies in pregnancies occurring following paternal imatinib exposure. 12 In another study, although low-level imatinib was encountered in specimens collected from cord blood, amniotic fluid, and the placenta from a woman started on imatinib therapy on the 28th week of pregnancy, high levels of imatinib were detected in neonatal urine, and high levels of its metabolite N-desmethyl imatinib were found in the mother’s milk. 24
In contrast to these findings, Russell et al. reported that medication was stopped in a CML patient using imatinib in the first 4 weeks of pregnancy, that leukocytosis and thrombocytosis subsequently developed during the pregnancy, at which time imatinib was then resumed, and that a female baby was delivered with no prenatal complications. 25 Those authors concluded that exposure to imatinib should be avoided during the organogenesis period. 25 Ali et al. discovered that a patient using 400 mg imatinib was 8 weeks pregnant in the fourth month of treatment and stopped the imatinib therapy. 26 They reported no complications in the female baby born in the 38th week of pregnancy. 26 In another study, a baby born to a patient using imatinib in the first 5 months of pregnancy was followed-up until the age of 8 years, and no malformations were observed. 27
Some studies have also investigated the effects of imatinib on the male reproductive system. One in vitro study of germinal cells showed a decrease in germline stem cell culture growth and differentiated cells including spermatogonial stem cells, but reported that the self-renewal of spermatogonial stem cells was unaffected by imatinib. 28 Prasad et al. showed that imatinib administration resulted in histopathological changes in the adult mouse testis, but that these changes reversed with discontinuation of the drug. 29 A decrease in the germinal epithelium and edematous areas were detected in the groups receiving imatinib in the present study. Interestingly, however, while no difference was determined in the Imatinib-20 and Imatinib-40 groups compared to the control group in terms of Johnsen scoring, a decrease occurred in the Imatinib-60 group score. Nurmio et al. reported a decrease in the number of peripherally located type A spermatogonia and apoptosis in spermatogonia following imatinib exposure at doses of 50 mg/kg and 150 mg/kg on postnatal days 5–7, but that cell migration was unaffected and no change occurred in epididymal sperm numbers. 30 In the present study, a normal quantity of apoptotic cells was encountered in spermatogonia in the seminiferous tubules in testis sections stained using the TUNEL method, although no significant change was observed between the groups.
Positive staining in type A spermatogonia, acrosomal granules of round spermatids and Leydig cells has been observed with immunohistochemical staining for c-kit in human testis tissue, together with variation in staining in Sertoli cells in both normal and subfertile individuals. 31 In another study, Sandlow et al. reported varying levels of c-kit expression in early spermatogenic cells, Leydig cells, the acrosomal granules of round spermatids, and in the acrosomal region of spermatozoa inside the tubule in mice, rats and humans. 32 C-kit has also been observed in the elongated spermatid stage during spermatogenesis maturation and in epididymal spermatozoa. 33 Consistent with the previous literature, immunohistochemically labeled c-kit was intensively stained in round spermatids and testicular spermatozoa in all groups in the present study, but no difference was observed in histopathological grade measurements at staining analysis. Basciani et al. showed positive PDGF staining not only in Sertoli and Leydig cells in the fetal period, but also in spermatocytes, spermatozoa, and perimyoid cells (PMCs) in addition to Sertoli and Leydig cells in adulthood. They therefore suggested that PDGF might be a target or a potential growth factor for other cells. 34 We observed intensive involvement in Leydig cells and PMCs between the seminiferous tubules at immunohistochemical PDGF staining, but no difference was determined in positivity scoring between the groups.
A number of studies have also shown that imatinib increases oxidative stress levels. 35,36 Based on our biochemical findings, although oxidative stress increased significantly in testis tissue in the Imatinib-20 group compared to the control group at TBARS measurements, we determined a decrease in the Imatinib-60 group. One study involving an induced hepatic fibrosis model reported a decrease in oxidative stress in a group receiving imatinib. 37 Another study reported that imatinib administered to heart tissue did not directly result in oxidative stress. 38 Our serum findings showed a decrease in TBARS levels in all groups compared to the control group, although these decreases were only significant in the Imatinib-20 and Imatinib-40 groups. Not only imatinib, but also secondary tyrosine kinase inhibitors used in the treatment of leukemia have been shown or reported to reduce oxidative stress and apoptosis in an induced diabetes model in animals. 39
Al-Rasheed et al. observed that imatinib caused a decrease in GSH values in liver tissue, 35 while Emadi et al. reported that imatinib reduced sources of GSH in the kidney. 36 In our thiol measurements, we similarly observed a significant decrease in imatinib in testis tissue in the Imatinib-60 group, together with insignificant decreases in the Imatinib-20 and Imatinib-40 groups. However, our serum findings revealed a significant increase in thiol values in the Imatinib-40 group compared to the control group, but a significant decrease in the Imatinib-60 group.
Protamine and histone are used as markers of nuclear maturation and quality. 40 Analysis of gene expression levels in the present study showed that protamine and histone expression were not affected in testis tissue exposed to imatinib. Based on our findings, it may be concluded that imatinib exhibits no change in nuclear maturation during spermiogenesis. Some previous studies have shown that imatinib results in a decreased sperm count. 41,42 The present study showed a significant decrease in total sperm numbers in the Imatinib-20 group compared to the control group. Schultheis et al. reported normal ovulation in female rats administered imatinib, as well as normal sperm production in male rats. 43 Similarly in the present study, we observed no difference in sperm counts in the Imatinib-40 and Imatinib 60 groups compared to the control group, while the sperm count in the Imatinib-60 group increased compared to the Imatinib-20 group.
De Moura et al. reported that pregnant patients exposed to TKI in the first weeks of pregnancy exhibited no congenital malformations, but nevertheless recommended that TKI use be avoided during pregnancy. 44 Long-term imatinib use has been observed to cause vascular contraction in the placenta and shrinkage in the trophoblast layer both in rats receiving imatinib during pregnancy and also in rats in which imatinib use was stopped before pregnancy. 45 Normal births have been reported in association with the use of imatinib in the second and third trimesters of pregnancy, with lower concentrations of imatinib being observed in umbilical blood than in maternal blood. 46 In addition, although the amount of imatinib detected in mother’s milk is much lower than at therapeutic doses, the effects in babies are unknown. 47 In the light of this information, we also think that imatinib use in the prenatal period can have adverse impacts at the molecular and biochemical level, despite exhibiting no effects on fetus testis tissue. Any adverse event encountered in the pre-embryonic period has been reported, based on the all-or-none principle, to result in either survival or fetal death. 48 The fact that no pregnancy occurred in rats in the estrus stage with a regular cycle in the group receiving 80 mg imatinib in this study may also be associated with this principle.
This study investigated the effects of imatinib on testis tissue throughout pregnancy. A healthy control group undergoing no procedures was added in order to observe potential poor conditions in tissue processing. Nonetheless, there are still a number of limitations to this study. First, the effects of increasing dosages of imatinib on the population, such as the sex of offspring and birth rates, could not be examined due to the low number of experimental animals. The present research now needs to be supported by studies investigating the genetic and molecular damage mechanisms involved at increasing dosages, and particularly the absence of pregnancy at 80 mg/kg.
Planned management for CML patients wishing to become parents has been reported to be capable of exhibiting positive effects on the health of the mother and child. 49 Some studies have suggested that elective discontinuation of TKIs among CML patients who wish to become pregnant, followed by resumption after giving birth, will cause no severe effects through the interruption of treatment (such as sequelae or permanent damage). 50 It has also been suggested that discontinuing TKI therapy before pregnancy and using therapies such as interferon-α during pregnancy can also be a safe option. 51
Measurement of levels of mitochondrial Ca++ as well as oxidant/anti-oxidant enzymes and molecules is now required to complement this study.
Conclusion
Even though Imatinib caused no inhibition of spermatogenesis at 20 and 40 mg, this was not the case at 60 mg. This preliminary study now requires further confirmatory investigations to elucidate the signaling pathways at the cellular and molecular levels.
Footnotes
Declaration of conflicting interests
The author(s) declared no potential conflicts of interest with respect to the research, authorship, and/or publication of this article.
Funding
The author(s) disclosed receipt of the following financial support for the research, authorship, and/or publication of this article: This work was supported by the Recep Tayyip Erdoğan University, Rize, Turkey [TDK-2017-825].