
Abstract
Alzheimer’s disease (AD) is a chronic neurodegenerative disease leading to progressive dementia in elderly people. The disease is characterized, among others, by formation of amyloid-β (Aβ) polypeptide plaques in the brain. Although etiology of the disease is not fully understood, recent research suggest that nanomaterials may affect AD development. Here, we described the consequences of exposure of mouse BV-2 microglia to silver nanoparticles (AgNPs, 50 µg/mL), cerium oxide nanoparticles (CeO2NPs, 100 µg/mL), and cadmium telluride quantum dots (CdTeQDs, 3 or 10 µg/mL) in the context of its ability to clear Aβ plaques. The brain microglial cells play an important role in removing Aβ plaques from the brain. Cell viability and cycle progression were assessed by trypan blue test and propidium iodide binding, respectively. The uptake of Aβ and NPs was measured by flow cytometry. Secretion of proinflammatory cytokines was measured with the use of cytometric bead array. Aβ (0.1 μM) did not affect viability, whereas NPs decreased microglia growth by arresting the cells in G1 phase (CdTeQDs) or in S phase (AgNPs and CeO2NPs) of cell cycle. The uptake of Aβ was significantly reduced in the presence of AgNPs and CeO2NPs. In addition, the least toxic CeO2NPs induced the release of proinflammatory cytokine, tumor necrosis factor α. In summary, each of the NPs tested affected either the microglia phagocytic activity (AgNPs and CeO2NPs) and/or its viability (AgNPs and CdTeQDs) that may favor the occurrence of AD and accelerate its development.
Keywords
Introduction
Alzheimer’s disease (AD) is one of the most common chronic neurodegenerative diseases leading to progressive dementia in elderly people. No effective therapy against the disease has been developed so far and its treatment is aimed at relief of symptoms and delaying of the disease progression. 1 Intracellular neurofibrillary tangles (NFTs) and extracellular senile plaques in the brain are two main hallmarks of the AD. 1 NFTs consist of aggregated abnormally hyperphosphorylated microtubules associated with Tau protein. Extracellular plaques are composed of insoluble, aggregated Aβ peptides, dystrophic neurites, and Tau or chromogranin A proteins. In physiological conditions, properly functioning autophagy prevents accumulation of NFTs; however, with aging, the autophagy becomes less effective and NFTs may accumulate in neurons. 1 The clearance extracellular plaques mainly depends on the phagocytic activity of microglia. Malfunctioning of microglia facilitates the development of AD. 2
Microglia constitute about 10% of all cells (by number) in the central nervous system and are involved in innate immune response. Microglial cells are able to phagocyte damaged or dead cells and cellular debris, including amyloid-β (Aβ). 3,4 Once uptaken, the peptide is degraded in lysosomes. 2,5,6 In stress conditions, microglial cells become activated and release anti-inflammatory cytokines and chemokines, mitigating inflammatory response but generating reactive oxygen and nitrogen species. 3 –5 If excessively or chronically activated, for example, by increased accumulation of Aβ deposits, microglia become neurotoxic and start to produce proinflammatory cytokines that may lead to development or progression of AD. 2,7 –10
In the past decade, a remarkable development of nanotechnology has been observed. Nanomaterials are widely used in industry and everyday products, but increasing body of evidence proves also their potential usefulness in treatment or diagnosis of numerous diseases. Silver nanoparticles (AgNPs), due to their antimicrobial properties, are widely used in medical devices, wound dressings, dental materials, and so on. 11,12 Cadmium telluride quantum dots (CdTeQDs) have unique photophysical properties and were proposed as useful markers in molecular bioimaging techniques. 13,14 Although there is no clear evidence that NPs are able to cross blood–brain barrier, it was shown that NPs can accumulate in the brain. 15 –17 Thus, they can be used as drug carriers or diagnostic tools. 11,18 –20 Cerium oxide nanoparticles (CeO2NPs) have antioxidant properties that make them potentially useful in therapy. 10,18,21 –25 They were demonstrated to mitigate reactive gliosis and mitochondrial damage in neurodegenerative diseases, thus they are foreseen to be a promising candidate for the treatment of AD. 25 In addition, N-acetyl-L-cysteine-capped CdTeQDs were reported to disaggregate the existing amyloid plaques or fibrils and thus reduce their toxicity. 26 PEGylated selenium nanoparticles conjugated with antitransferrin receptor monoclonal antibody (OX26) activate ubiquitin-proteasome system and autophagy enhancing elimination of damaged or unfolded proteins. 27
On the other hand, many reports describe possible detrimental effects of NPs, like cytotoxicity or inflammation. 11,12,28,29 Harmful effects of AgNPs on cells and organisms have been repeatedly proven and widely described, however, this is yet subject of debate to what extent silver ions released from nanoparticles are responsible for these effects. 11,12,21,29 Similar to AgNPs, QDs are highly cytotoxic; hence, their use should be strictly controlled, 30 –32 while toxicity of CeO2NPs seems to be low. Nonetheless, toxicity of NPs toward brain cells is still not adequately studied, especially in the context of neurodegenerative diseases.
Thus, the aim of this study was to compare the effects of AgNPs, CeO2NPs, and CdTeQDs on BV-2 microglial cells growth and viability, proinflammatory signaling, and their ability to phagocytose Aβ. The main goal was to verify whether NPs can improve clearance of Aβ in the AD. Our results revealed that the Aβ uptake was impaired in the presence of AgNPs and CeO2NPs. Moreover, seemingly harmless CeO2NPs induced the release of tumor necrosis factor α (TNFα), a cytokine involved in the development of several neurodegenerative diseases. 33
Methods
Cell culture
BV-2 mouse microglial cells were purchased from Banca Biologica e Cell Factory Centro di Risorse Biologiche IRCCS Azienda Ospedaliera Universitaria GENOVA (Genoa, Italy) and maintained in RPMI-1640 medium with 10% fetal bovine serum (FBS) (Biological Industries, Israel) and 2 mM
Characterization of amyloid-β (1–42) in solution
Unlabelled human Aβ (1–42) was purchased from AnaSpec Inc. (Belgium), dissolved in deionized water (500 µM) and frozen in aliquots at −80°C. The appearance of polypeptide aggregates was observed with the use of scanning electron microscope (SEM, Zeiss, Oberkochen, Germany).
Preparation and characterization of nanoparticles suspension
Silver nanoparticles (AgNPs, 20 nm) and CdTeQDs (3.8 nm, em 650 ± 5 nm, hydrophilic, terminated with –COOH group) were purchased from PlasmaChem GmbH (Germany), CeO2NPs (≥25 nm) were purchased from Sigma-Aldrich (St Louis, California, USA). NPs (2 mg) were suspended in 800 µL of deionized water and sonicated (10 min) on ice at a radiant energy density of 4.2 kJ/cm3. Immediately after sonication, 100 µL of 15% BSA followed by 100 µL of 10× PBS were added to get NPs stock suspension (2 mg/mL) in PBS with 1.5% BSA, pH = 7.1. The size distribution profile and zeta potential of these NPs preparations were measured by dynamic light scattering (DLS, Malvern, UK), at 25°C with a scattering angle of 173°, in triplicate, with 14 subruns. Concentrations of NPs for the experiments were chosen according to IC50 established in 3-(4,5-dimethyl-2- thiazolyl)-2,5-diphenyl-2H-tetrazolium bromide (MTT) assay (Online Supplemental Table S1). The concentrations used were as follows: 50 μg/mL for AgNPs, 100 μg/mL for CeO2NPs, and 3 μg/mL for CdTeQDs.
Assessment of the uptake of amyloid-β and nanoparticles by microglial cells
BV-2 microglial cells were seeded into six-well plates and grew overnight to reach 1.35 × 10⁵ cells/well on average. The cells were incubated with Aβ (1–42) labeled with HiLyte™ Fluor 488
Possible influence of NPs on the HiLyte Fluor 488 fluorescence was checked as follows: HiLyte Fluor 488-labeled Aβ (1–42) was dissolved in the growth medium at the concentration of 0.1 µM. Fluorescence of this solution was measured with the use of a microplate fluorescence reader Infinite M200 (Tecan, Austria), set to excitation at 503 nm and emission 528 nm and compared with the fluorescence for HiLyte Fluor 488 labeled Aβ in combination with NPs at the same concentrations as used in the experiments.
Cell viability assays
Cytotoxicity of NPs was assessed by MTT assay. The results are presented in supplementary materials (Online Supplemental Table S1). The data obtained by MTT assay were used to calculate IC50 concentration for each NP; however, MTT assay is not suitable for measurement of Aβ toxicity. Aβ decreases cellular reduction of MTT by accelerating exocytosis of MTT and its product, formazan. 35 –37 Thus, viability of cells treated with Aβ or combination of Aβ and NPs was assessed by trypan blue exclusion test. 38 The cells were seeded in six-well plates at a density of 6 × 10⁴ cells/well and incubated with Aβ (0.1 µM), or/and AgNPs (50 µg/mL), CdTeQDs (3 µg/mL) or CeO2NPs (100 µg/mL) for 24 or 48 h. After incubation, both floating and attached cells were harvested and trypan blue was added to stain dead cells. Total cell number and percentage of dead cells were calculated after counting under a light microscope.
Cell cycle analysis by flow cytometry
To analyze the effect of Aβ and/or NPs on cell cycle progression, the cells were seeded in six-well cultured plates (TPP, Switzerland) at a density of 2 × 10⁴ cells per well and subsequently treated with Aβ (0.1 µM) or/and AgNPs (50 µg/mL), CdTeQDs (3 µg/mL) or CeO2NPs (100 µg/mL) for 48 h. After treatment, the cells were trypsinized, centrifuged (200 × g, 4°C, 10 min), washed with cold PBS, fixed in ice-cold 70% ethanol, and stored at −20°C until the analysis. For analysis, the fixed cells were spun down (1000 × g, 4°C, 10 min), washed with PBS, and incubated in PBS for 15 min at room temperature for rehydration. Then, 7 µL of RNAse A (Sigma-Aldrich, Saint Louis, Missouri, USA) at concentartion of 10 mg/mL was added to 300 µL of the cell suspension and incubated for 1 h at 37°C. Finally, propidium iodide (PI; 10 μL, 1 mg/mL) was added and the samples were kept on ice, in the dark, for further 30 min. DNA content in cells was assessed by measuring fluorescence of DNA-bound PI, with the use of a LSRFortessa (BD Biosciences) flow cytometer. DNA profiles were analyzed with the use of ModFit LT v 5.0 (Win)Software (Verity Software House Inc., USA).
TNFα, IL-1β, IL-6, and INFγ cytokines secretion
Secretion of proinflammatory cytokines by BV-2 cells was determined by cytometric bead array (CBA) method. The cells were seeded a day before the experiment in 24-well microplates at a density of 2.7 × 10⁴ cells per well in 0.4 mL medium. Then, the cells were treated with Aβ (0.1–10 μM) or/and AgNPs (50 μg/mL), CdTeQDs (3 μg/mL), and CeO2NPs (100 µg/mL) for 8, 24, and 48 h. After treatment, cell culture supernatants were collected, flash-frozen in liquid nitrogen, and stored at −80°C until the assay was performed. Concentration of cytokines was measured by flow cytometry using BD CBA Mouse/Rat Soluble Protein Master Buffer Kit and Mouse Flex Sets for TNFα, interleukin 1β (IL-1β), interleukin 6 (IL-6), and interferon γ (IFNγ) cytokines (BD Life Sciences—Biosciences, Franklin Lakes, New Jersey, USA: Catalog No. 558266) according to the manufacturer instructions. Lipopolysaccharide (30 µg/mL) from Escherichia coli 0127:B8 (Sigma-Aldrich, Saint Louis, Missouri, USA) was used as a positive control.
Statistical analysis
Statistical differences among means were determined by one-way or two-way analysis of variance, accompanied by post hoc analysis by Tukey’s multiple comparison tests, where applicable t-test was used. All calculations were made using GraphPad Prism 5.0 software (GraphPad Software, Inc., San Diego, USA).
Results
Amyloid-β (1–42) and NP characterization
SEM analysis showed that Aβ preparation used in our study is a mixture of monomers and amorphous aggregates of various sizes and shapes (Figure 1). Hydrodynamic diameter of tested NPs as measured by DLS is shown Table 1. The NPs after suspension were larger than a nominal size declared by the manufacturer, apparently due to the formation of BSA corona and/or aggregation. High polydispersity index and low zeta potential for CdTeQDs compared with AgNPs and CeO2NPs indicate their lower homogeneity and higher propensity to aggregate. Interestingly, AgNPs and CdTeQDs had a negative zeta potential, while CeO2NPs had similar zeta potential like AgNPs but positive.

Scanning electron micrograph of Aβ (1–42) oligomers in complete culture medium, after 24-h incubation at 4°C (magnitude ×100,000). EHT: extra high tension; WD: Western Digital; Aβ: amyloid-β.
DLS analysis of nanoparticles in the complete culture medium.a
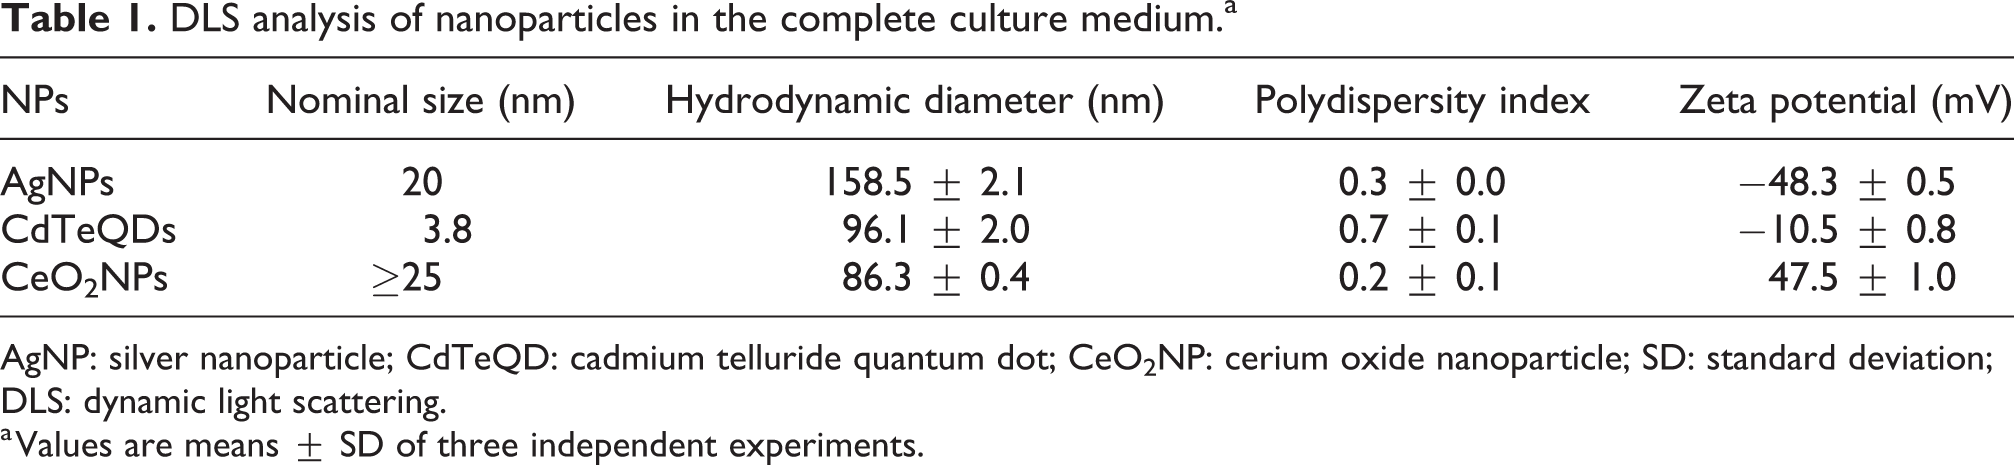
AgNP: silver nanoparticle; CdTeQD: cadmium telluride quantum dot; CeO2NP: cerium oxide nanoparticle; SD: standard deviation; DLS: dynamic light scattering.
a Values are means ± SD of three independent experiments.
Cell viability assays
Toxicity of AgNPs, CeO2NPs, and CdTeQDs was measured by MTT assay. Calculated IC50 values for 24-h treatment were as follows: 50, 100, and 3 μg/mL, respectively (Online Supplemental Table S1). Viability of cells treated with Aβ was assessed by trypan blue exclusion test after 24 or 48 h of incubation. The results revealed that 0.1 μM Aβ was not toxic for BV-2 cells. AgNPs and CdTeQDs inhibited viability by 20% (Figure 4), while CeO2NPs had no significant effect on viability of the cells. Concomitant treatment with Aβ and NPs showed no effect of Aβ on NPs cytotoxicity.

Assessment of AgNPs (50 μg/mL), CdTeQDs (3 µg/mL), CeO2NPs (100 µg/mL), and Aβ (1–42) (0.1 μM) uptake by microglia after 2-h incubation. AgNP: silver nanoparticle; CdTeQD: cadmium telluride quantum dot; CeO2NP: cerium oxide nanoparticle; Aβ: amyloid-β.

Influence of AgNPs (50 μg/mL), CdTeQDs (3 µg/mL), and CeO2NPs (100 µg/mL) on Aβ (1–42) (0.1 μM) uptake by microglia after 2-h incubation. AgNP: silver nanoparticle; CdTeQD: cadmium telluride quantum dot; CeO2NP: cerium oxide nanoparticle; Aβ: amyloid-β.

Comparison of Aβ, AgNPs (50 μg/mL), CdTeQDs (3 µg/mL), and CeO2NPs (100 µg/mL) effect on viability of BV-2 cells. Bars represent means ± SD, n = 3, ‘a’ denotes statistically significant difference versus control, p < 0.05, by two-way ANOVA, Tukey’s test. AgNP: silver nanoparticle; CdTeQD: cadmium telluride quantum dot; CeO2NP: cerium oxide nanoparticle; Aβ: amyloid-β; ANOVA: analysis of variance; SD: standard deviation.
Monitoring of nanoparticles and amyloid-β uptake by BV-2 microglia
Uptake of NPs and Aβ by BV-2 cells was measured by flow cytometry after 2-h treatment. Incubation with AgNPs or CeO2NPs alone significantly increased mean SSC value of BV-2 cells. In contrast, incubation with Aβ or CdTeQDs did not affect SSC value; thus, in this case, an increase in fluorescence was taken as a marker of the uptake. The representative plots are shown in Figure 2, whereas numerical values are given in Table 2.
Uptake of Aβ (0.1 μM), AgNPs (50 µg/mL), CeO2NPs (100 µg/mL), and CdTeQDs (10 µg/mL) by microglial cells after 2-h incubation, measured cytometrically as the increase in SSC or fluorescence.a

AgNP: silver nanoparticle; CdTeQD: cadmium telluride quantum dot; CeO2NP: cerium oxide nanoparticle; SSC: side scatter.
a Values are means ± SD, n ≥ 3.
bStatistically significant differences compared to control, p < 0.05, by t-test.
Influence of NPs on Aβ uptake, measured as a shift in fluorescence intensity, is given in Figure 3. Table 3 shows mean results of three independent experiments ± SD. Coincubation experiments revealed that AgNPs and CeO2NPs, but not CdTeQDs, significantly decrease Aβ uptake. The presence of Aβ during incubation with NPs did not change their uptake (Online Supplemental Table S2). It should be stressed that the observed decrease in HiLyte Fluor 488 fluorescence was not caused by the quenching effects of NPs (Online Supplemental Table S3).
Impact of NPs (AgNPs, 50 μg/mL; CeO2NPs, 100 μg/mL; CdTeQDs, 10 μg/mL) on Aβ uptake by microglial cells after 2-h incubation, measured cytometrically as a change in fluorescence distribution at 528 nm.a

AgNP: silver nanoparticle; CdTeQD: cadmium telluride quantum dot; CeO2NP: cerium oxide nanoparticle; Aβ: amyloid-β; NP: nanoparticle; ANOVA: analysis of variance; SD: standard deviation.
a Values are means ± SD, n ≥ 3.
b Statistically significant differences compared to control, p < 0.05.
cStatistically significant difference between fluorescence values of HiLyte™ Fluor 488 labeled Aβ (1–42) alone and in combination with NPs, p < 0.05, one-way ANOVA, accompanied by post hoc analysis by Tukey’s multiple comparison test.
Cell cycle analysis
The effect of Aβ and/or AgNPs, CeO2NPs, or CdTeQDs on BV-2 cells cycle progression was evaluated by flow cytometry (Figure 5 and Table 4). Aβ had no effect on cell cycle progression of exposed cells. In contrast, treatment with NPs resulted in alteration of cell cycle distribution: Treatment with AgNPs or CeO2NPs resulted in accumulation of cells in S phase, whereas after treatment with CdTeQDs, the arrest occurred in G1 phase. Moreover, early apoptosis (sub-G1 peak in the cytograms) was observed after AgNPs treatment (25% of whole population). The increased amount of more degraded cell fragments (cell debris) appeared after incubation with CdTeQDs. Simultaneous treatment with Aβ and NPs gave similar effects as treatment with NP alone (Online Supplemental Table S4).

Cell cycle distribution of BV-2 cells after treatment with Aβ (1–42) (0.1 μM), AgNPs (50 µg/mL), CdTeQDs (3 µg/mL), or CeO2NPs (100 µg/mL) for 48 h. AgNP: silver nanoparticle; CdTeQD: cadmium telluride quantum dot; CeO2NP: cerium oxide nanoparticle; Aβ: amyloid-β.
Cell cycle distribution in BV-2 population after treatment with Aβ and NPs.a

AgNP: silver nanoparticle; CdTeQD: cadmium telluride quantum dot; CeO2NP: cerium oxide nanoparticle; Aβ: amyloid-β; SD: standard deviation.
aBV-2 cells were treated with 0.1 µM Aβ (1–42), 50 µg/mL AgNPs, 3 µg/mL CdTeQDs, or 100 µg/mL CeO2NPs for 48 h. The percentages of cells in the respective cycle phases were calculated by using ModFit LT v 5.0 Software. Results are mean ± SD, n = 3.
b The level of apoptosis and debris was indicated as % of whole cell population.
c Statistically significant difference versus control group, p < 0.05, by t-test.
Proinflammatory cytokine release
Neither Aβ, nor NPs or their combinations had any effects on secretion of IL-1β, IL-6, and IFNγ by BV-2 cells. Concentrations of IL-1β, IL-6, and IFNγ were below detection limit of the assay (10 pg/mL); however, we were able to measure TNFα release. Interestingly, only treatment with CeO2NPs induced a statistically significant increase in TNFα secretion. This effect was not influenced by coincubation with Aβ (Figure 6 and Table 5).

Representative dot plots showing CeO2NPs stimulated TNF alpha production as measured by BD CBA assay in the conditioned culture medium. CBA: cytometric bead array.
TNFα secretion by BV-2 cells treated with 0.1 µM Aβ (1–42) and/or 50 µg/mL AgNPs, 3 µg/mL CdTeQDs, 100 µg/mL CeO2NPs, and LPS (30 µg/mL) as a positive control (for 8, 24, and 48 h).a

LPS: lipopolysaccharide; TNFα: tumor necrosis factor α; AgNP: silver nanoparticle; CdTeQD: cadmium telluride quantum dot; CeO2NP: cerium oxide nanoparticle; Aβ: amyloid-β; SD: standard deviation.
aValues are means ± SD of at least three independent experiments.
bStatistically significant difference versus control, p < 0.05 by t-test.
Discussion
The aim of this study was to elucidate effects of NPs on biological properties of microglial cells, including their viability, inflammatory response, and ability to uptake of Aβ.
We have shown that Aβ and NPs were effectively uptaken by BV-2 microglial cells. Aβ did not affect NPs uptake, while AgNPs and CeO2NPs (but not CdTeQDs) decreased the uptake of Aβ (Figures 2 and 3, Tables 2 and 3).
Different types of NPs can enter the cells through scavenger receptors as Aβ does. 39 –43 To the best of our knowledge, this is the first report about inhibition of amyloid uptake by microglia under the influence of nanoparticles.
It is possible that AgNPs and CeO2NPs may be taken up preferentially, whereas CdTeQDs could use alternative way, that is, through mannose receptor as well as through clathrin-dependent endocytosis 18 ; thus, they would not compete with Aβ.
In our experiments, Aβ (0.1 µM) had no detrimental effect on viability of BV-2 microglial cells (Figure 4). Our results are compatible with the results of Abe et al., 44 who found that Aβ did not induce any significant loss in viability of astrocytes. In contrast, AgNPs and CdTeQDs decreased viability of microglia (Figure 4). In agreement with other reports, we showed relative resistance of microglial cells to AgNPs. For example, Hsiao et al. 45 observed only a slight decrease in cell metabolic activity after treatment of BV-2 cells with 10 nm AgNPs, whereas no change in BV-2 cell proliferation was observed after incubation with 5 nm AgNPs. 29 In contrast to glial cells, the existing data repeatedly revealed high AgNPs cytotoxicity in various other cellular models, for example, HepG2, RAW264.7, HeLa, and A549 cells. 46 A few available data concerning cytotoxic properties of CdTeQDs toward microglial cells also confirm our results. Wu et al. 47 reported only 20% loss of viability of BV-2 cells treated with 30 nM CdTeQDs, and similar results were obtained for rat microglial N9 cells. 32 In contrast, CeO2NPs, although used at a relatively high concentration (100 µg/mL), did not affect BV-2 cell viability (Figure 4). No data are available on viability of microglia treated with CeO2NPs; however, a large number of reports describe antioxidative and neuroprotective properties of CeO2NPs that suggests rather low toxicity. 22 –25
Cell cycle analysis by flow cytometry was performed to discover arrest points that could give input to growth retardation (Figure 5 and Table 4). No adverse effect of Aβ treatment was observed in line with its negligible toxicity. On the contrary, treatment with AgNPs resulted in accumulation of BV-2 cells in S phase and onset of apoptosis. AgNPs-induced apoptosis and cell cycle arrest in G1 and S phases were also observed in other cellular models, for example, mouse macrophages and fibroblasts. 48,49 CdTeQDs caused G1 block, consistent to earlier findings on cadmium ions toxicity and ability to inhibit cell cycle progression. 50 The impact of CeO2NPs on cell cycle progression was visualized as a slight retardation in S phase and no apoptosis. It should be added that concomitant treatment with Aβ and NPs did not change neither NPs cytotoxicity nor their effects on cell cycle progression (Figure 4, Online Supplemental Table S4).
It has been reported that Aβ caused the release of proinflammatory cytokines and chemokines by human, rat, or mouse microglia. 51 –54 An increased level of proinflammatory cytokines has been also observed in brain tissue of AD patients. 4,10 Nonetheless, in our experiments, no release of IL-1β, IL-6, TNFα, and IFNγ was observed after treatment with Aβ (1–42) in the concentration range of 0.1–10 μM. This discrepancy might be due to the different experimental setup or different aggregation stage of Aβ. It was reported that isolated Aβ (1–42) protofibrils, but not isolated fibrils, are robust stimulators of BV-2 microglia, 51 thus, different mixtures of aggregated and nonaggregated βA might evoke different cellular response.
No increased release of cytokines was also observed after treatment with AgNPs (Table 5). This is in agreement with the results of Hsiao et al. 45 obtained for BV-2 cells, treated with 10 nm AgNPs; however, it was reported that 3-5 nm AgNPs induced IL-1β release. 29 AgNPs induced the release of IL-1β, IL-6, and IL-8, and TNF α was also reported for human monocytes, normal lung cells, and glioblastoma cells. 55,56 The observed variability in AgNPs potential to evoke proinflammatory response might be an effect of different cells used in different laboratories, and/or treatment time, NP size, and concentration. It is well documented that smaller AgNPs exert more pronounced effects on mammalian cells. 57
In line with this, CdTeQDs did not induce any proinflammatory cytokine release in our study (Table 5). Despite the well-documented toxicity of CdTeQDs, there are not many studies concerning their effects of on cytokine release by mammalian cells. Wu et al. 47 observed an increased release of IL-1β mRNA and protein in BV-2 cells after treatment with 3-mercaptopropionic acid (MPA)-modified CdTeQDs (40 nM). Interestingly, an increase in mRNA level of IFNα and TNFα was also reported, however, without any mention about protein release.
Cytokine release by microglia treated with CeO2NPs was not yet described, either. Although in in vivo inhalation experiment with CeO2NPs aerosol, the level of IL-1β, IL-6, and TNF α raised in bronchoalveolar lavage fluid and in blood of exposed rats. 58 In our experiments with microglial cells, CeO2NPs induced an increase in TNFα, but not IL-1β, IL-6, and IFNγ secretion (Figure 6 and Table 5). Whether lack of IL-1β, IL-6, and IFNγ production upon treatment with CeO2NPs is due to the specific traits of BV-2 cells or to differences in the in vivo versus in vitro treatments requires further investigation.
In conclusion, for the first time, we demonstrated that NPs can impair the uptake of Aβ by microglial cells; in our study, this phenomenon was observed for AgNPs and CeO2NPs. Also, AgNPs and CdTeQDs, even at relatively nontoxic concentrations, exhibited the ability to retard BV-2 cells growth. Thus, the basic functions of microglial cells are impaired. In in vivo condition, this can have a marked influence on Aβ oligomer clearance.
CeO2NPs appeared the least toxic to microglia. There are high hopes for these nanoparticles as a tool to protect against neurodegeneration. However, here, we showed that CeO2NPs inhibited the cell cycle progression by microglial cells and induced TNF α secretion—a potent cytokine that can result in brain inflammation and neuronal damage. 33 Thus, despite the potential benefits of CeO2NPs that predispose them for biomedical applications, one should keep in mind that NPs can be potentially harmful and detailed research should be performed to reliably estimate the risk of their use.
Supplemental material
Supplemental Material, Supplementary_Materials_HET - Diminished amyloid-β uptake by mouse microglia upon treatment with quantum dots, silver or cerium oxide nanoparticles: Nanoparticles and amyloid-β uptake by microglia
Supplemental Material, Supplementary_Materials_HET for Diminished amyloid-β uptake by mouse microglia upon treatment with quantum dots, silver or cerium oxide nanoparticles: Nanoparticles and amyloid-β uptake by microglia by K Sikorska, I Grądzka, B Sochanowicz, A Presz, S Męczyńska-Wielgosz, K Brzóska and MK Kruszewski in Human & Experimental Toxicology
Footnotes
Declaration of conflicting interests
The author(s) declared no potential conflicts of interest with respect to the research, authorship, and/or publication of this article.
Funding
The author(s) disclosed receipt of the following financial support for the research, authorship, and/or publication of this article: This work was supported by the National Science Centre (UMO-2013/11/N/NZ7/00415) (KS); the Ministry of Science and Higher Education (4316/E-76/M/2016) (KS); and from the Statutory grants for Institute of Nuclear Chemistry and Technology (IG, BS, SMW, KB, and MK), Institute of Rural Health (MK).
Supplemental material
Supplemental material for this article is available online.
References
Supplementary Material
Please find the following supplemental material available below.
For Open Access articles published under a Creative Commons License, all supplemental material carries the same license as the article it is associated with.
For non-Open Access articles published, all supplemental material carries a non-exclusive license, and permission requests for re-use of supplemental material or any part of supplemental material shall be sent directly to the copyright owner as specified in the copyright notice associated with the article.