
Abstract
There is a global concern about adverse health effects of endocrine-disrupting chemicals (EDCs). Bisphenol A (BPA), an estrogenic and obesogenic compound, used in the plastic and medical industry has a dominant position among EDCs as far as human health and regulatory scenario are concerned. Due to its omnipresence across the biosphere, population of all age groups and health status is unavoidably exposed to BPA. Transgenerational exposure to BPA and its effects have also been recognized. However, there is no report on the transgenerational effect of BPA on metabolically disordered parents, such as obese ones. We studied effect of BPA exposure in F0 generation and its impact on F1 generation and factored parental obesity in transgenerational effect of concurrent exposure to low dose BPA (10 ppm × 180 days) in Wistar rats in a one-generation study protocol. The exposed F0 generation animals were crossed and F1 generation was analyzed 35 days after birth for indications of reproductive toxicity. We observed changes in hormone levels and disturbance in glucose and lipid homeostasis. Animals showed increased serum cholesterol and triglycerides along with higher birth weight and rapid weight gain. Histopathological evidence confirmed the presence of regressive and inflammatory changes in the ovary and testis. The test group showed metabolic disturbances in comparison to control group. Our study showed the additive effect of parental obesity in transgenerational reproductive toxicity of BPA. Female animals of F1 generation of BPA-treated obese parents showed more insulin resistance than males with similar exposure scenario. Our study highlights the confounding role of metabolic disorders such as obesity in the transgenerational toxicity of BPA, which otherwise itself is implicated in the aetiology of such metabolic disorders, directly or indirectly.
Introduction
Bisphenol A (BPA), a common plasticizer, is widely used to manufacture plastics, food containers, thermal paper, epoxy resins, and dental sealants. 1,2 It has been classified as a member of endocrine-disrupting chemicals (EDCs) and as an obesogen. 3,4 With the increase of plastic production in postindustrial era, huge amount of BPA pollutant has been detected in the water, air, and food consumed by the general population. 1,5,6 Its exposure in wildlife and toxic consequences have been documented. 7,8 Although BPA is poorly bioaccumulated, it has been detected in aquatic wildlife species, especially fish. 9 Prenatal and early life exposure to BPA has been reported to induce adverse effects on sperm count, sperm motility, and other reproductive functions. 10 Oral exposure to BPA is considered to be the primary entry route in humans, though other routes such as dermal contact are also described. 6,11 Epidemiological studies have shown 95% of human urine samples have measurable levels of BPA. 12 –14 Furthermore, BPA has been found in placental tissue, amniotic fluid, umbilical cord blood, breast milk, and ovarian follicular fluid. 15,16 The study by Takahashi and Oishi 17 revealed a higher bioaccumulation of BPA in fetal tissue compared with maternal tissues. Such exposure to BPA has been implicated in anxiety and depression-like behavior in the next generation. 18 The accumulation of BPA has been identified as a major cause of transgenerational impact on the F1 generation. 17,19
Mounting evidence indicates that BPA is a health hazard and accordingly its use has been regulated, particularly in plastic bottles and baby feeding devices. 20,21 A dose of 50 μg/kg/day has been considered to be safe according to the current USEPA reference (http://www.epa.gov/iris/subst/0356.htm).
Significant effects of transgenerational EDCs have been documented on body weight, serum hormones, and across various organ systems. 22,23 Chemicals such as 2,3,7,8-tetrachlorodibenzo-p-dioxin (TCDD) and diethylstilbestrol (DES) have deleterious effects on hormonal and reproductive functions of animals across generations. 23,24 Moreover, paternal obesity has been found to be associated with transgenerational increase in body mass, body fat, and disconcerted metabolic measures in prepubertal children. 25 Studies have also shown that parental obesity negatively affects the preimplantation embryo development, and leads to increased risk of miscarriage, decrease in live birth rates, and disturbed reproductive processes of the offspring. 26,27 The interplay of BPA as a known obesogenic EDC and obesity is interesting to contemplate. Moreover, BPA has been reported to interact with and induce peroxisome proliferator-activated receptor-γ (PPAR-γ), which is implicated in promoting obesity. 28 –30 In the present one generation study, we report on the transgenerational effect of chronic BPA exposure with obese parentage on F1 generation with particular focus on reprotoxicity and lipid and glucose homeostasis.
Materials and methods
Chemicals and reagents
BPA, epinephrine, hematoxylin, 3,3,5,5′-tetramethylbenzene (TMB), nicotinamide adenine dinucleotide phosphate – reduced (NADPH), and thiobarbituric acid (TBA) were purchased from Sigma-Aldrich (St. Louis, Missouri, USA). Butylated hydroxytoluene (BHT) and eosin were procured from Sisco Research Laboratories Pvt. Ltd. (Mumbai, India). Orthophosphoric acid (OPA) was purchased from SD Fine Chemicals Ltd. (Ambala, India). All other chemicals and reagents were of the high purity grade obtained locally from the accredited vendors.
Animals
Wistar rats of either gender (weighing 40–60 g; age 3–4 weeks) obtained from the Central Animal House Facility of the University were kept under a controlled temperature of 24°C ± 2°C with a 12-h light and12-h dark cycle and free access to food and water. Humidity was maintained at 50% ± 3% at all times during the study. All the experimental procedures were approved by the Institutional Animal Ethics Committee (project # 1330).
Experimental design
Animals were randomly divided into four groups. Animals of each group composed of males (n = 6) and females (n = 6) were housed in separate cages making n = 12 in each group. The control group (I) was given standard diet and free access to water. High-fat diet group (II) was given high-fat diet (40–45% fat added to standard diet) to induce obesity. Obesity was ascertained by calculating body mass index, as described by Novelli et al. 31 BPA group (III) was given BPA in drinking water at 10 ppm. Animals of group IV were given high-fat diet to induce obesity and later 10 ppm BPA in drinking water for 180 days. The high-fat diet was given to respective groups II and IV till the induction of obesity which took 4–5 weeks. Thereafter, BPA exposure in drinking water was started for groups III and IV for 180 days. This was done to maintain the uniformity among the animals in terms of age. After 180 days, male and female animals of each group were kept together for mating. One male was assigned to one female randomly from within the group. Hence, each group composed of six pairs of animals. Dosing schedule is illustrated in Figure 1. Post visualization of a vaginal plug females were housed separately for parturition. After birth, six pups from each group were chosen randomly and sacrificed on the 35th postnatal day (PND).
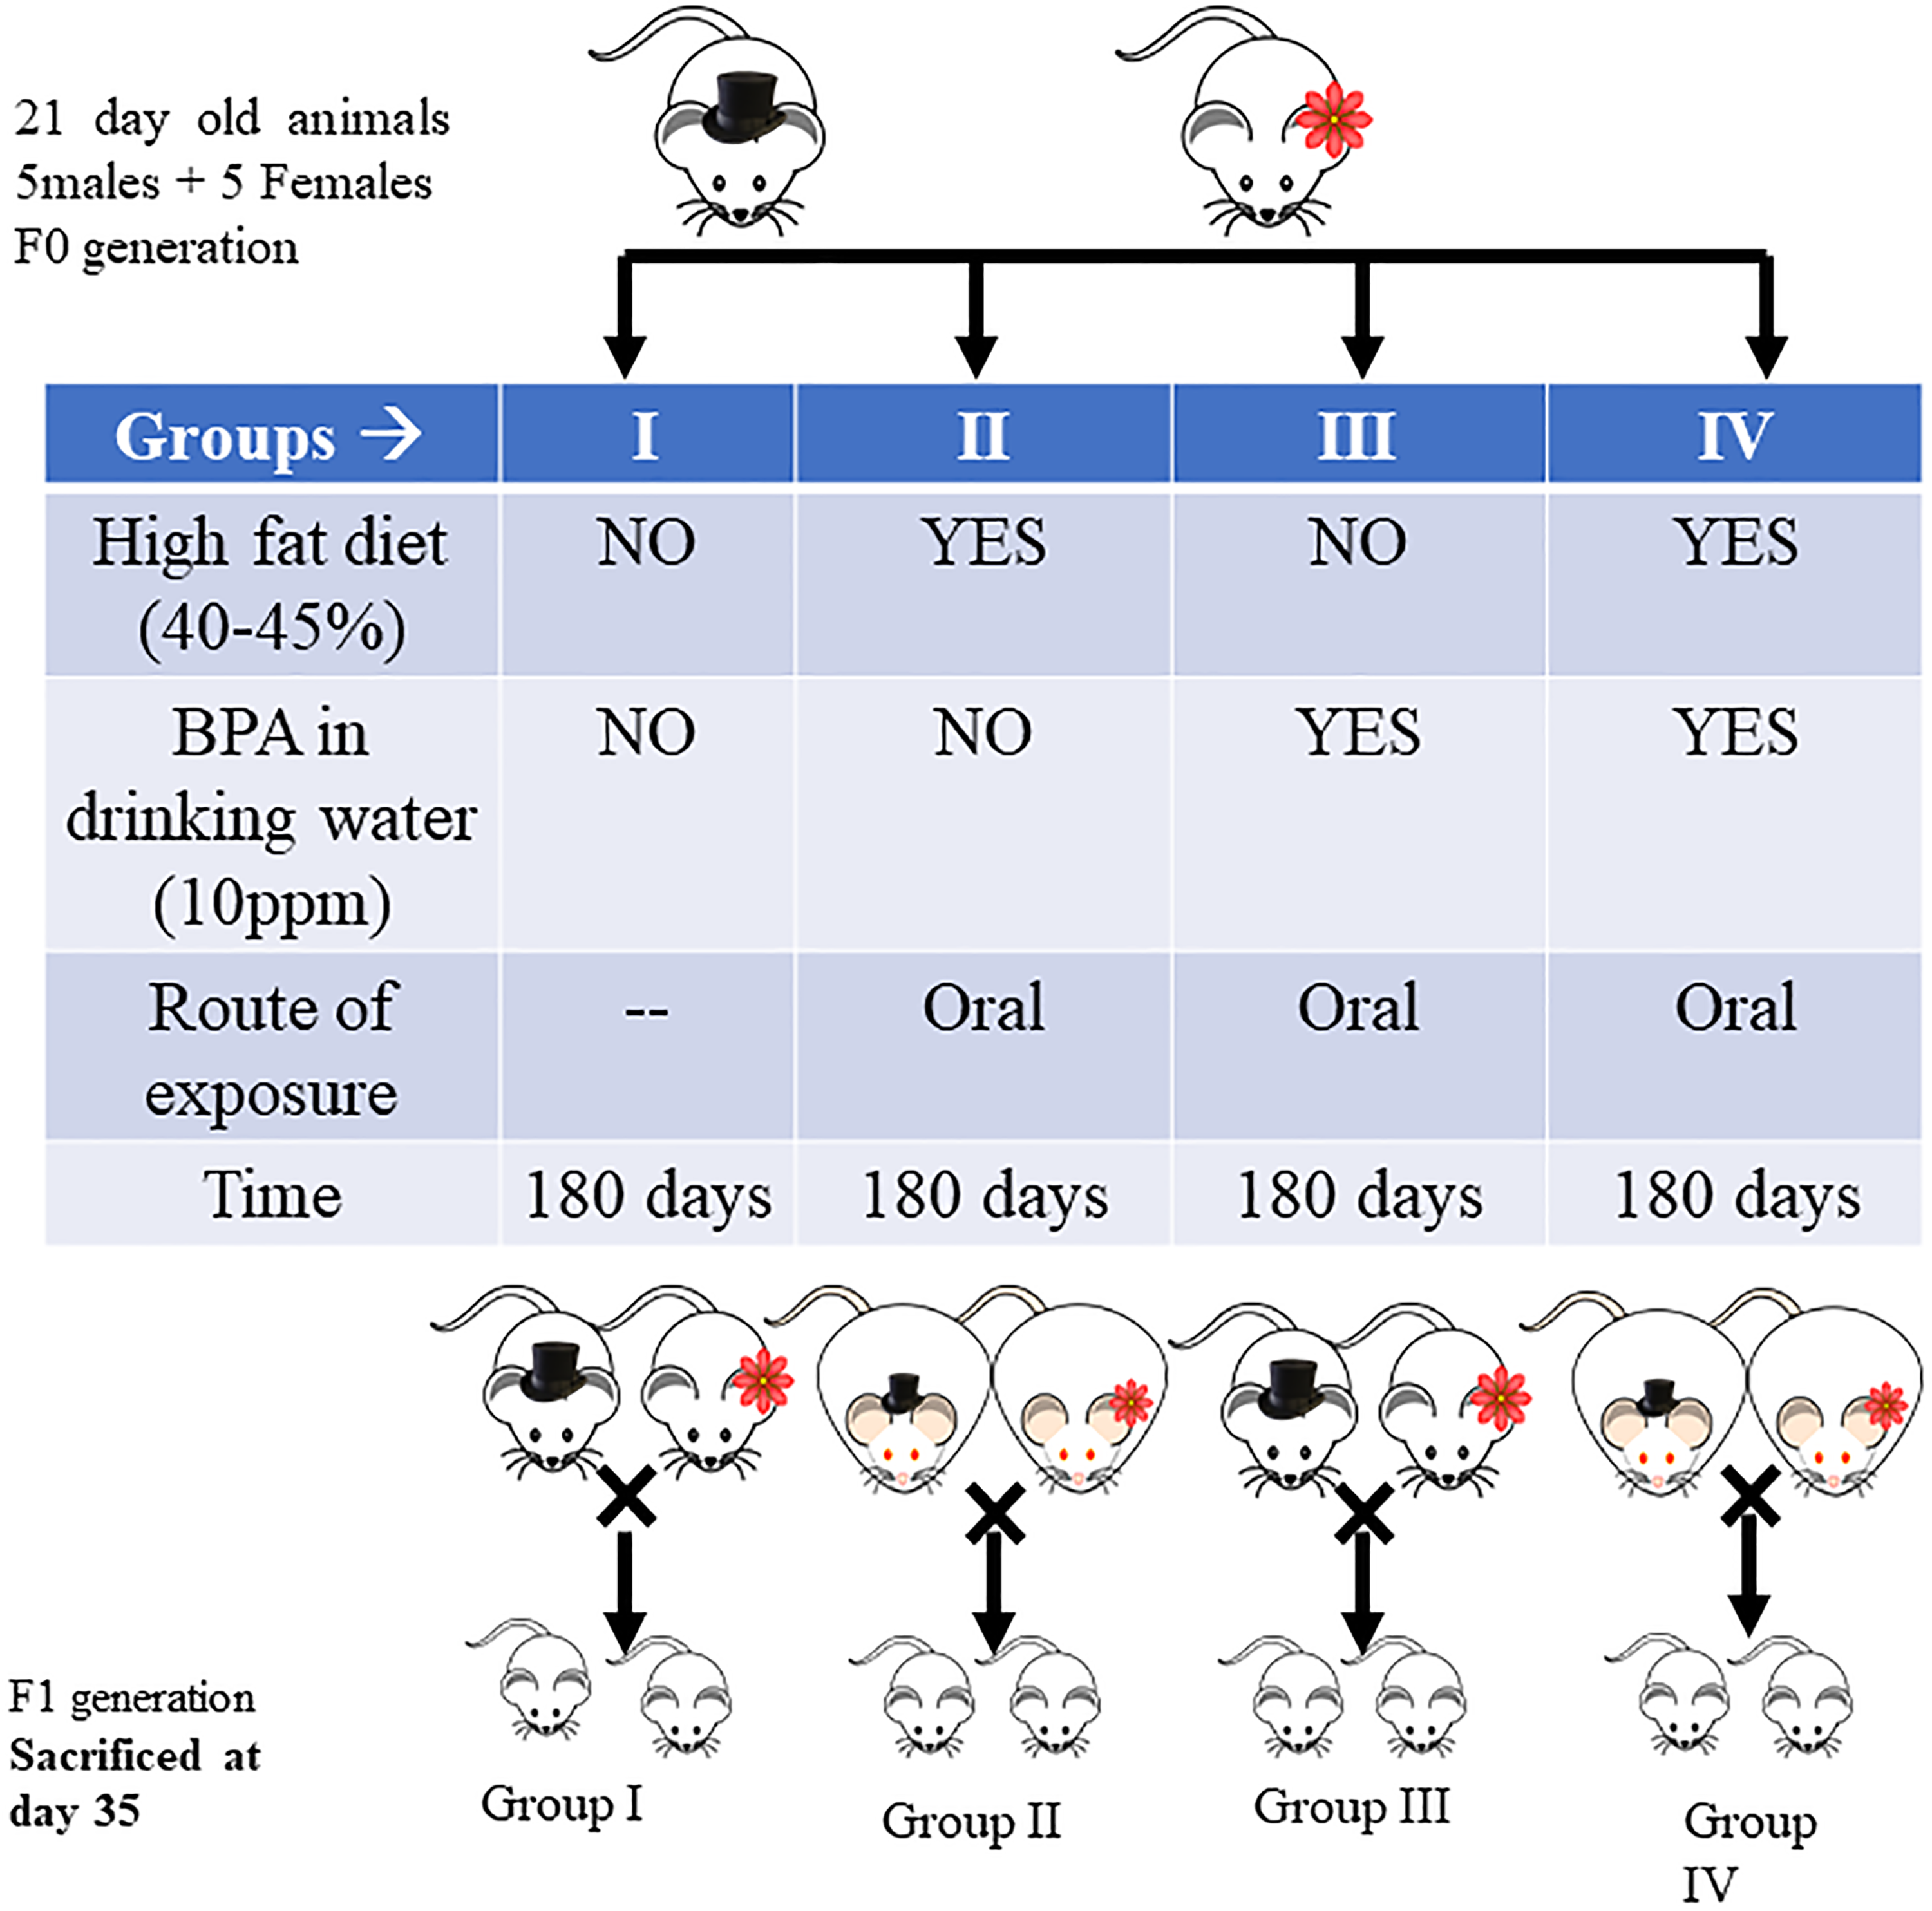
Graphical representation of experimental design.
BPA dosage was prepared daily by suspending 10 mg of BPA in 1 l of drinking water in a glass container on a magnetic stirrer until completely dissolved. The drinking water was refilled after every 24 h and was freely available to the animals.
Birth weight and total weight gain
Pups from all four groups were kept separately and marked duly. The body weight (in grams) of F1 animals was measured at PND1, PND7, PND14, PND21, PND28, and PND35. Testis and ovary weights were also recorded.
Necropsy
Necropsy of F1 generation animals was carried out on the 35th day of birth. Animals were fasted overnight and sacrificed by cervical dislocation under mild anesthesia.
Tissue and blood sample collection
Blood was collected by heart puncture technique. It was allowed to clot by leaving it undisturbed at room temperature for 45 min. The clot was removed and serum was prepared by centrifugation at 1500 × g for 10 min. Serum was stored at 4°C for further use. Testes and ovaries were excised, washed, and placed in the ice-cold saline solution. A small portion of excised tissue was fixed in 10% formalin solution for histopathological studies and rest of the tissue sample was flash frozen in liquid nitrogen for biochemical analyses. Sperm sample was collected from the epididymis. Cauda epididymis was excised and minced in 1 ml phosphate-buffered saline. After 3–5 min of incubation, solution was used for sperm count and assessment of sperm morphology.
Blood and serum analysis
Blood glucose was analyzed directly from blood collected in concerned vials. Analysis of each sample was done in duplicates for all animals of each group. Blood parameters were determined after 12 h overnight fasting using the handheld commercial glucose meter (ACCUCHEK Active; Roche, Mannheim, Germany). A single drop of freshly drawn blood was added to the test strip and was completely absorbed. The strip was analyzed by inserting it into the glucometer and readings were duly noted. Serum insulin concentrations were calculated based on the principle given by Hales and Randle (1963) with some modifications. 32 A 25 μl of the sample was added to 100 μl of enzyme conjugate in each well of microtiter plate. The solution was incubated at room temperature for 60 min on a horizontal shaker. The samples were discarded and wells were washed five times and blot was dried after last wash. TMB solution (200 μl) was added to each well, covered properly, and incubated at room temperature for 15 min. Later, 50 μl of stop solution was added to each well and the plate was read at 450 nm immediately.
Lipid profile parameters, such as triglycerides (TG), total cholesterol, high-density lipoprotein (HDL), and low-density lipoprotein (LDL), were analyzed using Roche Cobas 4000 Autoanalyzer (Roche Diagnostics Corp., Indianapolis, Indiana, USA). 33 The erythrocytes in blood sample were separated from the plasma by centrifugation and plasma sample was diluted with phosphate buffer provided in the kit. The HDL test uses a precipitation method with Mg2+ and phosphotungstic acid as a precipitant. Cholesterol esters in the sample were hydrolyzed to cholesterol and fatty acids. Cholesterol and NAD+ generate cholestenone and NADH in the presence of cholesterol dehydrogenase. WST8 was reduced to formazan dye by diaphorase and NADH through oxidation–reduction reaction. The color intensity of formazan was measured at a specific wavelength of 460 nm to calculate cholesterol, HDL, and LDL.
TGs in the sample were hydrolyzed to glycerol and fatty acids by lipoprotein lipase. Glycerol and NAD+ generate dihydroxyacetone and NADH in the presence of glycerol dehydrogenase. WST8 is reduced to formazan dye by diaphorase and NADH through oxidation–reduction reaction. The color intensity of the formazan is proportional to TG concentration and was calculated by measuring it at the wavelength of 460 nm. 33
Serum testosterone was analyzed by using Roche diagnostics Elecsys testosterone kit. Twenty microliters of the sample was incubated with a biotinylated monoclonal testosterone-specific antibody to occupy its binding sites. After addition of streptavidin-coated microparticles and a testosterone derivative labeled with a ruthenium complex, the complex was bound to the solid phase via interaction of biotin and streptavidin and incubated for 5 min in dark. Unbound substances were removed by washing. Relative light units were read in each well with a chemiluminescence microplate reader for 0.5–1.0 s.
Estrogen in female F1 offspring was analyzed by using Roche diagnostics Elecsys estradiol (E2) kit. Twenty-five microliters of the sample was dispensed in wells of microtiter plates. One hundred microliter of estradiol-horseradish peroxidase (HRP) conjugate reagent was added to each sample followed by 50 μl of rabbit anti-estradiol reagent. The solution was mixed thoroughly for 30 s and then rinsed five times with deionised water. One hundred microliter of TMB reagent was added to each well, mixed properly, and incubated for 20 min at room temperature. The reaction was stopped by adding 100 μl of stop solution (0.5 M H2SO4) provided in the kit. Absorbance was read at 450 nm and estrogen concentration was calculated as per the instructions provided in kit.
For follicle-stimulating hormone (FSH) and luteinizing hormone (LH) measurement, 50 μl of the sample was dispensed in each well for each hormone. One hundred microliter of FSH-enzyme and LH-enzyme reagent were added and the plate was swirled for 20–30 s and incubated for 60 min at room temperature. The contents were discarded and secondary antibody was added. The reaction was stopped by adding 100 μl of stop solution (0.5 M H2SO4) provided in the kit. Absorbance was read at 450 nm and FSH and LH concentrations were calculated separately. All samples were analyzed in triplicates.
Sperm analysis
Freshly excised epididymis was minced in phosphate buffer (0.1 M, pH 7.4). A 10 μl aliquot of the above solution was diluted with 990 μl of phosphate buffer containing 0.1 μl M imidazole. After incubation for 2–3 min, 10 μl of this solution was placed on the central square and allowed to settle. A clean coverslip was placed on the top. Percentage of morphologically abnormal spermatozoa was determined by staining the slides with eosin (1.6% eosin and 0.1 mol/l sodium citrate). Slides were viewed using a light microscope at × 100 magnification. The sperm counting was performed according to Koksal et al. 34 using Neubauer hemocytometer (Fein-Optik, Blakenburg, Germany).
Oxidative stress measurement in testis and ovary
Flash frozen testis and ovary samples were homogenized in chilled phosphate buffer (0.1 M, pH 7.4) using Potter-Elvehjem homogenizer (REMI, Mumbai, India) at 1000 × g for 10 min (4°C) to obtain 10% homogenate (wt%/v). After aliquoting the sample for analysis of lipid peroxidation (LPO), the remaining homogenate was centrifuged at 10,000 × g for 25 min at 4°C to obtain postmitochondrial supernatant (PMS) for biochemical assays.
LPO assay
LPO was measured as TBA reactive substances (TBARS) using the method described by Mihara and Uchiyama 35 with modifications. 36 Briefly, tissue homogenates were mixed with 10 mmol BHT, 0.67% TBA, and 1% chilled OPA separately. The mixture was incubated at 90°C for 45 min. After cooling, the precipitate was removed by centrifugation at 1000 × g for 10 min at room temperature. The absorbance of the supernatant was recorded at 532 nm spectrophotometrically against a blank containing reagent but no sample. The level of LPO was determined using an extinction coefficient of 1.56 × 10⁵ M−1 cm−1 and results expressed as mmol of TBARS formed/h/g tissue.
Superoxide dismutase (SOD) activity assay
SOD activity was measured according to the method of Misra and Fridovich. 37 The assay is based on the ability of SOD to inhibit the auto-oxidation of epinephrine at alkaline pH. The PMS (0.2 ml) was treated with 0.8 ml of 50 mmol glycine buffer (0.1 M pH 10.4), and 0.02 ml epinephrine. SOD activity was measured kinetically at 480 nm as the oxidized product of epinephrine, that is, adrenochrome and expressed as nanomoles of (-)epinephrine protected from oxidation/min/mg protein using a molar extinction coefficient of 4020 M−1 cm−1.
Histopathological analysis
The testicular and ovarian tissues fixed in 10% neutral formalin and embedded in paraffin were cut into sections of 5-µm thickness. Sections were deparaffinized using xylene and ethanol. Slides were washed using PBS and permeabilized with 0.1 M citrate + 0.1% Triton X-100 solution and stained with hematoxylin and eosin and observed at ×40 magnification using a light microscope. To avoid any bias, slides were coded and examined by the histopathologist in a blinded manner.
Statistical analysis
Data expressed as means ± standard error were analyzed using one-way analysis of variance (ANOVA) followed by Tukey’s multiple comparison test. P < 0.05 was considered significant. All the statistical analyses were performed using Graph Pad Prism 5 software (Graph Pad Software Inc., San Diego, California, USA).
Results
Effect on body weight of F1 offspring
Weight gain in rats over a period PND1–PND35 is shown in Figure 2. Male offspring of obese parents exposed to 10 ppm BPA (IV) in drinking water showed the highest weight in comparison with the offspring of control (I) group (p < 0.001). However, the birth weight of offspring of only high-fat diet group (II) was significantly higher than those of control group (I) animals (p < 0.01) (Figure 2(a)). No significant change was observed in the testis weight of animals of groups II, III, and IV when compared with sham control animals (Table 1).
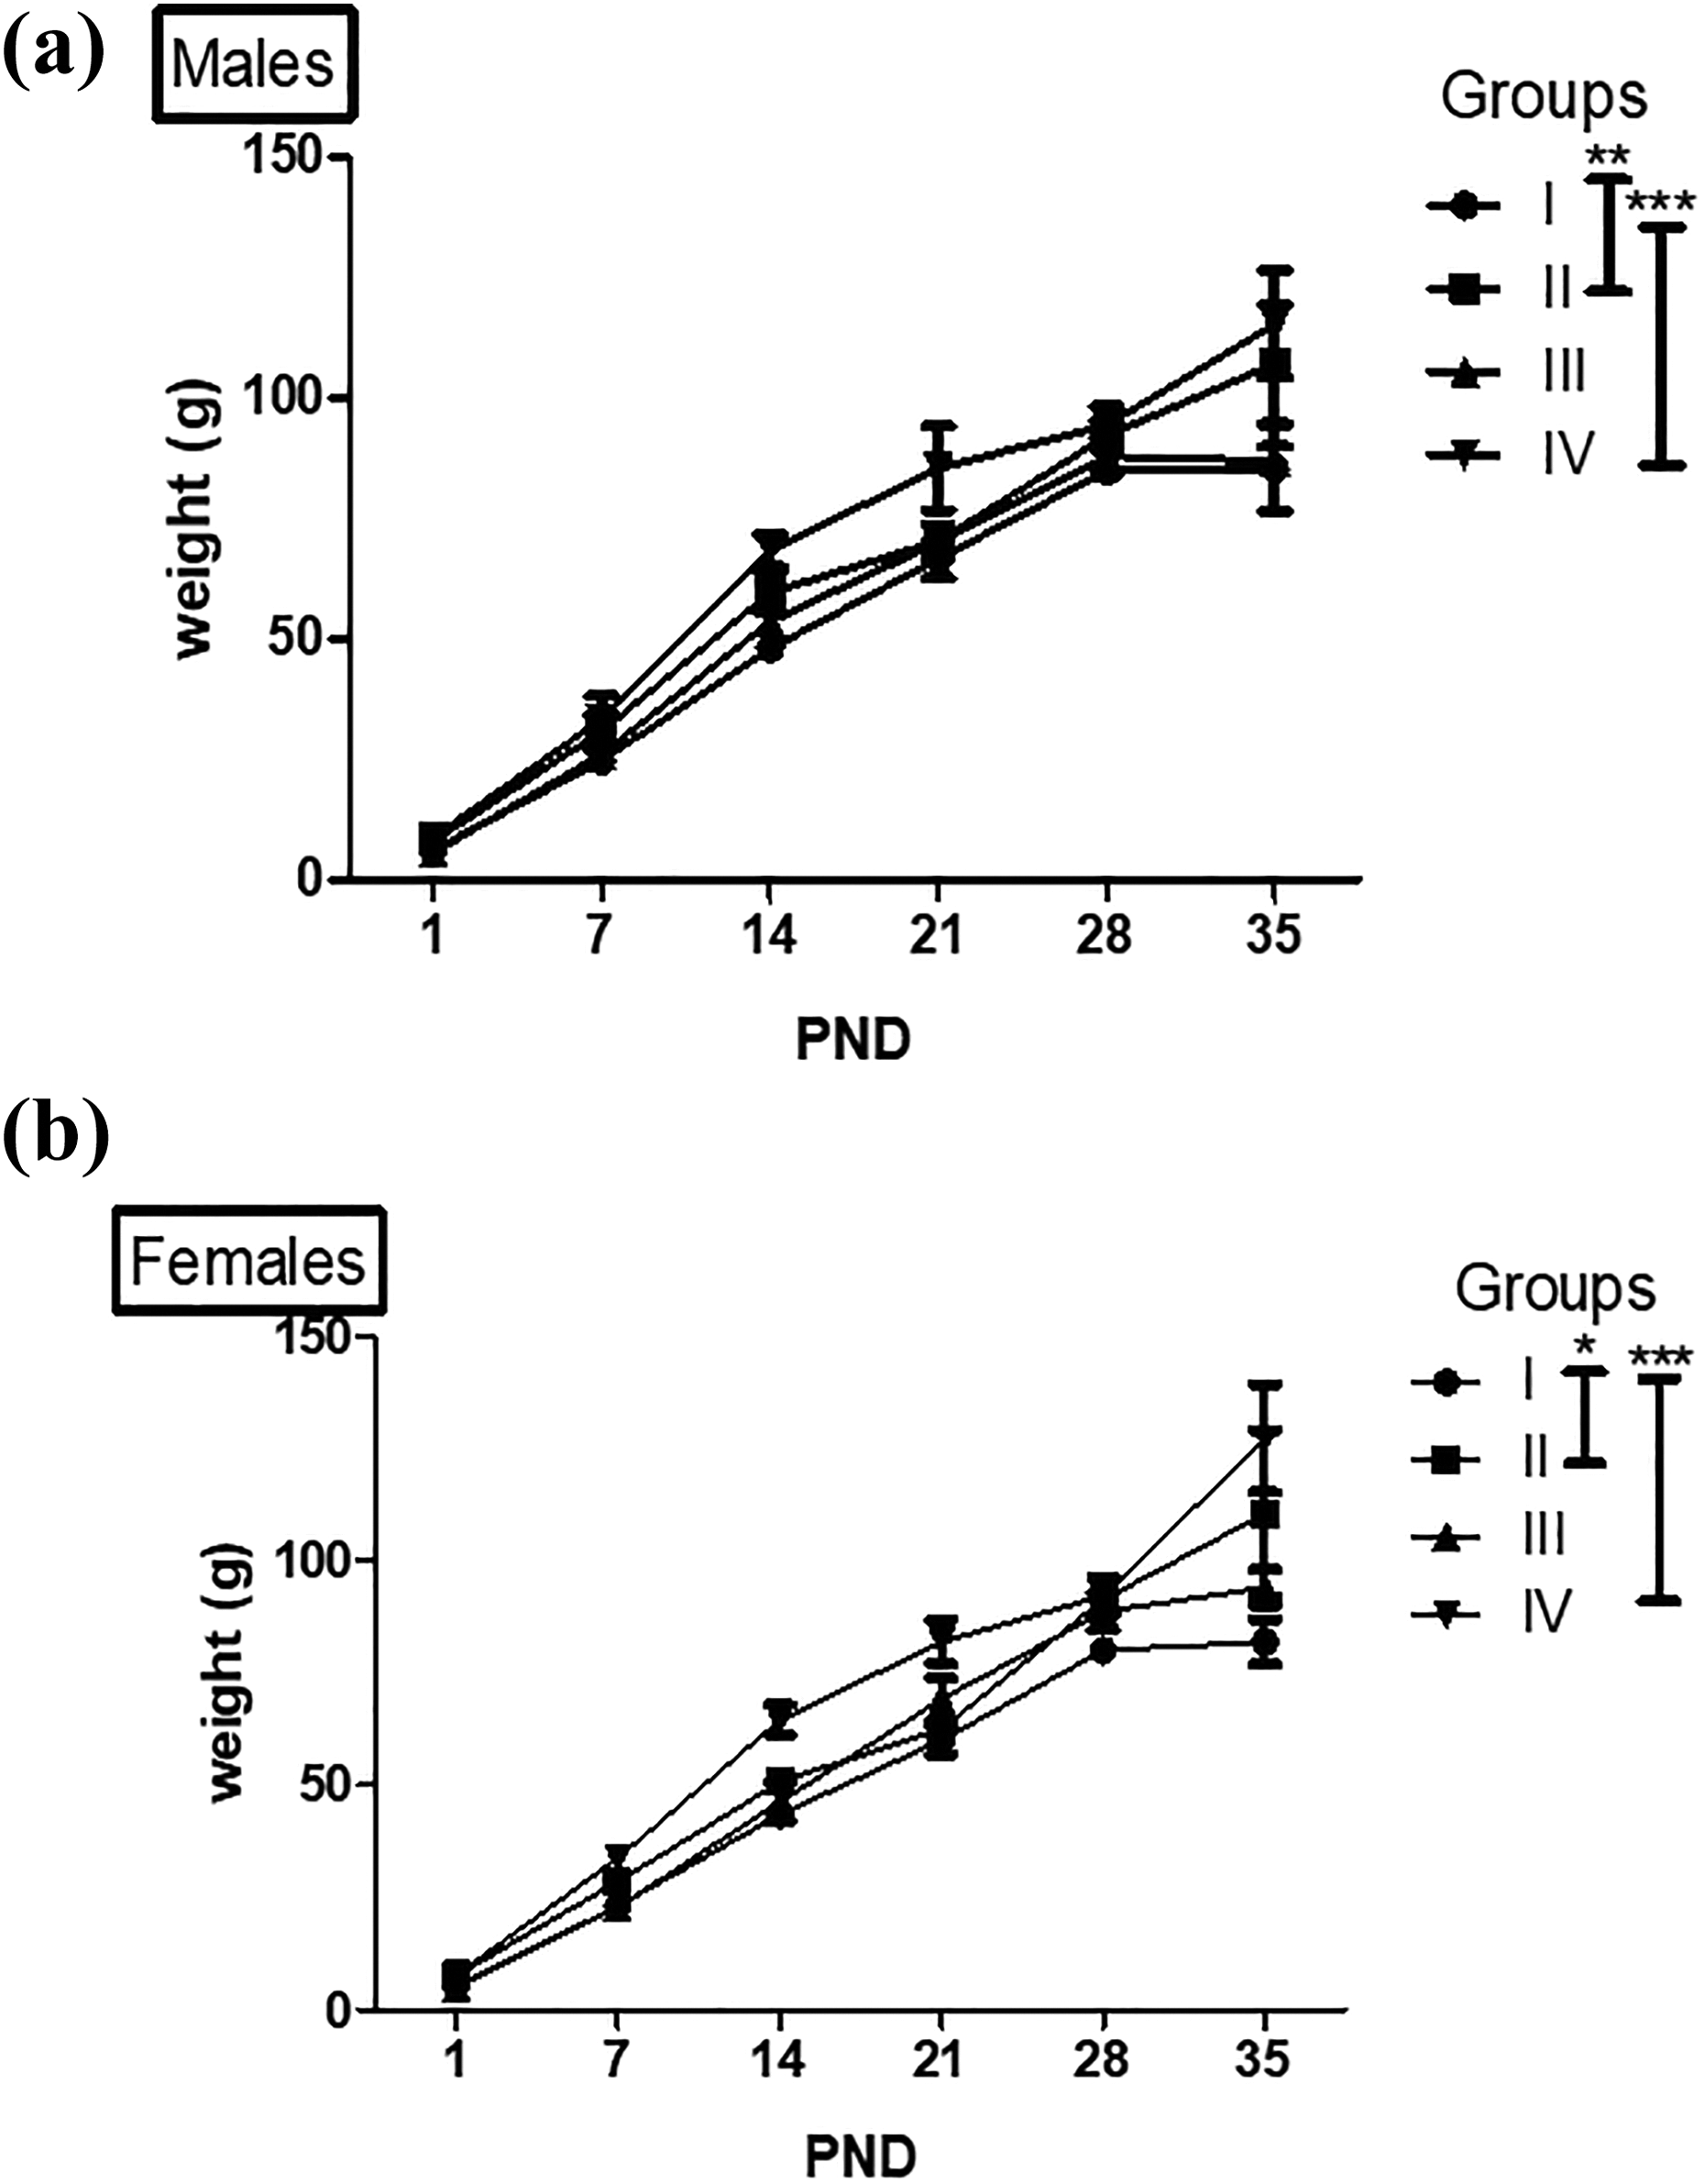
Transgenerational effect of parental obesity and low dose BPA exposure on periodic body weight gain in preadolescent rats of F1 generation at PND1, PND7, PND14, PND21, PND28, and PND35. When weight gain over PND1 to PND35 was compared, F1 generation males (a) with obese (group II) parentage showed maximum weight gain with a significant increase (**p < 0.01) in the overall weight gain (PND1-35). F1 males of BPA-exposed obese parents (group IV) also showed a higher overall weight gain (***p < 0.001) in comparison with the offspring of control group (I). When weight gain over PND1 to PND35 was compared, F1 generation females (b) with obese parentage (group II) showed maximum significant overall weight gain (*p < 0.05) in comparison to control group (I). The highest overall weight gain (***p < 0.001) was exhibited by offspring of BPA-exposed obese parents (group IV). Data are shown as means ± SE (n = 6 of either sex). BPA: bisphenol A; PND: postnatal day; SE: standard error.
Absolute organ weight of testis and ovary in animals of different treatment groups.

BPA: bisphenol A.
Group I, sham control (no high-fat diet and no BPA treatment); group II (high-fat diet and no BPA treatment); group III (no high-fat diet but treated with BPA); and group IV (high-fat diet and BPA treatment). Values are means ± standard error (n = 6).
Female offspring of BPA-treated obese parents also showed a similar pattern of weight gain in comparison to female offspring of control group (I) (p < 0.001) and offspring of group II also showed a significant weight gain (p < 0.05). The average numerical weight gain was more in test group (IV) females than in their male counterparts when compared with the respective control groups (I) (Figure 2(b)). However, no difference was observed in litter size and sex ratio at birth. Also, no pregnancy loss was seen in any of the groups. No significant change was observed in the ovary weight of animals of group II, III, and IV when compared with sham control animals (Table 1).
Effect on sperm count and abnormal sperm ratio of male offspring
No significant changes were observed in the sperm count of male offspring of obese (II) parents and BPA-exposed (III) parents. There was a significant decrease in the sperm count in group IV animals (p < 0.01) only compared to the offspring of control group (I) (Figure 3(a)).

Effect of parental obesity and low dose BPA exposure on sperm parameters in preadolescent F1 generation. (a) Sperm count: offspring of BPA-exposed obese parents (group IV) showed a significant decrease in the sperm count of the epididymal sperm samples (**p < 0.01). (b) Percentage of sperm abnormality: Number of abnormal sperms was significantly high in offspring with parental BPA exposure (group III) (**p < 0.01). A significant abnormal epididymal sperm percentage was exhibited by offspring of BPA-exposed obese parents (group IV) (***p < 0.001) in comparison with the offspring of control (I) group. (c) Sperm morphology: (I) normal epididymal sperm from control group, (II) epididymal sperm of male offspring of obese parents exhibits tail deformity (T), (III) epididymal sperm of male offspring of BPA-exposed parents exhibits abnormality in hook curvature (H) and tail deformities (T), and (IV) epididymal sperm of male offspring of BPA-exposed obese parents with tail deformity (T), abnormal hook curvature (H) as well as shortened neck (N). Data are shown as means ± SE (n = 6 males). BPA: bisphenol A; SE: standard error.
In terms of percent abnormality, group III and group IV showed varying levels of changes. When compared with the samples of control group (I), the offspring of BPA-exposed parentage showed an increased number of abnormal sperms (p < 0.01) (Figure 3(b)). The abnormal sperms of group III majorly exhibited tail abnormalities. However, offspring of BPA-exposed obese parents (IV) showed a higher level of significance (p < 0.001) of abnormal sperms.
The sperm morphology was observed in relation to the changes in the head, the neck, the hook, and the tail of the sperm. The sperm sample obtained from offspring of obese parents (II) had a small population of sperms with tail deformities (T) (Figure 3(c)). Sperm samples obtained from offspring of BPA-exposed parents (III) group showed a significant number with deformity in head and curvature (H) of the hook. Sperms of offspring of group IV exhibited major population of deformed sperms. The tails of sperms were bent (T) with changes in the curvature of head (H) and neck (N).
Effect on glucose homeostasis
Both male and female offspring of BPA-exposed obese parentage (IV) showed a similar pattern of increase in the fasting serum glucose (p < 0.05) concentration in comparison to the offspring of control group (I) (Figure 4(a)). Serum insulin concentration of males in the same group (IV) showed a significant increase (p < 0.01) (Figure 4(b)). Although the male offspring of obese (II) and BPA (III) exposed parentage group did not show any significant elevation in serum insulin compared to control (I), their female counterparts (IV) exhibited higher levels (p < 0.001) of the insulin, indicating a difference in the glucose metabolism of males and females.
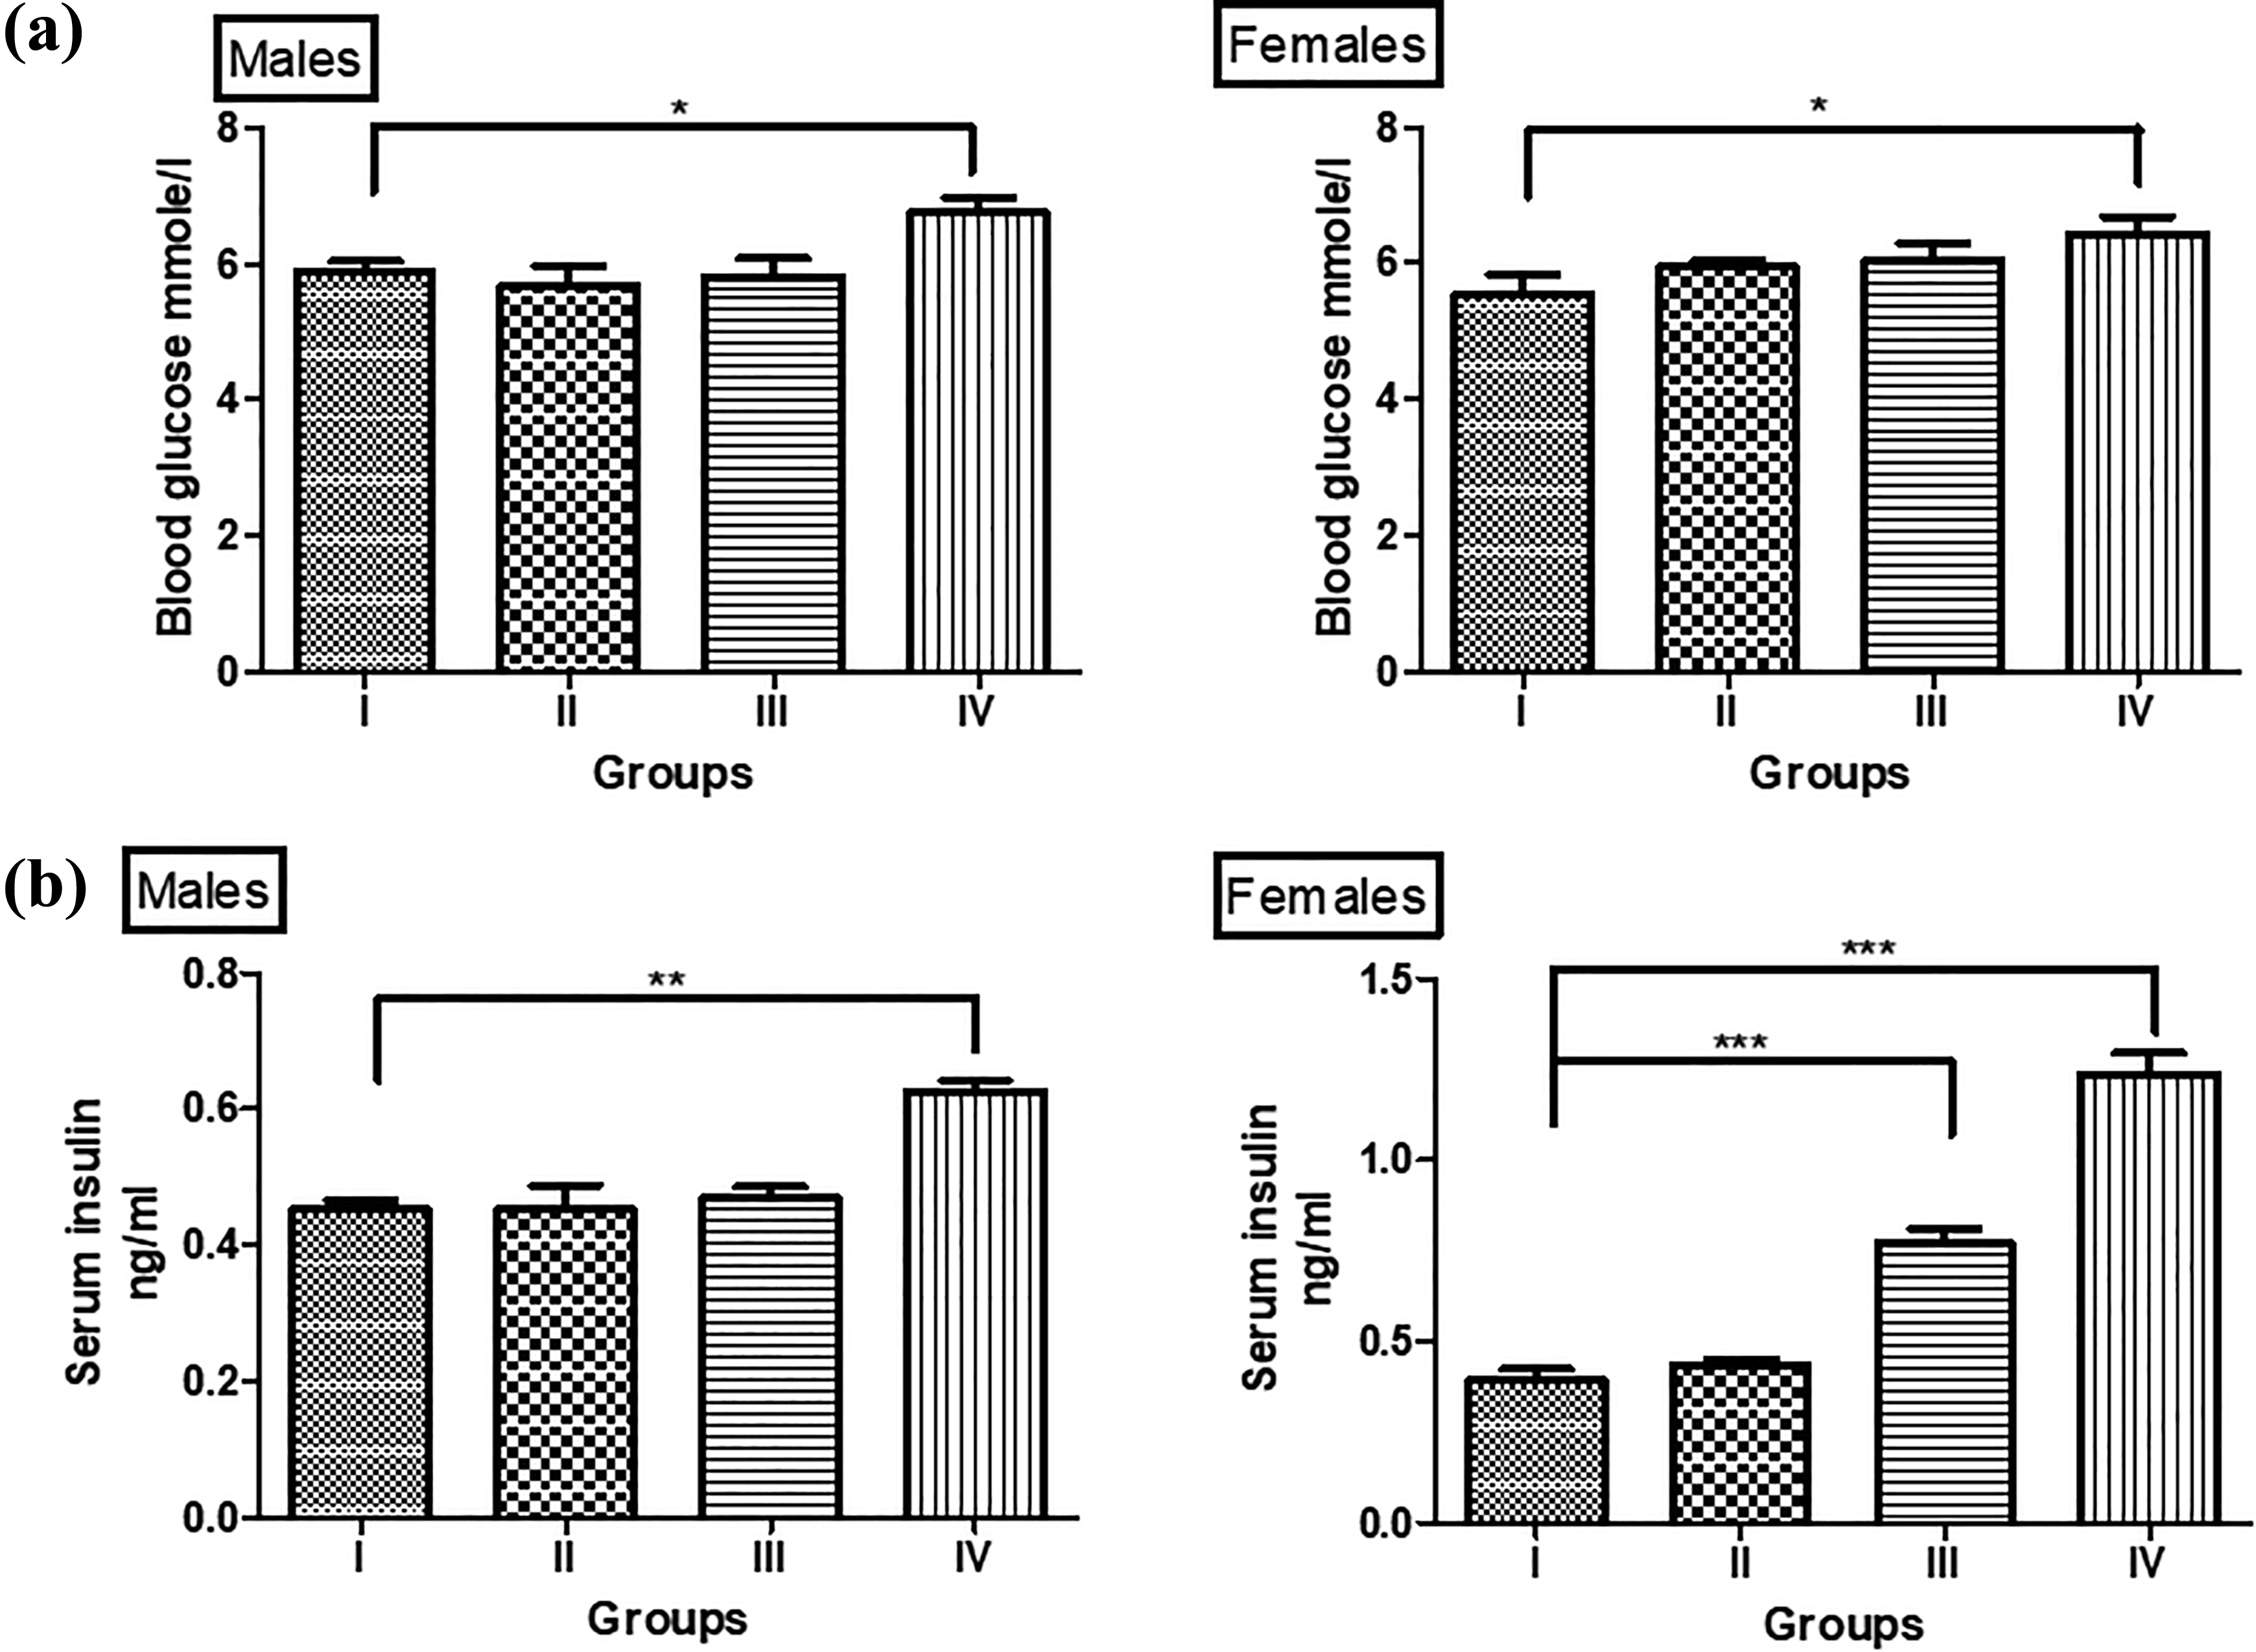
Alterations of glucose homeostasis of preadolescent F1 offspring with BPA-exposed obese parentage. (a) Fasting serum glucose: both male and female offspring of BPA-exposed obese parents (group IV) showed a slight significant increase (*p < 0.05). However, the offspring of obese parents (group II) and BPA-exposed parents (group III) did not show any changes in fasting serum glucose levels. (b) Fasting serum insulin: the male offspring of BPA-exposed obese parents (group IV) showed a significant increase in the fasting serum insulin concentrations (**p < 0.01) in comparison to the control group (I). However, in the female offspring of BPA-exposed parents (group III), a statistically significant increase in fasting serum insulin was observed (***p < 0.001). The female offspring of BPA-exposed obese parents also showed a significantly higher level of fasting serum insulin concentration (***p < 0.001), which was numerically higher than group (group III). Data are shown as means ± SE (n = 6 of either sex). BPA: bisphenol A; SE: standard error.
Effect on lipid homeostasis
Lipid metabolism parameters such as serum cholesterol level in male offspring of the obese parents (II) and male offspring BPA-exposed obese parents (IV) showed significant elevations (p < 0.001) (Figure 5(a)). The male offspring of BPA-exposed parents (III) also showed a slight numerical increase in the serum cholesterol levels but it was not statistically significant in comparison with the control (I) group offspring (Figure 5(a)). A similar pattern of increase was observed in the levels of serum TG of the male offspring of groups II and IV (p < 0.01) (Figure 5(c)).

Changes in lipid homeostasis of preadolescent F1 generation of obese parents with chronic low dose BPA exposure. (a). Serum cholesterol (male): in offspring of obese parents (group II), the cholesterol concentration showed significant elevation (***p < 0.001). However offspring of BPA-exposed obese parents (group IV) showed a numerically higher value of serum cholesterol with highest statistical significance (***p < 0.001) when compared with the control group (I). (b) Serum cholesterol (female): offspring of obese parents (group II) showed elevated levels of serum cholesterol (*p < 0.05), but highest levels were observed in offspring of BPA-exposed obese parents (IV) (**p < 0.01) when compared with the offspring of control group (I). Offspring of BPA-exposed parents (group III) did not show any difference. (c) Serum triglycerides (male): offspring of both obese parents (group II) as well as BPA-exposed obese parents (group IV) showed a similar level of significant change (**p < 0.01) and higher levels of serum TG concentration in comparison with the offspring of control group (I). Offspring of BPA-exposed parents (group III) did not show any difference. (d) Serum triglycerides (female): the highest concentration was exhibited by offspring of BPA-exposed obese parents (group IV) (***p < 0.001) followed by the offspring of obese parents (group II) (*p < 0.05) in comparison with the control group (I). Data are shown as means ± SE (n = 6 of either sex). BPA: bisphenol A; SE: standard error.
Female offspring of obese parents (II) (p < 0.05) and BPA-exposed obese parents (IV) (p < 0.01) also showed an increase in the levels of cholesterol and TG in blood serum samples when compared with the control offspring (I) (Figure 5(b) and (d)).
Serum HDL concentration in male offspring of obese parents (II) (p < 0.05) and BPA-exposed obese parents (IV) (p < 0.01) showed a significant decrease in comparison with the offspring of control group (I) (Figure 6(a)). Fasting serum concentrations of LDL in male offspring of obese parents (II) (p < 0.01) and BPA-exposed obese parents (IV) (p < 0.01) were also significantly higher in comparison to the males offspring of control group (I) (Figure 6(c)).

Transgenerational effect of parental obesity and low dose BPA exposure on HDL and LDL of preadolescent F1 generation. (a) Serum HDL (males): offspring of BPA-exposed obese parents (group IV) showed the lowest serum concentration of HDL, exhibiting the maximum statistical significance (**p < 0.01), followed by the offspring of obese parents (group II) (*p < 0.05). (b) Serum HDL (females): offspring of BPA-exposed obese parents (group IV) showed a significantly lower (**p < 0.01) serum HDL concentration when compared to control group (I), whereas offspring of obese (group II) and BPA-exposed (group III) parents did not show any significant changes. (c). Serum LDL (males): maximum elevation (***p < 0.001) in serum LDL levels was seen in offspring of BPA-exposed obese parents (group IV) followed by the offspring of obese parents (group II) (**p < 0.01), whereas the offspring of BPA-exposed (group III) parents did not show any changes. (d) Serum LDL (females): offspring of BPA-exposed obese parents (group IV) showed a significantly increased (***p < 0.001) serum LDL concentration when compared to control group (I), whereas offspring of obese (II) and BPA-exposed (group III) parents did not show any significant changes. Data are shown as means ± SE (n = 6 of either sex). BPA: bisphenol A; HDL: high-density lipoprotein; LDL: low-density lipoprotein; SE: standard error.
Female offspring of obese parents (II) did not show any statistically significant changes in the serum HDL and LDL levels. It was observed that the LDL (p < 0.001) and HDL (p < 0.01) levels were altered in the female offspring of BPA-exposed obese parents (IV) (Figure 6(b) and (d)).
Effect on sex hormones
We measured FSH, LH, and LH/FSH concentrations in male and female offspring of all the groups. Female offspring of all groups were assessed for estrogen concentration in the blood serum, whereas male offspring were tested for testosterone.
The serum testosterone concentration in male offspring of BPA-exposed obese parents (IV) showed a significant decrease (p < 0.05) in comparison with the offspring of control group (I) (Figure 7(a)). However, male offspring of obese (II) and BPA-exposed (III) parents did not show any statistical variance in serum testosterone concentration.

Effect of low dose BPA exposure and obesity of parents on reproductive hormones of preadolescent offspring. (a) Serum testosterone concentration in male offspring of BPA-exposed obese parents (group IV) was significantly decreased (*p < 0.05). However, the offspring of obese parents (group II) as well as BPA-exposed parents (group III) did not show any significant changes. (b) Serum estrogen level was also significantly decreased in female offspring of BPA-exposed obese parents (group IV) (**p < 0.01) followed by the offspring of BPA-exposed parents (group III) (*p < 0.05). The serum estrogen concentration in the offspring of obese parents (II) was slightly decreased. However, change was not statistically significant when compared with the control group (I). (c) LH/FSH ratio: in males, the LH/FSH ratio did not show any significant variation in the offspring of groups II, III, and IV when compared with those of group I (controls). In females, the LH/FSH ratio was significantly increased (***p < 0.001) in the offspring of BPA-exposed obese parents (group IV) followed by offspring of BPA-exposed parents (group III) (**p < 0.01) when compared with the control group (I). The offspring of obese parents (group II) did not show any significant change in the LH/FSH ratio. Data are expressed as means ± SE. LH: luteinizing hormone; FSH: follicle-stimulating hormone; BPA: bisphenol A; SE: standard error.
Significant reduction was observed in serum estrogen levels in female offspring of BPA-exposed parents (III) (p < 0.05) and BPA-exposed obese parents (IV) (p < 0.01) (Figure 7(b)), although change in serum estrogen concentration in female offspring of obese parents (II) was not statistically significant.
Serum FSH levels were not significantly altered in both males and females but serum LH levels were found to be decreased. Male offspring did not show any statistically significant changes in the LH/FSH ratio (Figure 7(c)). However, a significant increase in the LH/FSH ratio was observed in the female offspring of obese parents (II) (p < 0.01) and BPA-exposed obese parents (IV) (p < 0.001).
Lipid peroxidation
Male offspring of BPA-exposed obese parents (group IV) (p < 0.001) showed a significantly increased levels of LPO in testicular tissues. Offspring of normal diet fed parents exposed to BPA (group III) also showed enhanced LPO but the change was not statistically significant when compared to sham control group animals (I) (Figure 8(a)). In female offspring, LPO in ovaries was found to be increased in all the groups (p < 0.001) when compared with the offspring of control group (I) (Figure 8(b)).
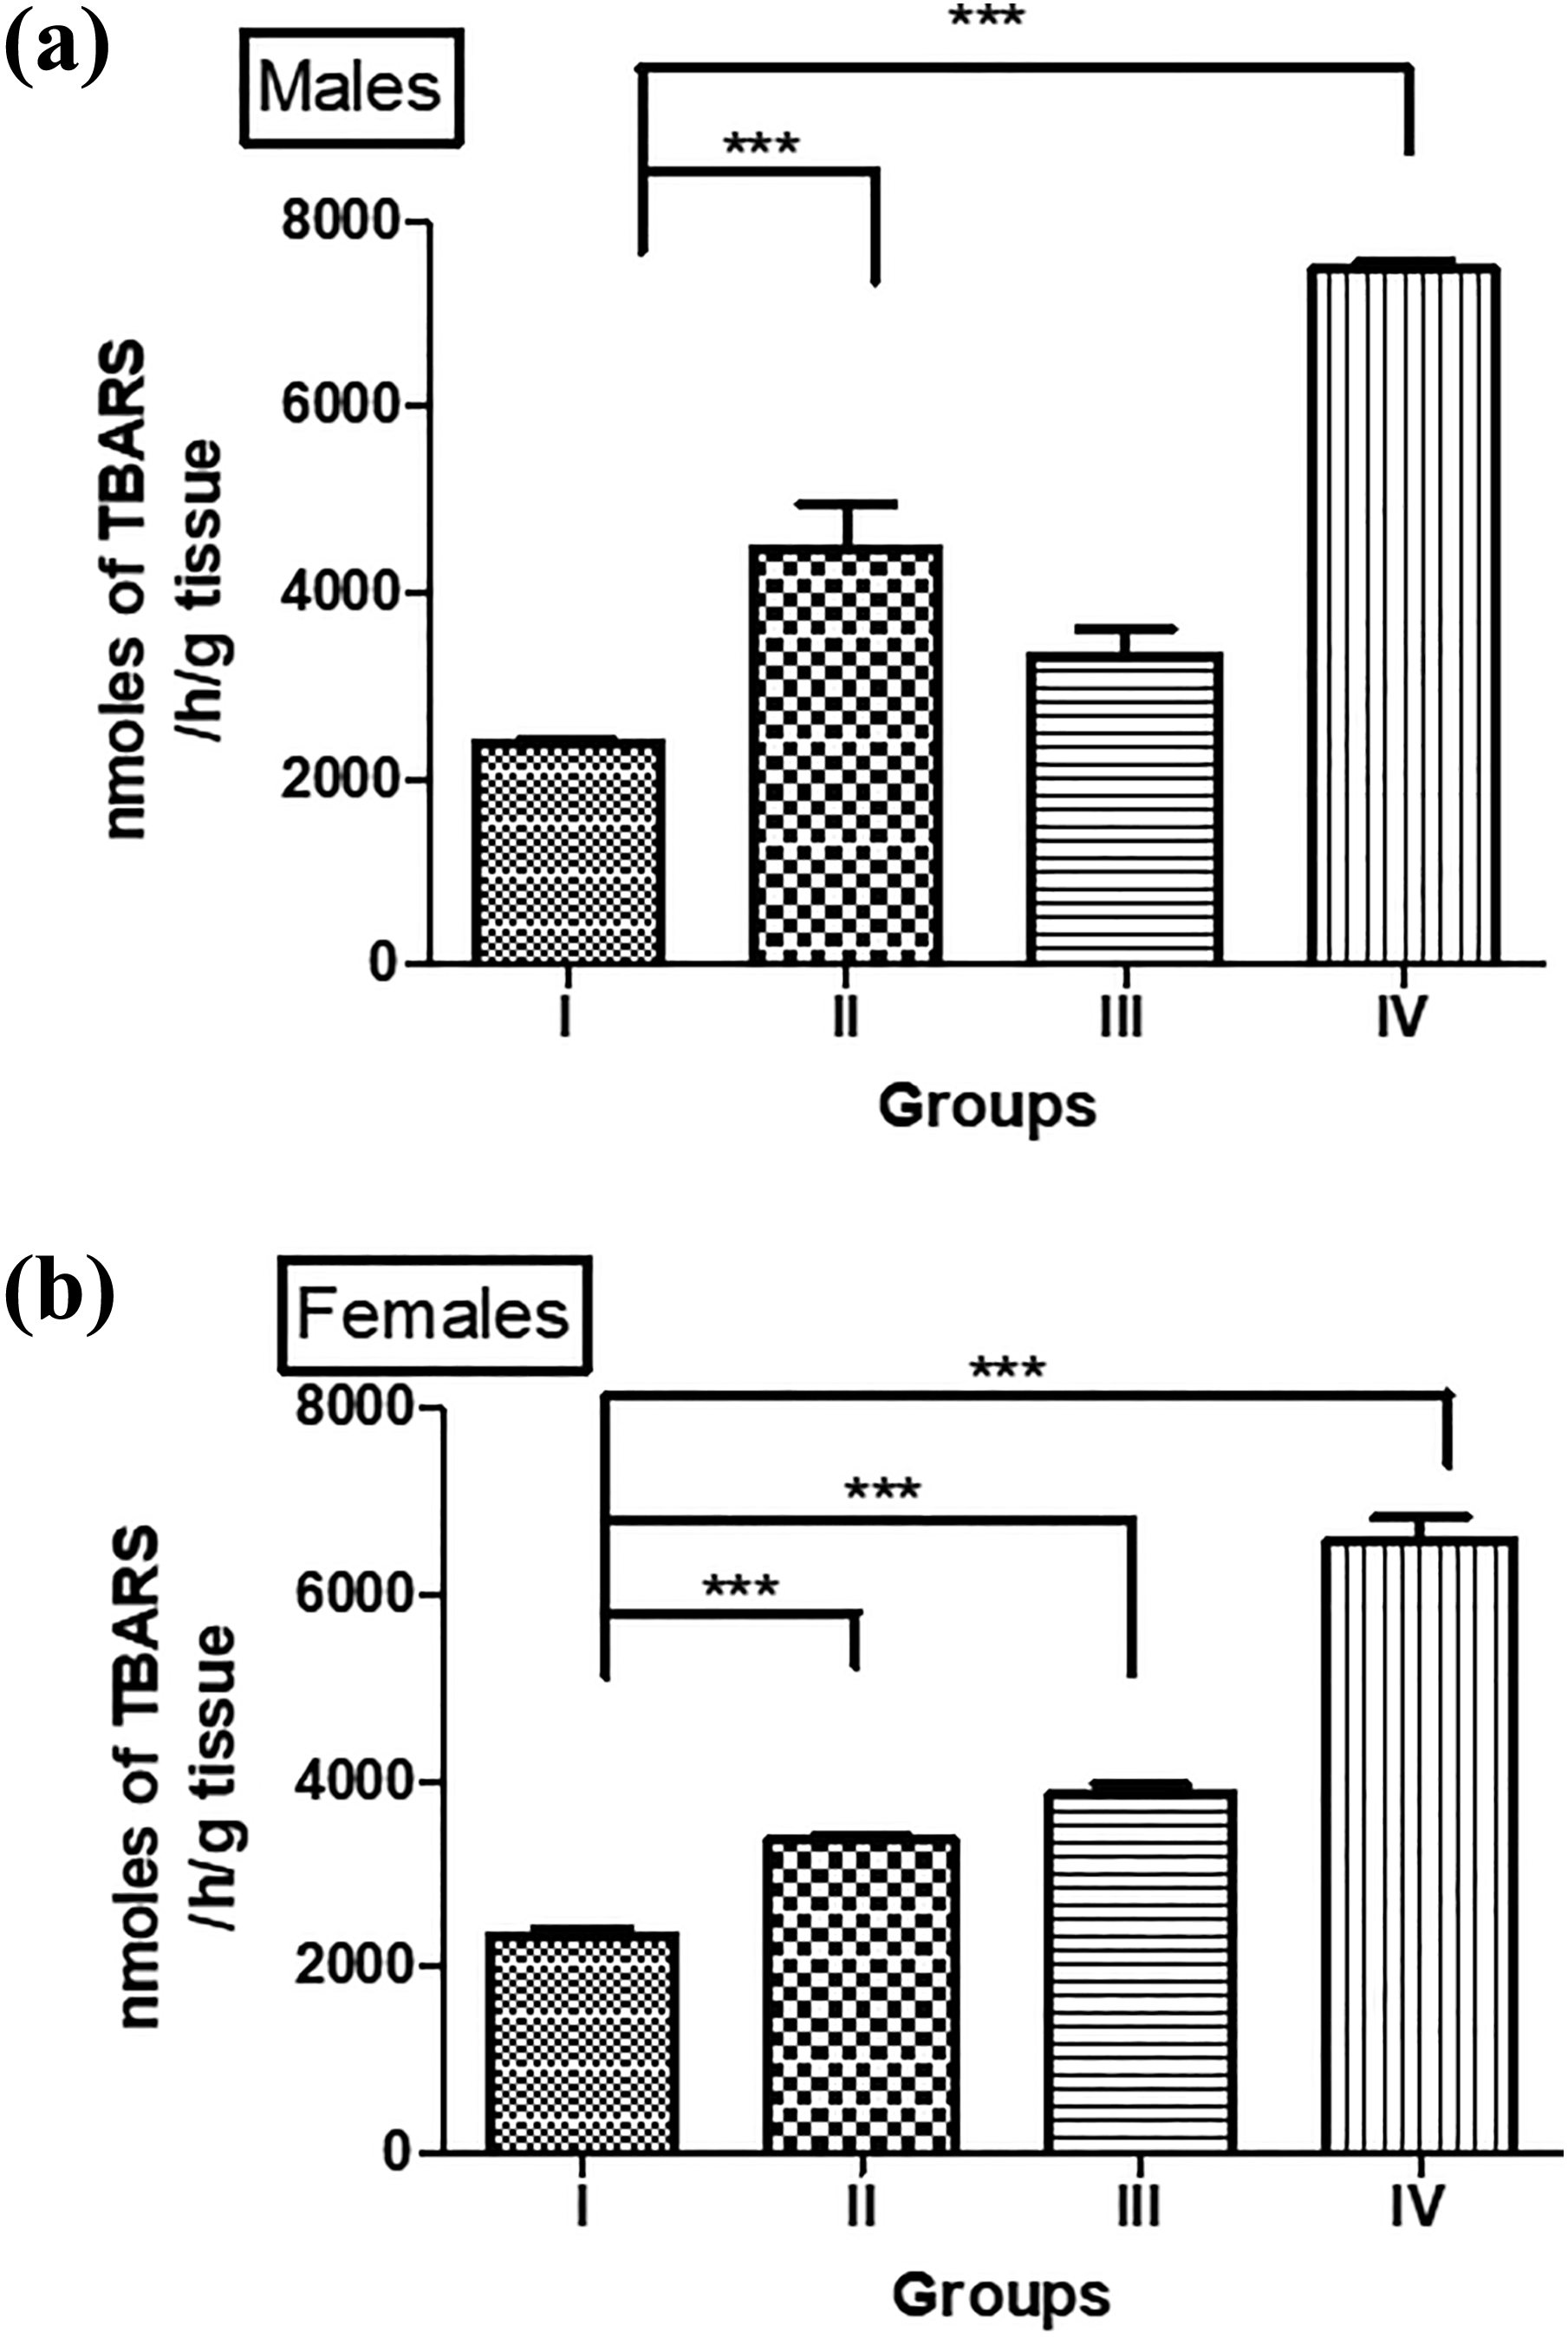
BPA-induced lipid peroxidation in the gonadal tissues of offspring of low dose BPA-exposed obese animals. (a) Males: offspring of BPA-treated obese parents showed maximum level of lipid peroxidation (***p < 0.001) followed by the offspring of obese parents (group II) (***p < 0.001). The offspring of BPA-exposed parents (group III) did not show any significant change versus control group (I). (b) Females: offspring of obese parents (group II), BPA-exposed parents (group III), and BPA-exposed parents showed significant increase LPO level (***p < 0.001) when compared with controls (group I). Data are shown as means ± SE (n = 6 of either sex). BPA: bisphenol A; SE: standard error.
Effect on antioxidant enzyme (SOD) activity
Male offspring of all the groups except control (group I) showed a decreased activity of SOD (Figure 9(a)). Decrease was more pronounced (p < 0.001) in animals of group IV, which were borne from parents maintained on high-fat diet exposed to BPA. Regarding SOD activity in ovarian tissues, it was observed that SOD activity was significantly decreased in offspring of obese parents (II) (p < 0.05) and BPA-exposed obese parents (IV) (p < 0.001) in comparison to control group (I) (Figure 9(a)).

Superoxide dismutase (SOD) activity in gonadal samples of offspring of BPA-exposed obese animals. (a) Males: offspring of obese parents (group II) as well as BPA-exposed parents (group III) showed decrease in the testicular SOD activity (**p < 0.01). The highest level of decrease in SOD activity was observed in the offspring of BPA-exposed obese parentage (***p < 0.001) when compared with the control group (I). (b) Females: a significant decrease in SOD activity in ovarian tissue was observed in offspring of BPA-exposed obese parents (group IV) (***p < 0.001) followed by offspring of obese parents (II) (*p < .05). However, the offspring of BPA-exposed parents (group III) did not show any significant change in SOD activity in ovaries when compared with the control group (I) data. Data are shown as means ± SE (n = 6 of either sex). BPA: bisphenol A; SE: standard error.
Histopathological changes
Various histopathological changes were observed in gonads of offspring of all the groups in comparison to the offspring of control group (I) (Figures 10 and 11). In the ovaries of female offspring of the obese parentage (II), an increase in the number of atretic follicles, a decrease in the primordial follicles, lipid vacuolation, regressing follicles, and stromal cell loss (D) were observed. In ovaries of offspring of BPA-exposed parentage (III), corpus luteum (C) was seen with lipid vacuolation and hemorrhagic changes (B). In ovaries of offspring of BPA-exposed obese parents (IV), highest indications of toxicity were observed. There was an increased loss of cells in the stroma (D) and no corpus luteum was observed. However, increased number of follicles was present and inflammatory cells and blood vessels were also congested. Follicular cysts (A), a diagnostic characteristic of polycystic ovarian syndrome (PCOS), were also seen in increased numbers. Histological samples of female offspring of BPA-exposed obese parents (IV) showed the hallmark of a typical PCOS observations (Figure 10).

Effect of parental obesity and BPA exposure on ovarian histology of F1 generation. (a) (I) Normal ovarian tissue of control animals, (b) (II) ovary section of female offspring of obese parents showing a reduced number of corpus luteum (C) and stromal cell loss (D), (c) (III) ovary section of female offspring of BPA-treated parents exhibiting follicular cyst formation (A), hemorrhage (B) and degenerated corpus luteum (C), and (d) (IV) ovary section of offspring of BPA-exposed obese parents exhibiting follicular cysts (A) and increased cellular atrophy (D), that is, loss of stromal cells. BPA: bisphenol A.

Changes in histology of testicular tissue of preadolescent F1 generation of BPA-exposed obese parents. (a) (I) Normal testicular tissue histology of control group, (b) (II) testicular section of male offspring with obese parents exhibits increased tubular spaces (B) and loss of interstitial cells (A), (c) (III) testicular section of offspring with parental BPA exposure exhibits increased tubular spaces (B) and loss of interstitial cells (A) and (d) (IV) testicular sample of male offspring of BPA-exposed obese parents exhibits (A) loss of interstitial cells, (B) increased tubular spaces, (C) premature exfoliation, and (D) cellular atrophy.
The testes of animals of all the groups were examined for changes in structure, cells, inflammation, atrophy, and exfoliation. Compared to the male offspring of control (I) group, the offspring of obese parents (II) showed increased spaces between the seminiferous tubules (B) and lipid vacuolation (A). The testicular tissue of offspring of BPA-exposed parents (III) showed degenerative changes in the seminiferous tubules (A) and a slight increase in the intertubular spaces (B). The male offspring of BPA-exposed obese parents (IV) showed the most remarkable signs of toxicity with respect to loss of cells (D), increased gap between the tubules (B), cellular atrophy (A), presence of inflammatory cells, degeneration of seminiferous tubules, lipid vacuolation, and premature exfoliation (C) (Figure 11).
Discussion
Our study aimed to reveal the transgenerational effect of chronic parental exposure to BPA with special emphasis on the interplay of parental metabolic disorder of obesity. The primary route of exposure to BPA in humans is oral through food and drinking water. 1,5,6 The dosage used in the study was decided according to previous report of Rashid et al. 36 Besides reprotoxicity, we also studied metabolically relevant parameters that included hormones, lipid, and glucose homeostasis in preadolescent offspring. The toxic actions of BPA have primarily been documented using direct exposure on a healthy population. 1,3,4 When the exposure occurs to a gestating female during the critical period of sex determination, not only the F0 generation female but also the developing fetus and the fetal germ cells are directly exposed. Hence, we designed a study to check the transgenerational effect of chronic low dose parental exposure to BPA on the F1 generation of obese animals. The documented actions of chronic exposure to BPA include pubertal disturbances, ovarian and testicular changes, body weight changes, and altered glucose homeostasis. 3,7,10,38 –40 Recent studies demonstrated the negative effects of parental obesity on the next generation as well as effect of nutrient deficiency on the sperm parameters. 41,42 Glucose metabolism is important in the process of spermatogenesis as well as specific functions, such as motility and fertilization ability in mature sperms. 43 At high dose, BPA is reported to cause reduction in weight of animals. 44 However, low dose BPA exposure produces different results. 45,46 We observed a higher birthweight of offspring of the test group. Birth weight was significantly increased in the F1 generation females and there was a greater tendency to gain weight in the females than the males of the same group. BPA is a suspected obesogen and its direct exposure has been shown to promote obesity. 4,46 Obesity is associated with many clinical conditions including cardiovascular anomalies, type 2 diabetes, and a diminished life expectancy. 47 Experimental studies in rats indicate that obese dams can lead to the appearance of obesity in the next generation. 48 Our study extended this concept to analyze parallel effects of BPA along with parental obesity. In the same way, serum cholesterol, LDL, and TG showed a significant increase in the blood samples. Observations suggest different disease phenotypes (testicular changes, ovary disease, hormonal changes, and overweight) may be linked to the onset of a complex metabolic syndrome that involves transgenerational inheritance etiology.
It has been observed in many studies that changes in the lipid profile and early life weight fluctuations may lead to disruption of glucose homeostasis in preadolescent and adult life. 40,48 We identified major disturbances in the glucose homeostasis of the test F1 lineage. Animals showed higher fasting serum glucose along with increased serum insulin. These results indicate that BPA affected insulin sensitivity in F1 generation of obese rats.
It is widely known that obesity induces metabolic complications in reproductive functions of both males and females. 42,49 Women with PCOS have an estimated 2-4 fold increase in the prevalence of metabolic syndrome, impaired glucose tolerance, and type 2 diabetes. 50 We observed a decrease in estrogen and testosterone levels of F1 test rats. The LH/FSH ratio also showed a significant increase in the test animals, indicating the onset of ovarian disease, which could be confirmed by histopathological analysis. On the other hand, males showed a decline in serum testosterone concentration. However, the LH/FSH ratio remained unaffected in those animals. The changes in sperm morphology were evident, as sperms of male offspring of BPA-exposed parents exhibited hook deformities as well as tail impairments, whereas male offspring of BPA-exposed obese parents exhibited changes in hook curvature, and neck and tail abnormalities. Various decapitated sperms were also observed in highest frequency in samples from group IV animals (obese parents + BPA). BPA has been reported to induce male reprotoxicity, including adverse effects on sperm counts and sperm morphology. 51,52 A significant decline in the sperm count of group IV animals combined with an increased percentage of abnormal sperms places them under high risk of subfertility/infertility. Regarding male reproductive system, analysis of testis abnormalities indicated an increased number of apoptotic spermatogenic cells within the testis of male offspring of BPA-exposed obese parents. Traces of premature exfoliation and degenerative changes were observed in the F1 lineage of group IV. This may be the result of an increased oxidative stress in the testicular tissue. Such cellular changes have been reported in BPA-exposed animals in previous studies. 53 As glucose metabolism is an integral part of the spermatogenesis process, any disruption in glucose metabolism can lead to impairment of sperm function. 43 Group IV males showed higher levels of serum insulin and blood glucose concentration, which may also have contributed to the loss of sperm structure and function.
Ovarian abnormalities in the form of primordial follicle loss, loss of cells in stroma, and inflammation were prominently evident in F1 lineage females of group IV. Large follicular cysts observed in ovarian tissue confirm the incidence of polycystic disease in female rats. Reproductive toxicity is the major effect of BPA and induction of female reproductive toxicity is a common consequence of exposure to BPA and other EDCs. 54 An increase in the levels of oxidative stress marker, LPO, and decrease in antioxidant enzyme SOD activity may also be the cause of these cellular and tissue level changes leading to stromal loss. Currently, the world’s population of women is facing increased ovarian diseases of primary ovarian insufficiency characterized by primordial follicle loss and a polycystic ovarian disease with the presence of anovulatory cystic structures. 55,56 The high weight gain rates along with higher blood glucose and serum insulin are clinical indications of PCOS. All the changes observed in the F1 lineage of group IV in this study indicate toward the grave transgenerational effects of chronic low doses of BPA in the obese population.
There is a growing interest in BPA with regard to its effect on various metabolic disorders such as diabetes and obesity. 57 –59 Thus, BPA exposure, obesity, diabetes, and reproductive toxicity outcomes offer a complex scenario to toxicologists and risk assessors. Recently, Deshpande et al. 60 have shown genetically inherited obesity and high-fat diet-induced obesity alter the spermatogenesis in adult male rats. Our study is an attempt to address some of the concerns emerging out of these exposure scenarios.
Conclusions
Our study, for the first time, provides conclusive evidence of the aggravating effect of parental obesity on transgenerational toxicity of BPA involving the reproductive system of F1 generation (Figure 12). We induced obesity by high-fat diet. Recent studies implicating metabolic disorders and decreased fertility can help justify our results. Both male and female preadolescent progenies exhibited hormonal and metabolic disruption along with regressive structural changes in respective gonads. Taken together, our results show a clear confounding role for obesity in transgenerational reprotoxicity of BPA.
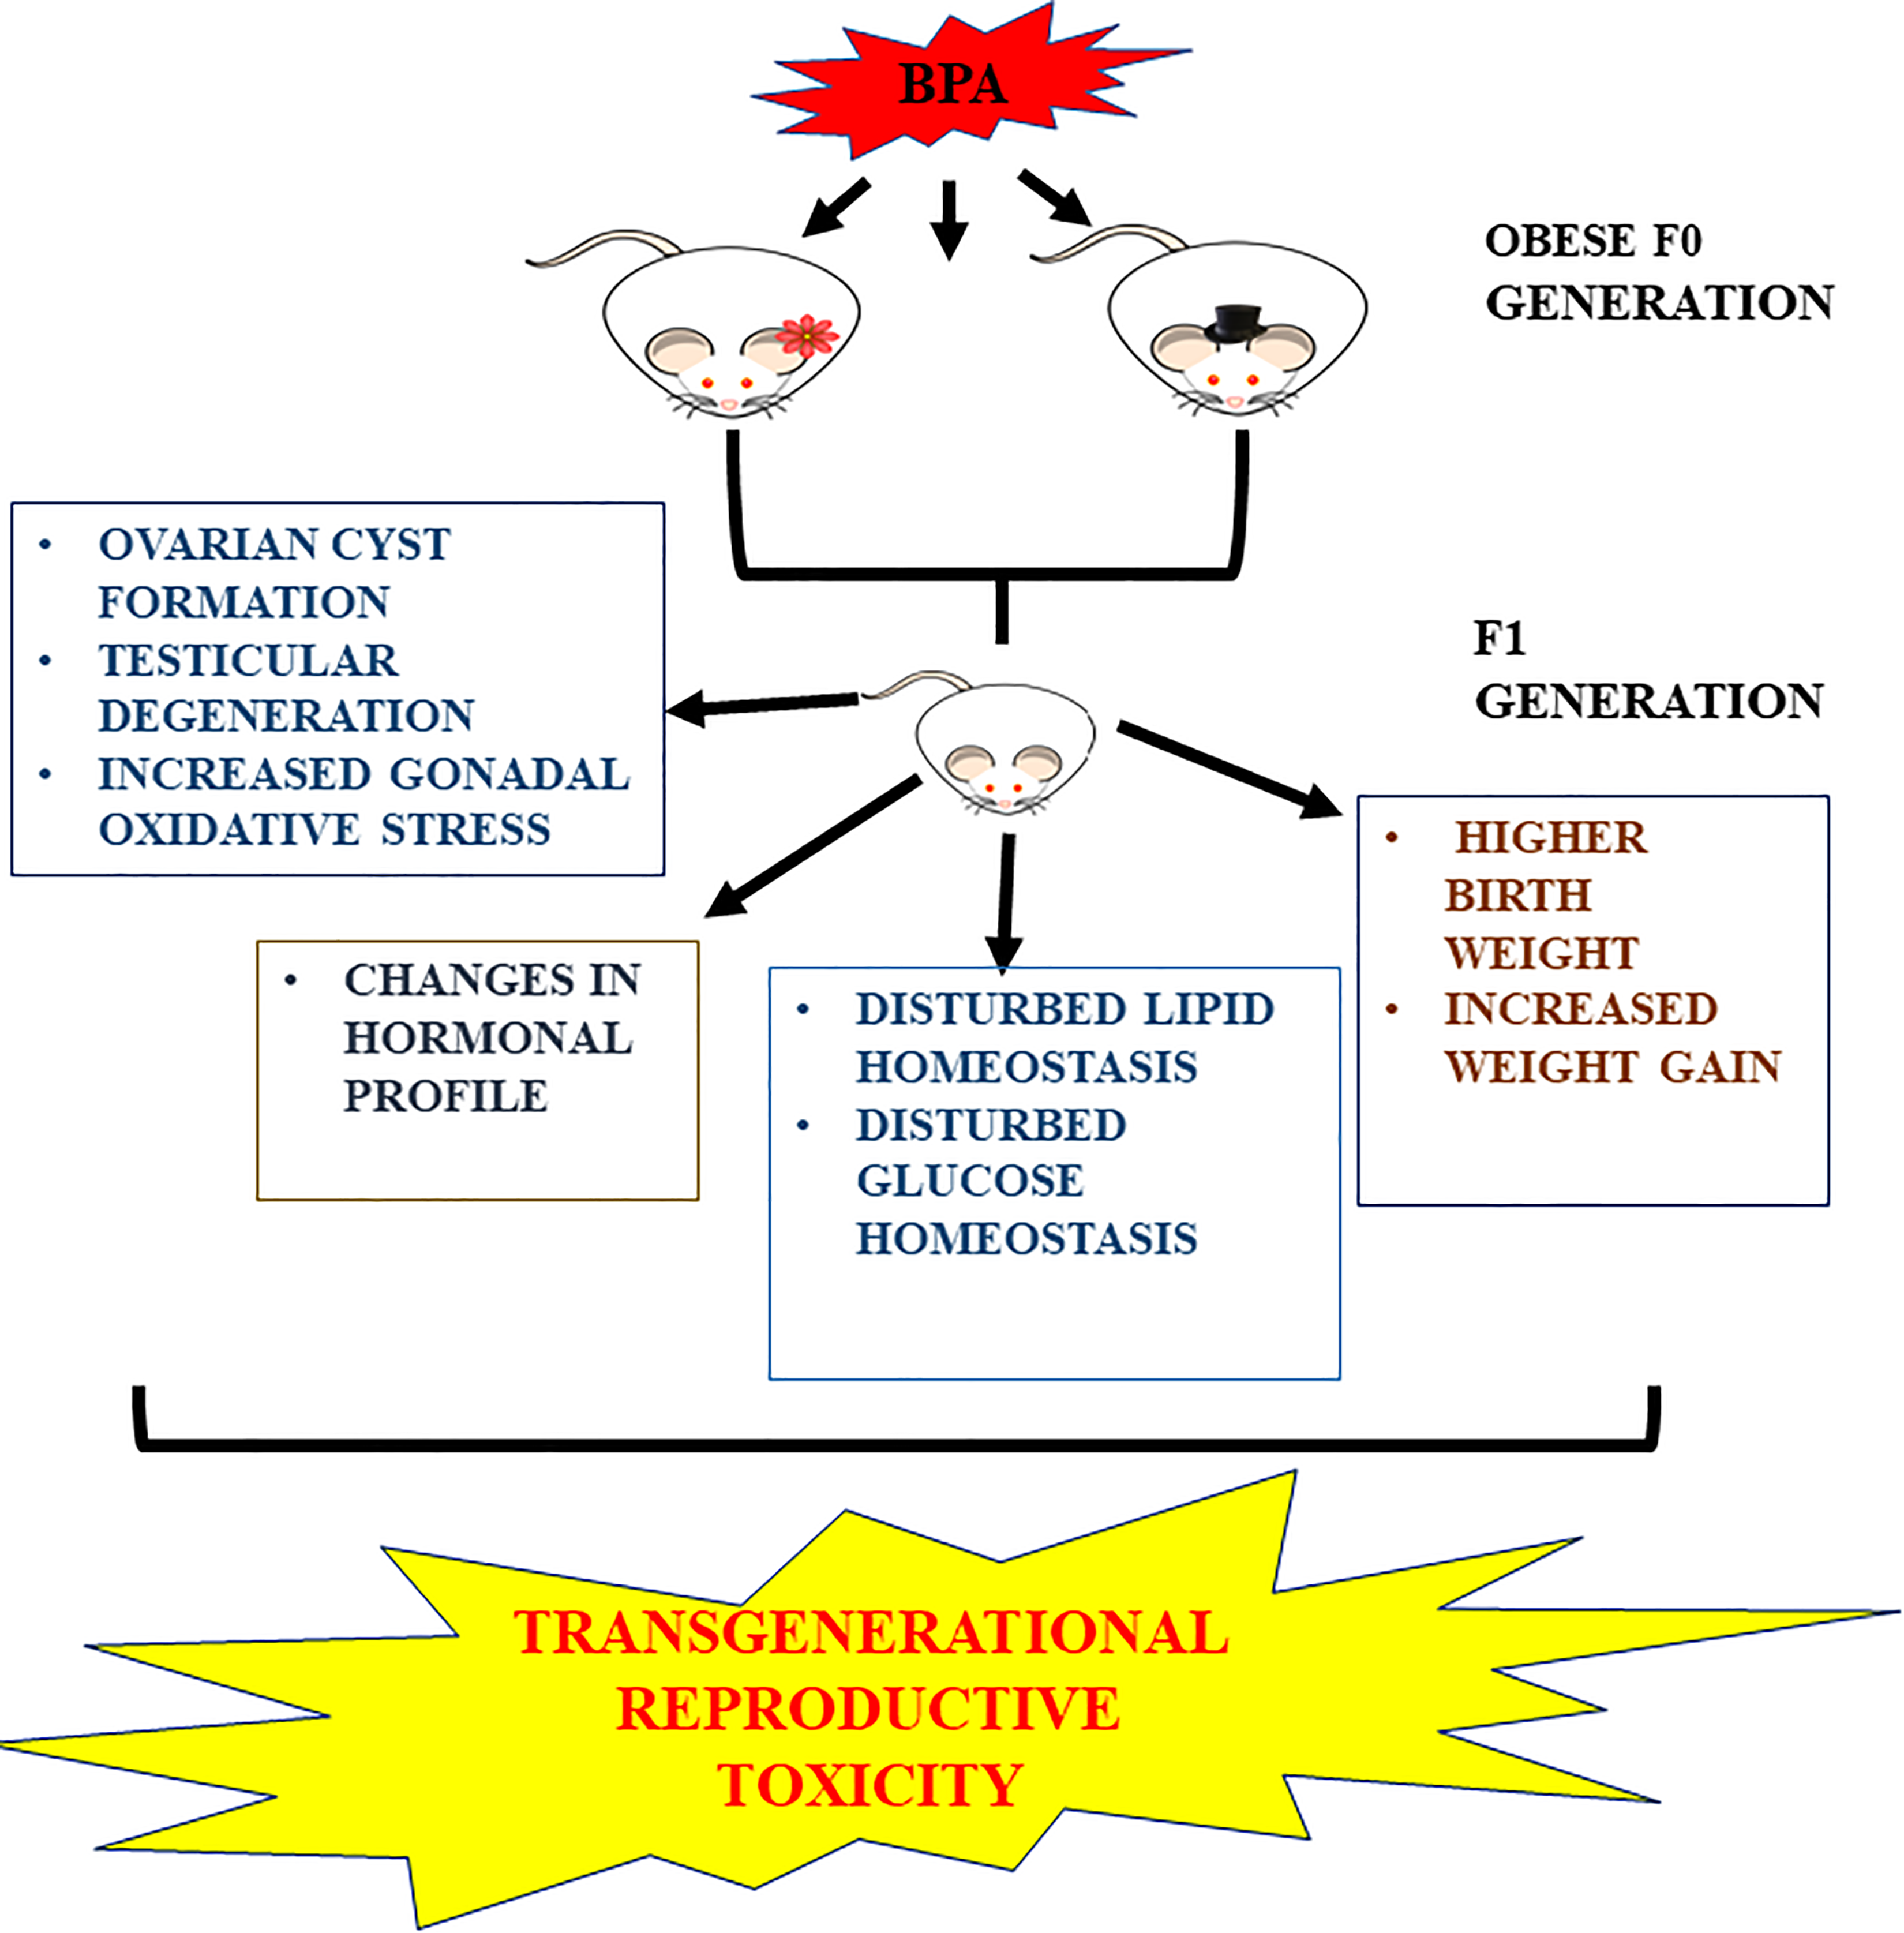
Graphical abstract showing transgenerational effect of bisphenol A (BPA) and obesity.
Footnotes
Acknowledgements
Dr. AK Tiwari, Veterinary Officer, Central Animal House Facility, Jamia Hamdard, New Delhi, India, facilitated interpretation of histopathological findings.
Author contributions
SD, SR, and SP were responsible for the design and execution of the studies. MAA, SA, MF, and HH contributed to the analysis of biochemical data. All authors contributed to the final manuscript.
Declaration of conflicting interests
The author(s) declare no potential conflicts of interest with respect to the research, authorship, and/or publication of this article.
Funding
The author(s) disclosed receipt of the following financial support for the research, authorship, and/or publication of this article: SD received a Senior Research Fellowship of University Grants Commission—Maulana Azad National Fellowship (UGC-MANFSRF; Grant No.: 201516-MANF-2015-17-UTT-59439).