
Abstract
Objectives:
Metformin, the type 2 anti-diabetes medication, showed antitumor activity both in vivo and in vitro. This study was carried out to investigate the mechanisms behind the metformin anticancer effect against 2-amino-1-methyl-6-phenylimidazo[4,5-b]pyridine (PhIP)-induced mammary carcinogenesis in female Sprague-Dawley rats.
Methods:
Rats received 10 doses of PhIP (75 mg/kg, p.o., days 1–5 and 8–12). Then, rats were treated with metformin for 26 weeks at a dose of 2 mg/ml in drinking water.
Key findings:
Metformin antitumor effect was mediated by increasing the adenosine monophosphate protein kinase (AMPK) activity, liver kinase B1, and decreasing the aromatase and insulin levels compared with the PhIP-administered group. Also, this treatment resulted in a significant decrease in mammary tissue oxidative stress markers and serum lipid profile. In parallel, mammary gland tumors found in PhIP+metformin group were all histologically benign included only (hyperplasia). However, most of the mammary gland tumors found in PhIP group were histologically malignant.
Conclusions:
These results showed that metformin antitumor effect was mediated through AMPK pathway, reducing oxidative stress and serum lipid levels. This study supports the potential benefit of using metformin as adjuvant therapy during breast cancer treatment.
Introduction
Metformin is the most important drug for the treatment of type 2 diabetes in obese patients and in women with polycystic ovarian syndrome. 1 Metformin exerts its antidiabetic action via decreasing liver’s gluconeogenesis and increasing the insulin sensitivity of body tissues. 2 Breast cancer is associated with type 2 diabetes, and a previous epidemiological study demonstrated that type 2 diabetes increased the risk of developing breast cancer by 10–20%. 3 Recent studies have suggested that metformin has anticancer effects in several cancer cell lines and animal models including the breast. 4
Activation of adenosine monophosphate protein kinase (AMPK) was required for metformin’s inhibitory effect on liver’s glucose production. 5 AMPK is an enzyme that plays an important role in insulin signaling, whole body energy homeostasis, and the metabolism of glucose and fats. 6 Metformin increases the concentration of cytosolic adenosine monophosphate (AMP), which in turn explains the inhibition of glucagon-induced increase in cAMP and protein kinase A activation. 7 In addition, AMPK may play a role in increasing peripheral insulin sensitivity, as metformin administration increases AMPK activity in skeletal muscle. 8 Another evidence on the link between metformin anticancer effect and AMPK is that small interfering of RNA inhibition of AMPK leads to the absence of an inhibitory effect of metformin on cell growth. 9 Moreover, a recent study showed that metformin could activate AMPK in cancer and non-cancer settings. 10
Liver kinase B1 (LKB1) is a tumor suppressor that encodes serine–threonine kinase that directly phosphorylates and activates AMPK. 11 AMPK–LKB1 have a molecular link between obesity and postmenopausal breast cancer via its actions to inhibit the expression of aromatase (the enzyme responsible for a key step in the biosynthesis of estrogen), hence estrogen production, within the breast. Metformin increases the phosphorylation of AMPK at Thr172 and decreases the forskolin/phorbol ester-induced expression of aromatase at concentrations of 10 and 50 μM. Therefore, it will reduce the local production of estrogens within the breast. 12
Food cooking process may create some endogenous or exogenous cancer causes such as heterocyclic aromatic amines (HCAs) formed from the reaction of creatine or creatinine, amino acids, and sugars in meat and fish cooked at high temperatures. 13 2-Amino-1-methyl-6-phenylimidazo[4,5-b]pyridine (PhIP) is one of the most abundant HCAs in cooked meat or fish. 14 HCAs are foodborne class of carcinogens, identified and isolated in 1977, categorized by WHO as class I cancer-causing agents. HCAs are a group of 20 compounds, some of which cause oxidative stress in various organs and used for cancer chemoprevention studies. 15 Oxidative stress causes DNA damage, which can lead to mutations in tumor suppressor genes. Numerous studies suggest that oxidative stress has a direct effect on various tumors progression and metastasis. 16 Metformin has an antiproliferative effect associated with cell cycle arrest and apoptosis, which could be mediated by oxidative stress, as well as AMPK activation. 17
Independent factors of cancer development in type 2 diabetes are insulin resistance and hyperinsulinemia (either endogenous due to insulin resistance or exogenous from administration of insulin formulations). 18 In addition, the risk of tumor development may be associated with hyperglycemia-related oxidative stress, accumulation of advanced glycation end products, and low-grade inflammation. 19 Metformin exerts its anticancer effect systemically via the reduction of circulating levels of insulin and insulin-like growth factor 1 (IGF-1). 20
Therefore, this study investigates the role that metformin could play against PhIP-induced mammary carcinoma in Sprague-Dawley (SD) rats through AMPK activation and inhibition of oxidative stress.
Materials and methods
Ethical approval
The Institutional Animal Care and Use Committee, Faculty of Science, Tanta University has approved the protocol of the study in January 2016 under (IACUC-Sci-TU-0086) certificate number.
Materials
PhIP-HCl (Nard Institute, Japan) was a generous gift from professor Shoji Fukushima, Department of Pathology, Osaka City University, Medical School, Japan. Metformin was purchased as metformin-HCl (500 mg) tablets from Merck (UK).
Animals
Healthy, female SD rats were obtained from the Holding Company for Biological Products and Vaccines (Vaccera), Helwan-Giza, Egypt. They were allocated to plastic cages covered with metal grids with dry husk padding and allowed to acclimatize for 1 week in the animal facility conditions before being divided into groups for experimentation when reached the age of 43 days and 100 ± 10 g approximately. Target values for temperature and relative humidity measured in the animal facility were about 23 ± 2°C and 55 ± 5%, respectively, and lighting was naturally exposed light–dark (day/night) cycle. All rats were given drinking water and high polyunsaturated fat diet (corn oil 23.5%). 21 All diet ingredients obtained from Nasr Company for Immediate Chemicals (Giza, Egypt), prepared weekly in our laboratory and stored in a cold room (<4°C). This diet was composed of dried grass, soybean, wheat bran, corn mixed vitamins, minerals (salts), bones powder, and bean straw. Ingestion energy is not more than 488.76 kcal/l00 g. Animals were carefully observed every day and their body weights, food consumption, and water intakes were measured precisely every week to evaluate metformin consumption in drinking water, besides to observe any signs of toxicity or abnormality during the experiment. The average was calculated during the course of the experiment as grams per rate per day for food and milliliters per rat per day for water.
Experimental design
A total of 40 SD rats were divided into 4 groups as follow: group 1 (G1, 15 rats): normal feeding without treatment (−ve control); group 2 (G2, 15 rats): Metformin (Met) only, 2 mg/ml in drinking water 22 daily for 26 weeks starting after last PhIP dose. Approximately, water consumption in rats was 10–12 ml per 100 g body weight daily and metformin did not affect the drinking intake; group 3 (G3, 15 rats): PhIP dissolved in 5% DMSO and administered as (75 mg/kg b.wt., p.o.) days 1–5 and 8–12. 21 ; group 4 (G4, 15 rats): PhIP+metformin: same previous doses.
Experimental induction of mammary tumors
Mammary carcinogenesis was experimentally induced in female SD rats at 43 days of age by administration of PhIP dissolved in 5% DMSO (75 mg/kg b.wt., p.o.) days 1–5 and 8–12. 21
Clinical observations
All animals were observed every day for systematic clinical status. The weight of the rats was measured weekly throughout the experimental period. Palpation was committed twice a week at the beginning then daily after appearance of the first tumor for detection of any growth in the mammary glands and visible tumor volumes. Tumor volume was calculated using the formula: (length) × (width) × (depth) × π/6.
Tumor histopathology
All tumors; normal mammary glands and normally appearing mammary glands from PhIP-treated groups besides suspected tissues were collected and fixed in 10% phosphate buffered formalin for histopathological study. Formalin-fixed tissue samples were dehydrated in graded alcohol, cleared in xylene, and embedded in paraffin blocks. About 4–5 μm thick sections were taken and stained with hematoxylin and eosin (H&E) for histopathological examination. The tumors were diagnosed according to the criteria of tumor pathology in experimental animals of Turosov and Mohr. 23
Determination of AMPK, aromatase activity, and LKB1 levels
Tumor samples as well as normally appearing mammary tissues from all groups were processed using (MyBioSource, Inc., San Diego, California, USA) ELISA assay kits as follow: AMPK levels at Thr 172 were estimated as described in the instruction manual of MBS2501430. Aromatase activity (measured as forskolin/phorbol ester) was prepared as described in the instruction manual MBS2023052. LKB1 protein expression levels were measured as described in (Cloud-Clone Corp., Houston, Texas, USA) the instruction manual SEH115MU 96.
Determination of antioxidant activity levels
Tumor samples as well as normally appearing mammary tissues from all groups were processed and evaluated colorimetrically for biochemical analyses of the antioxidant activity levels according to the following methods: The lipid peroxides content as malondialdehyde (MDA) was estimated according to the method of Yoshioka et al. 24 without any modification. The reduced glutathione (GSH) concentration was determined according to the method described by Beutler et al. 25 Superoxide dismutase (SOD) activities in mammary gland and mammary tumors were estimated as per the method described by Shiraishi et al. 26 The total antioxidant capacity (TAC) was determined according to the method described by the manufacture’s kit (Abnova kit, Walnut, California 91788, USA) by Cu+2 reagents, assay diluents, protein mask, and Trolox standard (1 µmol).
Blood biochemistry and hormone analysis
Blood was collected from the abdominal aorta from all rats at autopsy using 5-ml syringes. Collected blood samples were immediately centrifuged at 3000 r/min for 15 min to separate serum, which was stored frozen at −20°C until use. Biochemical analyses for low-density lipoprotein-cholesterol (LDL-C), total cholesterol, and high-density lipoprotein-cholesterol (HDL-C) were established using commercially available kits to measure their serum concentration. In addition, biochemical hormonal analyses were established using a commercially available radioimmunoassay kit to measure serum concentration of insulin (Cisbio ASSAYS, Bedford, Massachusetts, USA).
Statistical analyses
The significance of differences between groups’ mean values were subjected to analysis of variance (SPSS, version 16, USA). Data for tumor incidence (%) were analyzed according to the Fisher’s exact probability test or the χ2 test. Statistical significance was estimated at p < 0.05.
Results
Gross pathology and volumes of mammary tumors
Some rats that were injected with PhIP showed gross tumor lumps firstly specified by a small, rigid, and nodular growth that was growing fast into a globular sized mass of 2.5 cm at the 17th week and further progressed to big masses. Some animals showed multiple tumors, which later become large masses of tumors. Most rats having tumors had skin necrosis followed by ulceration. Measurements of tumor volumes showed that the tumors were greatly variable in size. Tumors found in the group treated with PhIP+Met had a significant decrease in the average tumor volume (2.8 ± 0.33) as compared to ones observed in the PhIP treated group (6.7 ± 0.52).
Histological typing of mammary tumors
Figure 1 shows histological variations of different mammary gland tissues from some rats in the experimental groups. Some of the mammary masses found in PhIP group were diagnosed as mammary gland tubular adenoma and invasive cribriform adenocarcinoma. The PhIP+Met group showed mammary gland tissue with mild hyperplasia.

Photomicrographs of: (a) Normal histology of rat tubuloalveolar mammary gland; (b) PhIP-induced mammary gland tubular adenoma; (c) PhIP-induced mammary invasive cribriform adenocarcinoma; (d) magnified portion of PhIP+metformin showing mild ductal hyperplasia. H&E. H&E: hematoxylin and eosin; PhIP: 2-amino-1-methyl-6-phenylimidazo[4,5-b]pyridine.
Average AMPK, LKB1, and aromatase levels in mammary gland tissues
Figures 2 to 4 show the data for the average AMPK, LKB1, and aromatase measured in mammary gland tissues from all experimental groups. Treatment with metformin alone in group 2 showed a significant increase in AMPK and LKB1 and a significant decrease in aromatase mammary gland tissue levels as compared to the control group (p < 0.05). PhIP administration in group 3 caused a significant decrease in AMPK and LKB1 mammary gland tissue levels while significantly increased the aromatase mammary gland tissue levels as compared with the control group (p < 0.01). On the other hand, treatment with PhIP+Met in group 4 significantly increased the mammary tissue levels of AMPK and LKB1 while decreased the aromatase levels highly significantly as compared to the PhIP-only group (p < 0.01), but still with a significant difference comparing to the control group (p < 0.05).
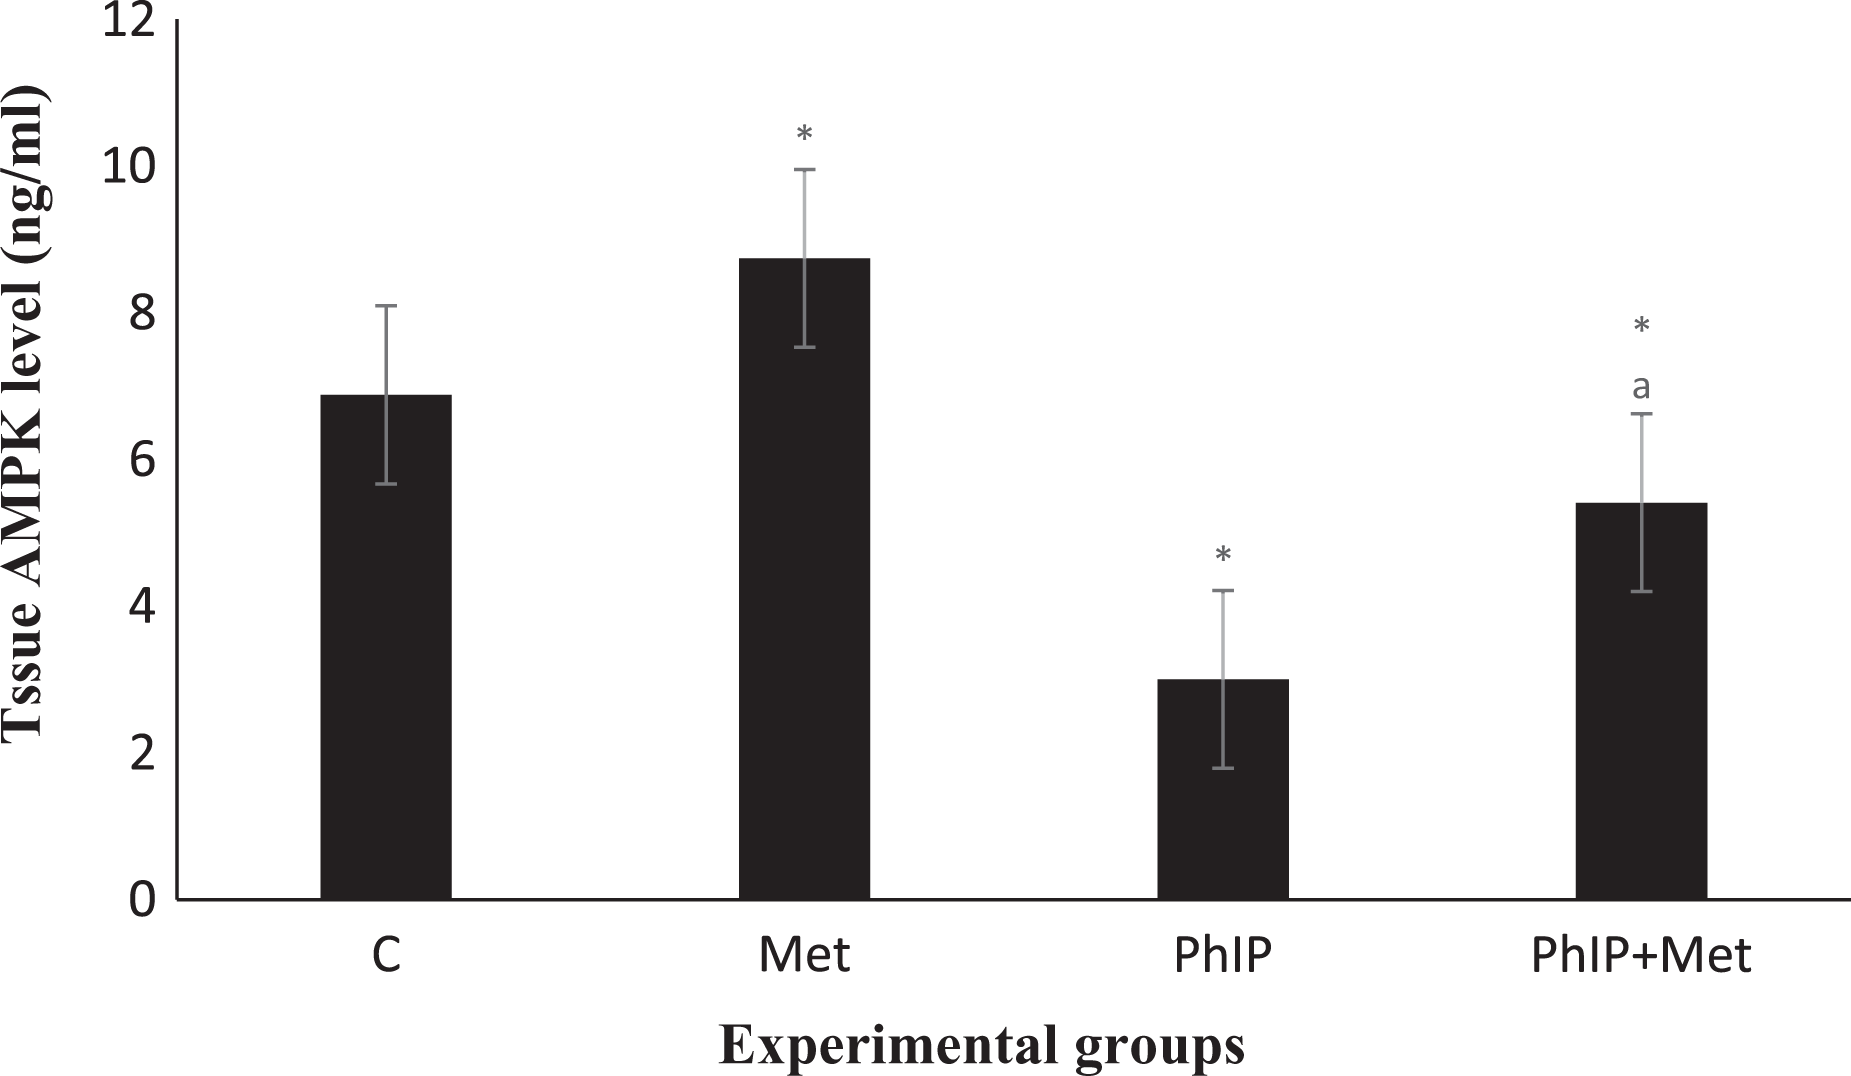
Tissue AMPK levels (ng/ml). Control: (−ve) control; Met: metformin (2 mg/ml) in the drinking water starting after last PhIP dose; PhIP: 2-amino-1-methyl-6-phenylimidazo(4,5-b)pyridine (75 mg/kg b.wt., by gavage) starting from first day of the experiment on days 1–5 and 8–12. AMPK: 5′ adenosine monophosphate-activated protein kinase. Data are mean ± S.D.; *significant versus G1 group at p < 0.05; asignificant versus G3 at p < 0.01. S.D.: standard deviation.

Tissue LKB1 levels (ng/ml). Control: (−ve) control; Met: metformin (2 mg/ml) in the drinking water starting after last PhIP dose; PhIP: 2-amino-1-methyl-6-phenylimidazo(4,5-b)pyridine (75 mg/kg b.wt., by gavage) starting from first day of the experiment on days 1–5 and 8–12. LKB1: liver kinase B1. Data are mean ± S.D.; *significant versus G1 group at p < 0.05; asignificant versus G3 at p < 0.01. S.D.: standard deviation.

Tissue aromatase levels (ng/ml). Control: (−ve) control; Met: metformin (2 mg/ml) in the drinking water starting after last PhIP dose; PhIP: 2-amino-1-methyl-6-phenylimidazo(4,5-b)pyridine (75 mg/kg b.wt., by gavage) starting from first day of the experiment on days 1–5 and 8–12. Data are mean ± S.D.; *significant versus G1 group at p < 0.05; asignificant versus G3 at p < 0.01. S.D.: standard deviation.
Average MDA, GSH, SOD, and TAC levels in mammary gland tissues
Table 1 shows the data for the average MDA, GSH, SOD, and TAC measured in mammary gland tissues from all experimental groups. About MDA, the groups treated with Met alone showed a significant increase in mammary tissue levels as compared to control negative group (p < 0.05), but still much lower than rats treated with PhIP alone (p < 0.01). However, treatment with PhIP+Met has significantly decreased their mammary tissue levels as compared to PhIP-alone-administered group (p < 0.01).
Average levels of antioxidant markers of mammary gland tissues from all experimental groups.a

Control: (−ve) control; Met: metformin (2 mg/ml) in the drinking water starting after last PhIP dose; PhIP: 2-amino-1-methyl-6-phenylimidazo(4,5-b)pyridine (75 mg/kg b.wt., by gavage) starting from first day of the experiment on days 1–5 and 8–12; MDA: malondialdehyde; GSH: glutathione; SOD: superoxide dismutase; TAC: total antioxidant capacity; S.D.: standard deviation; n: number of samples analyzed.
aData are mean ± S.D..
bSignificant versus G1 group at p < 0.05
cSignificant versus G3 group at p < 0.01.
Metformin treatment alone showed a significant increase in GSH mammary gland tissue levels as compared to the control group (p < 0.05). On the other hand, treatment with PhIP only showed a significant decrease in GSH mammary gland tissue levels as compared to control (p < 0.01). Meanwhile, treatment with PhIP+Met has significantly increased mammary tissue levels of GSH compared to the PhIP group (p < 0.01) but still had significant difference compared to the control group (p < 0.05).
Treatment with PhIP showed a significant decrease in SOD and TAC mammary gland tissue levels compared with the control group (p < 0.01). On the other hand, combined treatment with PhIP+Met significantly increased the SOD and TAC mammary gland tissue levels compared to the PhIP group (p < 0.01), while still significantly lower than the control group (p < 0.05).
Serum Insulin, LDL-C, HDL-C, and total cholesterol
Insulin, LDL-C, and total cholesterol levels were significantly higher in the PhIP group compared to the control one (p < 0.01). Treatment with PhIP+Met showed a significant decrease (p < 0.01) in LDL-C and total cholesterol levels compared to the PhIP group but still significantly higher than the control group levels (p < 0.05; Figures 5 to 7). About HDL-C, administration of PhIP alone showed a significant decrease in the HDL-C serum levels compared to the control group (p < 0.01). Meanwhile, treatment with PhIP+Met significantly increased the serum HDL-C levels compared to the PhIP group (p < 0.01) while still significantly lower than the control group (p < 0.05; Figure 8).

Serum insulin levels (pmol/L). Control: (−ve) control; Met: metformin (2 mg/ml) in the drinking water starting after last PhIP dose; PhIP: 2-amino-1-methyl-6-phenylimidazo(4,5-b)pyridine (75 mg/kg b.wt., by gavage) starting from first day of the experiment on days 1–5 and 8–12. Data are mean ± S.D.; *significant versus G1 group at p < 0.05; asignificant versus G3 at p < 0.01. S.D.: standard deviation.

Serum LDL-C levels (mg/dl). LDL-C: low-density lipoprotein-cholesterol; Control: (-ve) control; Met: metformin (2 mg/ml) in the drinking water starting after last PhIP dose; PhIP: 2-amino-1-methyl-6-phenylimidazo(4,5-b)pyridine (75 mg/kg b.wt., by gavage) starting from first day of the experiment on days 1–5 and 8–12. Data are mean ± S.D.; *significant versus G1 group at p < 0.05; asignificant versus G3 at p < 0.01. S.D.: standard deviation.

Serum total cholesterol levels (mmol/l). Control: (−ve) control; Met: metformin (2 mg/ml) in the drinking water starting after last PhIP dose; PhIP: 2-amino-1-methyl-6-phenylimidazo(4,5-b)pyridine (75 mg/kg b.wt., by gavage) starting from first day of the experiment on days 1–5 and 8–12. Data are mean ± S.D.; *significant versus G1 group at p < 0.05; asignificant versus G3 at p < 0.01. S.D.: standard deviation.
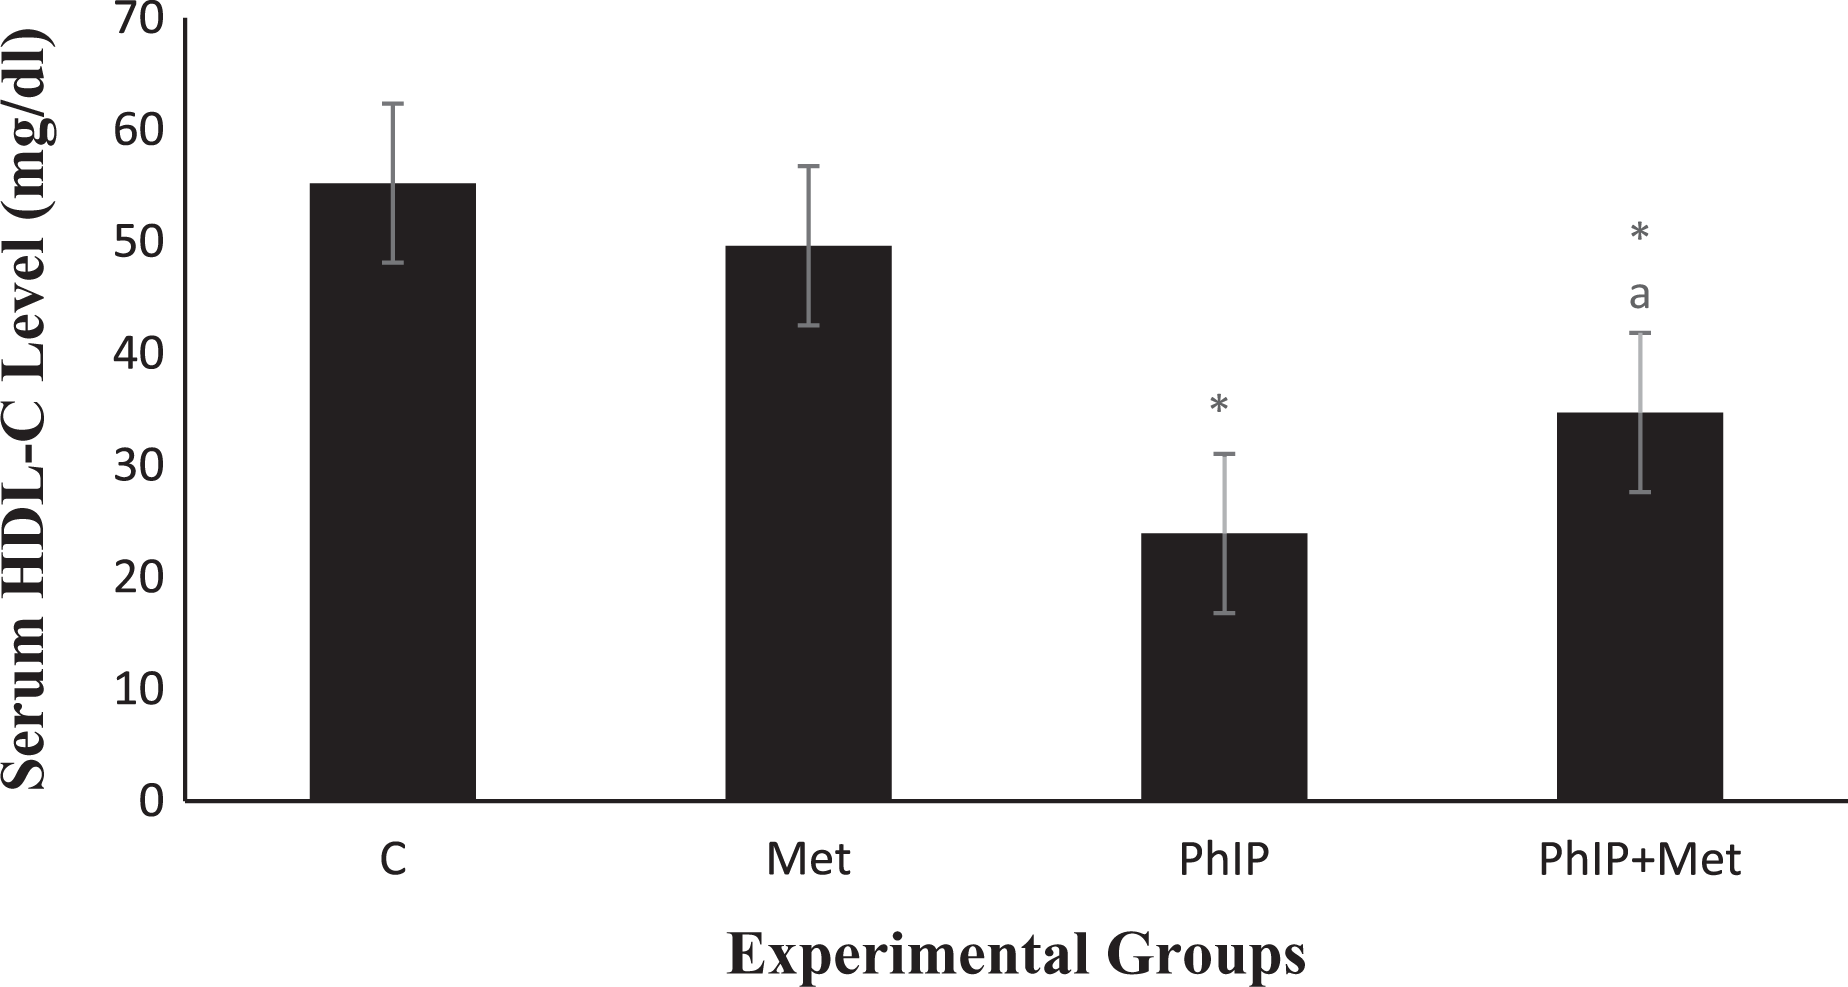
Serum HDL-C Levels (mg/dl). HDL-C: high-density lipoprotein-cholesterol. Control: (−ve) control; Met: metformin (2 mg/ml) in the drinking water gavage starting after last PhIP dose; PhIP: 2-amino-1-methyl-6-phenylimidazo(4,5-b)pyridine (75 mg/kg b.wt., by) starting from first day of the experiment on days 1–5 and 8–12. Data are mean ± S.D.; *significant versus G1 group at p < 0.05; asignificant versus G3 at p < 0.01. S.D.: standard deviation.
Discussion
Metformin is believed to act directly (insulin-independent) on cancer cells by stimulation of AMPK in association with LKB1, which act as tumor suppressors. AMPK is an important regulator of energy homeostasis. It stimulates pathways of energy production such as glycolysis and fatty acid β-oxidation but inhibits pathways of energy utilization such as fatty acid biosynthesis, cholesterol biosynthesis, and gluconeogenesis. 4 However, direct action of metformin on AMPK has not been confirmed yet, one of the indirect proposed actions include inhibition of complex 1 of the mitochondrial electron transport chain. 27 This would result in a decrease in ATP formation and a consequent increase in adenosine diphosphate (ADP) and AMP, the latter being an obligatory activator of AMPK. A study by Brown et al. 12 showed that treatment of human breast adipose stromal cells with 50 μM metformin resulted in a significant increase in phosphorylation of AMPK at Thr 172.
Interestingly, metformin also caused a significant increase in LKB1 protein expression and promoter activity. Furthermore, metformin decreases aromatase expression. Therefore, they suggested that metformin would reduce the local production of estrogens within the breasts which provides a new setting and preventive measure in obese women. This is consistent with our findings, which show that treatment of female SD rats with PhIP showed a significant decrease in tissue AMPK and LKB1 levels with a consequent increase in aromatase level. On the other hand, combined treatment with metformin (PhIP+Met) had significant, similar and opposing effects on AMPK, LKB1, and aromatase compared to the PhIP group. In addition, a study by Queiroz et al. 17 showed that MCF-7 breast cancer cells treated with 10 mM of metformin resulted in an increase in p-AMPK levels.
In our study, PhIP-treated group resulted in higher average tumor volume compared to the one treated with PhIP+Met. Histopathological findings revealed mammary gland tubular adenoma and invasive cribriform adenocarcinoma in PhIP-treated group, while PhIP+Met treated group showed only mild hyperplasia. Our results were in accordance with Ghoshal et al. 21 who found that female SD rats that treated orally with PhIP showed different phenotypes of mammary tumors including intraductal carcinoma (papillary, cribriform, and comedotype) and tubular adenocarcinoma. In addition, a study by El-Ashmawy et al. 28 demonstrated that metformin alone or in combination with doxorubicin reduced the tumor volume of solid Ehrlich carcinoma mice, and this effect was mediated through AMPK pathway.
Other publications have also suggested the link between hypoglycemic medications and cancer. 20,29 The results of numerous studies suggested that metformin use is associated with inhibition of cancer cell growth and proliferation and reduction in all-cancer incidences in comparison with other hypoglycemic drugs. 30 In addition, in nondiabetic women with breast cancer, metformin significantly lowers insulin levels and improves insulin resistance. 31 Metformin reduces levels of circulating glucose, improves insulin sensitivity, and decreases insulin resistance associated hyperinsulinemia as one of the antineoplastic effects of metformin in breast cancer. 32 These results supported our findings in the present study, which showed that combined treatment with metformin (PhIP+Met) resulted in the significant lowering effect on insulin levels compared to the PhIP group, which had high insulin level versus the normal control one. In addition, homeostasis model assessment of insulin resistance (HOMA-IR) could be used to assess insulin resistance.
Oxidative stress has an important role in initiation, progression, and metastasis of breast cancer. 33 The data for oxidative stress markers studied here showed a significant increase in MDA mammary tissue levels, with a consequent decrease in GSH, SOD, and TAC levels in the chemical carcinogen (PhIP)-treated group versus normally appearing mammary gland tissues. In line with this, Jain et al. 34 showed the effect of PhIP on the normal breast epithelial cells (MCF-10A). In the absence of PhIP, reactive oxygen species (ROS) production was limited but increased significantly in the presence of PhIP in a dose-dependent manner. On the other hand, combined treatment with metformin resulted in a significant decrease in MDA mammary tissue levels and markedly increased GSH, SOD, and TAC levels compared to PhIP-treated group. The antiproliferative role and mechanism of action of metformin in MCF-7 cancer cells treated with 10 mM of metformin for 24, 48, and 72 h was examined by Queiroz et al. 17 who found that treatment with metformin resulted in an increase of catalase, MnSOD, and Cu/Zn SOD protein expression.
Since the increase in cholesterol concentration is an indication of membrane structure and function, an imbalance in the cholesterol level has similarly been implicated in many diseases, such as cancer. 35 In the present investigation, PhIP causes an increase in serum lipids (LDL-C and HDL-C) and total cholesterol levels, while metformin opposes this effect. This was demonstrated by Martin et al. 36 who found that increasing the non-HDL lipids or decreasing HDL lipids levels is strongly associated with the increased breast cancer risk while total cholesterol and triglycerides levels were not significantly associated with that. On the other hand, metformin improved glycemic control and lipid concentrations in patients with insulin-treated non-insulin-dependent diabetic patients whose diabetes was poorly controlled and these improvements could be maintained over the long term. 37
Conclusions
This study makes a step forward in clarifying part of metformin mechanisms that could be useful in the treatment of mammary carcinoma induced by PhIP in SD rats.
Footnotes
Declaration of Conflicting Interests
The author(s) declared no potential conflicts of interest with respect to the research, authorship, and/or publication of this article.
Funding
The author(s) received no financial support for the research, authorship, and/or publication of this article.