
Abstract
The aim of this study was to identify biomarkers of zoledronate-induced nephrotoxicity and to further characterize the mechanisms underlying this process by analyzing urinary metabolites. Twenty-four rats were randomly divided into four groups containing four (two control groups) or eight rats (two zoledronate groups) per group. The rats were injected intravenously with saline or zoledronate (3 mg/kg) singly (single, 3 weeks) or repeatedly eight times (3 weeks/time, 24 weeks). Serum blood urea nitrogen, serum creatinine, creatinine clearance, and kidney injury observed by hematoxylin and eosin and immunohistochemical staining were changed only in the repeated zoledronate group (3 mg/kg, 3 weeks/time, 24 weeks). Urinary levels of S-adenosylmethionine, S-adenosylhomocysteine,
Introduction
Zoledronic acid, also known as zoledronate, is a bisphosphonate drug given intravenously to treat osteoporosis, hypercalcemia of malignancy, and osteolytic bone metastases. The use of zoledronate has become widespread due to its effectiveness as the only bisphosphonate drug approved by the US Food and Drug Administration (FDA) for the treatment of osteolytic bone metastases caused by cancer. However, concern has been raised about it causing nephrotoxicity in clinical practice. 1 –3 The nephrotoxic effects of zoledronate are dose dependent and infusion time dependent. 4 The reported rates of zoledronate-induced nephrotoxicity in current clinical use range around 1%. 5 –7 Although a relatively lower nephrotoxicity of zoledronate has been claimed in some reports, 8 many cases of zoledronate-associated renal toxicity or renal failure have been reported in clinical research. For example, 72 cases of zoledronate-associated renal failure were reported to the FDA. 1 A report from French Adverse Event Reporting System also found seven cases of zoledronate-induced renal toxicity. 7 Similarly, a report from the Research on Adverse Drug Events and Reports Project showed that kidney injury was identified in zoledronate-associated cancer clinical trials. 9 Therefore, zoledronate-induced nephrotoxicity is a significant public health concern.
Zoledronate-induced nephrotoxicity is usually marked by elevated serum creatinine and is accompanied by histopathological changes, which are characterized by necrosis and fibrosis of tubular epithelial cells. 10 The molecular mechanisms have also been reported as an inhibitor of farnesyl diphosphate synthase (FDPS, an enzyme in the mevalonate pathway for cholesterol biosynthesis), and zoledronate-induced dysfunction of posttranslational lipid modification (prenylation) of small guanosine triphosphate hydrolases (GTPases). The small GTPases are important signaling proteins regulating osteoclast morphology, cytoskeleton arrangement, membrane ruffling, trafficking, and cell survival. Thus, it has been suggested that the mechanisms of zoledronate-induced nephrotoxicity are similar to its pharmacological effects in osteoclasts. The inhibition of FDPS by zoledronate in renal cells may cause diminished function of sodium–potassium adenosine triphosphatase (Na+-K+-ATPase), membrane ruffling, trafficking, and apoptosis. 11,12 What is more, it has been reported that defective fatty acid metabolism contributes to renal lipid accumulation and kidney fibrosis and plays an important role in the progression of zoledronate-induced nephrotoxicity. 13
Because of the advantages of “omics” tools in capturing comprehensive and dynamic metabolic impacts of zoledronate treatment, some possible biomarkers for zoledronate induced toxic effects have been suggested. For example, interleukin-19 was identified as a translational indicator of zoledronate-induced renal injury according to a well renal proximal tubule cell line, renal proximal tubule epithelial cells/telomerase reverse transcriptase 1 (RPTEC/TERT1) cells, utilizing microarray analysis. 14 Urine N-telopeptide of type I collagen was identified as an inflammatory marker, which is responsible for zoledronate-induced acute phase response in postmenopausal women with osteoporosis. 15 In addition, a proteomics study showed that valine, leucine and isoleucine degradation pathway is the most disturbed pathway in zoledronate-induced HK-2 cell toxicity. 13 These studies highlight the significance of the “omics” approach in uncovering the comprehensive and dynamic metabolic changes induced by zoledronate. However, the metabolic character of zoledronate treatment and the metabolomics-based mechanisms of zoledronate-induced nephrotoxicity are inconclusive; little information is available on metabolic predictors or biomarkers of zoledronate-induced nephrotoxicity.
Several characterized metabolites have been examined and identified as biomarkers to predict drug-induced nephrotoxicity, such as gentamicin-, aristolochic acid-, cisplatin-, cyclosporine A- and puromycin in established in vitro and in vivo models. 16 Given that branched chain amino acid metabolism, glucose metabolism, and fatty acid metabolism are highly disturbed in response to zoledronate treatment, 13 it can be inferred that some small molecular metabolites may be used as biomarkers to predict the development of zoledronate-induced kidney injury. Thus, the present study utilized a liquid chromatography/mass spectrometry (LC/MS)-based metabolomics approach to evaluate changes in endogenous metabolites found in rat urine after zoledronate treatment regimens, which may be helpful for identifying potential biomarkers and understanding the mechanism involved in zoledronate-induced nephrotoxicity.
Methods
Chemicals, cells, and animals
Zoledronic acid (monohydrate, purity > 98%) was obtained from Bide Pharmatech Ltd. (Shanghai, China). Ammonium acetate and ammonium hydroxide were bought from Kermel Chemical Reagents (Kermel, Tianjin, China). Cholic acid-2, 2, 3, 4, 4-d5, as an internal standard was bought from Sigma-Aldrich Biotechnology (St Louis, Missouri, USA). Phosphate-buffered saline (PBS, pH = 7.4) was bought from Beyotime Biotechnology (Beyotime, Wuhan, China). Solvents used as eluents for LC/MS were high-performance liquid chromatography-grade methanol, acetonitrile from Fisher Scientific (FairLawn, NJ, USA) and ultrapure water. All other chemicals used in this study were of the highest grade commercially available.
HK-2 (CRL-2190), a human proximal tubular cell line, was purchased from American Tissue Culture Collection (ATCC, Manassas, Virginia, USA) and cultured in Dulbecco’s modified Eagle’s medium/Nutrient F-12 Ham (DMEM/F12) supplemented with 10% fetal bovine serum and 100 IU/ml penicillin–streptomycin at 37°C in a humid atmosphere with 5% carbon dioxide. Male Sprague Dawley (SD) rats (7 weeks of age) were obtained from Vital River Laboratory (Animal Technology Co., Ltd, Beijing, China) and initially weighing about 200 g. All animals were maintained in a specific pathogen-free conditioned room with a 12-h light/12-h dark cycle. The ambient air temperature and relative humidity were set to 22 ± 2 °C and 50 ± 10%, respectively. Tap water and rodent chow were given ad libitum. The rats were acclimatized and habituated to the laboratory for at least 1 week before being subjected to tests and were used only once throughout the experiments. The protocol was approved by the Institutional Animal Care and Use Committee of Jiangxi Science and Technology Normal University (No. 2013-012), which is also in accordance with the guidelines of Institutional Animal Care and Use Committee of the Jiangxi Institutes for Biological Sciences. All efforts were made to minimize animals suffering.
Experimental design
All animals were randomly assigned into four groups containing four (two saline groups) or eight rats (two zoledronate groups) per group listed below: one group of eight rats was given zoledronate (3 mg/kg, Z8, n = 8) and one group of four rats was given saline (C8, n = 4) by intravenous injection once every 3 weeks for 24 weeks. The other two groups of rats remained untreated until near the end of the study (the 21st week), at which time another group of eight rats was given a single intravenous injection of zoledronate (3 mg/kg, Z1, n = 8) and another group of four rats was given saline (C1, n = 4).
The volume of each dose injected was adjusted to 5 ml/kg per rat on the basis of the daily body weights of the rats just before dosing. The dose and interval of zoledronate used in this study were determined on the basis of previous reports, 13,17 which successfully induced renal damage in animals. After receiving the last dose of zoledronate in Z8 and C8 groups, rats from four experimental groups were placed in individual metabolic cages and fasted overnight, and urine samples were collected over a 24-h period. Following this 24-h period, all rats were anesthetized with inhaled isoflurane. The collected urine samples were divided two parts for a canonical marker (creatinine) and metabolites assay and frozen at −80 °C until analysis. Blood samples were collected from the arteria femoralis and centrifuged at 850 × g for 10 min. The serum obtained was frozen at −20°C until the biochemical analysis was performed. Kidney tissues were excised and weighed immediately. A small portion of the left kidney was fixed in 10% neutral-buffered formalin for histopathological use, and the right kidney was frozen in liquid nitrogen and stored at −80°C.
Urinalysis and serum biochemical parameters
Serum biochemical parameters including blood urea nitrogen (BUN) and creatinine were analyzed using an automated Hitachi Analyzer (7020 Clinical Analyzer; Hitachi, Tokyo, Japan). Urinary creatinine was determined using a urine chemistry analyzer (TBA-200FR NEO, Toshiba, Tokyo, Japan).
Hematoxylin and eosin staining
For hematoxylin and eosin (H&E) staining, tissue samples of kidney were dissected and fixed in a 10% neutral formalin solution, dehydrated in serial alcohol solutions, and embedded in paraffin. All tissues were cut to a 5–μm-thick sections and stained with H&E. All slides were viewed with an optical microscope (Olympus Optical, Tokyo, Japan)
Immunohistochemical staining
For immunohistochemical (IHC) staining, kidney tissue sections (5 μm) were deparaffinized in xylene, using graded ethanol, and rinsed with distilled water. For antigen retrieval, the sections were incubated with citrate buffer solution (pH = 6.0, 100°C) for 15 min. After blocking using 0.3% hydrogen peroxide in methanol for 30 min, the sections were incubated overnight at 4°C with primary antibody cleaved-caspase 3 (Asp175, Cell Signaling, Danvers, Massachusetts, USA). The secondary antibody was added, and the sections were incubated at 37°C for 1 h. Image analysis was using an optical microscope (Olympus Optical).
Urinary metabolites analysis
After adding the internal standard (1 μg/mL), the urine samples were then vortexed and centrifuged at 14,000 × g for 5 min at 4°C to remove solid materials and 1 ml aliquot of the supernatant was stored for subsequent LC-MS/MS analysis.
For LC-MS/MS analysis, the UPLC system was coupled to a QExactive plus orbitrap mass spectrometer (Thermo Fisher, Carlsbad, California, USA) equipped with a heated electrospray ionization (H-ESI) probe. Urine samples were separated by an ACQUITY UPLC BEH Amide column (2.1 × 100 mm2, 1.7 μm, Waters, Shanghai, China). Each sample was loaded to a normal phase chromatography column, and the sample was then eluted to the orbitrap mass spectrometer with the mobile phase as follows: mobile phase A was 0.1% formic acid in water; mobile phase B was 0.1% formic acid in acetonitrile; gradient program was (time, % B, flow rate) 1 min, 0%, 200 μl/min; 6 min, 25%, 200 μl/min, 13 min, 90%, 200 μl/min; 15 min, 90%, 200 μl/min; 20 min, and 0%, 200 μl/min. Column temperature was 25°C; injection volume was 1 μl, and the autosampler temperature was 4°C. An ESI procedure was performed in both positive and negative ionization mode. The detailed mass spectrometer parameters are as follows: spray voltage, 3.5 kV for positive and 2.5=kV for negative; capillary temperature, 275°C for positive and 320°C for negative; sheath gas flow rate (arb), 35; aux gas flow rate (arb), 8; mass range (m/z), 70–1200 for positive and 80–1200 for negative; full MS resolution, 70,000; MS/MS resolution, 17,500; topN, 10; NCE, 30; duty cycle, 1.2 s. Crude metabolite identification was based on a Tracefinder search with a home-built database, with an MS1 mass error of <10 ppm and MS2 mass error of <15 ppm. Subsequently, the metabolites with isotopic pattern = NONE were excluded. The relative quantification for each metabolite was measured by target compound intensities versus internal standard intensities. Each experimental urine sample was pooled to generate quality control (QC) urine samples, which were prepared by the same method. The QC sample was used to provide a representative sample containing all metabolites encountered during the analysis, which were used to validate the method.
ROS and histamine measurement
The HK-2 cells were treated with zoledronate (0, 1, 10, 50 µM) for 48 h. Reactive oxygen species (ROS) and histamine contents were determined by a MitoSOX™ red mitochondrial superoxide indicator (Thermo Fisher) and a commercial enzyme-linked immuno sorbent assay (ELISA) kit (Elabscience, Wuhan, China), respectively. For ROS determination, cells were discarded medium and washed with Hank's balanced salt solution with calcium and magnesium (HBSS, Thermo Fisher), the MitoSOX (5 μM) prepared in HBSS was added in the cells and incubated for 10 min at 37°C. Stained cells were analyzed immediately using a fluorescent microscope (Olympus Optical). For histamine determination, cell supernatant samples were processed according to the manufacturer’s protocol.
Data analysis
Data-dependent MS/MS acquisition (DDA) data were analyzed using TraceFinder (Thermo Fisher). For urinary metabolites analysis, two levels of identification were performed simultaneously using TraceFinder. Metabolites were first potentially assigned according to endogenous MS database by accurate masses. At the same time, those that can match with the spectra in fragment database were confirmed in MS/MS level. About 10 ppm and 15 ppm mass tolerance was applied for precursor and fragment matching, 0.25 min retention time shift was allowed for quantitation.
The acquired data were analyzed by principle components analysis (PCA) using the SIMCAP. 13.0 software package (Umetris AB; Umea, Sweden); Additionally, a partial least squares–discriminant analysis (PLS-DA) was also conducted using SIMCAP 13.0 to determine separate influential variables between the treatment and the control groups based on their variable importance in projection (VIP). Metabolic databases including human metabolome database (HMDB), METLIN, and the Kyoto Encyclopedia of Genes and Genomes (KEGG) were used to identify metabolites that could be potential markers. Pathway analysis was finished using Metaboanalyst (www.metaboanalyst.ca).
Statistical analysis
Statistical analysis was performed with SPSS 17.0 software (SPSS, Inc., Chicago, Illinois, USA). Student’s t-test was used to compare the differences between two groups. Data that performed with significant differences among three or more groups were determined by one-way analysis of variance with Duncan’s multiple range test. Analyses were performed utilizing GraphPad Prism 6.0 (GraphPad Software Inc., La Jolla, California, USA). A p value of <0.05 was considered to indicate statistical significance.
Results
Changes in biochemical parameters
The biochemical parameters of the serum samples are summarized in Table 1. Compared with each control group (C1 and C8), only the repeated administration of zoledronate (Z8) resulted in significant increases in serum blood urea nitrogen (BUN) and serum creatinine (Scr) levels after 24 weeks of injections. The single injection of zoledronate (Z1) did not induce any changes in BUN and Scr. Moreover, there was a significant reduction in the creatinine clearance of the Z8 group compared with the C8 group after 24 weeks, but this value of creatinine clearance was similar between C1 group and Z1 group. Besides, there were no significant changes in urine volume and urinary creatinine among C1, C8, Z1, and Z8 groups.
Biochemical parameters of serum and urine from the control and zoledronate treatment groups.a

aAll values are indicated as mean ± SD.
b p < 0.05: values marked with asterisks represent significant differences as compared with each control group.
BUN: blood urea nitrogen; Z1: zoledronate; Scr: serum creatinine
Histopathological evaluations
Light microscopy revealed that the single injection of zoledronate (Z1) had a very limited effect on the histology of the kidneys (Figure 1(c)). Kidneys in the control also showed normal glomeruli, proximal tubular cells, and vessels (Figure 1(a) and (b)). By contrast, kidney sections from repeated injection of zoledronate-treated rats (Z8) indicated major sites of zoledronate-induced nephrotoxicity in the renal tubules, which included tubuloepithelial degradation, tubule vacuolization, hyaline cast, and early necrosis (Figure 1(d)). IHC staining revealed that repeated injection of zoledronate (Z8)-induced higher expression of cleaved-caspase 3 compared to other experimental groups (C1, C8, and Z1), which indicates a higher magnitude of apoptosis (Figure 1(h)); however, a single injection of zoledronate (Z1) exhibited lower expression of cleaved-caspase 3 (Figure 1(g)), the same as that in the other two control groups (Figure 1(e) and (f)).

Kidneys were stained with H&E (a–d) and stained by cleaved-caspase 3 antibody (e–h). Kidney samples from the (a, e) saline group, single treatment (C1); (b, f) saline group, repeated treatment (C8); (c, g) zoledronate treatment group (Z1, 3mg/kg, i.v. single treatment); (d, h) zoledronate treatment group (Z8, 3mg/kg, i.v. 3 weeks/time, 24 weeks). The kidney sections were obtained from the rats after an overnight fast 24 h after the last treatment dose. i.v.: intravenous injection; H&E: hematoxylin and eosin.
Multivariate analysis of the MS data
The urine samples of the single dose and repeated dose of zoledronate treatment were assessed with a LC-MS/MS analysis in both positive and negative ionization modes to allow for wide detection coverage. First of all, the PCA was conducted on mean-centered, no-scale data from the urine samples. Raw data were normalized to the internal standard intensity in urine samples. From the PCA method, the outputs were exported and displayed with a score plot (Figure 2(a) and (b)). The score plot could visualize the classification of data and determine whether any treatment group induced disturbance in the metabolite concentration of the urine samples exists. Additionally, observations situated outside the ellipse were considered to be outliers. It can be seen that Z8 group is separate from control groups (C1 and C8) and Z1 group with a significant outlier in both positive and negative ionization mode. However, there is a partial overlap between the Z1 group and control groups (C1 and C8), and the data points for both of the two control groups are not distinguishable (Figure 2(a) and (b)). These results indicate there is a good distinction between repeated treatment of zoledronate and other groups.

Score scatter plots of the PCA for the urine samples collected from the control group, single treatment (C1); control group, repeated treatment (C8); zoledronate treatment group (Z1, 3 mg/kg, i.v. single treatment); zoledronate treatment group (Z8, 3 mg/kg, i.v. 3 weeks/time, 24 weeks). (a) Positive model of electrospray ionization [ESI]+ data; (b) negative model of ESI− data. i.v. = intravenous injection. R2X represents the cumulative SSs of all the Xs explained by all extracted components. Q2 is an estimate of how well the model predicts the Ys. PCA: principal component analysis; ESI: electrospray ionization; SSs: sum of squares; i.v.: intravenous.
Second, the supervised PLS-DA method was then applied to examine the metabolic changes in the treatment and control groups to characterize their metabolite profiles after removing outliers based on the PCA analysis. The PLS-DA score plot and loading plot for both positive and negative ionization modes are shown in Figure 3. Similarly, it is clear that the data points of the Z8 group in the PLS-DA score plots are separate from one another in the positive and negative ionization modes (Figure 3(a) and (b)). Although a slight overlap can be observed between control and Z1 groups (Figure 3(a) and (b)), the data points for these three experimental groups are clearly distinguishable from each other. For the PLS-DA loading plots (Figure 4), VIP values were applied to determine whether specific metabolites exhibited significant changes in different treatments. The variables with VIP values that were higher than 1.0 and the metabolites that were dominant in the loading plots were selected as potential biomarkers. These selected markers were then identified again by comparing their retention times, MS/MSn, with metabolic databases including HMDB, METLIN, and KEGG or reports or authentic reference standards.

Score scatter plots of the PLS-DA for the urine samples collected from the control group, single treatment (C1); control group, repeated treatment (C8); zoledronate treatment group (Z1, 3mg/kg, i.v. single treatment); zoledronate treatment group (Z8, 3mg/kg, i.v. 3 weeks/time, 24 weeks). (a) Positive model of ESI+ data; (b) negative model of ESI− data. i.v.: intravenous injection. R2X (cum) represents the percent of variation of the training set explained by the model. Q2 (cum) represents the percent of variation of the training set predicted by the model according to cross validation. R2X and R2Y represent the cumulative SSs) of all the Xs and Ys explained by all extracted components. Q2Y is an estimate of how well the model predicts the Ys. PLS-DA: partial least-squares–discriminant analysis; ESI: electrospray ionization; SSs: sum of squares; i.v.: intravenous.

Loading plots of the PLS-DA for the urine samples collected from the control group, single treatment (C1); control group, repeated treatment (C8); zoledronate treatment group (Z1, 3mg/kg, i.v. single treatment); zoledronate treatment group (Z8, 3mg/kg, i.v. 3 weeks/time, 24 weeks). Loading plots display the correlation structure of the variables. That is, they show the importance of the x-variables in the approximation of the X matrix. (a) Positive model of ESI+ data; (b) negative model of ESI− data. i.v.: intravenous injection. PLS-DA: partial least-squares–discriminant analysis; ESI: electrospray ionization; SSs: sum of squares.
Identification of potential biomarkers
After multivariate analysis of the MS data, 35 metabolites selected from loading plots were analyzed using Metaboanalyst (www.metaboanalyst.ca) to execute a pathway analysis, and the impact-value threshold was set to 0.10. Any pathway that scored above this threshold was categorized as a potential target pathway affected in zoledronate-induced nephrotoxicity (Figure 5). Finally, these metabolites were identified and are presented in Table 2, among which 19 metabolites were selected and marked in bold based on the statistical analysis.

Pathway analysis of metabolites using Metaboanalyst (www.metaboanalyst.ca), which gives information about the biological role of metabolites (Table 2, pathway) and yields a possible mechanism of zoledronate-induced nephrotoxicity. The impact–value threshold was set to 0.10. Any pathway that scored above this threshold was categorized as a potential target pathway affected in zoledronate-induced nephrotoxicity.
Identification of potential urinary biomarkers in zoledronate-induced nephrotoxicity after single or repeated treatment of zoledronate.a
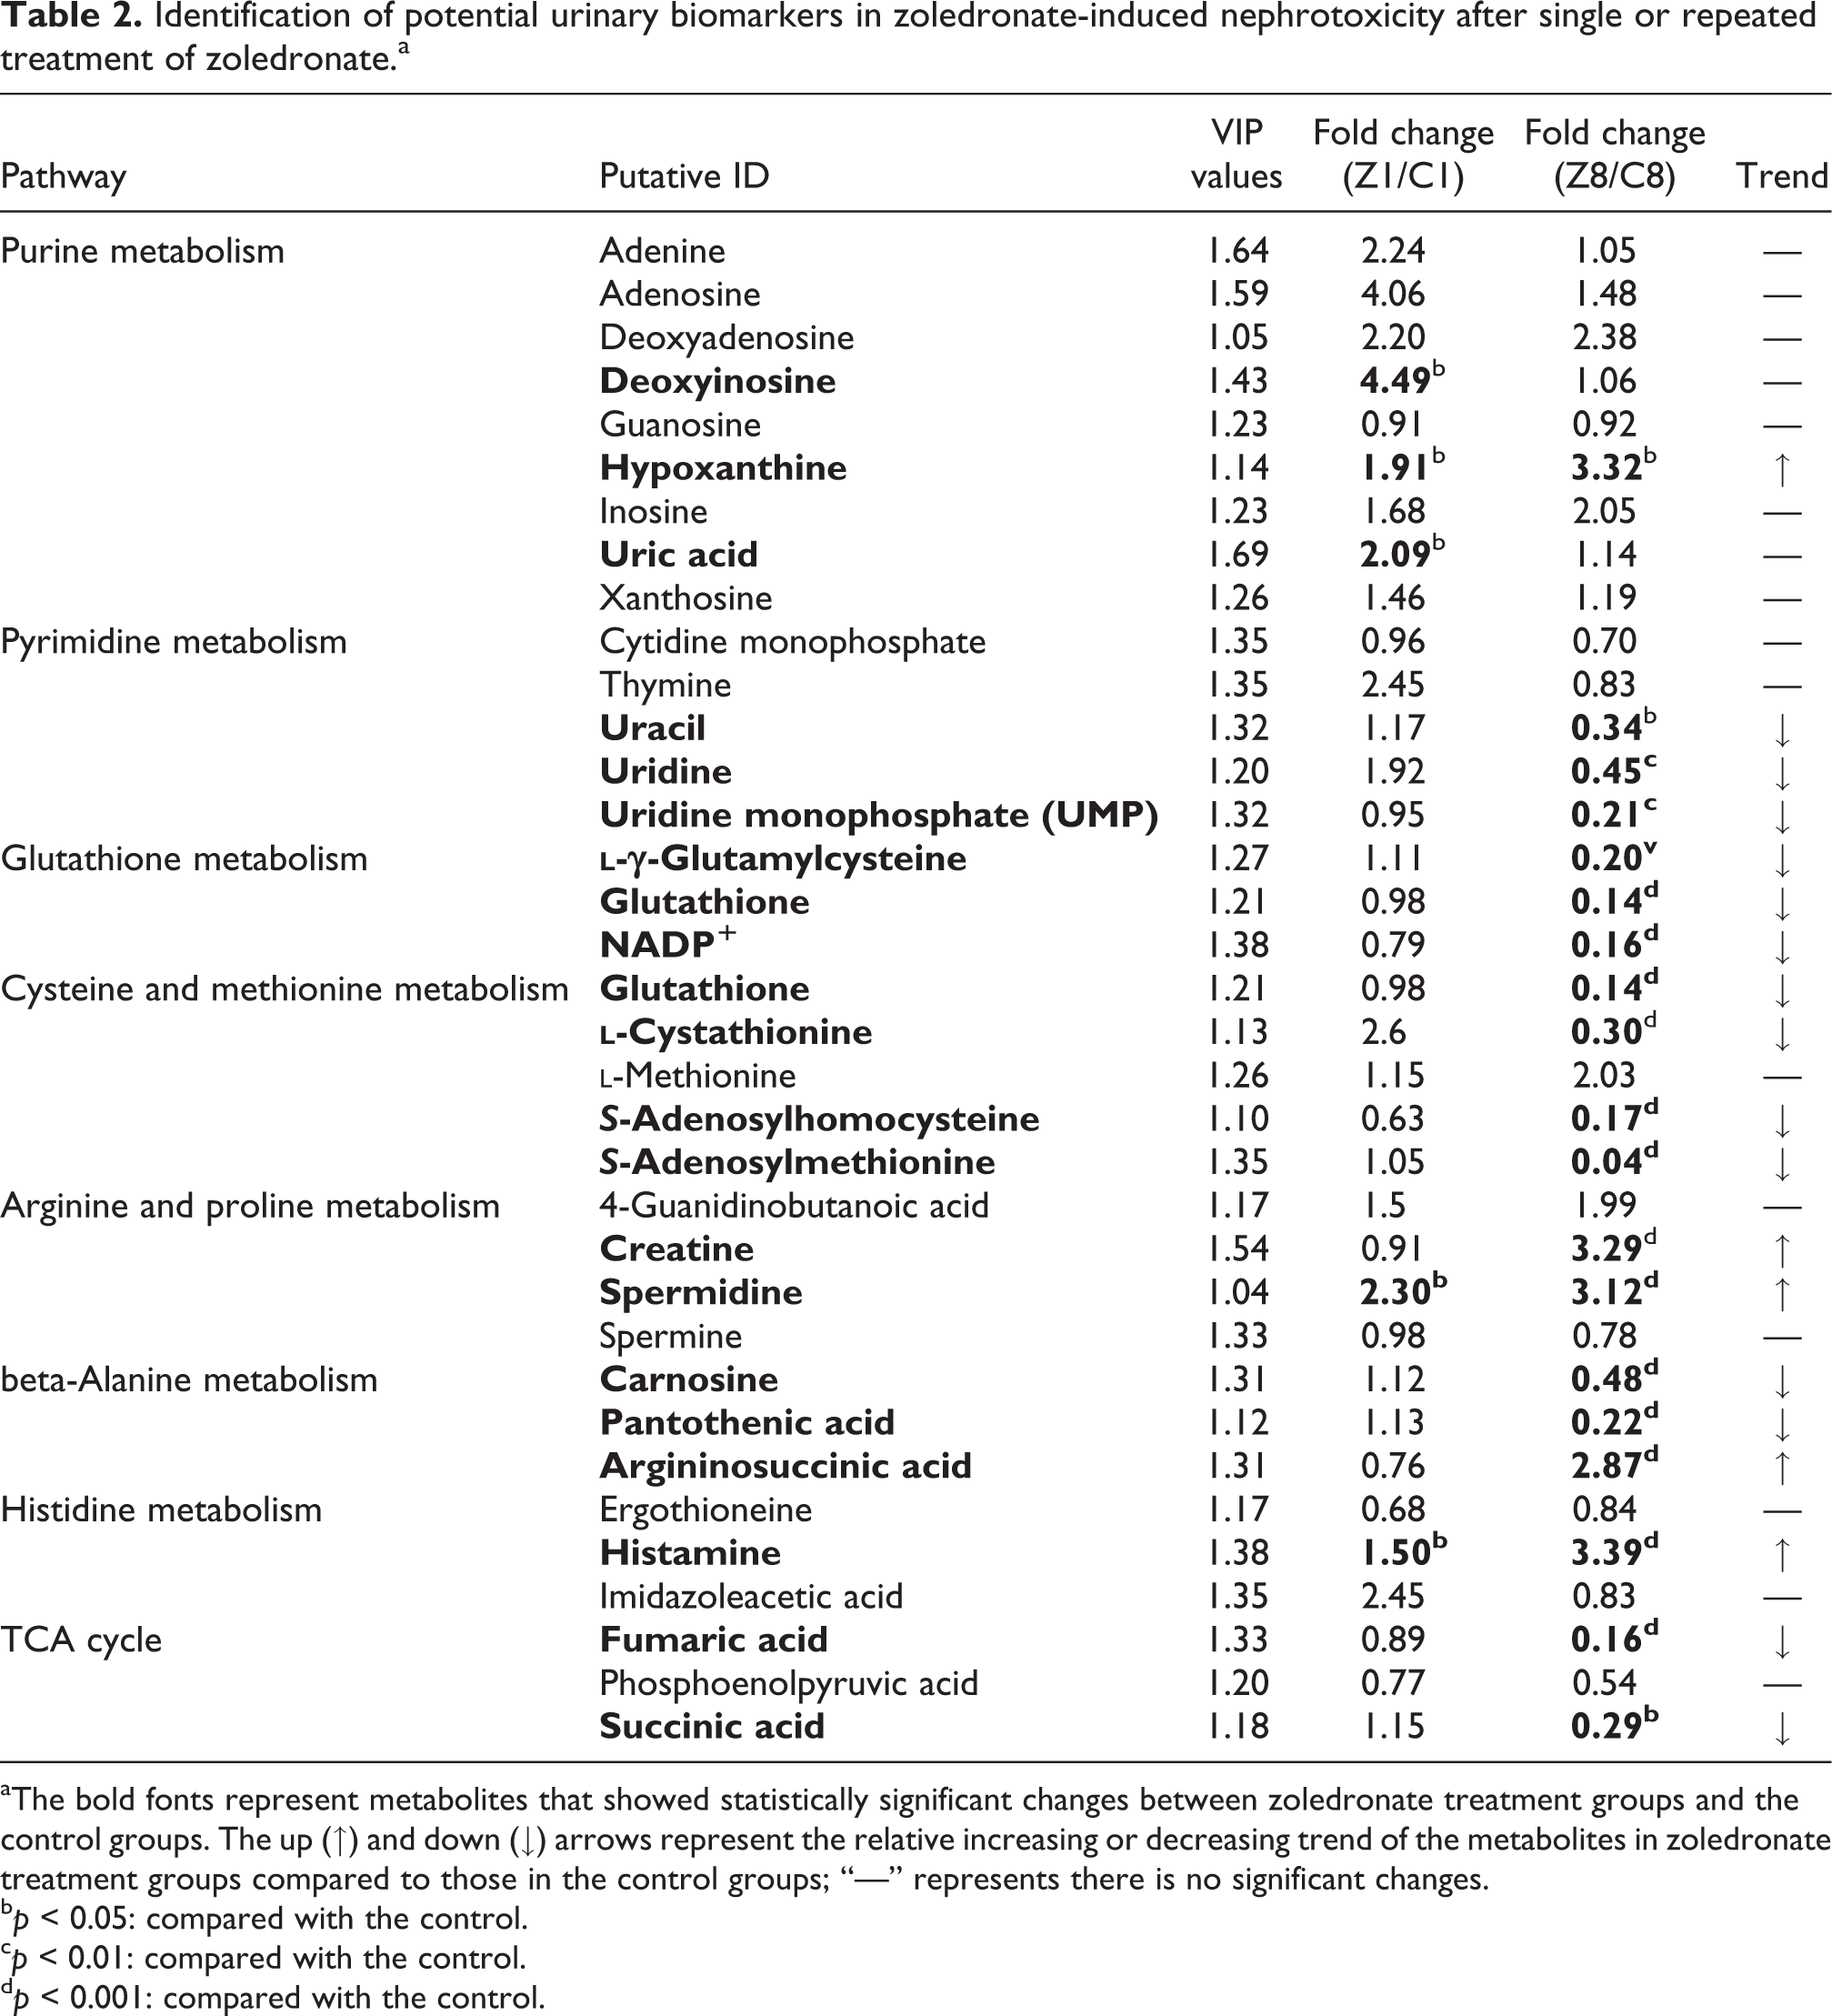
aThe bold fonts represent metabolites that showed statistically significant changes between zoledronate treatment groups and the control groups. The up (↑) and down (↓) arrows represent the relative increasing or decreasing trend of the metabolites in zoledronate treatment groups compared to those in the control groups; “—” represents there is no significant changes.
b p < 0.05: compared with the control.
c p < 0.01: compared with the control.
d p < 0.001: compared with the control.
These results showed that repeated treatment with zoledronate caused statistically significant decreases in the levels of urinary metabolites including pyrimidine derivatives such as uracil, uridine and uridine monophosphate (UMP) related to pyrimidine metabolism, and amino acid derivatives such as S-adenosylmethionine (SAM), S-adenosylhomocysteine (SAH),
The effect of zoledronate on ROS production and histamine release in HK-2 cells
It is well-known that ROS overproduction is a contributing and causative factor for the development of oxidative damage and inflammation. Thus, the effect of zoledronate on ROS and histamine production in HK-2 cells was determined to verify whether lower levels of intermediates related to the TCA cycle and glutathione biosynthesis are the consequence of ROS overproduction, and higher levels of histamine are the consequence of histamine overproduction. The doses chosen were based on our previous report. 10 As shown in Figure 6(a) and (b), zoledronate induced ROS (superoxide) production and histamine release in a dose-dependent manner. These results suggested the lower levels of the TCA cycle and glutathione biosynthesis were induced by zoledronate, thereby causing oxidative stress and allergic reactions in kidney cells, which further increased the level of urinary histamine.

Zoledronate-induced ROS production and histamine release in HK-2 cells. (a) ROS production in HK-2 cells under various concentrations of zoledronate treatments at 48 h. (b) Histamine release in HK-2 cells under various concentrations of zoledronate treatments at 48 h. Data are presented as mean ± SD (n = 6) and *p < 0.05, **p < 0.01, and ***p < 0.001 compared with the control, respectively.
Discussion
Previous studies have shown that a portion of unbounded zoledronate was endocytotic uptake and was excreted unmetabolized by the kidney, and the intracellular zoledronate level was found to be dose-dependent without saturation. 18 Thus, the kidney may be easily exposed to extraordinary levels of zoledronate and this type of exposure can lead to renal cell damage. Conventional markers, such as serum BUN and Scr, are useful markers frequently used in clinical diagnosis to evaluate kidney function. However, these markers are easily affected by extrarenal factors and vary markedly in a wide range due to various statuses of protein intake, endogenous protein catabolism, hepatic urea synthesis, and muscle mass or food uptake. Furthermore, BUN and Scr levels are only responsible for substantial renal injury, which is generally defined as the loss of two thirds of functional capacity. Therefore, much more sensitive markers, including proteins and small molecule metabolites, have been developed in recent years. 19 –21
As far as we know, the metabolomic changes in urine samples induced by zoledronate have never been reported before. In the present study, 19 metabolites were selected as potential markers in zoledronate-induced nephrotoxicity by a LC-MS/MS-based metabolomics approach. The most interesting markers among them are S-adenosylmethionine, S-adenosylhomocysteine,
Another significant finding is that urinary levels of pyrimidines and its intermediates such as uracil, uridine, and UMP were decreased markedly after repeated administration of zoledronate. It has been reported that some of the key catalyzing enzymes in purine and pyrimidine metabolism express only in the liver and kidney, 23 and there are some nephrotoxicants such as cisplatin 24 and aristolochic acid, 25 which impair pyrimidine metabolism. Therefore, the declined urinary levels of pyrimidines and its intermediates may reflect the inhibitory effect of zoledronate on pyrimidine biosynthesis in renal cells through inhibiting key enzymes, thereby causing cellular toxicity. Besides, treatment with zoledronate resulted in a significant elevation in urinary levels of deoxyinosine, uric acid, and hypoxanthine. Deoxyinosine is a nucleoside that is formed when hypoxanthine is attached to a deoxyribose ring. Deoxyinosine is found in DNA, while inosine is found in RNA. Adenosine deaminase (ADA) catalyzes the conversion of adenosine and deoxyadenosine to inosine and deoxyinosine, respectively. 26 It can be proposed that zoledronate could probably alter ADA in kidneys, which could be observed by urinary excretion of deoxyinosine. Uric acid is an end product of purine metabolism. It is produced by the enzyme xanthine oxidase from xanthine, which is created from hypoxanthine by xanthine oxidoreductase. 25 Given the fact that increased excretion of hypoxanthine is induced by zoledronate, our current results suggest that the increased excretion of urinary uric acid was due to the transformation of hypoxanthine into uric acid in the kidneys through the purine metabolic pathway. However, only hypoxanthine could be a potential “metabolic biomarker” for zoledronate-induced nephrotoxicity because only hypoxanthine showed increments in both single and repeated administrations.
Apart from the metabolites mentioned above, some urinary metabolites such as fumaric acid, succinic acid, creatine, phosphocreatine, 4-aminobutyric acid, and pantothenic acid were excreted less into urine after repeated zoledronate treatment. Succinic acid and fumaric acid are two key intermediates involved in the TCA cycle, the decreased levels of them may indicate an impaired TCA cycle in renal tubular cells. Drug-induced nephrotoxicity can result in increased urinary excretion of intermediates related to the TCA cycle. For example, the urinary concentrations of α-ketoglutaric acid, citric acid, and succinic acid decreased following tubular damage induced by colistin and doxorubicin, which both resulted from the altered TCA cycle in renal tubular cells. 27,28 Considering the increased oxidative stress induced by zoledronate in kidneys, the impaired TCA cycle might be another consequence of oxidative damage. However, metabolites related to the TCA cycle may be not appropriate biomarkers for zoledronate-induced nephrotoxicity for the same reason as for metabolites related to cysteine-mediated glutathione biosynthesis.
Furthermore, urinary levels of three amino acids derivatives including creatine, spermidine, and histamine exhibited significant elevations following treatment with zoledronate regardless of the treatment duration. Creatine is synthesized mainly in the liver and kidneys from arginine, glycine, and methionine and is responsible for a cell’s energy shuttle. Creatine and phosphocreatine exist in a reversible equilibrium, and phosphocreatine stores the energy related to excess ATP. The impaired TCA cycle induced by zoledronate indicated it is unlikely that there was excess ATP to be stored by phosphocreatine. In contrast, creatine is effectively reabsorbed via the Na+/Cl−/creatine transporter that is located on the apical membrane of the renal epithelia. 29 Thus, it is possible that the increased urinary creatine levels resulted from tubular damage, which would lead to reduced reabsorption of filtered creatine and increased excretion of urinary creatine. Spermidine is one of three kinds of polyamine that are required for the survival of the vast majority of living cells. Spermidine interacts with negatively charged molecules such as proteoglycan, glycated proteins, and nucleic acids. Spermidine also helps stabilize the nucleic acid helical structure. In our study, the reduced levels of pyrimidines may affect nucleic acid structures, which may cause a negative feedback of elevation in spermidine levels. Histamine is an organic nitrogenous compound involved in the inflammatory response. In this study, it was found that zoledronate induced a dose-dependent increment in histamine release, which suggests the elevation in urinary histamine levels was caused by inflammatory response. Nonetheless, the possibility must not be excluded that enhanced spermidine and histamine excretions may derive from the same mechanism of creatine, that is, the reduced reabsorption of filtered spermidine and histamine due to tubular damage.
In summary, the present study demonstrated that repeated exposure to zoledronate resulted in marked changes in the urinary metabolic profiles, which are involved in pyrimidine metabolism, glutathione metabolism, the TCA cycle and histamine metabolism. According to these pathways identified, Figure 7 summarizes the possible changes in zoledronate-treated kidney cells. Four potential metabolic biomarkers were selected including hypoxanthine, creatine, spermidine, and histamine. Nevertheless, further investigations are warranted to validate the relationship between the potential metabolic biomarkers and zoledronate-induced nephrotoxicity.

Summary of zoledronate-induced changes in urinary metabolites according to possible changes induced by zoledronate in renal tubular cells.
Footnotes
Declaration of Conflicting Interests
The author(s) declared no potential conflicts of interest with respect to the research, authorship, and/or publication of this article.
Funding
The author(s) disclosed receipt of the following financial support for the research, authorship, and/or publication of this article: This study was supported by the grant from the National Natural Science Foundation of China (81860692), the Foundations of Jiangxi Science & Technology Normal University (1020160937) and Jiangxi Provincial Key Laboratory of Drug Design and Evaluation (20171BCD40015).