
Abstract
In 2012, alcohol liver disease resulted in 3.3 million—5.9% of global deaths. This study introduced whey protection capacity against chronic alcohol-induced liver injury. Rats were orally administered to 12% ethanol solution in water (ad libitum, average 8.14 g of ethanol/kg body weight (b.w.)/day) alone or combined with whey (per os, 2 g/kg b.w./day). After 6-week treatment, chronic ethanol consumption induced significant histopathological liver changes: congestion, central vein dilation, hepatic portal vein branch dilation, Kupffer cells hyperplasia, fatty liver changes, and hepatocytes focal necrosis. Ethanol significantly increased liver catalase activity and glutathione reductase protein expression without significant effects on antioxidative enzymes: glutathione peroxidase (GPx), copper–zinc-containing superoxide dismutase (CuZnSOD) and manganese-containing superoxide dismutase (MnSOD). Co-treatment with whey significantly attenuated pathohistological changes induced by ethanol ingestion and increased GSH-Px and nuclear factor kappa B (NF-κB) protein expression. Our results showed positive effects of whey on liver chronically exposed to ethanol, which seem to be associated with NF-κB-GPx signaling.
Introduction
Alcohol beverages are, among others, the most loved and almost certainly the oldest and most consumed additive. Since ancient times, it has been used for relaxation, but unfortunately, the abuse of alcoholic beverages has been on the rise for years. Chronic alcohol abuse in time shows detrimental effects on the psychosocial and behavioral aspects of life, physical health, causing severe damage to various organ systems, particularly the liver. Alcohol is the main cause that leads to development of alcohol liver disease (ALD), and during the year 2010, more than a million deaths worldwide was linked to liver cirrhosis, and 47.9% of that number was caused by chronic alcohol use. 1
Alcohol has a well-known hepatotoxic effect that causes direct damage to the liver, including multiple morphological and functional malformations and the induction of the immune response, as well as damage caused by its metabolites; acetaldehyde and endotoxin from the gastrointestinal tract. 2 –6 Alcohol triggers the oxidative stress that leads to fibrosis, and cirrhosis as well as hepatocyte hypoxia due to increased oxygen consumption during metabolism causing inflammation and changes of the type of fatty liver. 7 Long-term alcohol consumption leads to ALD, where the very important roles in the onset of illness are long-term consumption and higher doses of alcohol. 1
There are some potent hepatoprotective drugs, but numerous hepatoprotective substances traditionally used in the diet of many nations often do not have a clearly justified therapeutic effect with defined dose and the method of administration. Whey became a popular dietary supplement, which, due to its biological ingredients, such as lactoferrin, beta-lactoglobulin, alpha-lactalbumin, glucomacropeptide, immunoglobulins, lactose, vitamins and minerals, has a number of properties that promote immunity. 8 More recent research suggests antihypertensive, antitumor, hypolipidemic, antiviral, antibacterial, regenerative, and potentially antioxidant properties of whey. 8 –14 Recent studies suggested that primary supposed mechanism of whey beneficial effects was an intracellular conversion of the concentration of the amino acid cysteine with glutathione. 15 There are data that have proved increased values of glutathione after whey treatment. 16 –18 Also, the hepatoprotective role of whey isolates is reflected in the suppression of the activity of alanine and aspartate aminotransferase and histopathological changes, such are, decrease in portal fibrosis and perivenal sclerosis. 19,20 Therefore, whey may be considered as a possible therapeutic tool in oxidative stress correlated diseases, such as ALD. 17 Our previous results showed that whey consumption prevented elevation of the atherosclerosis index, pointing to its protective role, probably through the redistribution of lipids. 21
Based on these presumptions, in the current study, we tested the hepatoprotective effect of chronic whey supplementation on the liver damage in adult male Wistar rats subjected to 6-week chronic alcohol consumption, utilized as a model of ALD. Particularly, we analyzed the potential cytoprotective and regenerative effect of chronic whey administration on pathohistological malformations in rat liver upon chronic ethanol ingestion, and whether these changes are followed with alterations in activation and expression of multiple antioxidant enzymes (AOE) coupled with the expression of proapoptotic p53 protein and oxidative sensitive transcription factor, nuclear factor kappa B (NF-κB).
Materials and methods
The study was conducted on male Wistar rats aged 9–11 weeks and weighing 200–220 g, which were raised in the Vivarium of the Center for Biomedical Testing, Institute for Research and Development Galenika a.d.
Animals were kept in standard cages, with three animals per cage, at a constant room temperature of 22 ± 1°C, with a circadian rhythm of 12-h day/12-h night, fed with standard food for laboratory animals produced in Veterinary Institute Zemun.
All animals were treated according to the principles 2010/63/EU of the European Parliament on the protection of animals used for scientific purposes. This study was approved by the Ministry of Agriculture and Environmental Protection—Veterinary Administration of the Republic of Serbia, decision number: 323-07-10690/2015-05, and by the Ethical Committee of Development, Regulatory Affairs and Quality Division, Galenika a.d., Belgrade, decision number: 4121/2015.
Experimental design
The study included 24 male Wistar rats that were divided into four groups: the control group, the alcohol group (12% ethanol ad libitum for 42 days), the whey group (2g/kg per day per os during 42 days), and the group that was treated in parallel with the same doses of alcohol and whey during the same period. The applied amount of alcohol was determined to give low concentrations in rat blood, bearing in mind their rapid metabolism and auto-induction of microsomal enzymes. Our previous work showed that the experimental procedure applied also in this work elevated ethanol concentration in the blood to the amount of 0.254 g/L that can be considered as moderate toxic. 21 We defined the period of time of 42 days as a chronic alcohol treatment (1–14 days—acute toxicity, 21–28—subacute toxicity and after 28 days—chronic toxicity). 22,23
The whey was administered with a rat gavage tube, every day during the experiment, once daily, always at 9 am, continuously for 6 weeks, as follows: cow whey powder product administration, dissolved in 0.5 g/mL of distilled water, (ingredients: carbohydrates—61 g/100 g, proteins—11 g/100 g and lipids—2 g/100 g) was ordered based on the average daily intake of whey from previous human studies 24 –26 (recommended doses—5–50 g of whey per day) and the dose is extrapolated from humans to rat, 27 –29 through the metabolic body size or food intake rather than body weight as a criterion (the dose amounted 0.4g/200 g of animal weight). Ethanol (12%) was administered (Ethanol absolute 99% “Merck”) diluted with distilled water, daily ad libitum for 6 weeks.
All animals were euthanized after 42 days of treatment, by intraperitoneal injection of ketamine (Ketamidor 10% 10 mL RighterFaraAG) at a single dose of 0.224 mg/kg b.w., (immediate death, which was confirmed by heart harvest).One portion of the liver was excised for pathohistological analysis. The rest of the liver was perfunded in situ with cold phosphate-buffered saline buffer, excised, frozen in liquid nitrogen and kept at −70°C for the determination of the activity of antioxidant enzymes and Western blot (WB) analysis. The weight of the liver was also measured.
Pathohistological examination
Part of the liver tissue dedicated for pathohistological examination was fixed in 4% neutral-buffered formalin solution for 3 weeks, dehydrated in increasing concentrations of ethanol and xylene and embedded in Histowax (Histolaboduct AB, Göteborg, Sweden). Each tissue block was sectioned at 5 µm thickness on a rotary microtome and stained with hematoxylin and eosin (H&E) 30 and were examined using a light microscope (Leica DM LS2, Germany). Original microphotographies were made by Canon Power Shot S70.
The degree of the histopathological changes (congestion, dilatation of central vein, dilatation of the hepatic portal vein branch, inflammation of the portal area, Kupffer cells hyperplasia, newly formed bile ducts, fatty liver changes and edema of the hepatocytes) in the liver of each animal were ranked in one of five groups: 0 = absence of change; 1 = discrete changes, 2 = moderate changes; 3 = pronounced changes; 4 = very pronounced.
Measurement of enzyme activities and total glutathione and thiobarbituric acid reactive substances concentrations
Thawed liver samples were homogenized and sonicated in 10 volumes (wt/vol.) of 0.25 M sucrose, 1 mM ethylenediaminetetraacetic acid, and 0.05 M Tris-HCl buffer (pH 7.4) before centrifugation for 90 min at 105,000 × g, 4°C. The supernatant was used to determine enzyme activities and total glutathione level.
Total superoxide dismutase (SOD) activity was determined by the adrenaline method. 31 One SOD unit was defined as the amount of the enzyme necessary to decrease the rate of adrenalin autoxidation by 50% at pH 10.2. For determination of SOD2 activity, the assay was performed after preincubation with 8 mM KCN. The SOD1 activity was calculated as the difference between the total SOD and SOD2 activities. CAT activity was determined by the monitoring of hydrogen peroxide (H2O2) consumption and expressed in U/mg protein. 32 The activity of GSH-Px was determined using t-butyl hydroperoxide as a substrate and expressed in mU/mg protein. 33 glutathione reductase (GR) activity was determined by NADPH oxidation concomitant with GSSG reduction and expressed in mU/mg protein. 34 Total glutathione S-transferases (GSTs) activity was measured using 1-chloro-2, 4-dinitrobenzene (CNDB) as a substrate and expressed in U/mg protein. 35 xanthine oxidase (XOD) activity was determined by the monitoring of uric acid production in the presence of xanthine as a substrate and expressed in mU/mg protein. 36 Total glutathione level was determined by an enzymatic recycling assay in the presence of 5,5′-dithiobis-(2-nitrobenzoic acid) (DTNB), GR, and nicotinamide adenine dinucleotide phosphate (NADPH) and expressed as nmol/mg protein. 37 For measurement of lipid peroxidation (LPO) products, thawed liver samples were homogenized and sonicated in 10 volumes (wt/vol.) of Tris buffer pH 7.4 without sucrose, before centrifugation for 10 min at 10,000 × g, 4°C. The degree of LPO was assessed by estimating the level of thiobarbituric acid reactive substances (TBARS) in supernatant and expressed in nmol/mg protein. 38 Protein concentration was measured by the method of Lowry et al. 39
Measurements of absorbance were performed using a SAFAS UVmc2 spectrophotometer (SAFAS, Monaco) for SOD; Shimadzu UV-160 spectrophotometer (Shimadzu Scientific Instruments, Shimadzu Corporation, Kyoto, Japan) for CAT, GST, and XOD; Thermo Scientific Evolution 300 UV-Vis Spectrophotometer (Thermo Fisher Scientific, Waltham, Massachusetts, USA) for GSH-Px and GR; Thermo Scientific Multiskan Spectrum microplate spectrophotometer (Thermo Fisher Scientific Oy, Vanata, Finland) for total glutathione, TBARS, and protein concentration.
Preparation of whole cell extracts and Western blotting
After a swift thawing, tissue were weighed and homogenized at 4°C by 20 strokes of a Potter-Elvehjem homogenizer (1:4 = tissue mass: vol) in 20 mM HEPES pH 7.4 buffer (containing 1 mM Na2-EDTA, 10% glycerol, 150 mM NaCl, 20 mM Na2MoO4, 0.15 mM spermidine, 0.1 mM PMSF, 5 μg/ml antipain, 5 μg/ml leupeptin, 5 μg/ml aprotinin and phospatase inhibitors: 20 mM β-glycerophosphate, 5 mM Na4P2O7 × 10H2O, 2 mM Na3VO4, 25 mMNaF and 0.5% Triton X-100). Homogenates were then incubated on ice for 2 h (with frequent vortexing) in the same buffer and centrifuged at 12,000 r/min for 30 min at 4°C to obtain supernatant that was used as a whole cell liver extract. 40
Protein concentration in samples was analyzed by the method of Markwell et al. 41 The samples were mixed with denaturing buffer according to Laemmli et al., 42 boiled for 5 min at 100°C, and equal amounts of proteins (60 μg) were separated by electrophoresis on 7.5% sodium dodecyl sulfate–polyacrylamide gel (SDS-PAGE). Proteins were then transferred onto PVDF membrane (Immobilon-P membrane, Millipore) using a blot system (Transblot, BioRad). Membranes were incubated with respective primary and secondary antibodies, and signal was developed using enhanced chemiluminescence reagent (ECL, Pierce). Following primary antibodies were used: anti-CuZnSOD (SOD1) (Stressgen), anti-MnSOD (SOD2) (Stressgen), anti-catalase (Calbiochem), anti-glutathione peroxidase (GPx) (Santa Cruz Biotechnology), anti-glutathione reductase (GR) (Santa Cruz Biotechnology), anti-NF-κB (Santa Cruz Biotechnology), and anti-p53 (Santa Cruz Biotechnology), while rabbit polyclonal anti-β-actin (ab8227, Abcam) antibody was used to detect actin as a loading control. Densitometry of protein bands on X-ray film was performed by Image J analysis PC software.
Statistical analysis
Statistical data processing examined the significance of differences between the values of the parameters obtained in different groups using: Pearson’s χ2 test, two-way ANOVA, and post hoc tests (Tukey’s test), according to the protocols described by Hinkle et al. 43 The level of statistical significance for all tests was p < 0.05. Statistical analyses of WB were performed on logarithmically transformed data using two-way ANOVA with whey and ethanol as independent factors. Significant differences were given as p < 0.05 and presented as mean ± SEM.
Results
The average hepato-somatic index was approximately 4%, and there was no significant difference between experimental groups.
Pathohistological analysis
Results of pathohistological analyses are presented in Table 1 as well as original representative photomicrographs for control (Figure 1) and all the treated groups (Figures 2 to 4). Pathohistological analyses showed that there is a highly significant difference in the degree of focal necrosis of hepatocytes between the group of ethanol-treated animals (Figure 3) compared with the group of animals treated with ethanol and whey (Figure 4; χ2 = 21.489; p < 0.011): focal necrosis was absent in 83.3% of the animals from the group treated with ethanol and whey, whereas in the ethanol group, all animals had a focal necrosis of a different degree.
Histopathological changes in rat liver after 6-week treatment with whey, ethanol, and their combination.a
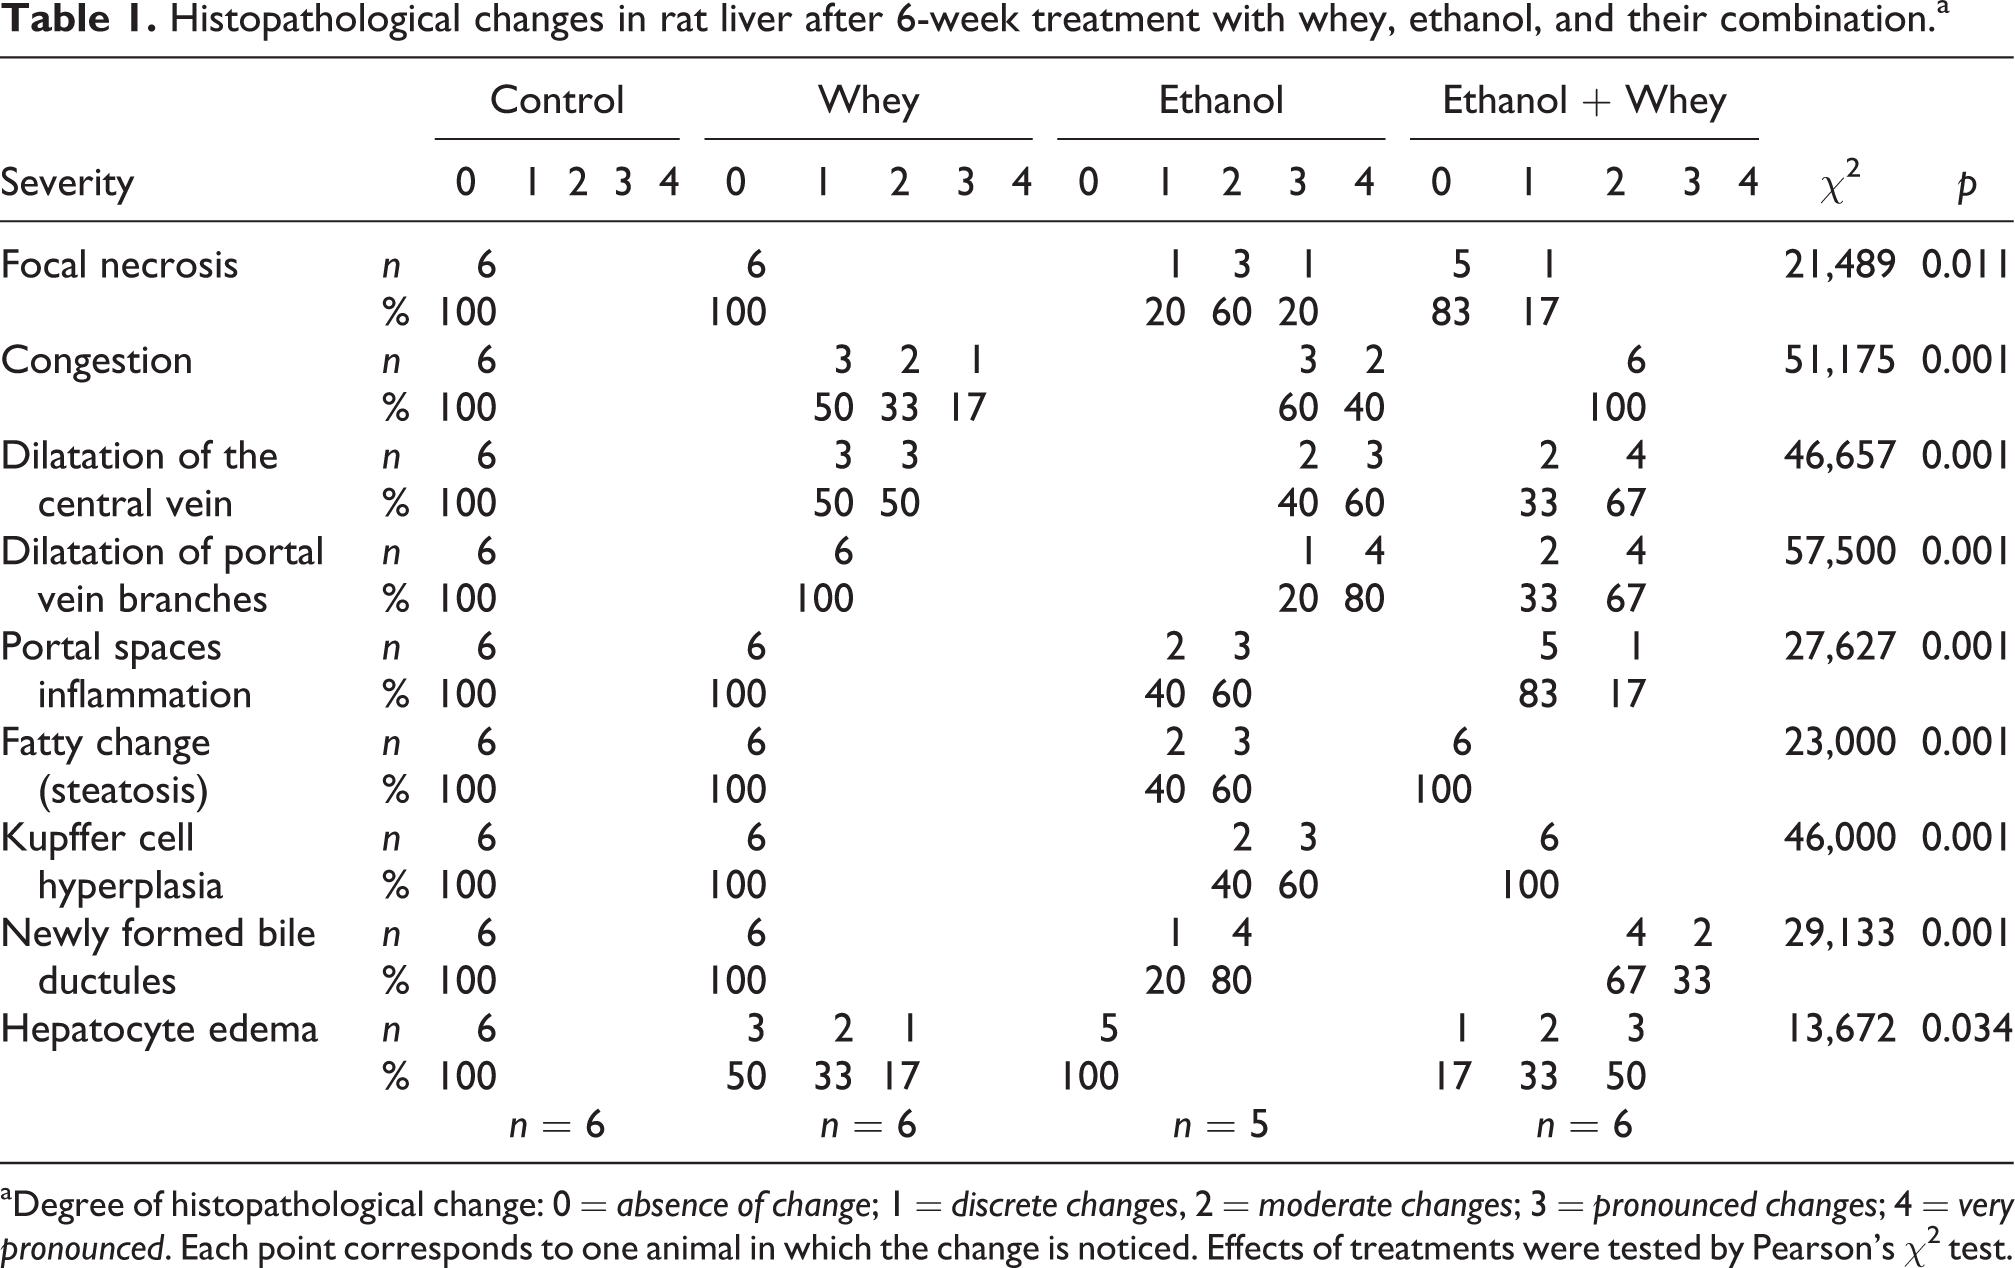
aDegree of histopathological change: 0 = absence of change; 1 = discrete changes, 2 = moderate changes; 3 = pronounced changes; 4 = very pronounced. Each point corresponds to one animal in which the change is noticed. Effects of treatments were tested by Pearson’s χ2 test.
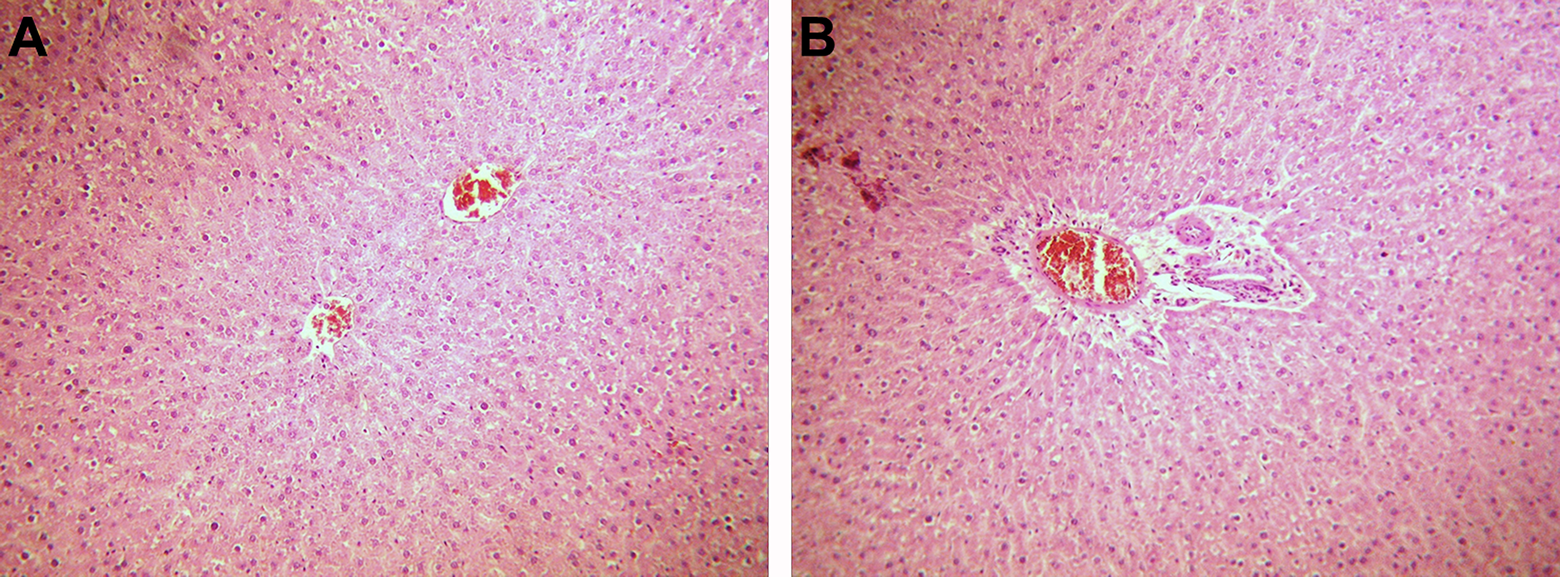
Photomicrographs of rat liver structure from control group, H&E stain. The normal structure of the liver with hexagonal shaped lobules: (a) with a central vein in the middle and trabecular arrangement of hepatocytes and (b) portal triads; (a and b ×100). H&E: hematoxylin and eosin.

Photomicrographs of rat liver structure from the whey-treated group, H&E stain. (a). Moderate dilatation of central vein with discrete congestion and discrete edema of hepatocytes (marked by arrow); (b) pronounced congestion of portal vein branch and moderate edema of hepatocytes (marked by arrow); (c) pronounced congestion of portal vein branch; (d) moderate edema of hepatocytes (marked by arrow); (a and b ×100; C and D ×200). H&E: hematoxylin and eosin.
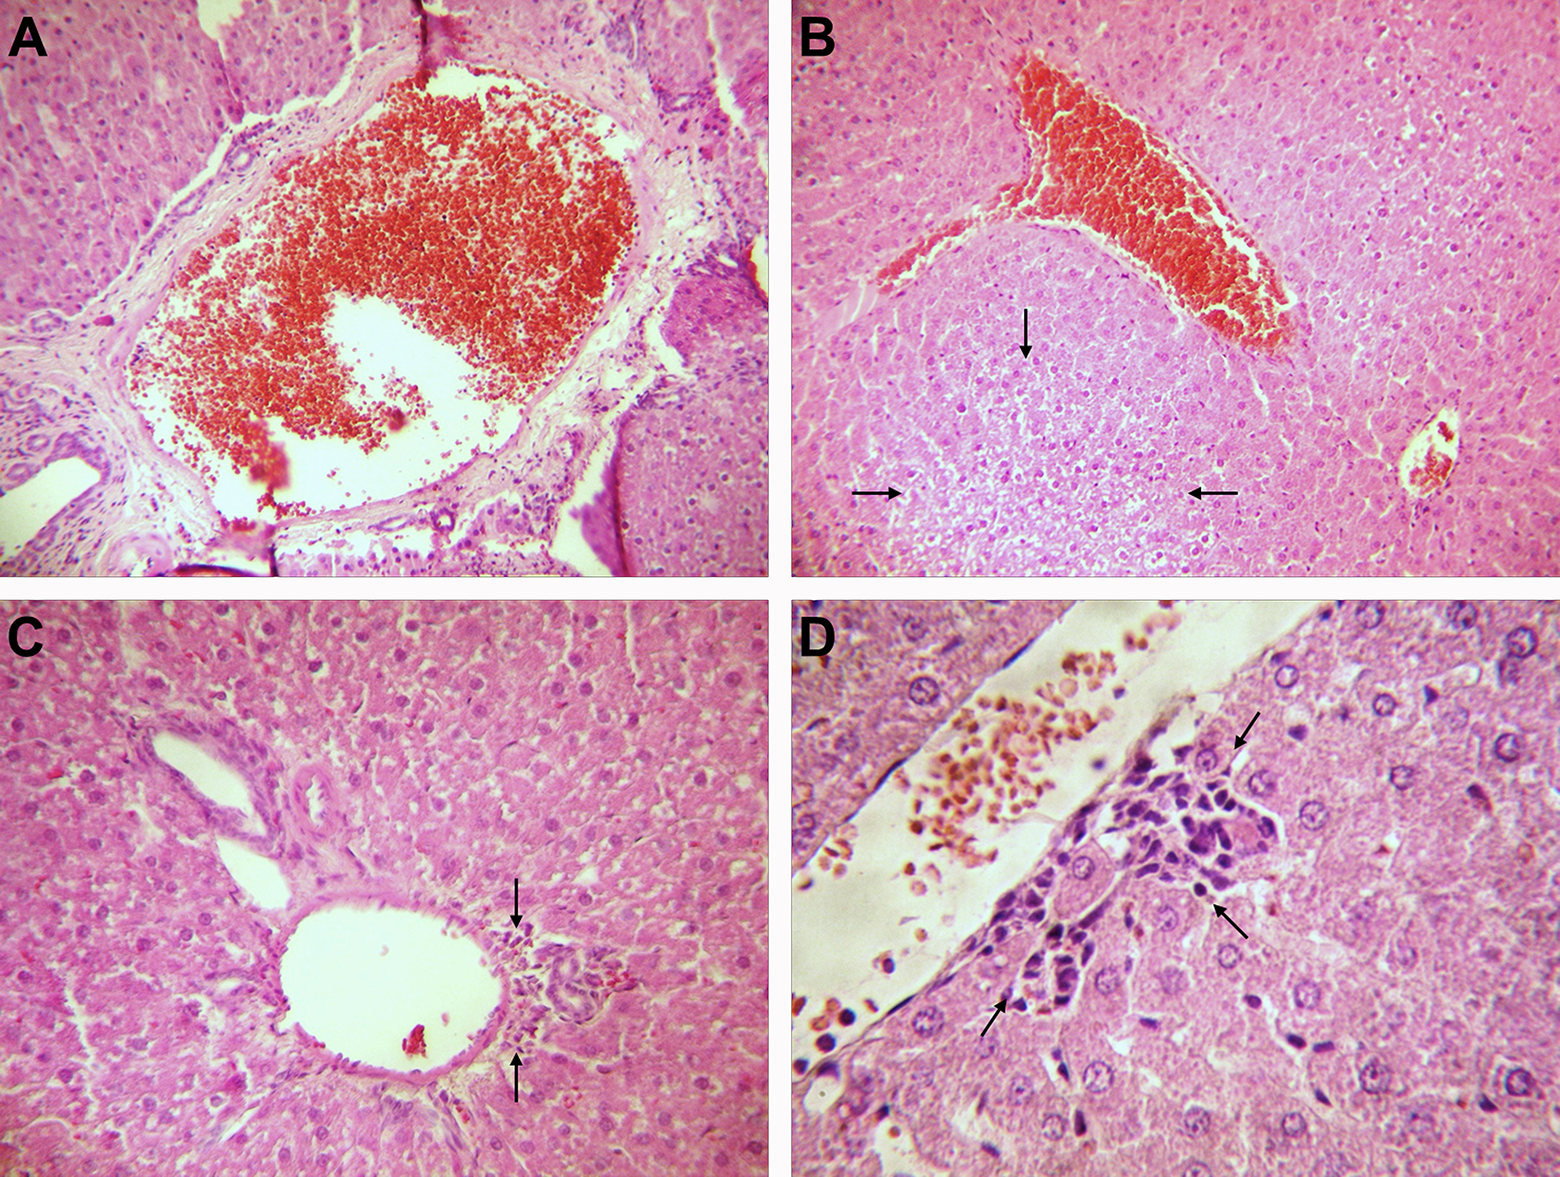
Photomicrographs of rat liver structure from ethanol-treated group, H&E stain. (a) Very pronounced dilatation of the portal vein branch and pronounced congestion; (b) moderate fatty changes (marked by arrows) and very pronounced congestion; (c) moderate lymphocytes and plasma cells infiltration of portal triad (marked by arrows); (d) focal necrosis of hepatocytes with neutrophil infiltration (marked by arrows); (a and b ×100; c ×200; d ×400). H&E: hematoxylin and eosin.
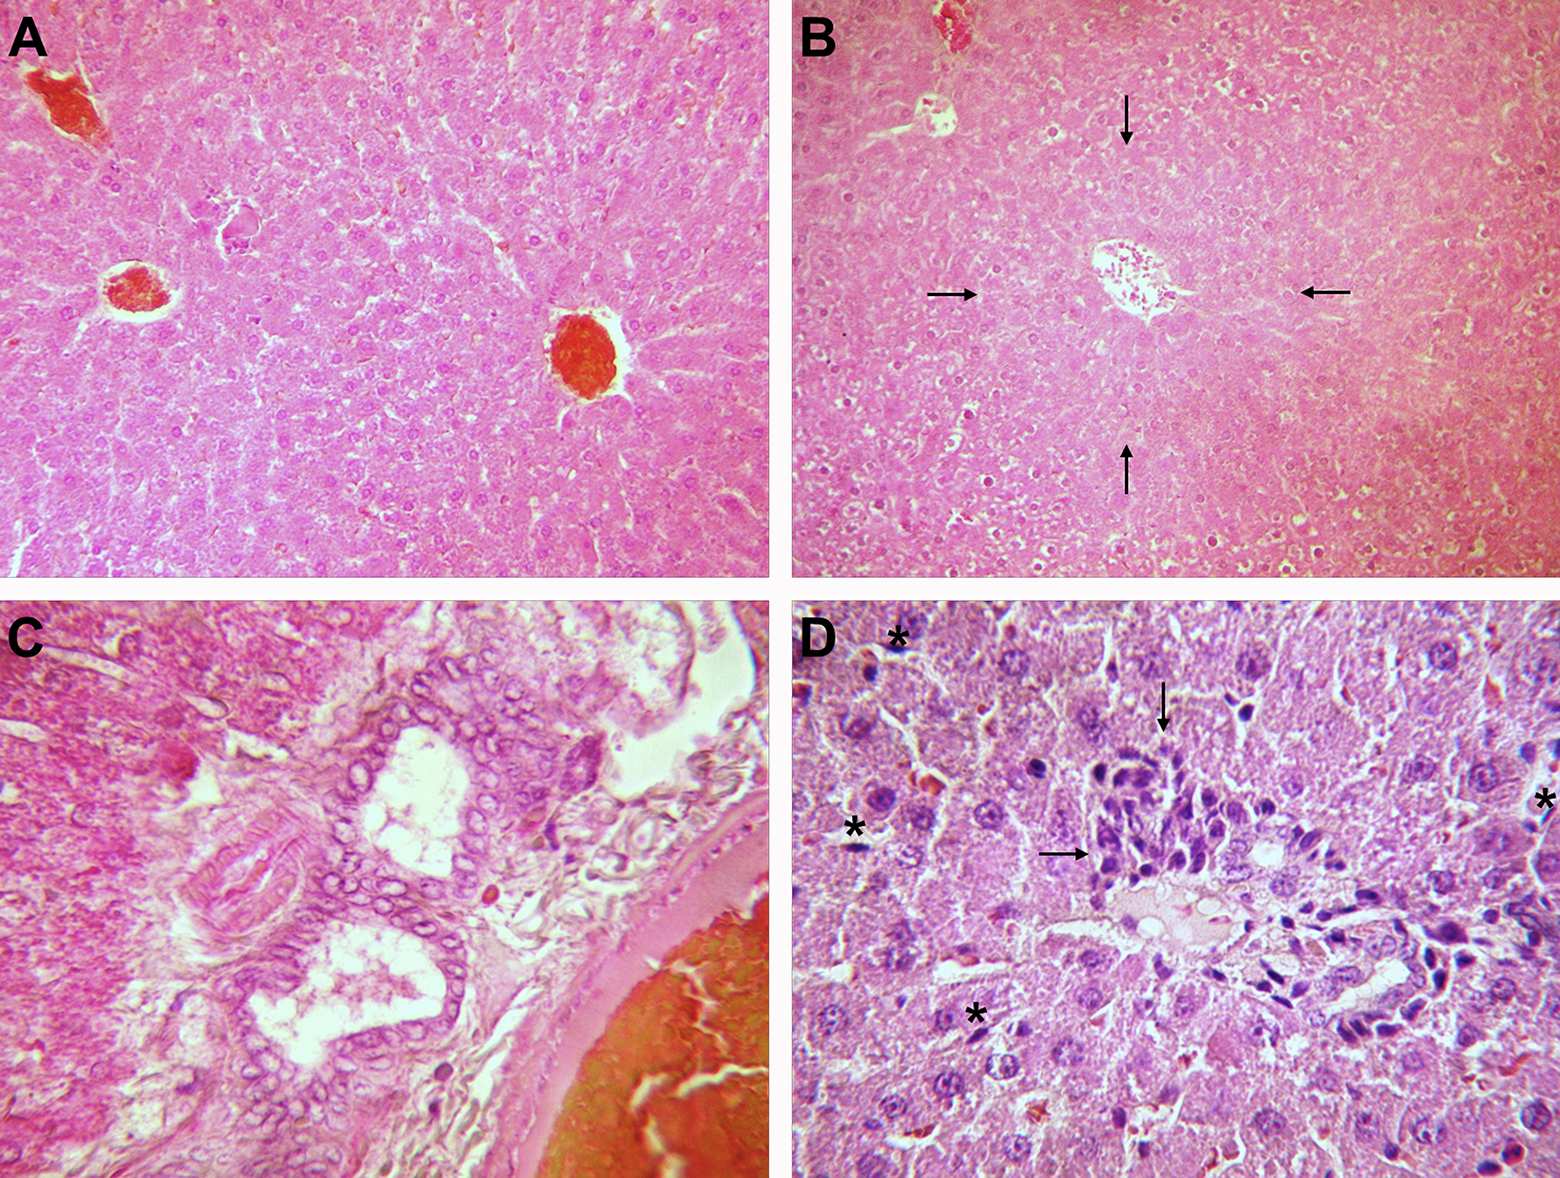
Photomicrographs of rat liver structure from ethanol + whey-treated group, H&E stain. (a) Moderate dilatation and congestion of central vein; (b) focal necrosis of hepatocytes in acinar zone 3, around the central vein (marked by arrows); (c) pronounced newly formed bile ductules; (d) discrete portal triad inflammation (marked by arrows) and discrete hyperplasia of Kupffer cells (marked by asterisk); (a ×100;b ×200; c and d ×400). H&E: hematoxylin and eosin.
In the group treated with whey (Figure 2), three (50%) of the animals had discrete congestive changes of the liver blood vessels, two (33.3%) had moderate, and one (16.7%) animal had a pronounced described changes. In the ethanol group, three (60%) animals had pronounced and two (40%) of them had very pronounced congestive change, while in the group treated with ethanol and whey, all six animals had moderate congestive changes (χ2 = 51.175; p < 0.001).
Very pronounced dilatation of the central vein was noted in three (60%) animals treated with ethanol, while two (40%) of them had pronounced changes, in contrast to the animals from the group treated with ethanol and whey, where two(33.3%) animals had a discrete and four (66.7%) of them had moderate dilatation of the central vein (χ2 = 46.657; p < 0.001).
Pronounced dilatation of portal vein branches was observed in one (20%) animal treated with ethanol, while very pronounced found at the rest four (80%) animals from the same group. Generally, the group treated with ethanol and whey had a less pronounced change. Among them, two (33.3%) animals had discrete, and four (66.7%) animals had a moderate dilatation of portal vein branches. In addition, only discrete examined histopathological change was observed in all whey treated animals (χ2 = 57.500; p < 0.001).
Portal spaces inflammation was discrete in two (40%) and moderate in three (60%) animals from the group treated with ethanol, while it was discrete in five (83.3%) and moderate in one (16.7%) animal from the group treated with ethanol and whey (χ2 = 27.627; p < 0.001).
Fatty changes of hepatocytes were observed in all ethanol-treated animals. Among them, two (40%) animals had discrete and three (60%) animals had moderate examined changes. In the control group, as well as in whey, and ethanol and whey-treated animals, there were no fatty changes (χ2 = 23.000; p < 0.001).
Kupffer cell hyperplasia was not observed in animals of control and whey-treated groups, while it was moderate in two (40%) and pronounced in four (60%) animals from the ethanol group. Discrete Kupffer cell hyperplasia was found in all six (100%) animals treated with ethanol and whey (χ2 = 46.000; p < 0.001).
Newly formed bile ductules were not found in animals from the control and whey-treated groups, while their appearance was moderate in four (80%) animals and discrete in one (20%) animal from the ethanol-treated group. Among animals from ethanol- and whey-treated group, four (66.7%) of them had moderate and two (33.3%) pronounced newly formed bile ductules (χ2 = 29.133; p < 0.001).
Discrete hepatocyte edema was found in two (33.3%) animals from the whey-treated group, while one (16.7%) of them showed moderate edema. There was no described histopathological change in any animal from the group treated with ethanol. In addition, among animals from the ethanol and whey-treated groups, two (33.3%) of them had discrete and three (50%) had moderate hepatocyte edema (χ2 = 13.672; p < 0.034).
Determination of enzyme activities (SOD1, SOD2, CAT, GSH-Px, GR, GST, XOD) and concentration of total glutathione and TBARS
Ethanol ingestion induced elevation of CAT activity (F = 27.3, p < 0.05), which was not suppressed by whey (Figure 5). Namely, ethanol increased CAT activity compared to control group, while ethanol + whey group also increased CAT activity compared to the whey group. There were no changes in the activity of the other measured AOE as well as GST and XOD activity and the concentration of total glutathione and TBARS concentrations.

The activity of antioxidant enzymes (SOD1, SOD2, CAT, GSH-Px, and GR), GST, XOD, and concentration of total glutathione and TBARS in in whole cell extracts from rat liver after treatment with ethanol (E), whey (W), and ethanol + whey combination (E + W) are shown the corresponding charts. Data are expressed as mean ± SEM (n = 6). Statistical significance was tested by two-way ANOVA and post hoc compared by Tukey’s HSD test. *p < 0.05. ANOVA: analysis of variance; TBARS: thiobarbituric acid reactive substances; SOD: superoxide dismutase.
Determination of protein levels (SOD1, SOD2, CAT, GSH-Px, GR, NFkB, and p53)
Whey significantly elevated levels of SOD1, GR, and NF-κB protein levels (SOD1: F = 6.58, GR: F = 12.70, NF-κB: F = 5.16; p < 0.05) (Figure 6(b), (f), and (g)), while ethanol elevated level of GR (F = 11.13, p < 0.05) (Figure 6(f)). Namely, whey-treated group showed significantly increased level of SOD1 (Figure 6(b)) compared to the control group. GSH-Px level increased in rats concomitantly treated with whey and ethanol compared to group treated with ethanol or whey (Figure 6(e)). GR level was increased in all treated groups compared to the control (Figure 6(f)). NF-κB level was increased in group concomitantly treated with whey and ethanol compared to group treated with ethanol only (Figure 6(g)).

Representative WBs (a) and protein levels of antioxidant enzymes (SOD1, SOD2, CAT, GSH-Px, and GR) (b to f) and transcription factors (NF-κB and p53) (g and h) in whole cell extracts from rat liver after treatment with ethanol (E), whey (W) and ethanol + whey combination (E + W) are shown in the corresponding charts. β-Actin was used as loading control. Values are means ± SEM (n = 6) and presented as percentage of control. Statistical significance was tested by two-way ANOVA and post hoc compared by Tukey’s HSD test (*p < 0.05). WB: Western blot; SOD: superoxide dismutase; ANOVA: analysis of variance.
Discussion
Previous studies have shown that the cytotoxic effect of chronic alcohol usage on the liver is, in a part, mediated via production of ROS, which causes LPO, increased protein oxidation, and induced DNA damage. 4 Oxidative stress, which is created as a consequence of alcohol consumption and its metabolism, is one of the central mechanism in alcohol induced liver damage. 3,44 Products of CYP2E l-dependent oxidative stress such as H2O2, lipid peroxides (LOOH), malondialdehyde (MDA) are diffusible, come out of hepatocyte and stimulate the (Ito) cells to produce collagen and induce the development of fibrosis during chronic exposition to alcohol. High content of iron in chronic alcoholism induces increased production of other oxidants, such as hydroxyl (OH), radicals of iron, and hydroxyethyl radicals. 45 These radicals are toxic to the cell, bringing them to LPO of the cell membrane with production of reactive lipid aldehydes (MDA). In addition, oxidation of ethanol under the action of alcohol dehydrogenase causes a change in redox condition (decrease in concentration the ratio of oxidized (NAD/NADH). 45 Chronic consumption of ethanol causes increased release of endotoxin originating from gram-negative bacteria of the intestine into the port circulation and induce the inflammatory response in the liver. Activated Kupfer cells produce free radicals, which, then, by activating NF-κB cause an increased synthesis of numerous cytokines, chemokines, growth factors, eicosanoids, reactive oxygen species (ROS) and nitrogen monoxide (NO). 45 –47
The application of 12% ethanol ad libitum (average 8.14 g of ethanol/kg b.w./day 0.254 g/L in blood) in this study led to significant pathohistological changes in the liver of treated animals. Ethanol caused significant congestion, central vein dilation, hepatic portal vein branch dilation, Kupffer cells hyperplasia, fatty hepatocyte changes, and focal necrosis of the hepatocyte. These changes are characteristic of the initial stage of alcoholic liver disease, steatosis, and there is no development of the more progressive forms of alcoholic liver disease. In the study of Dahiru and Obidoa, 48 chronic alcohol consumption (40% v/v 1ml/100 g per os for 6 weeks) in rats caused a necrosis of hepatocyte, aggregation of mononuclear cells, fat degeneration in central and middle zones characteristic for liver damage. In that study, morphological changes in the liver represent typical changes that define the manifest form of alcoholic liver disease. In our study, histopathological findings in the group treated with alcohol showed changes that are milder compared to other similar studies, probably because of smaller daily dose and the percentage of ethanol, significantly lower in our study, regardless of the same duration of the experiment. Chronically consumed alcohol in similar way also leads to a change in the redistribution of fat in the blood of Wistar rats. 21 In the same study, it has been shown that supplements such as whey protein do not affect the concentration of ethanol in the blood or change the redistribution of fat caused by alcohol but has a protective effect on lipid status, atherosclerosis index, and general health risk factor. Simultaneous alcohol use with whey protein in the same study led to an increase in LDH, which is a significant biochemical indication of the normal liver function. 21
A lot of previous animal experimental studies that used natural products as protectors on hepatotoxicity 49 –51 induced by well-known hepatotoxic agents showed antioxidative properties in manner of direct scavenging of free radicals, metal chelation, and induction of antioxidant enzymes. 50
Hepatoprotective effects of whey in our study are similar to hepatoprotective findings from the literature of other authors where the effect of whey was investigated to repair and regenerate the damage caused by the toxic effects of ethanol and other toxic agents. 20,52 As a suggested mechanism by which the whey leads to the improvement of histopathological findings are reduced production of free radicals induced after exposure to ethanol as well as the activation of regenerative processes. Other mechanisms can be attributed to the ability of whey in binding and chelating metals, and to antioxidative potency of many amino acids that whey contains. 53 The importance in antioxidative capacity have in majority histidine-containing peptides. 54 Whey also has a role in anti-inflammatory activity, since there is a study that confirms the decrease of C-reactive protein values after treatment with hydrolyzed whey protein supplement. 55
Protective effects of whey protein isolates (WPIs), alpha-lactalbumin (α-LA), and beta-lactoglobulin (β-LG) have also been shown to impair rat liver hepatotoxicity induced by oral administration of paracetamol (500 mg/kg) and alcohol (5 ml/kg) for 2 and 4 weeks. 56 Hepatoprotective effects of whey have been shown in many studies where liver damage is not caused by alcohol but with other hepatotoxic agents. One such study 57 showed that whey proteins at a dose of (100, 200 mg/kg per os) during 30 days had a significant effect on the reverse of histopathological changes caused by co-administered use of carbonate tetrachloride (CCl4) and fluvastatin.
Our study showed that ethanol in dose applied for 6 weeks did not change the level of TBARS, suggesting that liver managed to counteract the deleterious effects of alcohol regarding LPO effect. However, ethanol disturbed ROS homeostasis, since the increased CAT activity was found, suggesting elevated levels of H2O2. This is in agreement with previous preliminary studies that have shown that CAT activity increased after the treatment with low alcohol concentrations and decreased after treatment with high doses of alcohol. 58 Since there was no CAT protein expression increase, it seems that CAT activity is posttranslationally modified. Furthermore, chronic alcohol treatment did not affect the activity of SOD enzymes in our study. Although there are authors who have reported an increase in SOD activity during ethanol treatment, differences in dose and exposure time are significant. 58 Some studies have shown that the activity of manganese SOD (MnSOD) has been increased in experimental animals during acute and chronic ethanol administration 59 and that excessive expression of MnSOD prevents liver damage in rats treated with alcohol. 60 The study of the pig model showed a decreased activity of CuZnSOD and GPX as well as an increased MnSOD activity during alcohol exposure. 61,62 There are also studies that showed the absence of CuZnSOD, activity in chronic alcohol treatment. 63,64 It is obvious that influence of ethanol on ROS production and AOE activity strongly depends on the amount of ingested ethanol and duration of its consumption. Furthermore, since there were no changes in SODs activity, it seems that microsomal “turnover” of H2O2 comes from activated microsomal enzymes responsible for ethanol metabolism.
Our results showed that supplementation with whey attenuated all signs of chronic liver damages. However, whey supplementation did not affect the activity of AOE in the liver but elevated the amount of SOD1 and GR proteins in nonethanol-treated rats and GSH-Px of ethanol-treated rats. It can be suggested that whey change the level of AOE expression that follows changed metabolic lipid profile of liver shown in our previous work. 21 On the other hand, parallel both ethanol and whey consumption led to elevated NF-κB suggesting a transcription factor response. Signs of lower inflammation after consumption of whey were detected by histopathological examination. Therefore, parallel intake of whey with ethanol is obviously protected, but the molecular mechanism of its molecular action seems to overlap. In general, both agents rearrange the metabolic expression in liver; changes have to be considered as adaptive response to its ingestion. Elevated protein level of GSH-Px can be considered as an adaptive response to elevated H2O2. The measured activity of GSH-Px that do not follow elevated protein expression can be considered as posttranslational modification since antioxidant enzymes have different levels of its activity regulation in vivo. Chronic alcohol increased the protein expression of GR. Unchanged GR activity in spite of elevated protein content suggests that alcohol decreased GR activity that is similar to some previous studies results. 65 Although alcohol-induced liver damage is associated with reduction of GSH levels in some studies, 66,67 our results showed no changes. The effects of ethanol on the level of the GSH have variable character and range from reduction, increase to unchanged content. 4,68 Our results point out that observed changes on both activity and protein expression of AOE cannot be linked to the amount of glutathione but to the overall glutathione-mediated metabolic processes.
Some research studies have identified several transcription factors (NF-κB, p53) that are activated by fluctuations of the intracellular ROS level. 69 –71 Moreover, their alterations have been associated with ALD. Namely, it has been reported that p53 has a key role in the pathogenesis of alcoholic liver disease and liver sensitivity to alcohol-induced damage is associated with differences in p53 activation and corresponding inadequate regulation in signal cascades that regulate apoptosis, oxidative stress, insulin signaling, and fatty acid metabolism. 71 In addition, numerous studies confirm that the expression of NF-κB in Kupffer cells leads to the development of alcoholic liver disease. 72 –74 Considering this study, our results suggested that the administered dose of ethanol did not affect the expression of p53 and NF-κB which corresponded to mostly unaltered oxidative status upon the alcohol treatment.
The beneficial effects of whey cotreatment were reflected also through increased NF-κB levels. Although NF-κB is a key mediator in the inflammatory response, some studies have shown that this mediator functions as a factor in the survival of hepatocytes in conditions such as liver regeneration. 75 This phenomenon was confirmed by the signs of regeneration in the pathohistological findings of animals treated with the combined use of ethanol and whey. Therefore, we can suggest the cytoprotective and regenerative effects of whey is due to increased expression of NF-κB transcription factor. Bearing in mind the dual nature of NF-κB an inducer and suppressor in the apoptosis process, it seems that in this study NF-κB probably influence regenerative processes. Moreover, it has been found that GPx gene contains NF-κB putative regulator sequence, 76 which implies that increased NF-κB expression upon whey supplementation could lead to elevation of GPx and normalization of glutathione metabolism which could be responsible for the hepatoprotective effect of whey.
Conclusions
Chronic ethanol consumption of even low daily concentrations causes in liver: congestion, central vein dilation, portal venous dilation, portal inflammation, Kupfer’s hyperplasia, fatty hepatocyte changes, and focal necrosis; whey supplementation reverse to some extent degenerative changes and attenuated liver damage.
Parallel intake of whey with ethanol is obviously protected, but molecular mechanism related to ROS homeostasis and AOE expression seems to overlap. In general, both ethanol and whey rearrange the metabolic expression in liver and their concomitant ingestion prevents serious liver damage.
Footnotes
Acknowledgments
The authors would like to acknowledge the professional assistance and support from the Community Health Centre “Medicus Universalis”, Kruševac, Serbia, and the Vivarium of the Center for Biomedical Testing, Institute for Research and Development Galenika a.d., Belgrade, Serbia.
Author contributions
JH, MM, M Mijovic, MA and DPB conceptualized and refined research idea and created research design; IR, SV, AC, SR, MM, MA, and SJH have done literature search; BJ and DPB selected statistical tests; IR, M Mijovic, BJ, VN, VL, NT, ZP, and MM collected and prepared data; BJ, NT, MA, and DPB performed statistical analyses; IR, SV, MM, and MA wrote the first draft of the manuscript; MA, DPB and SJH wrote the second draft of the manuscript; IR, SV, NT, and MM edited the manuscript and prepared it for submission.
Declaration of Conflicting Interests
The author(s) declared no potential conflicts of interest with respect to the research, authorship, and/or publication of this article.
Funding
The author(s) disclosed receipt of the following financial support for the research, authorship, and/or publication of this article: This work was funded by the Ministry of Education, Science and Technological Development, Republic of Serbia (grant nos. 173014 and III41029).