
Abstract
Silver nanoparticles are used in many commercial products in daily life. Exposure to nanosilver has hepatotoxic effects in animals. This study investigated the cytotoxicity associated with polyvinylpyrrolidone-coated nanosilver (23.44 ± 4.92 nm in diameter) exposure in the human hepatoma cell line (HepG2) and normal hepatic cell line (L02), and the molecular mechanisms induced by nanosilver in HepG2 cells. Nanosilver, in doses of 20–160 μg mL−1 for 24 and 48 h, reduced cell viability in a dose- and time-dependent manner and induced cell membrane leakage and mitochondria injury in both cell lines; these effects were more pronounced in HepG2 cells than in L02 cells. Intracellular oxidative stress was documented by reactive oxygen species (ROS) being generated in HepG2 cells but not in L02 cells, an effect possibly due to differential uptake of nanosilver by cancer cells and normal cells. In HepG2 cells, apoptosis was documented by finding that ROS triggered a decrease in mitochondrial membrane potential, an increase in cytochrome c release, activation of caspase 3 and caspase 9, and a decrease in the ratio of Bcl-2/Bax. Furthermore, nanosilver activated the Fas death receptor pathway by downregulation of nuclear factor-κB and activation of caspase 8 and caspase 3. These results suggest that apoptosis induced by nanosilver in HepG2 cells is mediated via a mitochondria-dependent pathway and the Fas death receptor pathway. These findings provide toxicological and mechanistic information that can help in assessing the effects of nanosilver in biological systems, including the potential for anticancer activities.
Introduction
Nanotechnology is rapidly growing, and nanoparticles are used in a wide range of commercial products. Nanosilver is one of the most commonly used nanomaterials in food, cosmetics, and health care–related consumer products because of its antibacterial and antifungal properties. 1 –4 As an antimicrobial agent, silver has an estimated annual demand of 3125 tons per year for medicine and 2800 tons per year for food, hygiene, and water purification. 5 The production data for nanosilver are not publicly available, but the material has been incorporated into many medical products including, but not limited to, wound dressings, contraceptive devices, surgical instruments, medical catheters, and bone prostheses. 6,7 Thus, exposure to nanosilver is a reality in people’s lives; accordingly, concerns about the possible contribution of nanosilver to environmental and human toxicities are increasing.
Conceivably, nanoparticles could induce many unpredictable and deleterious effects. Concerns about the safety of nanosilver require assessment of its potential for toxicity. In vivo studies have revealed that nanosilver can diffuse from the exposure site and become systemically available. 8 –12 Our previous biodistribution study in mice 13 indicated that silver nanoparticles were distributed extensively in body tissues, but they were primarily concentrated in the liver and spleen after intravenous administration. Dziendzikowska et al. 14 also reported that silver nanoparticles were translocated from the blood to organs such as the liver, spleen, kidney, lungs, and brain after being administered intravenously to rats, with the highest concentration being in the liver. In recent in vitro studies, toxicity of nanosilver was evaluated in cultured cells, such as human osteoarthritic chondrocytes, neutrophils, and tumor cells, with traditional toxicological end points, such as cytotoxicity, oxidative stress, and apoptosis. 15 –23 Kim and Ryu 24 reviewed studies that investigated oxidative stress-, genotoxicity- and apoptosis-related changes brought about by nanosilver in cultured cells and animal tissues. The possible mechanisms of nanosilver-induced toxicity included the stimulation of oxidative stress, genotoxicity, and apoptosis. AshaRani et al., 25 using normal human lung fibroblast cells and human glioblastoma cells, found that starch-coated silver nanoparticles caused changes in cell morphology, inhibition of proliferation, and DNA damage. Kim et al., 26 in studies with mammalian cell lines, found that nanosilver particles caused primary DNA damage and cytotoxicity but not mutagenicity. The toxicological effects of nanosilver were related to the physicochemical properties of nanoparticles, such as particle sizes, surface coatings, and charges, and the test systems used. Our previous study 27 showed that nanosilver exposure could induce cell cycle arrest in the G2/M phase, thus significantly increasing the apoptosis rate and the generation of reactive oxygen species (ROS) and decreasing the mitochondrial membrane potential (MMP) in HepG2 cells. These results suggested that the toxicological mechanism of nanosilver is related to oxidative stress of cells. The cytotoxicity of nanosilver was also affected by the dispersion media of the nanoparticles. Further studies are warranted to evaluate the risk posed by nanosilver to the environment and human health and to fully understand the cellular toxicological mechanism of nanosilver.
The liver, a part of mononuclear phagocytic system, is the primary exposure site to foreign compounds, and silver nanoparticles have been reported to mainly accumulate in the liver. 13,14 In the present study, we selected the normal human hepatic cell line (L02) and the hepatoma cell line (HepG2) to study the cytotoxicity of nanosilver in different cell lines. The toxic effects of silver ion released from silver nanoparticles were evaluated and compared to the effects of silver nitrate. We also investigated the cellular and molecular mechanisms underlying the cytotoxic response induced by nanosilver, including the involvement of cytochrome c, the cascade signaling pathways, and the Bcl-2/Bax and Fas death receptor pathway. Our findings provide experimental data that can be used to evaluate the biosafety of nanosilver and provide an important insight into the theoretical basis for biomedical applications.
Materials and methods
Characterization of silver nanoparticles
Silver nanoparticles, with a manufacturer’s stated average particle size of 15 nm (12–20 nm), were obtained from Shanghai Huzheng Nano Technology Co., Ltd., Shanghai, China, and used as received. The nanoparticles were coated with polyvinylpyrrolidone (PVP). The content of silver was 25% (w/w). The intended use of this product is for its antibacterial and anti-inflammatory effect in the treatment of burns and other inflammations.
Nanosilver was characterized by use of a transmission electron microscopy (TEM; JEM-2100, JEOL, Tokyo, Japan) and a scanning electron microscopy (SEM; S4800, Hitachi, Tokyo, Japan). Dynamic light scattering analysis and zeta potential were performed on a Malvern Zetasizer Nano-ZS90 instrument (Malvern, Worcestershire, UK). The content of silver was measured with inductively coupled plasma mass spectrometry (ICP-MS; Nexion 300X, PerkinElmer, Waltham, Massachusetts, USA).
Cell culture and nanoparticle treatment
Human liver HepG2 and L02 cells were provided by the Shanghai Institute of Cell Biology, Chinese Academy of Sciences, Shanghai, China. Both cell lines were cultured in Dulbecco’s Modified Eagle Media (DMEM) cell culture medium containing 10% fetal bovine serum and 1% penicillin–streptomycin (Gibco, Invitrogen, Grand Island, New York, USA). The cell lines were maintained in a 5% CO2 incubator at 37°C. Cell growth was observed daily under an inverted microscope (Olympus CK40, Olympus Co., Tokyo, Japan), and all experiments were performed in a clean atmosphere. The cells with good exponential phase of growth were chosen for tests.
Stock solutions of nanosilver (3.2 mg mL−1) were prepared in cell culture medium without fetal bovine serum and stored at 4°C. The required concentrations were obtained by diluting the stock solution with the cell culture medium soon before the test. Nanosilver suspensions were vortexed vigorously for 1 min and sonicated for 5 min to ensure uniformity. Nanosilver suspensions at appropriate concentrations were added to the cultures to obtain the respective treatment concentration and were incubated for 24 or 48 h. After nanosilver treatment, the plates were observed under a light microscope (Olympus CK 40, Olympus Co., Tokyo, Japan) to detect morphologic changes, and photographs were taken with an Olympus C7070WZ camera (Olympus Co., Tokyo, Japan).
Cell viability assay
Cell viability was evaluated with a Cell Counting Kit-8 (CCK-8, Beyotime Institute of Biotechnology, Shanghai, China) assay, which reflects the mitochondria activity of cells. The CCK-8 assay was performed according to the manufacturer’s instruction. L02 and HepG2 cells were seeded at 5.0 × 10⁴ mL−1 in 96-well plates and maintained in a 5% CO2 incubator at 37°C for 24 h. Appropriate amounts of nanosilver stock solutions were added to the cultures to obtain the desired concentration of nanosilver (20, 40, 80, 160, 320, and 640 μg mL−1). For evaluating the effect of silver ion released from silver nanoparticles, the supernatants were collected by ultracentrifugation (18,000 r min−1 × 2 h at 4°C, referred to as R-Ag+). As the content of silver was stated to be 25% (w/w), silver nitrate solutions (referred to as S-Ag+) with equivalent concentration of silver (5, 10, 20, 40, 80, and 160 μg mL−1) were prepared. The solutions of PVP (referred to as C-PVP), the coating material, with equivalent concentration of PVP (15, 30, 60, 120, 240, and 480 μg mL−1) were also examined. Replicates of four wells were prepared for each concentration. The cells were incubated for 24 or 48 h. After exposure, the cell culture medium was discarded, and cells in the solution containing 10% CCK-8 reagent with cell-free culture medium were incubated for 2 h at 37°C, 5% CO2. The optical density at 450 nm was recorded with a microplate reader (LB941, Berthold Company, Germany). Viability was calculated as the ratio of the mean of optical density obtained for each condition to that of the control (dispersion media only) condition. All experiments were performed in triplicate.
Lactate dehydrogenase assay
Lactate dehydrogenase (LDH) is a stable cytoplasmic enzyme, which is released into the cell culture medium when the plasma membrane is damaged. Accordingly, LDH activity can be regarded as an indicator of cell membrane integrity and used to assess the cytotoxicity caused by chemical compounds or other toxic environmental factors. HepG2 cells or L02 cells (1.0 × 10⁵ mL−1 per well in 24-well plates) were incubated with various concentrations of nanosilver (0, 20, 40, 80, and 160 μg mL−1) for 24 or 48 h and centrifuged at 1000 r min−1 for 10 min; 120 μL of culture supernatant was collected. LDH levels were determined according to commercial kit protocols (Beyotime Institute of Biotechnology). Absorption was measured with a microplate reader at 490 nm.
TEM of cellular ultrastructures
Ultrathin sections of the cells were analyzed with TEM to determine the distribution of nanoparticles. L02 and HepG2 cells were seeded in 6-well plates (1.0 × 10⁵ mL−1) and allowed to attach and grow for 24 h before treatment. After incubation with 160 μg mL−1 of nanosilver solution for 24 or 48 h, cells were harvested, washed with phosphate buffered saline (PBS), and prefixed with 2.5% glutaraldehyde at 4°C overnight. Fixed cells were washed three times with PBS, followed by postfixation with 1% osmium tetroxide for 30 min. The cells were washed three times with PBS. After dehydration, penetration, embedding, block, slicing, and electronic dyeing, the ultrastructure of the cells was observed under TEM (JEOL) at an accelerating voltage of 80 kV.
Cell apoptosis assay
Cell apoptosis induced by nanosilver was measured with an Annexin V-Fluorescein Isothiocyanate (FITC) apoptosis detection kit (KeyGen apoptosis detection kit, KeyGen Biotech Co., Nanjing, China). As described, 27 approximately 2.0 × 10⁵ cells per well were seeded in 6-well plates and incubated for 24 h. After nanosilver treatments (0, 20, 40, 80, 160 μg mL−1) for 24 or 48 h, cells were harvested and washed twice in PBS. Staining was performed according to the manufacturer’s instructions. Cells were incubated in the dark for 15 min at room temperature in 200-μL binding buffer containing Annexin V-FITC (10 μL) and propidium iodide (PI, 5 μL). After incubation, 300-μL binding buffer was added to each sample, and cells were kept on ice. A 488-nm laser was used for excitation, and FITC was detected in FL-1 with a 525/30 band pass (BP) filter; PI was detected in FL-2 with a 575/30 BP filter. Data analyses were performed by use of BD FACSDiva software (BD Biosciences Co., Franklin Lakes, New Jersey, USA).
MMP assay
JC-1 (tetrachloro-tetraethylbenzimidazol carbocyanine iodide) probe (KeyGen Biotech Co.) was used to measure mitochondrial depolarization in the HepG2 and L02 cells after treatment with nanosilver. Cell number, concentrations, and culture conditions were similar to those used in the cell apoptosis analysis. Treated cells were harvested and washed twice in PBS. The analysis was performed according to the manufacturer’s instructions (KeyGen MMP detection kit, KeyGen Biotech Co.). Cells were incubated in JC-1 working solution for 20 min at 37°C, 5% CO2, then centrifuged and washed twice in the incubation buffer. MMPs were monitored by determining the relative amounts of dual emissions from mitochondrial JC-1 monomers or aggregates by use of FACSCantoTM flow cytometer (BD Biosciences Co., Franklin Lakes, New Jersey, USA) at an excitation wavelength of 488 nm and emission wavelength of 525 nm. Mitochondrial depolarization was detected by an increase in the green/red fluorescent intensity ratio.
Intracellular ROS assay
The generation of ROS was monitored with 2′,7′-dichlorodihydrofluorescein diacetate (DCF-DA; KeyGen Biotech Co.) staining technology. As described, 27 cell number, concentrations, and culture conditions were similar to those used in the cell apoptosis analysis. Treated cells were harvested and washed twice in PBS. The analysis was carried out according to the manufacturer’s instruction (KeyGen ROS detection kit, KeyGen Biotech Co.). Staining was achieved by exposing the cells to 10 μM of DCF-DA for 20 min at 37°C. Hydrogen peroxide–treated cells (H2O2, 0.15%) were used as the positive control. Cells were washed three times in serum-free medium and analyzed by use of FACSCantoTM flow cytometer (BD Biosciences Co., Franklin Lakes, New Jersey, USA) at an excitation wavelength of 488 nm and emission wavelength of 525 nm. The data were analyzed with BD FACSDiva software (BD Biosciences Co., Franklin Lakes, New Jersey, USA).
Western blot analysis
Total cellular proteins were extracted by radioimmunoprecipitation assay with phenylmethylsulfonyl fluoride (PMSF; AMRESCO, Houston, Texas, USA). Approximately 2.0 × 10⁵ cells per well were seeded in a 6-well plate and incubated for 24 h. After nanosilver treatment (0, 20, 40, 80, and 160 μg mL−1) for 24 h, cells were harvested and washed twice with ice-cold PBS and lysed in an ice-cold radioimmunoprecipitation assay buffer (Beyotime Institute of Biotechnology) containing a cocktail of PMSF protease inhibitors (99:1) for 30 min. After centrifugation of the lysates at 12,000 r min−1 at 4°C for 10 min, the supernatants were collected and stored at −80°C until use. The protein concentrations of the extracts were determined with a bicinchoninic acid protein assay (Beyotime Institute of Biotechnology). An equal amount (50 mg) of protein was separated on a 10% sodium dodecylsulphate-polyacrylamide gel electrophoresis (SDS-PAGE) gel and electrotransferred to polyvinylidene difluoride membranes that were blocked with 5% bovine serum albumin in Tris-buffered saline containing 0.05% Tween 20 (TBST) for 1 h at room temperature. The membranes were incubated with first antibodies for cytochrome c, Bcl-2, Bax, nuclear factor (NF)-κB, caspase 3, caspase 8, and caspase 9 (1:1000 dilution; Abcam, Cambridge, UK) overnight at 4°C. After being washed with TBST five times, the membranes were incubated with horseradish peroxidase–conjugated goat anti-rabbit immunoglobulin G (IgG)/anti-goat IgG secondary antibodies (1:1000 dilution; Beyotime Institute of Biotechnology) for 1 h at room temperature. Protein bands were stained with the West Pico chemiluminescence reagent (Pierce, Rockford, Illinois, USA), and the films were scanned and analyzed with ImageJ 1.48 software. Each experiment was conducted at least three times.
Statistical analysis
All data are displayed as mean ± standard deviation (SD). The software used for the data analysis was SPSS 13.0 for Windows (SPSS Inc., Chicago, Illinois, USA). One-way analysis of variance was used to determine the statistical significance between control and exposed groups, followed by Dunnett’s t-test to determine the significance of differences between the groups. Differences were considered significant at p < 0.05.
Results
Characterization of nanosilver particles
Silver nanoparticles were reported by the manufacturer to be approximately 15-nm diameter. We used TEM to measure the primary particle size of approximately 500 random particles and compared the average particle size to the manufacturer’s reported sizes. As shown in the TEM images (Figure 1(a) and (b)), the silver particles were uniform in size and shape. Particles with diameter ranging from 10 to 35 nm accounted for 96% of the total particle count, with an average diameter of 23.44 ± 4.92 nm. The SEM image (Figure 1(c)) showed that the silver particles were well dispersed. The hydrate particle size of silver nanoparticles in cell culture was measured with a laser diffraction particle analyzer; the average size was 43.76 nm (Figure 1(d)). The zeta potential of nanosilver in DMEM cell culture medium was −4.95 mV. The content of silver was 29.08% (w/w) determined by ICP-MS. The results of particle characterization showed that cells were exposed to agglomerates of nanosilver that were slightly larger than the primary nanoparticles.

Characteristics of silver nanoparticles: (a) TEM of silver nanoparticles. Bar indicates 50 nm. (b) The size distribution histogram generated with imaging (a) shows nanoparticles of 10–35 nm with an average diameter of 23.44 nm. (c) Scanning electron micrograph of silver nanoparticles illustrates well-dispersed particles. (d) The average hydrate particle size in cell culture medium was 43.76 nm. The results indicate the presence of silver nanoparticle agglomerates in cell culture medium.
Nanosilver inhibited cell viability and induced LDH leakage more in HepG2 cells than in L02 cells
Viability assays are essential in toxicology to explain the cellular response to a toxicant; the assays give information on cell death, survival, and metabolic activities. In the current study, cell viability was determined with CCK-8 assay. As shown in Figure 2, the loss of viability was related to the exposure dose (20–640 μg mL−1) and exposure time (24 and 48 h). HepG2 cells had a significant time- and dose-dependent decrease in cell viability. However, L02 cells maintained cell viability at the exposure level lower than 80 μg mL−1 for 24 h. In the nanosilver concentration range of 20–160 μg mL−1, the cell viability decreased at a greater rate with HepG2 cells than with L02 cells. The silver ion solutions (R-Ag+) of various concentrations obtained through ultracentrifugation had limited cytotoxicity to both cell lines. The levels of silver ion released from nanosilver may be related to the concentrations of nanosilver dispersions. Only when the nanosilver concentration was >160 μg mL−1 for 48 h, did the R-Ag+ generate cytotoxicity in both cell lines. Silver nitrate solution (S-Ag+) decreased cell viability much more than did nanosilver. The C-PVP solution had no influence on cell viability (data not shown). The effect of nanosilver on cell viability of HepG2 and L02 cells was mainly induced by silver nanoparticles. Based on cell viability, the exposure level of 20–160 μg mL−1 was used in the subsequent experiments.

The viability of HepG2 and L02 cells was estimated with CCK-8 assay. Data are expressed as the mean ± SD (n = 4). Significantly different from control (*p < 0.05; **p < 0.01). AgNP refers to the dispersion of nanosilver; R-Ag+ refers to the supernatant containing silver ions released from nanosilver; S-Ag+ refers to the solution of silver nitrate. CCK-8: Cell Counting Kit-8; SD: standard deviation.
Cell membrane damage induced by nanosilver was estimated according to LDH leakage. As shown in Figure 3, LDH leakage increased in a concentration-dependent manner in HepG2 and L02 cells after 24 or 48 h of exposure (p < 0.05 or p < 0.01 compared to control). A statistically significant difference between HepG2 cells and L02 cells in LDH leakage was observed at the exposure level of 20–160 μg mL−1. LDH leakage was 1.9–2.7 times higher in HepG2 cells than in L02 cells, a result that accorded with the cell viability results. Thus, at the exposure level of 20–160 μg mL−1, HepG2 cells are more sensitive to silver nanoparticles than are L02 cells.

LDH activity after HepG2 and L02 cells was exposed to various doses (µg mL−1) of silver nanoparticles. Data are expressed as the mean ± SD (n = 4). Significantly different from the control (*p < 0.05; **p < 0.01). LDH: lactate dehydrogenase; SD: standard deviation.
Nanosilver disturbed cell morphology and distribution in cells
The toxic effect indicated by the viability assay may also be reflected in abnormal cell morphology. Thus, we investigated cell morphology after exposure to nanosilver by use of an optical microscope. When exposed to nanosilver at concentrations of 20–160 μg mL−1 for 24 or 48 h, the HepG2 cells had distinct morphological changes, whereas control cells appeared to be normal (Online Supplementary Figure S1). As the nanosilver concentration and exposure time were increased, the exposed cells appeared to be round and shrunken, with a few cellular extensions, but the effect was less on the L02 cells than on HepG2 cells (Online Supplementary Figure S2).
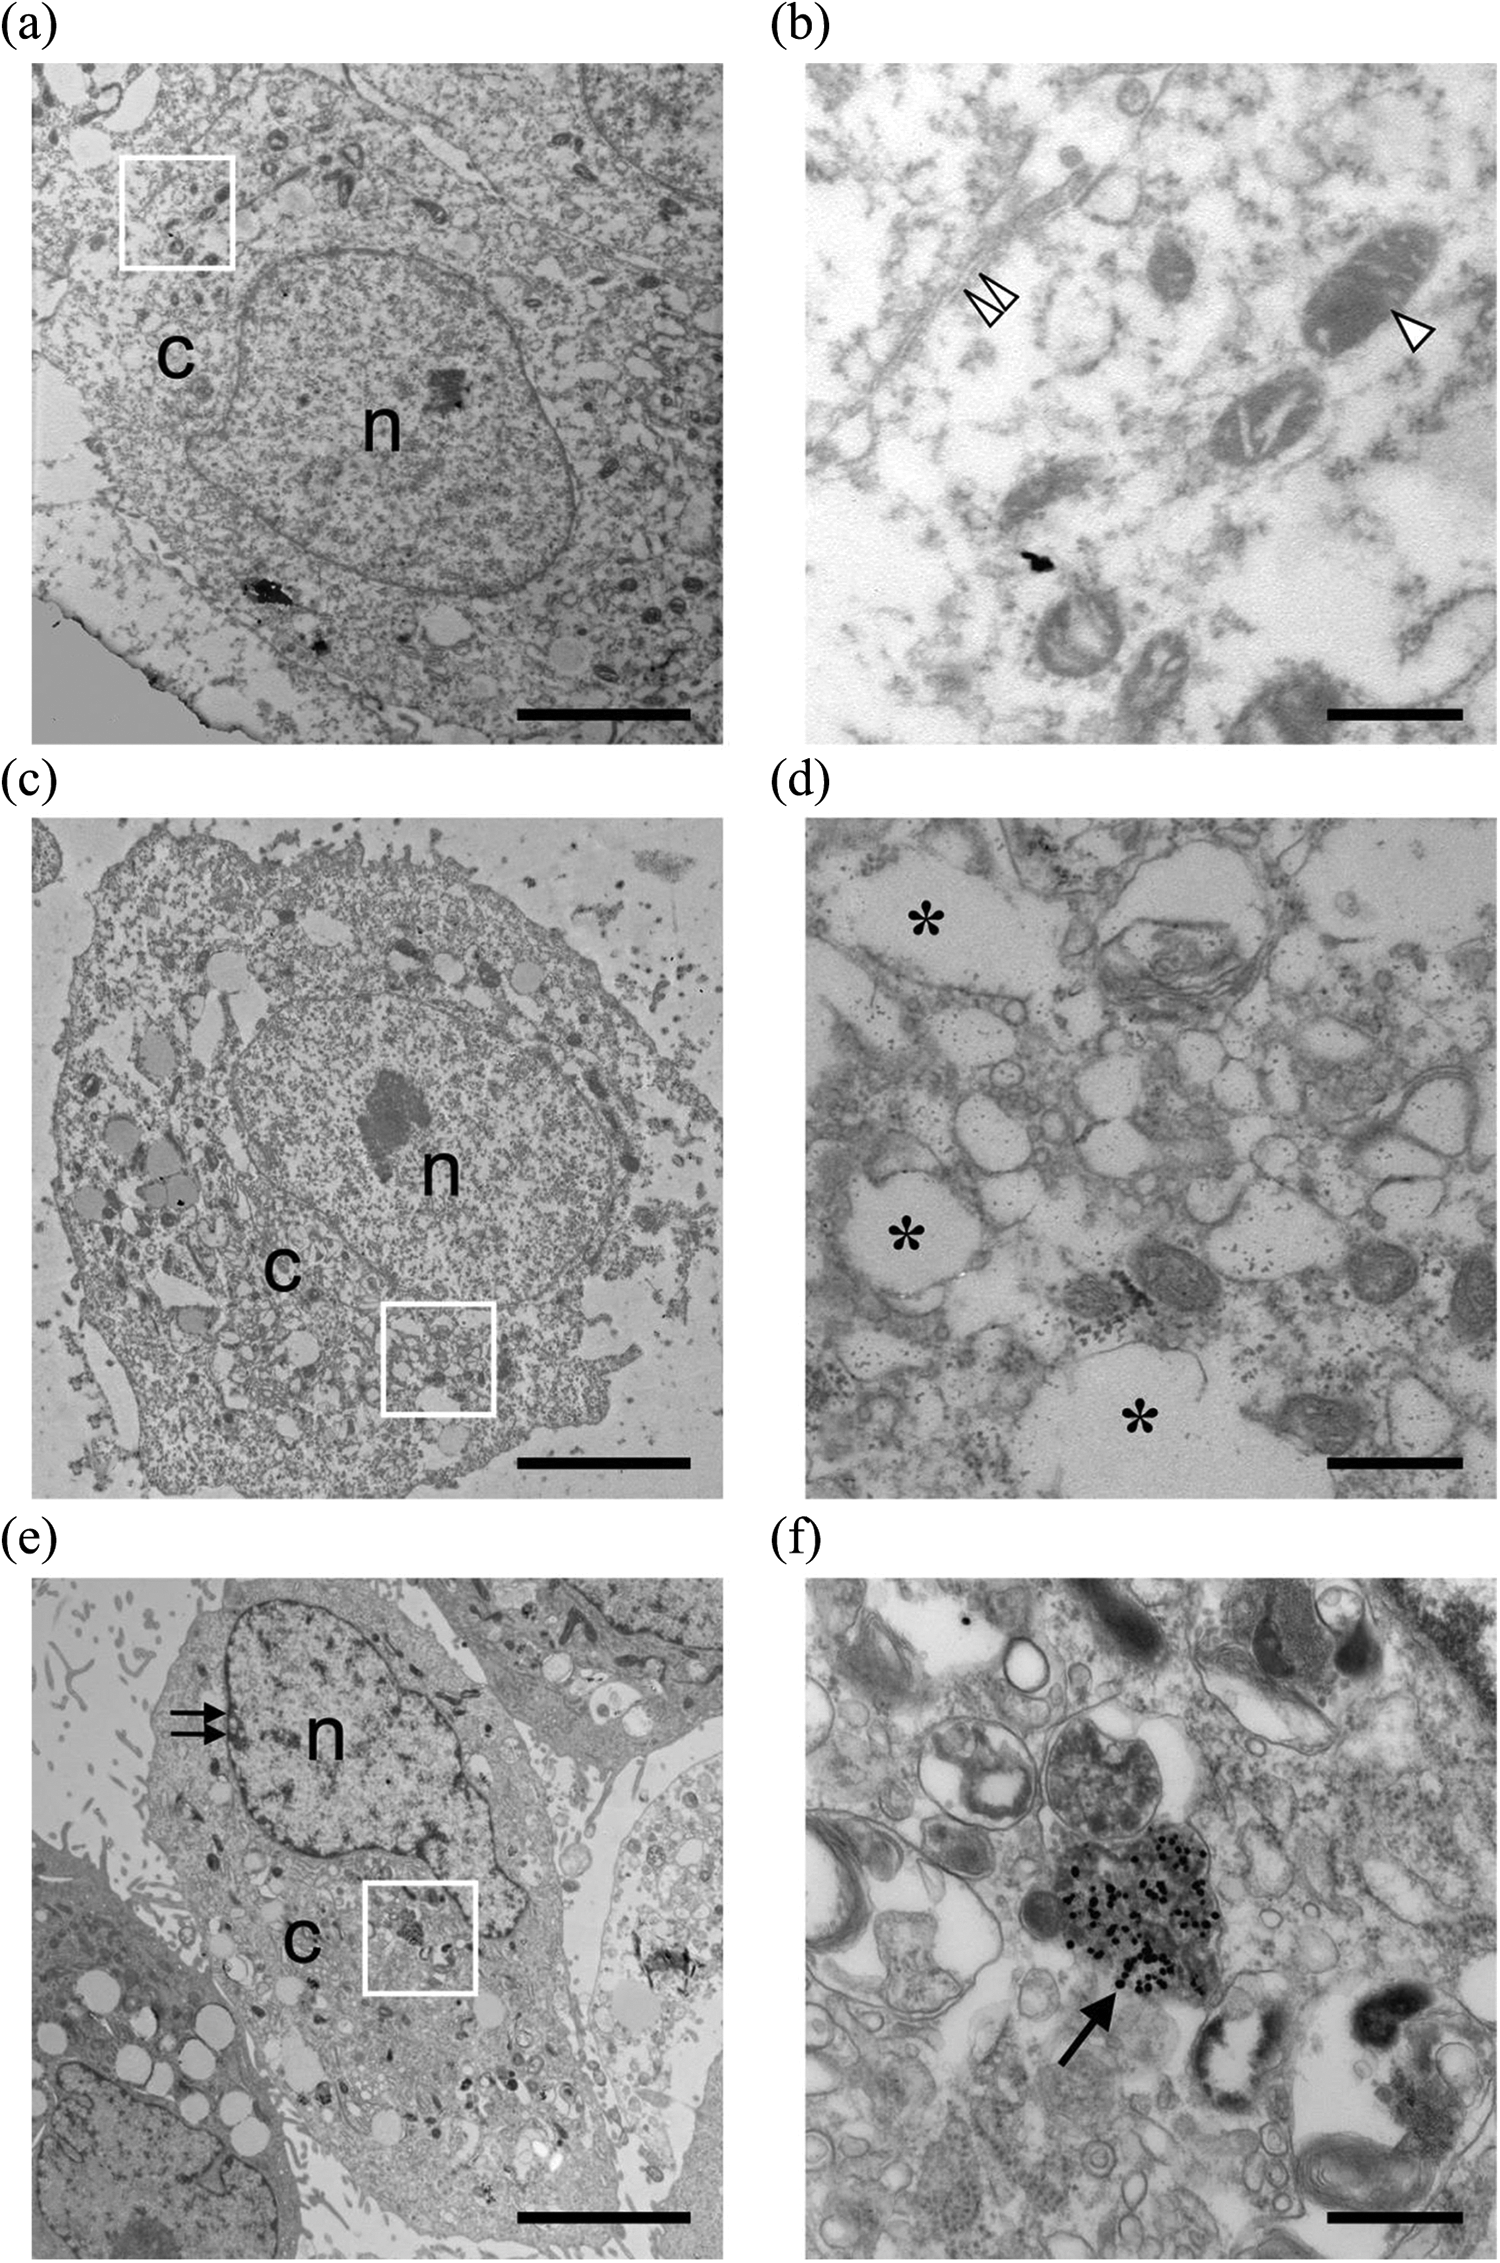
Figures 4 and 5 show the TEM ultrastructural images of untreated HepG2 and L02 cells (panels (a) and (b)) compared with cells exposed to 160 μg mL−1 of nanosilver for 24 or 48 h (panels (c) to (f)). Untreated HepG2 and L02 cells had normal cellular organelles with clear mitochondrial structures and neat arrangement of the endoplasmic reticulum. In HepG2 cells and L02 cells exposed to nanosilver, cell membrane shrinkage, increased intracellular vacuoles, tumid mitochondria, and condensed chromatin accumulation around nuclear membranes were present; the effects were severer in the HepG2 cells than in the L02 cells. The intracellular distribution of nanosilver was also observed at high magnification; nanosilver was mainly dispersed around cell membranes after 24-h exposure but was present in mitochondria and endocytotic vesicles after 48-h exposure.

Intracellular localization of nanosilver in HepG2 cells. TEM images of untreated HepG2 cells ((a) and (b)) or cells exposed to 160 μg mL−1 of nanosilver for 24 h ((c) and (d)) or 48 h ((e) and (f)) are shown. Panels (b), (d), and (f) are enlarged from the square area in (a), (c), and (e), respectively. Panels (a) and (b): Untreated HepG2 cells from the controls reveal normal cellular organelles. Panels (c) and (d): Exposed cells reveal cell membrane shrinkage, tumid mitochondria, and increased intracellular vacuoles, but no agglomerated or individual nanosilver in the cytoplasm of HepG2 cells after being treated for 24 h. Panels (e) and (f): Exposed cells show condensed chromatin accumulated around nuclear membranes, and agglomerated or individual nanosilver particles in the cytoplasm of HepG2 cells after being treated for 48 h. c: cytoplasm; n: nucleus; asterisk: intracellular vacuoles; single arrow head: mitochondria; double arrow head: endoplasmic reticulum; arrow: nanosilver particles; double arrow: condensed chromatin. Scale bar is 5 μm in panels (a), (c), and (e) and 0.5 μm in panels (b), (d), and (f). TEM: transmission electron microscopy.
Intracellular localization of nanosilver in L02 cells. TEM images of untreated L02 cells ((a) and (b)) or cells exposed to 160 μg mL−1 of nanosilver for 24 h ((c) and (d)) or 48 h ((e) and (f)) are shown. Panels (b), (d), and (f) are enlarged from the square area in (a), (c), and (e), respectively. Panels (a) and (b): Untreated L02 cells have normal cellular organelles. Panels (c) and (d): Exposed cells show cell membrane shrinkage and increased intracellular vacuoles, but no agglomerated or individual nanosilver, in the cytoplasm of L02 cells after being treated for 24 h. Panels (e) and (f): Exposed cells show condensed chromatin accumulated around nuclear membranes and agglomerated or individual nanosilver particles in the cytoplasm of L02 cells after being treated for 48 h. c: cytoplasm; n: nucleus; asterisk: intracellular vacuoles; single arrow head: mitochondria; double arrow head: endoplasmic reticulum; arrow: nanosilver particles; double arrow: condensed chromatin. Scale bar is 5 μm in panels (a), (c), and (e) and 0.5 μm in panels (b), (d) and (f). TEM: transmission electron microscopy.
Nanosilver-induced apoptosis was more in HepG2 cells than in L02 cells
Nanosilver-induced cell apoptosis was investigated with the Annexin V-FITC/PI double-staining method. As shown in Figure 6, the percent apoptosis was more after 48 h than after 24 h exposure to nanosilver at the concentration of 20–160 µg mL−1. The ratio of apoptosis in HepG2 cells increased by 1.9–7.3 times, while the corresponding ratio in L02 cells increased by 1.3–4.4 times over that of control in the concentration range of 20–160 μg mL−1 of nanosilver. Statistically, significant differences were present between the treated and the control cells in both HepG2 and L02 cells at all four concentration levels tested. Thus, the effect of nanosilver on the apoptosis of HepG2 and L02 cells was shown to be time- and dose-dependent, and the apoptotic effect of nanosilver was significantly greater for HepG2 cells than for L02 cells.

Percentages of early apoptosis in HepG2 cells (a) and in L02 cells (b) exposed to silver nanoparticles at 0–160 µg mL−1 for 24 or 48 h. Data are expressed as the mean ± SD (n = 4). Significantly different between the treated and control groups (*p < 0.05; **p < 0.01) and between the 24- and 48-h groups (# p < 0.05; ## p < 0.01).
Nanosilver decreased MMP more in HepG2 cells than in L02 cells
During the apoptotic process, mitochondrial membrane pores are opened and MMP is disrupted. 28 As shown in Figure 7, after 24 or 48 h exposure to nanosilver at the dose of 20–160 μg mL−1, a significant concentration-dependent decrease in MMP compared with control values occurred in HepG2 and L02 cells, indicating increased mitochondria injury. The percent decrease of MMP in HepG2 cells increased by 1.4–6.2 times, while the corresponding values in L02 cells increased by 1.3–3.9 times over that of control in the concentration range of 20–160 μg mL−1 of nanosilver. The decrease in MMP values was significantly greater in HepG2 cells than in L02 cells.

Decrease of MMP in HepG2 cells (a) and in L02 cells (b) exposed to silver nanoparticles at 0–160 µg mL−1 for 24 or 48 h. Data are expressed as the mean ± SD (n = 4). Significantly different between the treated and control groups (*p < 0.05; **p < 0.01); and between the 24- and 48-h groups (# p < 0.05). MMP: mitochondrial membrane potential; SD: standard deviation.
Nanosilver induced ROS production in HepG2 cells but not in L02 cells
Since excessive production of ROS in cells induces apoptosis, we assessed ROS formation induced by nanosilver after 24 or 48 h exposure to nanosilver by use of the DCF-DA assay. As shown in Figure 8, levels of DCF fluorescence increased with increasing exposure time (24 vs. 48 h) and nanosilver concentrations in HepG2 cells, but not in L02 cells, at all four concentration levels (20–160 µg mL−1).

ROS generation in HepG2 cells (a) and in L02 cells (b) exposed to silver nanoparticles at 0–160 µg mL−1 for 24 or 48 h. Data are expressed as the mean ± SD (n = 4). Significantly different between the treated and control groups (**p < 0.01); and between the 24- and 48-h groups (# p < 0.05; ## p < 0.01). ROS: Reactive oxygen species; SD: standard deviation.
Nanosilver activated apoptotic signaling pathways in HepG2 cells
Apoptosis-related protein expressions in HepG2 cells were examined with a western blot analysis. As shown in Figure 9(c), the expressions of cytochrome c, caspase 3, caspase 8, and caspase 9 were significantly increased with exposure to nanosilver. On the other hand, the expression of the transcription NF-κB and the ratio of antiapoptotic molecule Bcl-2 to proapoptotic molecule Bax were decreased. These results are consistent with the nanosilver-induced apoptosis of HepG2 cells being related to the mitochondrial apoptotic pathway and the Fas death receptor apoptotic pathway.

Effects of silver nanoparticles on apoptosis signaling pathways in HepG2 cells. (a) The protein of cytochrome c, Bcl-2, Bax, and NF-κB was detected via western blot analysis. GAPDH was used as an internal control to monitor for equal loading. (b) The protein of caspase 3, caspase 8, and caspase 9 expression was detected via western blot analysis. β-Actin was used as an internal control to monitor for equal loading. (c) Densitometry data from three experiments. Data represent mean ± SD (n = 3), *p < 0.05 when compared with the control. NF: nuclear factor; GAPDH: glyceraldehyde 3-phosphate dehydrogenase; SD: standard deviation.
Discussion
Silver nanoparticles are the most widely commercialized nanoparticles, and they are used as antimicrobials in food, cosmetic-related products, and in health-care and medical devices. More than 400 products that are claimed to contain nanosilver are available for public use. 1 As the application of nanosilver has become increasingly popular, the toxicological and environmental issues should be put on the agenda. Once nanoparticles enter the body, they may become systemically distributed regardless of the administration route. Because of their extremely small particle size, silver nanoparticles may be retained in tissues and cause toxic effects in the respiratory and gastrointestinal tracts, the ocular and visual system, skin, liver, and other organs. 13,14,29 Because silver nanoparticles accumulate primarily in the liver after entering the bloodstream, understanding whether nanosilver exerts adverse effects on hepatocytes is essential.
Studies have suggested that elementary silver exhibits little cytotoxicity at low concentrations. 30,31 However, it has been reported that silver nanoparticles act on human and bacterial cells, although the toxicity to human cells was very low compared with that to bacterial cells when the same concentration was used. 32 Korshed et al. 33 investigated the antibacterial effect of picosecond laser-generated silver nanoparticles and their toxicity to human cells. The authors concluded that the nanoparticles had broad antibacterial effects against microbes but with minimal human cell toxicity. However, data from studies on the toxicity of nanosilver to various mammalian cells have large variations, and nanosilver has induced cytotoxicity and genotoxicity in human cells. 25,34 –36 The interaction of nanosilver with mammalian systems is not fully understood, and little is known about the potential mechanism of their toxicity. No standard toxicity test of nanosilver is available in the field of nanotoxicology. Variations in in vitro cell model systems used, and the kinds of toxicity experiments performed, could affect the detection of their toxic effects and understanding of the mechanism involved. We have previously evaluated the cytotoxicity of nanosilver when exposed to HepG2 cells at various doses and in various dispersion media. 27 Our results are consistent with those of Singh and Ramarao 37 for the cytotoxic effects of nanosilver. Additionally, Kim et al. 38 demonstrated that the nanosilver-induced apoptosis can be, in part, due to p53. The aim of the present study was to evaluate the cytotoxicity of nanosilver at various doses on HepG2 cells and L02 cells and to investigate the mechanism of apoptosis induced.
Nanosilver exposure has the potential to induce hepatotoxic effects. Thus, we selected HepG2 and L02 cells to evaluate target organ specificity and compare toxic sensitivity. Cell viability is an important index of cytotoxicity, which is defined as the potential of a compound to induce cell death. In the present study, we used CCK-8 assay to determine cell viability. We also used PVP, a coating material for stabilizing the nanoparticles, and silver nitrate to compare the toxic effects with respect to different raw chemical compositions and forms of silver. The viability assay showed that the growth inhibitory rates of nanosilver to HepG2 cells were time- and dose-dependent, while L02 cell viability was not affected at a concentration of nanosilver below 80 µg mL−1 for 24 h. The result indicated that HepG2 cells are more sensitive than are L02 cells when exposed to nanosilver under the same concentration. Others 39 had similar results with HepG2 and L02 cells treated with gold nanoclusters. The toxicity of nanosilver reportedly depends largely on the release of silver ions. 40 However, we found little inhibitory effect of released silver ion solution on cell viability, whereas silver nitrate solution was severely cytotoxic to both cell lines. This difference could be because the silver nanoparticles used in the present study were coated with PVP, an inert biodegradable material, which blocked the release of silver ions in the test system. In this study, the effect of nanosilver on cell viability of HepG2 and L02 cells was mainly induced by silver nanoparticles. Based on the observation of cell viability, in the nanosilver concentration range of 20–160 μg mL−1, viability decreased more for HepG2 cells than for L02 cells. The cell survival of both HepG2 and L02 cells could be maintained at over 70% of control at 24-h exposure. Thus, we selected 20–160 μg mL−1 in the subsequent experiments.
LDH is a relatively stable enzyme in cells and can leak out only when the cell membrane is broken. 41 In this study, LDH leakage of both HepG2 and L02 cells increased in a time- and dose-dependent manner after exposure to nanosilver. However, LDH leakage was more in HepG2 cells than in L02 cells when exposed to the same concentration of nanosilver. LDH leakage indicates that exposure to nanosilver can affect cell membrane integrity and cause damage to both kinds of cells, but the effect is greater on HepG2 cells than on L02 cells. In summary, HepG2 cells were more sensitive than L02 cells to the cytotoxic effects of nanosilver.
To analyze the mechanisms of hepatotoxicity induced by nanosilver, the intracellular distribution of nanosilver was observed with TEM (Figures 4 and 5). After exposure for 24 h, nanosilver was found dispersed around cell membranes, whereas after 48-h exposure, aggregated nanosilver particles were present in the cytoplasm. The cellular internalization of nanosilver may be crucial for its biological effects. 25 We found that the black silver particles were present in the mitochondria or endocytotic vesicles of the HepG2 cells and L02 cells. It is possible that silver nanoparticles damage the structure of the organelles with which they are in direct contact, such as the mitochondrial membrane, and cause cell damage. Cellular uptake of silver nanoparticles has been seen in various cell types, such as human mesenchymal stem cells, primary T cells, primary monocytes, and astrocytes. 42 –44 Studies showed that single or clustered nanoparticles were attached to the cell membrane, internalized into cells, and distributed throughout the cytoplasm, but they were not present in the nucleus. The cytotoxicity of nanosilver was correlated with its uptake by cells: the more nanosilver was internalized, the greater was the toxicity. 45 In our study, the damaged cell morphology was more severe in HepG2 cells than in L02 cells. However, quantitative analysis of nanosilver levels in both cell types was not possible because of the limitations of quantification.
Little is known about the mechanism of nanosilver-induced toxicity, but cellular oxidative stress may be responsible for cytotoxicity of nanomaterials in general. 18,25,46 In the present study, apoptosis increased and MMP decreased in both cell types in a dose- and time-dependent manner in cells treated with 20–160 µg mL−1 of nanosilver, but the effect was more in HepG2 cells than in L02 cells. Also, nanosilver caused the generation of ROS in a dose-related manner in HepG2 cells, but not in L02 cells. ROS and the resulting oxidative stress are pivotal in apoptosis. 47 ROS produced by nanoparticles has induced mitochondrial membrane permeability and hence disturbance of the respiratory chain to trigger apoptosis. 48,49 Nanosilver-induced apoptosis has been demonstrated in many kinds of human-derived cells, such as colon cancer cells, hepatoma cells, Jurkat T cells, and HeLa cells, and in animal-derived cells, including mouse blastocysts, NIH3T3, and L929 fibroblasts. 20,21,43,50 –54 Sun et al. 55 investigated the neurotoxicological effects of nanosilver and silver ions with rat cerebral astrocytes; silver nanoparticles increased caspase activities and induced cell apoptosis under cytotoxic level of exposures, while silver ions compromised cell membrane integrity and caused cell necrosis. AshaRani et al. 25 also indicated that only a small percentage of fibroblasts was undergoing apoptosis and necrosis at higher concentrations of Ag-starch nanoparticles, while an increase of cell death observed was due to late apoptosis and necrosis. Flow cytometry assay based on FITC-labeled Annexin-V and PI double staining permitted direct evaluation of the proportions of the cells going through necrosis and apoptosis. Nanosilver increased cell apoptosis, and the proportions of necrotic cells were less than 0.8% for both HepG2 and L02 cells under the tested concentrations. Our finding that nanosilver affected liver cancer cells more than healthy cells is consistent with the cytotoxicity results of Tsoli et al. 56 Also, Li et al. 57 reported that polypolex inhibited the growth of HepG2 cells and induced apoptosis but did not affect the L02 cell line, a difference they attributed to differences in uptake between the tumor cells and normal cells. The sensitivity of neoplastic hepatocytes to nanosilver suggests that it may induce anticancer effects when used in bioimaging and drug delivery. More comparative studies of cancer cell lines and healthy cell lines, and more comprehensive observation of cellular uptake of nanosilver, should be addressed in future studies.
Several studies have shown that silver nanoparticles trigger apoptosis via ROS generation in in vitro systems. 58,59 However, the role of ROS in nanosilver-induced hepatoma cell damage is unclear. To explore the possible molecular mechanisms of nanosilver-mediated cell damage, we measured changes in the levels of regulators involved in apoptosis. Mitochondria are important signaling centers during apoptosis, and loss of mitochondrial integrity can be induced or inhibited by many regulators of apoptosis. 60,61 In many cases, oxidative stress induces cascade activation through cytochrome c release from the mitochondrial inter-membrane space into the cytosol. 60,62 Our studies provided evidence for a molecular mechanism by which silver nanoparticles induce cell damage via the generation of ROS and induction of apoptosis. Nanosilver induced mitochondrial release of cytochrome c and loss of MMP. During the apoptotic process, Bcl-2 prevents the opening of mitochondrial membrane pores, whereas Bax induces the opening of the pores. 63 We showed that loss of MMP by nanosilver is a result of downregulation of Bcl-2 and upregulation of Bax. Cytochrome c release initiates a cascade that leads to activation of caspase 3 and caspase 9. 64,65 Our results also demonstrated that cytochrome c was released from mitochondria into the cytoplasm, followed by activation of caspase 9 and caspase 3. Lee et al. 66 reported that silver nanoparticles led to apoptosis of mouse embryonic fibroblasts via mitochondria-dependent and caspase-dependent pathways related to oxidative stress. Piao et al. 67 also reported that silver nanoparticles induced oxidative cell damage in human Chang liver cells through the induction of mitochondria-involved apoptosis; the expression of NF-κB was decreased and caspase 8 was activated with increase in exposure level of nanosilver. The results indicated that ROS-evoked activation of Fas was accompanied by downregulation of NF-κB, activation of pro-caspase 8, and downstream of pro-caspase 3. Several studies have reported that nanoparticles induced cell death through the Fas death receptor pathway in apoptosis. 68,69 These findings provide new insight into the mechanisms of apoptosis induced by nanosilver. While, evidence suggests that nanosilver particles can be internalized via macrophages, we have also considered that a protein or a membrane channel could be involved in the mechanism of nanosilver-induced apoptosis by facilitating the entry of particles into cells, such as cancer cells. This topic may be attractive for future investigation.
In conclusion, the present study was undertaken to compare the cytotoxicity of nanosilver exposure on HepG2 cells and L02 cells at various doses of nanosilver and to investigate the mechanisms of apoptosis induced by nanosilver. Exposure to nanosilver resulted in increased cytotoxicity, induction of apoptosis, and mitochondrial injury in the HepG2 cells and L02 cells, but generation of ROS only in HepG2 cells. The cytotoxicity of nanosilver to HepG2 cells was more severe than to L02 cells, a difference that could be attributed to nanosilver inducing ROS production in the HepG2 cells but not in the L02 cells. Silver nanoparticles led to apoptosis of HepG2 cells via mitochondria-dependent and the Fas death receptor pathways related to ROS generation. These findings provide toxicological and mechanistic information that can help in assessing the effects of nanosilver in biological systems, including the potential for anticancer activities.
Supplemental Material
Supplemental Material, Apoptotic_pathway_of_nanosilver_Fig_S1 - Comparative cytotoxicity and apoptotic pathways induced by nanosilver in human liver HepG2 and L02 cells
Supplemental Material, Apoptotic_pathway_of_nanosilver_Fig_S1 for Comparative cytotoxicity and apoptotic pathways induced by nanosilver in human liver HepG2 and L02 cells by Y Xue, J Wang, Y Huang, X Gao, L Kong, T Zhang, and M Tang in Human & Experimental Toxicology
Supplemental Material
Supplemental Material, Apoptotic_pathway_of_nanosilver_Fig_S2 - Comparative cytotoxicity and apoptotic pathways induced by nanosilver in human liver HepG2 and L02 cells
Supplemental Material, Apoptotic_pathway_of_nanosilver_Fig_S2 for Comparative cytotoxicity and apoptotic pathways induced by nanosilver in human liver HepG2 and L02 cells by Y Xue, J Wang, Y Huang, X Gao, L Kong, T Zhang, and M Tang in Human & Experimental Toxicology
Footnotes
Acknowledgments
The authors thank Dr Jianguo Niu (Harvard University) for advising on techniques for observing cell morphology and for helpful discussions.
Declaration of Conflicting Interests
The author(s) declared no potential conflicts of interest with respect to the research, authorship, and/or publication of this article.
Funding
The author(s) disclosed receipt of the following financial support for the research, authorship, and/or publication of this article: This work was financially support by a Grant from National Natural Science Foundation of China (Nos 81573186, 81502783, 81473003) and the Fundamental Research Funds for the Central Universities (No. 2242016K40019).
Supplemental Material
Supplemental material for this article is available online.
References
Supplementary Material
Please find the following supplemental material available below.
For Open Access articles published under a Creative Commons License, all supplemental material carries the same license as the article it is associated with.
For non-Open Access articles published, all supplemental material carries a non-exclusive license, and permission requests for re-use of supplemental material or any part of supplemental material shall be sent directly to the copyright owner as specified in the copyright notice associated with the article.