
Abstract
A total of 66 male Wistar rats were used and six groups (control: 10 animals and experimental: 12 animals) were formed. While a separate control group was established for each study period, mad honey application to the animals in the experimental group was carried out with a single dose (12.5 g kg−1 body weight (b.w.); acute stage), at a dose of 7.5 g kg−1 b.w. for 21 days (subacute stage), and at a dose of 5 g kg−1 b.w. for 60 days (chronic stage). Tissue and blood oxidative stress markers (malondialdehyde (MDA), nitric oxide (NO), 4-hydroxynonenal (HNE), superoxide dismutase, catalase, glutathione (GSH) peroxidase, and glucose-6-phosphate dehydrogenase), hepatic chemical metabolizing parameters in the liver (cytochrome P450 2E1, nicotinamide adenine dinucleotide (NADH)-cytochrome b5 reductase, nicotinamide adenine dinucleotide phosphate (NADPH)-cytochrome c reductase (CYTC), GSH S-transferase (GST), and GSH), and micronucleus and comet test in some samples were examined. Findings from the study showed that single and repeated doses given over the period increased MDA, NO, and HNE levels while decreasing/increasing tissue and blood antioxidant enzyme activities. From hepatic chemical metabolizing parameters, GST activity increased in the subacute and chronic stages and CYTC activity increased in the acute period, whereas GSH level decreased in the subacute stage. Changes in tail and head intensities were found in most of the comet results. Mad honey caused oxidative stresses for each exposure period and made some significant changes on the comet test in certain periods for some samples obtained. In other words, according to the available research results obtained, careless consumption of mad honey for different medical purposes is not appropriate.
Keywords
Introduction
Mad honey poisoning occurs after the consumption of honey containing grayanotoxin (GTX) found in the nectar and pollen collected by honey bees from Rhododendron species of the family Ericaceae growing extensively on the mountains of Turkey’s eastern Black Sea region and in other countries such as Japan, Nepal, and Brazil and also in the region of North America and Europe. 1 –3 Mad honey is often used in complementary medicine. GTXs are also called andromedotoxins, rhodotoxin, and acetylandromedol. 4 These plant toxins are diterpenes 4 and have a closed chemical structure of C22H36O7 (GTX-I), 5 C20H32O5 (GTX-II), 6 and C20H34O6 (GTX-III). 5 These toxic components block voltage-gated sodium channels. 3,7 –9 By means of this action mechanism, the toxins exhibit a great many effects on the cardiovascular, 8 –14 respiratory, 1,13,15,16 renal, 17,18 liver, 17,19,20 and autonomic/central nervous systems. 16,21,22 Symptoms of GTX/mad honey intoxication are hypotension, bradycardia, nausea, vomiting, sweating, dizziness, impaired consciousness, fainting, blurred vision, and salivation. 13,16,21 –24
Oxidative stress can be defined as the increase of the generation of free radicals in cells or tissues. 25 Oxidative stress develops upon the disturbance of the equilibrium status between the defense system and oxidant production of the organism. Oxidative stress can be generally defined as the oxidative deterioration of membrane lipids. 26 –29 Malondialdehyde (MDA) is a product generated upon the oxidative deterioration of some natural macromolecules and is in the form dependent on free or bound to certain biologic structures. 25,27,30 Nitric oxide (NO) is produced at the cellular level in the biological system during oxidative stress process. 31,32 4-Hydroxynonenal (HNE) is the main product of oxidative stress and is also one of the biomarkers for oxidative stress. 33 –35 Superoxide anion is generated in living cells during mitochondrial respiration or abnormal activation of the enzymatic system such as nicotinamide adenine dinucleotide phosphate (NADPH) oxidase and xanthine oxidase. Superoxide dismutase (SOD) reacts with NO and superoxide anion, resulting in a strong inhibitory effect on peroxynitrate and peroxynitrite (ONOO) formation. SOD converts superoxide anions into hydrogen peroxide (H2O2) through metal ions such as copper and iron in the physiological environment. 25 –27,33,36 Catalase (CAT) converts 2H2O2 molecules into 2H2O and O2. The intracellular H2O2 sources are mitochondria, and at the same time, CAT plays an important role in removing this increasing radical. 25,27,30,33 Glutathione peroxidase (GSH-Px) is a selenoenzyme which plays an important role primarily in protecting against harmful effects caused by hydroxyperoxides in the cell by GSH. 31,37 Glucose-6-phosphate dehydrogenase (G6PD) has an important role in the protection of cells against oxidant-induced damage. 38 The first mechanism in occurring of oxidative stress is the elevations of free radical generation. 29,31,33,39 The other mechanism is insufficiency of enzymatic and nonenzymatic cellular antioxidant defense system. 28,33,34,40 One of the most important toxic effect mechanisms of toxic components or disease is the high level of free radical generation potentials. 18,19,26,29,33,41,42 Frequently used methods to assess possible oxidative stress potential of these free radicals include measuring blood and tissue MDA, NO, and HNE levels. 25,27,31,33 –35 On the other hand, one of the preferred methods for demonstrating any changes in the antioxidant mechanism is the evaluation of antioxidant enzymes. CAT, SOD, GSH-Px, and G6PD are among these enzymes and are evaluated according to the activities of these enzymes. 26 –28,31,38
Hepatic chemical metabolizing enzymes are involved in the conversion of components that are not necessary for the physiological system into less effective, ineffective, or, in turn, more toxic metabolites. 43 –45 Within this process, there is also a high level of free radical formation in the biological system. 46 On the other hand, enzymes involved in metabolism following elimination and biological components involved in the conjugation reaction also have important effects in reducing and limiting toxicity. 44 GSH, GSH-s-transferase (GST), NADH-cytochrome b5 reductase (CYPB5), NADPH-cytochrome c reductase (CYTC), and cytochrome P450 2E1 (CYP2E1) are important parameters in this respect. 47 –52 On the other hand, comet and micronucleus are the most frequently used tests that determine the genotoxic effects of the compounds. 53
Mad honey causes multiple side and toxic effects associated with GTX content and its consumption. 3,10 –13,15,20,23,24,54 –57 Although mechanism of toxic effect of GTX 8,9,58 –61 and its some toxic effect have been revealed in humans 3,10 –13,15,20,23,24,54 –57 and animals, 17,19,62 data on the effects of oxidative stress of mad honey or GTX 18,19 are limited. No previous studies on chemical metabolizing enzyme and genotoxic effects of mad honey or GTX have been found. The aim of the study is to determine the potential adverse effects that can occur in tissues and organs at different dose intervals in single and repeated exposures of honey, which are frequently consumed for different purposes 63,64 Mad honey can create very different and independent effects on the biological system. This was investigated to determine the possible effects on liver and kidney tissue, which is at the forefront of metabolism and elimination. In addition, heart tissue in terms of cardiovascular system and brain tissue samples from the other side for effects on the central nervous system were taken from all groups and evaluated. For the possible effects on the reproductive system of the mad honey, testicular tissue was evaluated. In order to get an idea of the effects on the general physiological system, some evaluations were made on blood samples. In addition, analysis of some metabolizing enzymes and some parameters involved in intoxication/detoxification pathway was carried out. In order to show possible genotoxic effects, comet and micronucleus tests, which are the most used tests in this area, have been performed. So in short, in this study, possible multiple toxic and genotoxic effects of mad honey and its severity were evaluated with regard to oxidative stress markers, hepatic chemical metabolizing parameters, and comet and micronucleus test.
Material and method
Animal material
Sixty-six adult Wistar male rats (150–200 g in weight) were used in the study. A total of six groups were formed, the rats were kept in room conditions (20–22°C) during the 12-h day/12-h night periods and animals were set in plastic cages with a maximum of four rats per cage. While a separate control group was established for each study period, mad honey application to the animals in the experimental group was carried out with a single dose (12.5 g kg−1 body weight (b.w.); group 1, control n: 10; group 2, experimental n: 12); acute stage), at a dose of 7.5 g kg−1 b.w. for 21 days (group 1, control n: 10; group 2, experimental n: 12; subacute stage), and at a dose of 5 g kg−1 b.w. for 60 days (group 1, control n: 10; group 2, experimental n: 12; chronic stage). The dose used was determined by taking into account the LD50 values of GTX 65,66 as well as previous studies with mad honey. 18,19,67 All mad honey applications were made directly into stomach by gavage without using vehicle. Research protocol was received the approval of Erciyes University experimental animals Ethical Board.
GTX analysis
Mad honey used in the study is a commercial product collected by beekeepers that produce bees from Rhododendron species flowers in different areas of the Black Sea region. The content and type analysis of GTX in mad honey was carried out at the TUBİTAK Marmara Research Center of the Scientific and Technological Research Council of Turkey. GTX-I and GTX-III levels in mad honey were measured in liquid chromatography tandem mass spectrometry instrument according to the method reported by Kaplan et al. 68 in the abovementioned institute as procurement of services. According to reports by Kaplan et al. 68 , the GTX-I and -III of mean values of recovery and detection limit was calculated as 97.32% and 12 μg kg−1, and 96.28% and 10 μg kg−1, respectively.
Collecting samples and preparing for analysis
At the end of trials, whole blood samples for biochemical analysis were taken from experimental animals to tubes with heparin or without anticoagulant by exposure to light ether anesthesia. Liver, kidney, brain, heart, and testes tissues were excreted after the death of the experimental animals. The blood samples were subjected to centrifugation at 6000 × g for 10 min, and the plasma/serum obtained was transferred into separate tubes. Plasma samples were used to measure MDA and NO levels. After platelets/leukocytes were discarded, the residual erythrocyte layer was washed three times with phosphate-buffered saline solution and then diluted to the same volume in the same solution. Subsequently, the erythrocytes were hemolyzed by adding ice-cold phosphate-buffered saline solution at a rate of 1/5 (v/v). Hemolysates were used for the determination of hemoglobin level, CAT, and GSH-Px activity. To determine blood SOD activities, the chloroform/ethanol solution (3/5 v/v) was vortexed by adding equal volumes into the hemolysate and then centrifuged at 6000 × g at +4°C for 10 min. The upper phase in the tube was pipetted for analysis. 69
The tissues extracted from the rats were washed with ice-cold phosphate-buffered solution before homogenization and at the same time, the fat and collagen tissues were cleaned. Tissues were then homogenized with phosphate-buffered solution (pH: 7.4) under external cooling in ice-water and centrifuged for 60 min at 40,000 × g at +4°C. Supernatants were transferred into eppendorf tubes to measure CAT and GSH-Px activities as well as MDA, NO, and protein levels. The tissue supernatant was added to an equal volume of a chloroform/ethanol mixture (3/5 v/v), vortexed and centrifuged at 6000 × g at +4°C for 10 min, and the top layer was removed so that extraction was completed to determine SOD activities and used for top phase analysis. Not yet used liver supernatants were centrifuged at 105,000 × g at +4°C for 60 min again and obtained cytoplasmic microsomal fraction obtained for assay of hepatic chemical metabolizing parameters. All samples were stored at −80°C until analyzed.
Sample analysis
The level of MDA was measured in the separated plasma/homogenized tissue samples using the method of Yoshioka et al. 70 and Ohkawa et al. 71 Erythrocyte hemoglobin levels and SOD, CAT, and GSH-Px activities were analyzed by the method of Fairbanks and Klee, 72 Luck, 73 Sun et al., 74 and Paglia and Valentie, 75 respectively. Tissue protein assay was made with the method of Lowry et al. 76 and modified by Miller. 77 NO analyses were performed by the method of Tracey et al. 78 CYP2E1 analysis was made according to Yoo et al.’s method. 79 The estimation CYPb5 activity was done by the method of Strittmatter and Velick. 80 CYTC (NADPH-cytochrome P450 reductase) analysis was performed by the method of Dignam and Strobel. 81 GST activity was determined using the method of Warholm et al. 82 The measurement of GSH levels was performed in accordance with Beutler’s method. 83 G6PD was measured by Beutler’s method. 84 Comet and micronucleus assay was performed according to Tice et al. 85 and Fenech. 86 Serum HNE levels were measured using OxiSelect™ HNE Adduct Competitive ELISA kit.
Statistical analysis
SPSS 13.0 statistical program was used for statistical analysis of all data in the study. All data within the scope of the study were given as arithmetic means and standard deviations. Differences between the groups were determined using Mann–Whitney U test. In the measurement of significances, p < 0.05 level was selected.
Results
Analysis of GTX-I and GTX-III in mad honey
The amounts of GTX-I and GTX-III in the mad honey used throughout the experiments were determined to be 34.05 and 6.50 μg g−1, respectively.
Acute stage
There was a significant increase in MDA levels of liver (48%), kidney (26.78%), brain (56.46%), testes (72.41%), heart (20.21%), and plasma (31.82%) according to control group value. Similarly, the NO levels of liver, kidney, brain, testes, heart, and plasma samples were increased statistically; these changes were 31.16, 41.83, 31.51, 16.14, 23.01, and 16.17%, respectively, when compared with the values of control group. A significant reduction was observed in the activity of SOD in liver (36.36%), kidney (35.22%), and brain (31.25%) samples compared to the control group while a meaningful increase was determined in this enzyme activity of testes tissue (27.63%). There is an important decrease in CAT activities of liver (26.78%), kidney (26.64%), brain (40.72%), testes (28.52%), heart (22.31%), and erythrocytes (18.68%) according to the values of control group. GSH-Px activity of the liver (37.55%) was significantly higher than that of the control group, while there was a significant decrease in the kidney (25.94%), brain (33.26%), testes (39.80%), and heart (46.75%) tissues. A statistically meaning increase was detected in serum HNE level by 120.33% compared to the control group. Liver CYTC activity is significantly increased by 74.19% compared to the control group. In terms of comet assay, head intensity decreased statistically significant for the kidney (6.46%) and heart (17.75%) tissues according to the control group. There was a biologically significant increase in tail intensity for kidney (66.04%) and heart (105.68%) tissues while meaningful statistically decrease in tail intensity of blood (35.07%) and liver (25.57%) tissues. There are no statistically differences in other parameters of treatment group compared to control for this stage (Figures 1 to 14).

The effects on tissue and plasma MDA level of mad honey given to rats at specific doses in acute, subacute, and chronic periods. *p < 0.05; %, this data express an increase (+) or decrease (−) as a percentage of mean control values in the treatment group (mad honey) between the statistically significant difference groups. MDA: malondialdehyde.
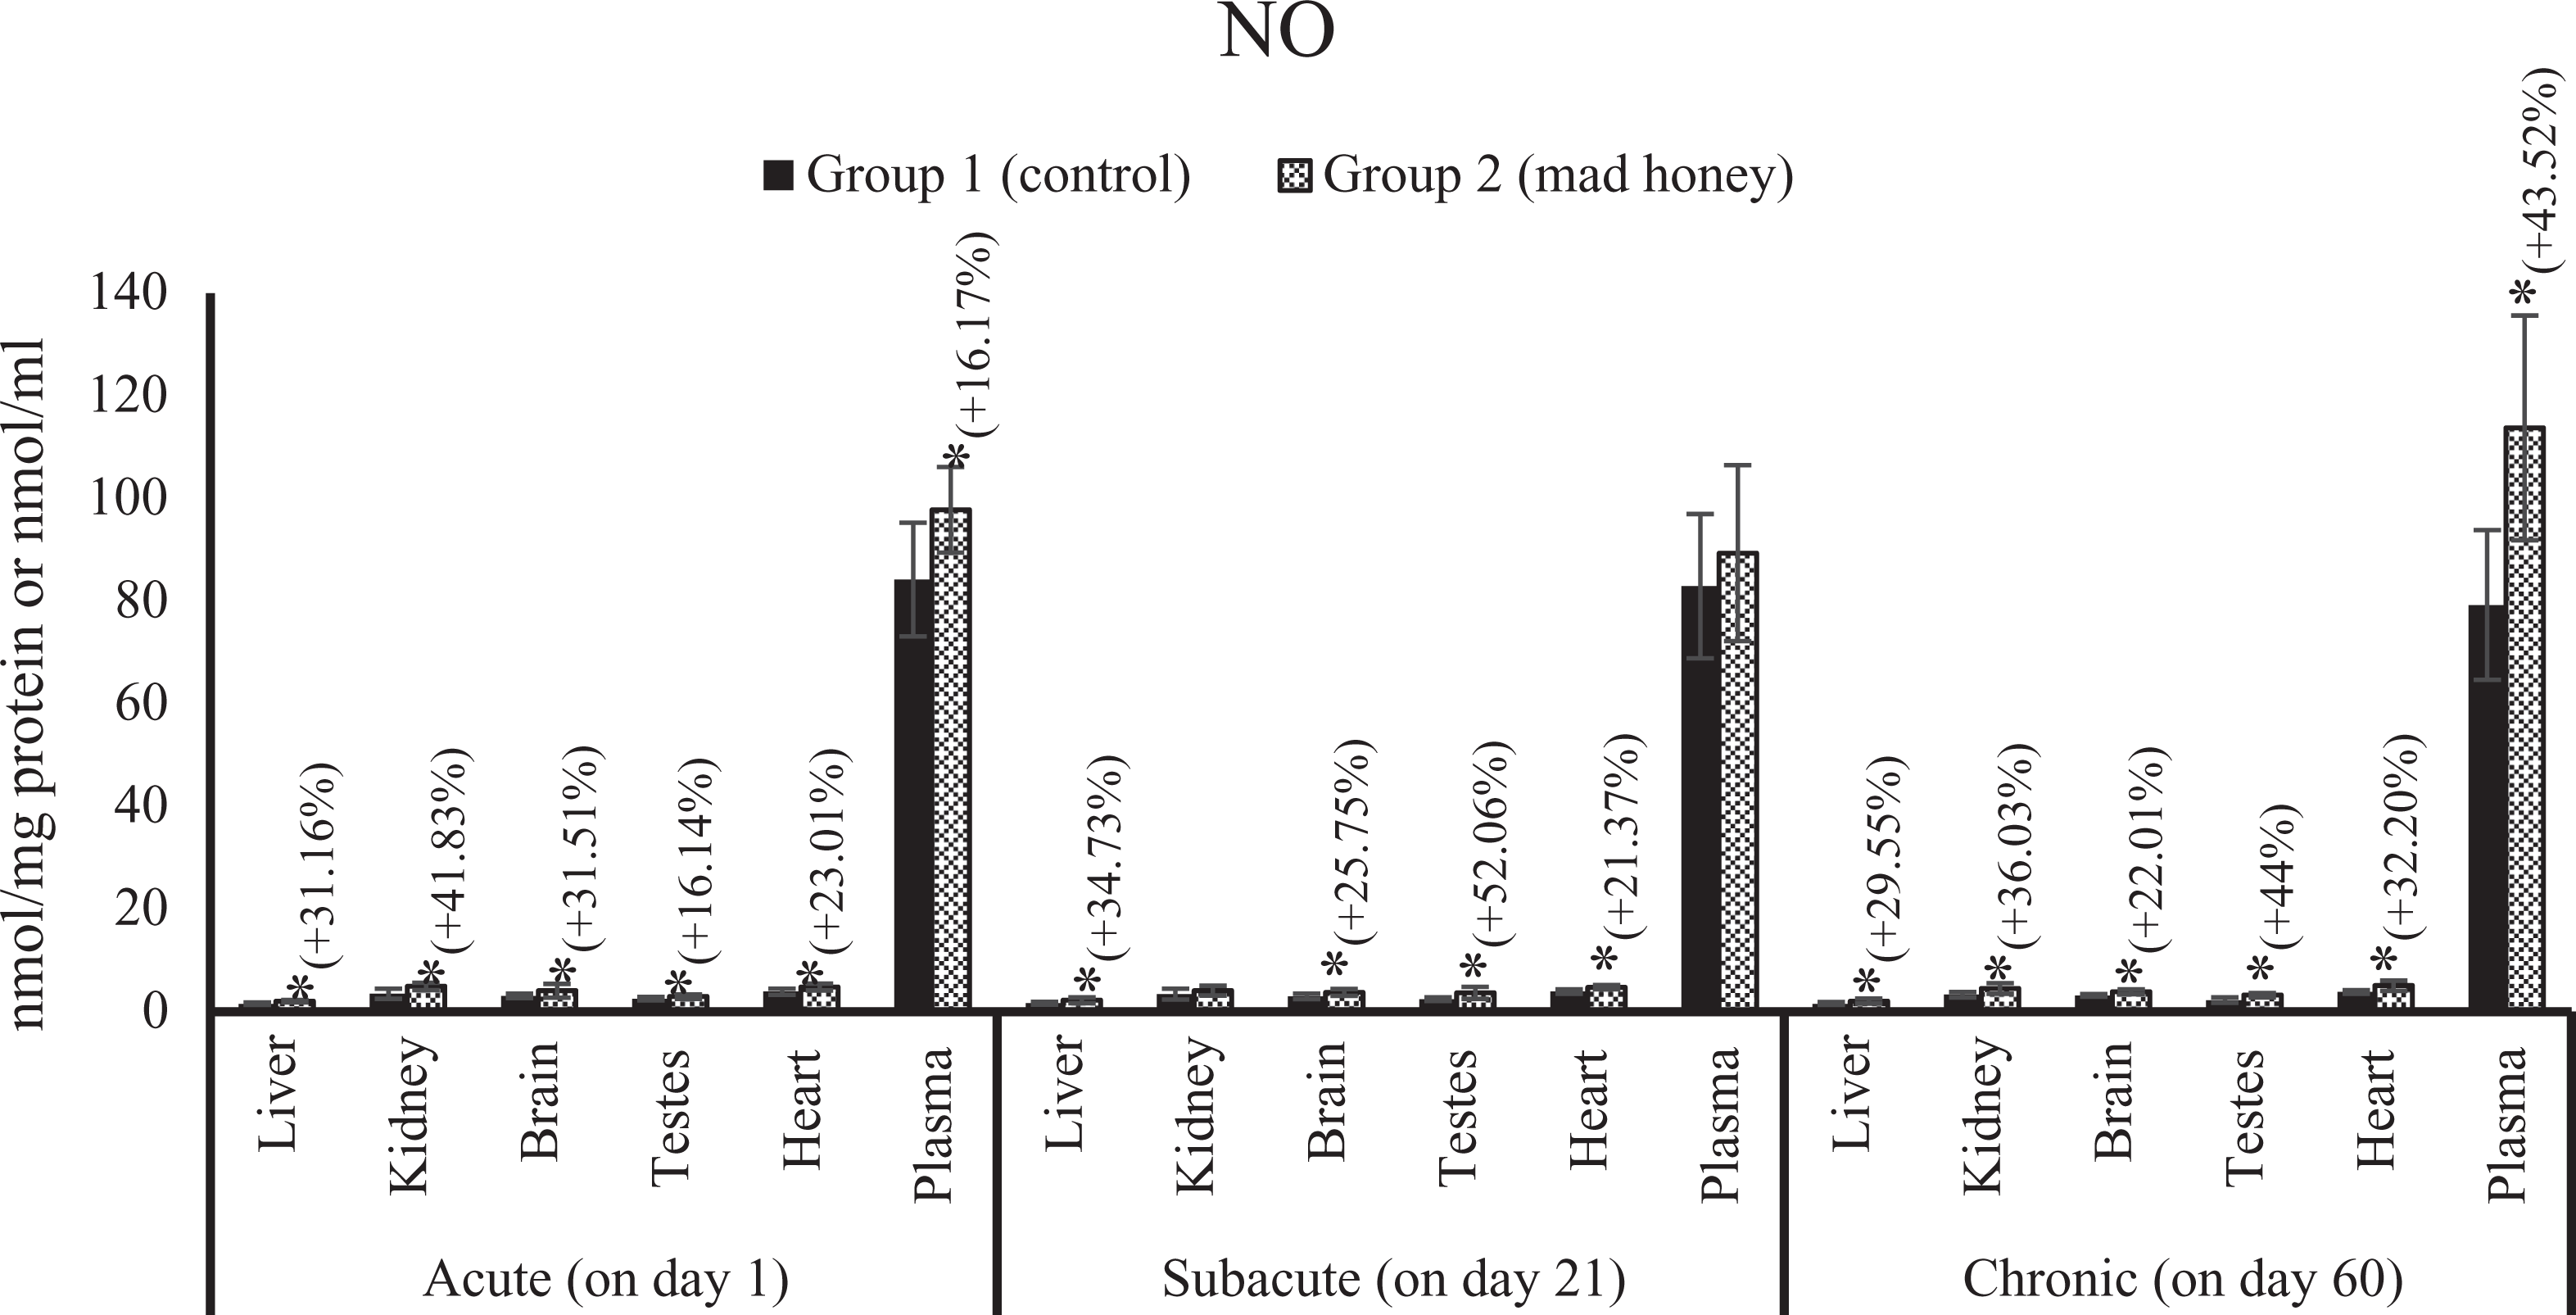
The effects on tissue and plasma NO level of mad honey given to rats at specific doses in acute, subacute, and chronic periods. *.p < 0.05; %, this data express an increase (+) or decrease (−) as a percentage of mean control values in the treatment group (mad honey) between the statistically significant difference groups. NO: nitric oxide.

The effects on tissue and erythrocytes SOD activity of mad honey given to rats at specific doses in acute, subacute, and chronic periods. *p < 0.05; %, this data express an increase (+) or decrease (−) as a percentage of mean control values in the treatment group (mad honey) between the statistically significant difference groups. SOD: superoxide dismutase.
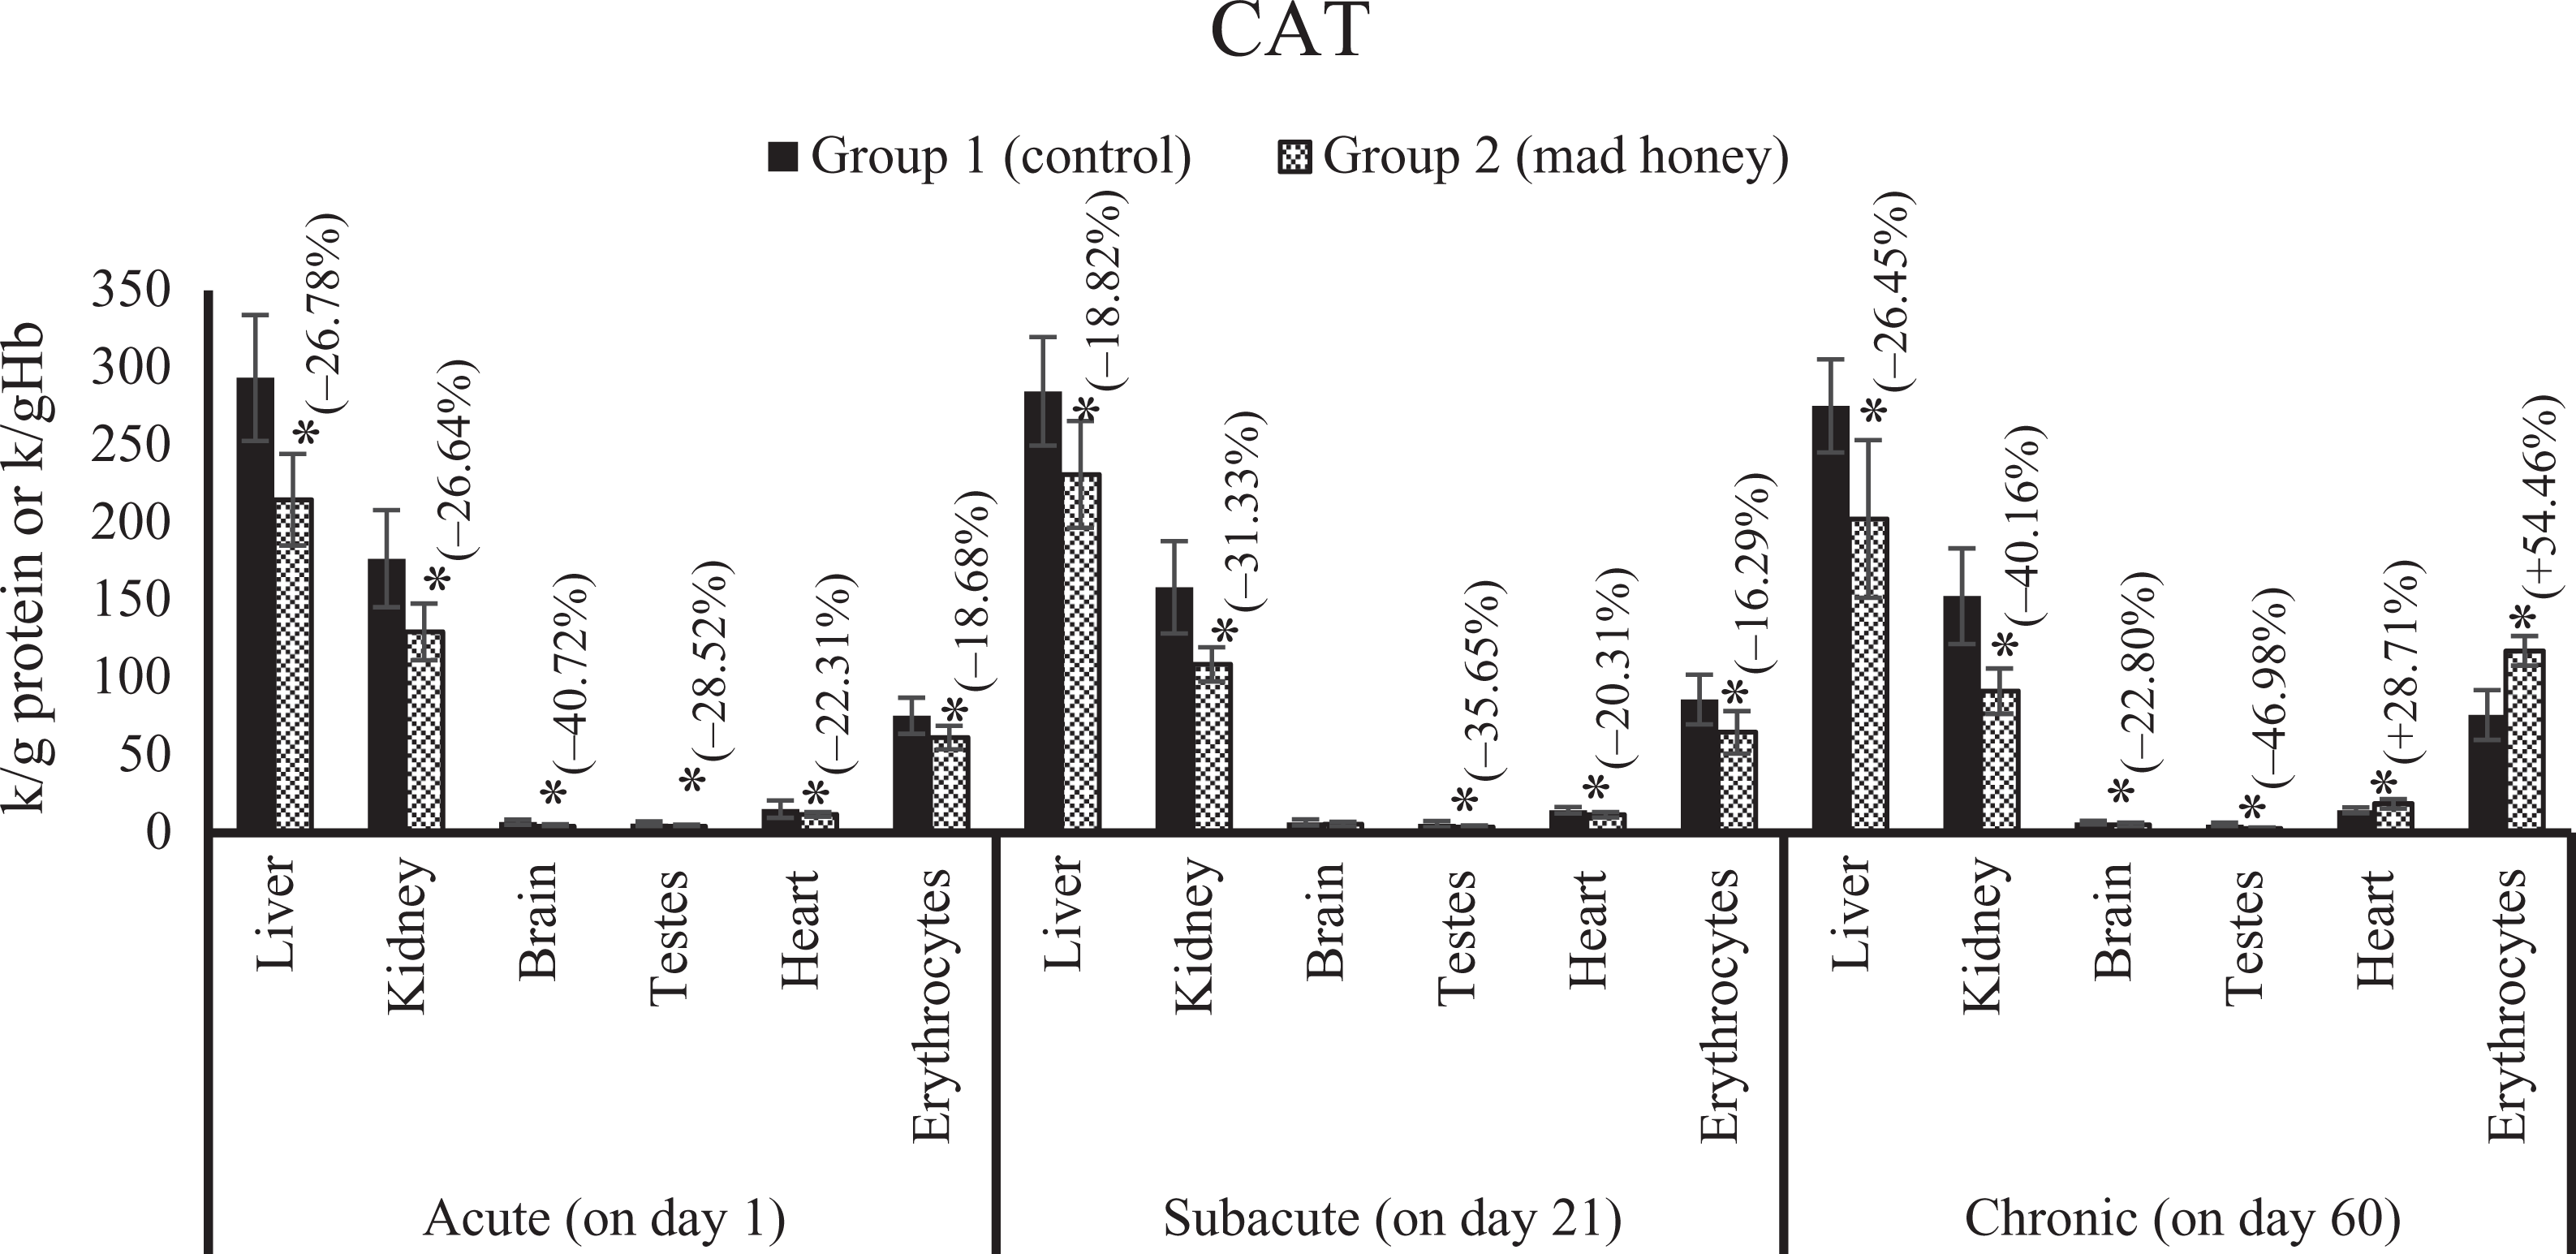
The effects on tissue and erythrocytes CAT activity of mad honey given to rats at specific doses in acute, subacute, and chronic periods. *p < 0.05; %, this data express an increase (+) or decrease (−) as a percentage of mean control values in the treatment group (mad honey) between the statistically significant difference groups. CAT: catalase.
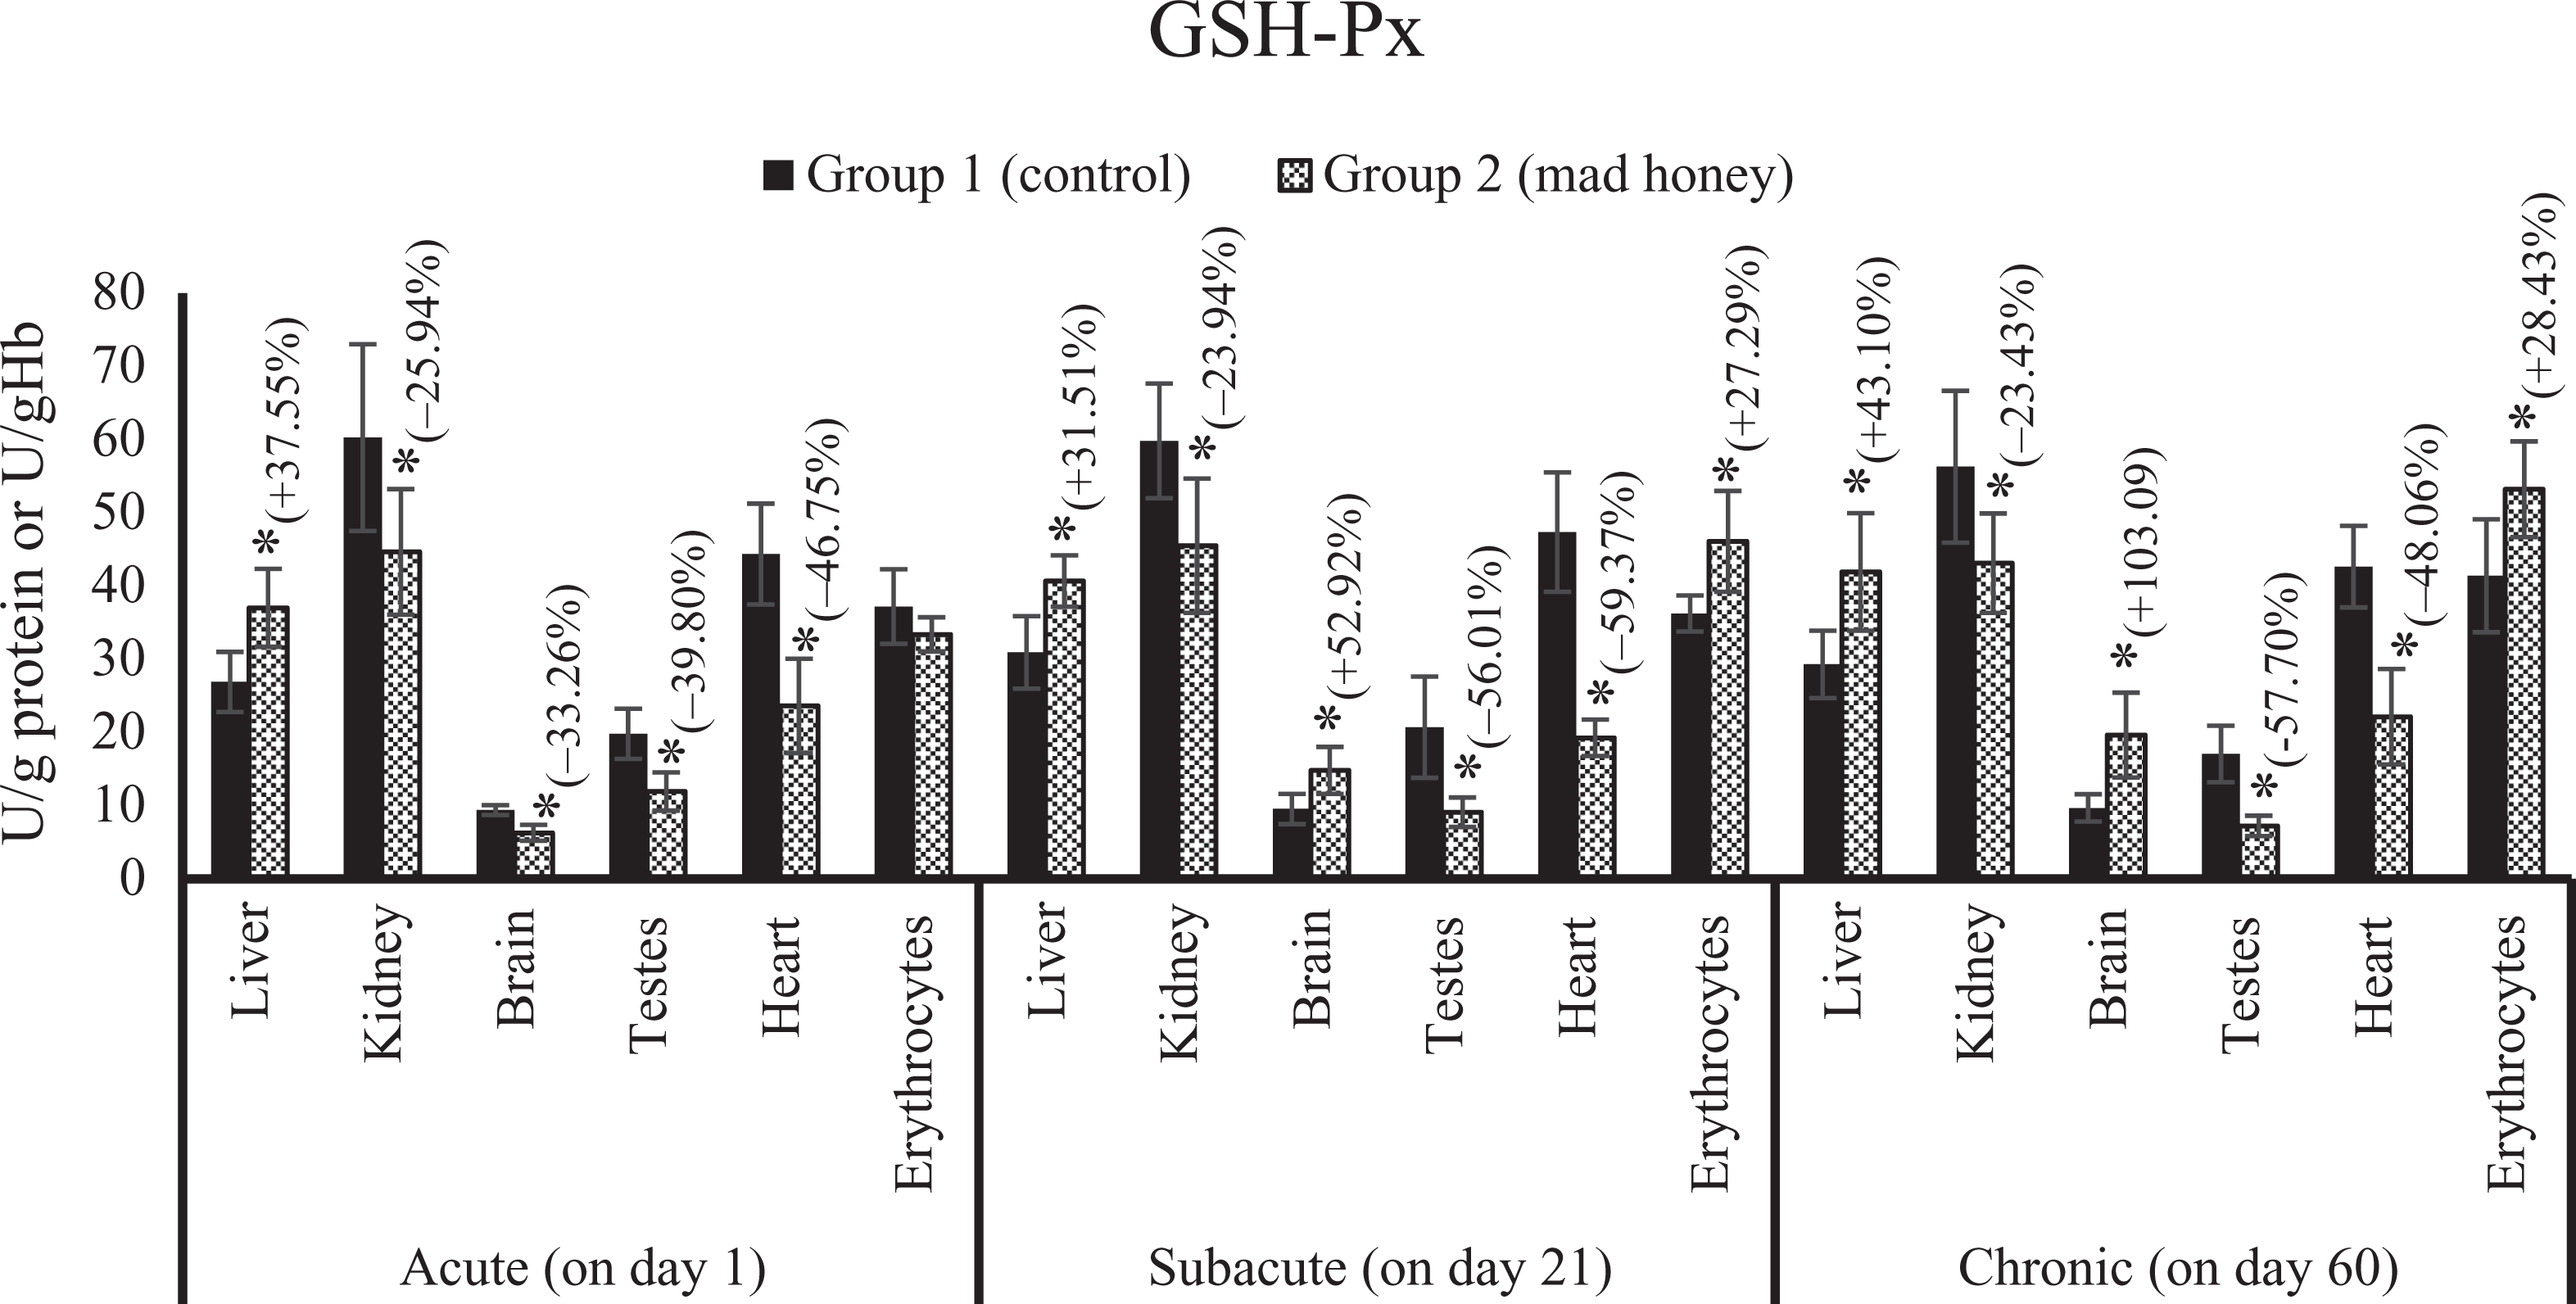
The effects on tissue and erythrocytes GSH-Px activity of mad honey given to rats at specific doses in acute, subacute, and chronic periods. *p < 0.05; %, this data express an increase (+) or decrease (−) as a percentage of mean control values in the treatment group (mad honey) between the statistically significant difference groups. GSH-Px: glutathione peroxidase.

The effects on serum HNE level of mad honey given to rats at specific doses in acute, subacute, and chronic periods. *p < 0.05; %, this data express an increase (+) or decrease (−) as a percentage of mean control values in the treatment group (mad honey) between the statistically significant difference groups. HNE: 4-hydroxynonenal.

The effects on GSH level in liver tissue of mad honey given to rats at specific doses in acute, subacute, and chronic periods. *p < 0.05; %, this data express an increase (+) or decrease (−) as a percentage of mean control values in the treatment group (mad honey) between the statistically significant difference groups. GSH: glutathione.
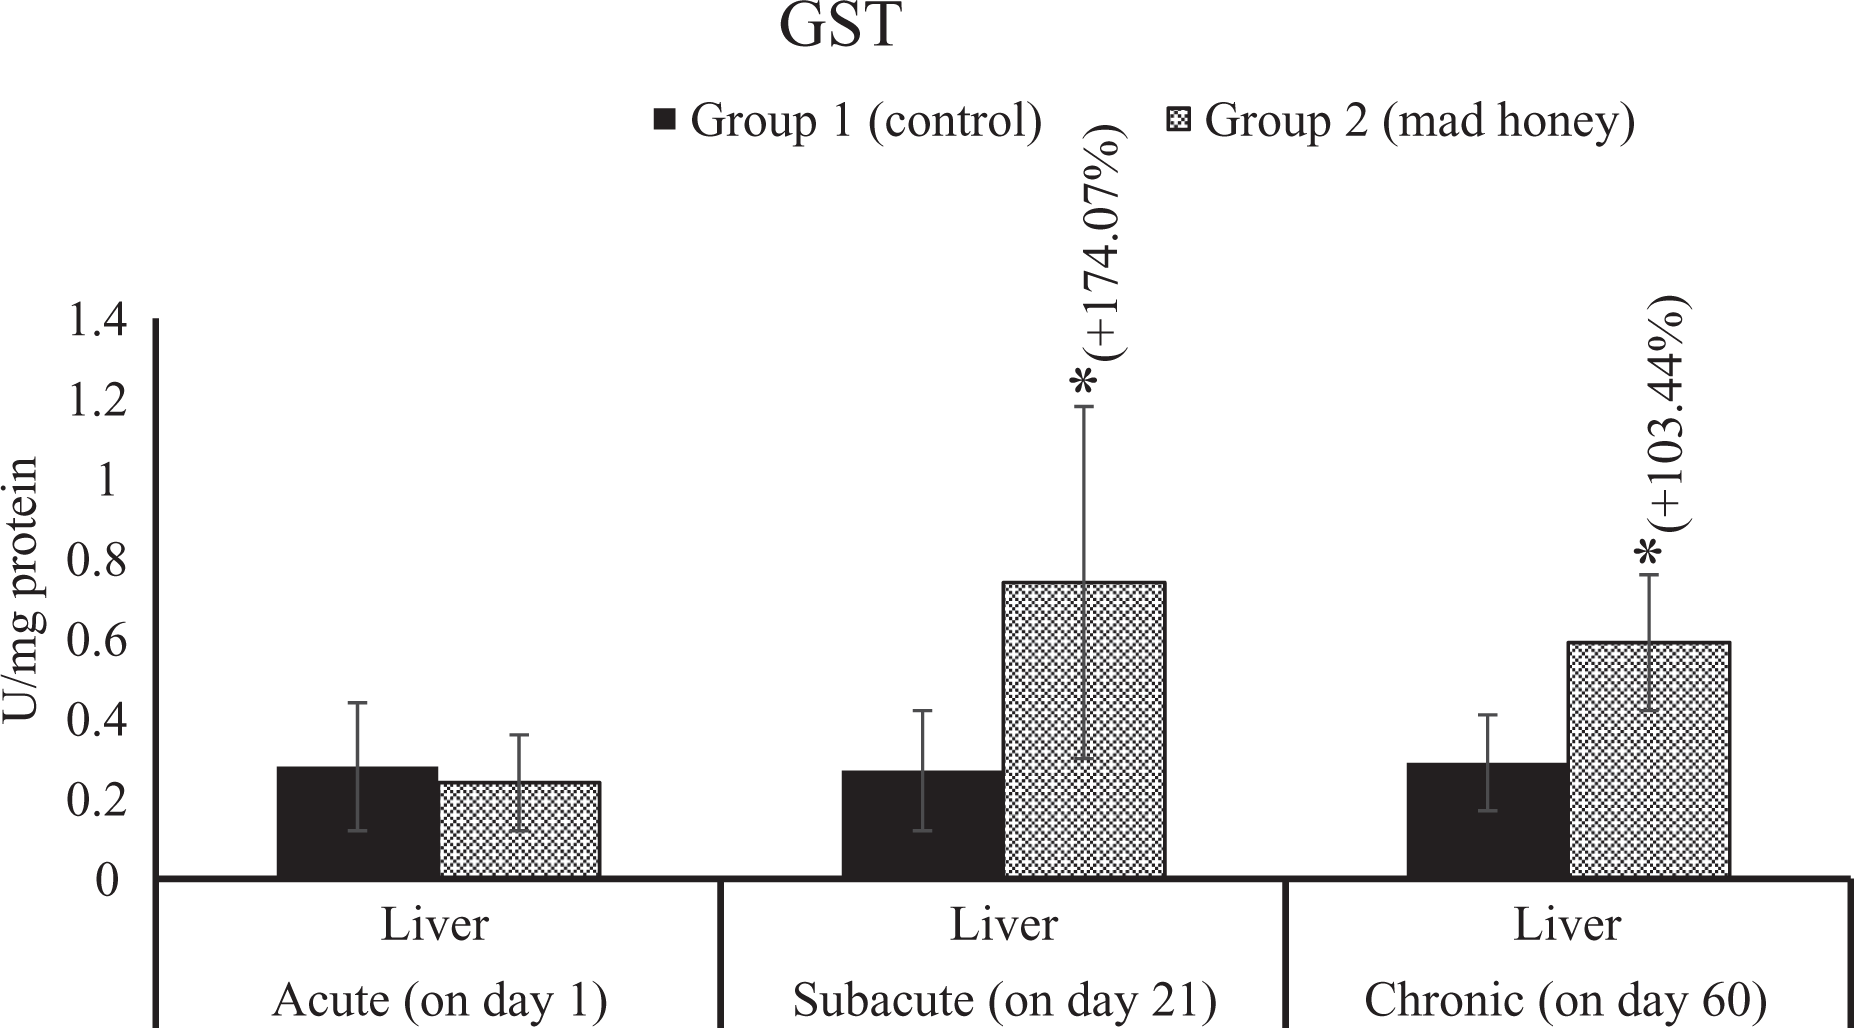
The effects on glutathione S-transferase (GST) activity in liver tissue of mad honey given to rats at specific doses in acute, subacute and chronic periods. *p < 0.05; %, this data express an increase (+) or decrease (−) as a percentage of mean control values in the treatment group (mad honey) between the statistically significant difference groups.

The effects on G6PD activity in liver tissue of mad honey given to rats at specific doses in acute, subacute, and chronic periods. G6PD: glucose-6-phosphate dehydrogenase.
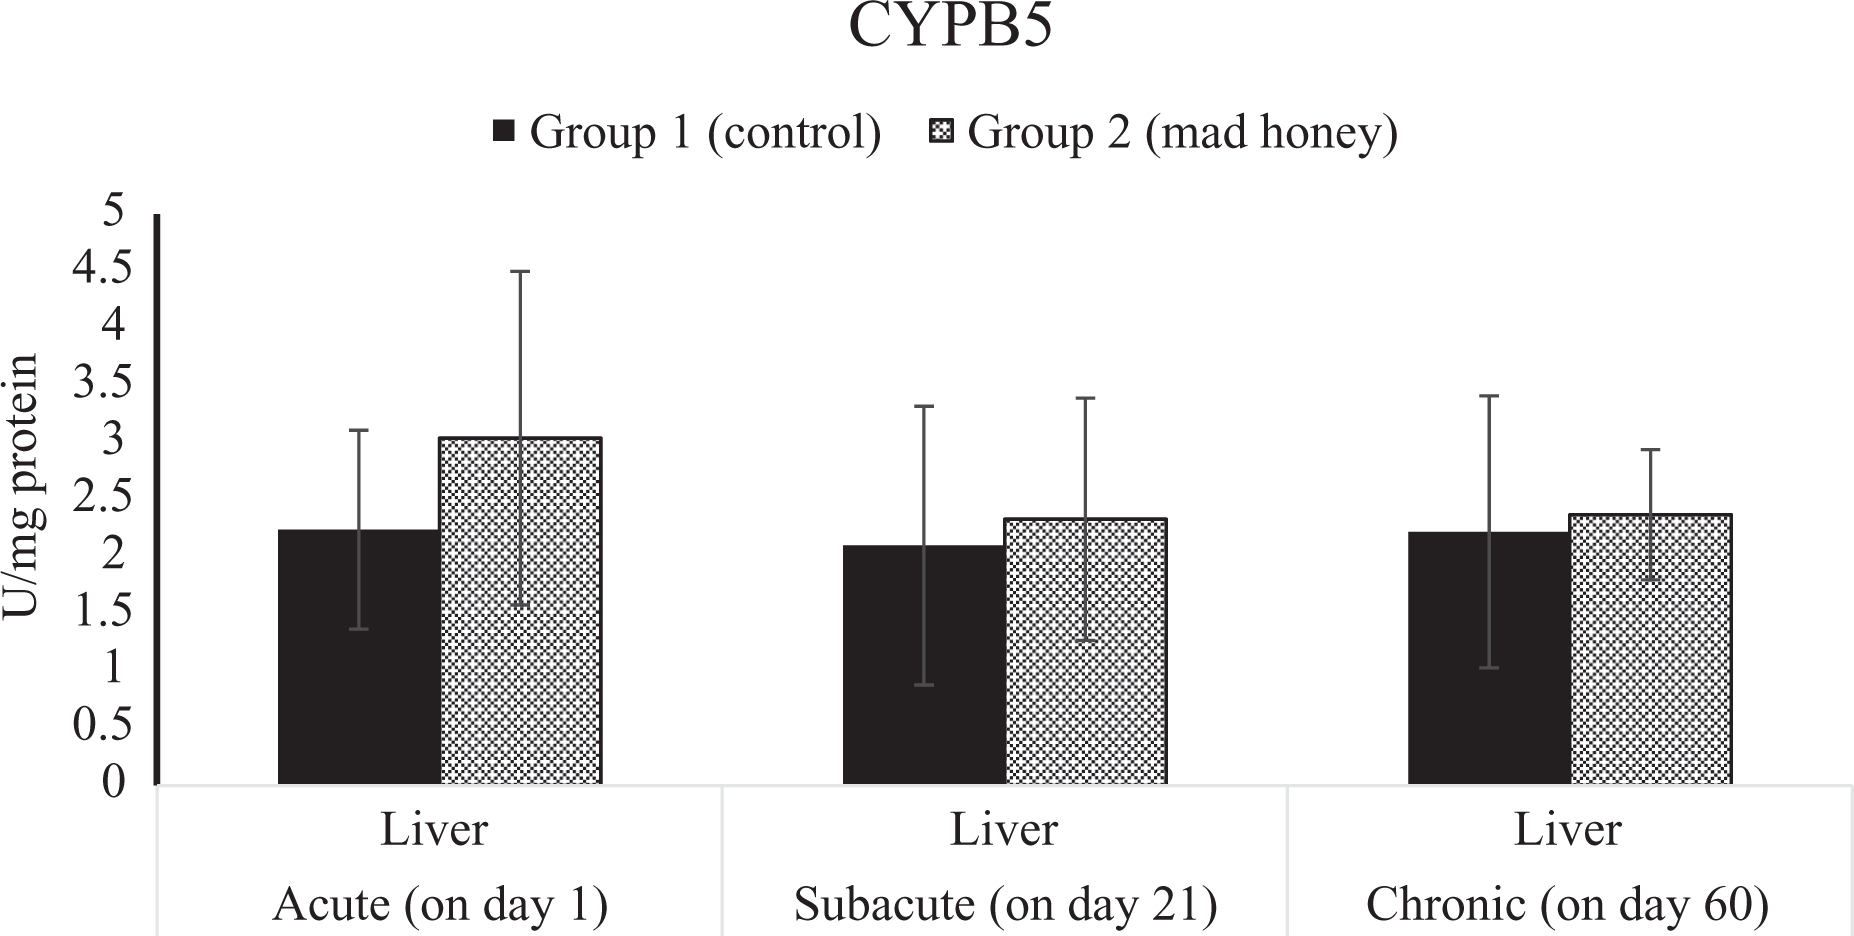
The effects on NADH- CYPB5 activity in liver tissue of mad honey given to rats at specific doses in acute, subacute, and chronic periods. CYPB5: cytochrome b5 reductase.

The effects on NADH- CYTC activity in liver tissue of mad honey given to rats at specific doses in acute, subacute, and chronic periods. *p < 0.05; %, this data express an increase (+) or decrease (−) as a percentage of mean control values in the treatment group (mad honey) between the statistically significant difference groups. CYTC: cytochrome c reductase.

The effects on CYP2E1 activity in liver tissue of mad honey given to rats at specific doses in acute, subacute, and chronic periods. CYP2E1: cytochrome P4502E1.

Comet assays in blood and tissues of mad honey given to rats at certain doses in acute, subacute, and chronic periods. *p < 0.05; %, this data express an increase (+) or decrease (−) as a percentage of mean control values in the treatment group (mad honey) between the statistically significant difference groups.

Micronuclei assays in bone marrow of mad honey given to rats at certain doses in acute, subacute, and chronic periods.
Subacute stage
There was a significant increase in MDA levels in the liver (54.16%), kidney (34.36%), brain (22.78%), testes (33.33%), heart (21.05%), and plasma (37.23%) when compared to the control group. In addition, NO levels significantly increased in liver (34.73%), brain (25.75%), testes (52.06%), and heart (21.37%) samples compared to the value of control group, while a significant decrease was observed in SOD activities of liver (34.48%), kidney (23.91%), and brain (23.84%) tissues compared to enzyme activity of control group, likewise a significant elevation in testes (28.76%) and erythrocytes (35.71%). CAT activity showed a significant decrease in liver (18.82%), kidney (31.33%), testes (35.65%), heart (20.31%), and erythrocytes (16.29%) according to the control group. GSH-Px activity showed a statistically remarkable increase in liver (31.51%), brain (52.92%), and erythrocytes (27.29%) according to the control group; in contrast, an important reduction was detected in the kidney (23.94%), testes (56.01%), and heart (59.37%) tissues. There was an important increase in serum HNE by 131.48% according to the control group. Liver GSH level (18.86%) statistically decreased in trial group compared to control group. There is an increase of 174.07% in liver GST activity. According to the control group, a significant decrease was found in blood (5.17%) and liver (5.19%) samples in terms of the head intensity in comet analysis. There was a statistically meaningful elevation in blood (56.60%), liver (77.82%), and kidney (67.11%) in terms of tail intensity. The other parameters examined were no difference between the control group and the treatment group for this period (Figures 1 to 14).
Chronic stage
Compared with the control group, there was a biologically important elevation in MDA levels in the liver (75.86%), kidney (82%), brain (24.39%), testes (44%), heart (59.45%), and plasma (50.74%). On the other hand, a significant increase was detected in the levels of NO in liver (29.55%), kidney (36.03%), brain (22.01%), testes (44%), and heart (32.20%) tissues and plasma (43.52%) samples when compared to control group values. Compared with control group values of SOD activity, there is a significant increase in the liver (39.28%), kidney (25.31%), testes (25.71%), heart (96.66%), and erythrocytes (50%); an important reduction was seen in the brain (18.24%) SOD activity. A biologically significant reduction was found in the liver (26.45%), kidney (40.16%), brain (22.80%), and testes (46.98%) compared to the CAT activity of control group, and there was a significant increase in CAT activities of the heart (28.71%) and erythrocytes (54.46%). GSH-Px activity showed a significant increase in the liver (43.10%), brain (103.09%), and erythrocytes (28.43%) according to the control group; in contrast, there is a significant decrease in the kidney (23.43%), testes (57.70%), and heart (48.06%) tissues. According to the control group, there is a significant increase in serum HNE level by 14.75%. There is a statistically meaning increase of 103.44% in liver GST activity. According to the control group, an important decrease was seen in the liver (12.58%) and kidney (6.23%) of head intensity, while there was a statistically remarkable increase in tail intensity of liver (83.72%) and kidney (30.23%). In the other parameters evaluated, there is no statistically difference between the control group and the experimental group for this period (Figures 1 to 14).
Discussion
In this study, the phytotoxin and levels of GTX-I and GTX-III were found to be 34.05 and 6.50 μg g−1, respectively. In similar studies previously done, Silici et al. 18,19 reported that the level of GTX-III in mad honey given to experimental animals was 6.22 μg g−1. Sahin et al. 67 reported that the level of GTX-III in the mad honey given to rats was in the means of 39.94 ± 0.02 μg g−1. Kurtoğlu et al. 87 found to be GTX-I and GTX-III as 20.4 ± 1.69 μg g−1 and 8.20 ± 1.93 μg g−1, respectively, in order to determine the GTX levels of collected mad honey. Kaplan et al. 68 found average 13.36 μg g−1 of GTX-I level and 5.95 μg g−1 of GTX-III level in mad honey used and collected from different regions for the development of the GTX analysis method. The level of GTX detected in the mad honey used in other studies is parallel to the values in this study.
GTX-I and GTX-III, a phytotoxin found in the pollen of the Rodedentron flowers, are commonly found in the mad honey. 3,15,87 On the other hand, there are also many phenolic compounds and other components that have antioxidant and antiradical properties 87 –89 in the mad honey. Therefore, the adverse effects obtained cannot be interpreted as direct effects of GTX, but the negative effects have been realized in each period, suggesting that phenolic and other compounds present in mad honey are not sufficient to neutralize these effects.
Mad honey has a potent ability to produce oxidative stress, which is directly proportional to the toxin content in honey. 18,19 Limited previous reports were indicated that honey has the potential to produce oxidative stress and this is caused by GTX content. 18,19 The amount of mad honey and consequently its content of GTX applied in this study were kept very high in this respect compared to previous studies, 13,18,19,67 taking into account the LD50 value of GTX. 65,66 It is believed that the mechanism of action of toxin is related to the potential for the formation of oxidative stress. Because, given the amounts in all periods, in general terms, the high level of free radical formation in the biological system is understood from the results obtained as detailed below. The effect of GTX is predominantly on the voltage-dependent sodium channel and is connected to the open-position voltage-dependent sodium channel so that the sodium channel becomes incapable of closing. Thus, the action potential is accompanied by prolonged hyperpolarization. 1,90 In this way, the increase in intracellular sodium concentration can act on the exchange mechanism of intracellular and extracellular Na/Ca. 91,92 In this way, intracellular calcium concentration increases, while sodium levels are decreased on the other side. It is also known that the increase in intracellular calcium concentration is one of the main mechanisms that trigger the formation of free radicals. 93 On the other hand, exposure to GTX may changes in liver and kidney tissues originating from a physicochemical structure. This situation may lead to organ dysfunction in organs such as liver and kidney, which is the primary role in metabolism and breakthrough. Functional disorders in the organs and deterioration of the balance in the biological system can also lead to high free radical formation. This has been demonstrated in previous studies with mad honey. 18,19 In addition, GTX plays an important role in cardiotoxicity by binding to muscarinic M2 receptors. 13 Increased vagal tone of GTX leads to impairment of physiological balance, 13 especially in cardiovascular system and other systems, due to intensification of cholinergic effect. This may indirectly lead to the impairment of the oxidant/antioxidant balance at the cellular level, the weakening of the cellular antioxidant defense system, and the formation of free radicals. In this context, significant changes have been observed in terms of oxidative stress parameters in the heart. In the light of the information, some changes in the MDA, NO, and HNE levels and SOD, CAT, and GSH-Px activities in blood/tissues were assessed as the oxidant–antioxidant imbalance. The increase in MDA, NO, and HNE levels suggests that mad honey induces the formation of free radicals and that this induction cannot be compensated by the enzymatic and nonenzymatic systems of the cells. When the changes in plasma MDA, NO, and HNE levels were compared with the control group for stages of acute, subacute and chronic it was found that free radical formation was not directly related to the period, that is, the exposure time. The increase in activities of SOD, CAT, and GSH-Px, which are antioxidant enzymes, can be explained by the direct effect of mad honey and the induction of enzyme activities of free radicals occurred by mad honey. Moreover, the decline in antioxidant enzyme activities (SOD, CAT, and GSH-Px) in the mad honey–treated groups indicated that these antioxidant enzymes are consumed in large quantities during detoxification of free radicals. Previous studies show that mad honey or GTX 18,19 can cause serious differences in oxidative stress markers in rat tissues. Moreover, the results obtained in previous studies indicate that the results obtained in this study are supported. 18,19
Chemical metabolizing enzymes such as cytochrome b5, 47,48 cytochrome c, 49,50 and CYP2E1 48,50,51 convert some of the endogenous and foreign compounds found in the biological system into highly electrophilic products that interfere with cell structures such as proteins, DNA, and RNA and destroy these structures. Therefore, cell damage and cell death at the advanced stage occur by disrupting normal homeostasis of cells through free radicals. 40,48,50 –52 As a matter of fact, the living organism is produced more active free radicals during all these biochemical reactions, 41 but these radicals are compensated in time. Oxidative stress, which is formed when they are not compensated, changes the normal functions of cells and leads many negative changes directly and indirectly on tissues, organs, and systems. 33,40,42 Such chemical metabolizing enzymes can lead to the formation of free radicals during biotransformation of most chemicals, especially in the liver. 47,49,50 Changes in chemical metabolizing parameters indicate a significant elevation in liver CYTC reductase activity for acute period and that liver GST activities were significantly increased in the study group making comparison with control group for subacute and chronic exposure. On the other hand, no changes were observed in most chemical metabolizing parameters (CYP2E1, CYPB5, and G6PD). This reveals that GTX does not form free radicals mainly and directly through chemical metabolizing enzymes. However, oxidative stress is a consequence of the increase in the formation of free radicals. The findings of oxidative stress parameters are partly consistent with these results. GST activity and GSH levels in the biological system are important factors in phase II reactions. 94 Hepatic GSH is one of the most important nonenzymatic antioxidants that protect the cells against free radicals and at the same time has a crucial role in the detoxification of the toxic compound. 44 Furthermore, GSH acts as a cofactor for GSH-Px and GST. 95 A reduction in the level of GSH, a potent free radical scavenger responsible for the conjugation of chemicals, 96 appears to be a finding, supporting 96 the hypothesis that the mad honey leads to oxidative stress. In fact, in the study, it was determined that there was a significant decrease in liver GSH level only in cases of subacute and chronic exposure. In addition, mad honey has caused significant changes in the comet test for some periods in some sample materials collected. Based on the knowledge of the authors, the effects of GTX or mad honey exposure on chemical metabolizing enzymes and genotoxic results have not been previously studied. For this reason, a comparative assessment of the data presented in the current study was not possible.
Conclusion
Mad honey has caused adverse effects on some oxidative stress markers, comet parameters, and chemical metabolizing enzyme parameters in rats. These potential adverse effects are more prominent on the oxidative stress parameters during the exposure period in the parameters examined. However, the role of the studied cytochromal enzyme system is limited to these effects. It is possible to estimate the toxic effects of mad honey from the obtained data. All negative effects of GTX in mad honey observed in the study are considered to be based on vagotonic activity as discussed in detail above. In this context, it has been understood that the amount of mad honey that is widely used today by the public for different medical purposes and the period of use are important. Random consumption can lead to many unpredictable adverse effects in the biological system. Since no previous research have been done on the genotoxic effect and the hepatic chemical metabolizing enzyme of GTX or mad honey, the present work is original in that it addresses this issue which has not been discussed before.
Footnotes
Declaration of Conflicting Interests
The author(s) declared no potential conflicts of interest with respect to the research, authorship, and/or publication of this article.
Funding
The author(s) disclosed receipt of the following financial support for the research, authorship, and/or publication of this article: This work was supported by the Scientific Research Fund of Erciyes University (project code: TCD-2012-4149).