
Abstract
Arrest of the cell cycle after DNA damage is believed to promote DNA repair. We aim to investigate the main factors affecting cell cycle arrest of lymphocytes in coke oven workers. A total of 600 workers were included in this study, and their urinary levels of four polycyclic aromatic hydrocarbons (PAH) metabolites, 8-hydroxydeoxyguanosine (8-OHdG), and cell cycle distribution were determined. Urinary PAH metabolites were significantly increased in coke oven workers (p < 0.01). It was found that only urinary 2-hydroxynaphthalene and 1-hydroxypyrene showed significant positive linear dose–response effects on 8-OHdG in this study population (ptrend = 0.025 and 0.017, respectively). The dose–response effect was also observed for smoking and drinking on 8-OHdG (ptrend < 0.001 and 0.034, respectively). Multivariate logistic regression analysis revealed that high levels of urinary 1-hydroxypyrene were associated with a significantly increased risk of S phase arrest (odds ratio (OR) = 1.32, p = 0.03), so as heavy alcohol drinking (OR = 1.31, p = 0.02). Drinking can significantly modify the effects of urinary 1-hydroxypyrene on S phase arrest, during co-exposure to both heavy drinking and median or high 1-hydroxypyrene levels (OR = 3.31, 95% confidence interval (CI) = 1.21–7.63 and OR = 2.56, 95% CI = 1.08–6.06, respectively). Our findings demonstrate that coke oven workers with heavy drinking will cause S phase arrest so as to repair more serious DNA damage.
Introduction
Coke oven workers are exposed to coke oven emissions (COEs) that contain a wide variety of volatile organic solvents and particulates, especially polycyclic aromatic hydrocarbons (PAHs). PAHs are metabolically activated to form stable PAH–DNA adducts and cause DNA oxidation, eventually leading to DNA damage. DNA damage can result in chromosome aberrations and genetic instability and might eventually trigger cancers. 1 –4 Epidemiological studies suggest an etiological link between carcinogenic PAHs exposure and lung cancer risk in coke oven workers exposed to COE, and coke oven workers were found to have a threefold to sevenfold increased risk for developing lung cancer. 5 –7
DNA damage can cause a wide range of cell cycle perturbations, including G0/G1 arrest or its evasion, G2/M arrest, S-phase accumulation. Arrest of the cell cycle after DNA damage is believed to promote DNA repair before cells enter mitosis. Abrogating cell cycle arrest presumably shortens the repair time and may thereby result in inefficient DNA repair. In experimental systems, Hamouchene et al. found that BaP (Benzopyrene) treatment of MCF-7 cells elicits S phase and G2/M arrest. 8 Wei et al. reported that HepG2 cells exposed to BaP effectively increase the percentage of cells in G0/G1 phase but decrease the percentage of S-phase cells. 9 Some studies have reported that HME87 cells and H358 cells treated with BPDE are blocked at G2/M. 10,11 The Vaziri laboratory noted that BPDE treatment of Swiss 3T3 cells results in G1/S arrest 12 but that BPDE (benzopyrene-7,8-dihydrodiol-9,10-epoxide) treatment of H1299 and MEF (Mouse embryonic fibroblasts) cells induces S-phase arrest. 13 –15 In our preliminary experiments, the results showed that BaP activated the S-phase checkpoint in a concentration- and time-dependent manner in 16HBE cells and WI38 cells. 16
In the present study, DNA damage in coke oven workers was detected mostly in lymphocytes, 17 –19 and therefore the purpose of this article is to investigate whether the cell cycle of lymphocytes in coke oven workers will be affected as well as what are the main factors affecting the cell cycle.
Materials and methods
Study subjects
A total of 600 subjects were recruited from a steel plant in northern China, of whom 437 workers have worked on top-, side- and bottom-ovens in the coke oven plant, which led to regular exposure to COE, and these workers had been employed for at least one year. The other 163 subjects from the department of water treatment with no related PAHs exposure in their workplace were used as control subjects. The subjects were not exposed to known mutagenic agents, such as radiotherapy and chemotherapy, in the last 3 months. A pretested questionnaire on demographic characteristics, smoking history, alcohol consumption, history of occupational exposure, and family medical history was administered in person by trained interviewers. Participants were considered smokers unless they had smoked an average of < 1 cigarette/day for < 1 year in their lifetime (nonsmokers) and considered drinkers unless they had drunk alcoholic beverages less than once each week for <1 year in their lifetime (nondrinkers). After all participants signed the informed consent, each worker donated approximately 20 mL of morning urine and 5 mL of fasting venous blood. This study was approved by the Medical Ethics Committee of the Shanxi Medical University. All samples were analyzed without knowing the subject status.
Airborne PAHs monitoring
We selected four working sites for the exposed group and three working sites for the control group, where we collected airborne samples three times consecutively, with the average flow rate of 2 L/min (Gilian HFS-513 air sampling pumps, Sensidyne, Inc, Petersburg, FL USA) for 2–5 h (240–600 L per sample). Particulate PAHs were collected on Teflon filters (pore size 2.0 mm, Advantec, Tokyo, Japan) in series with XAD-2 column (Supelco, Bellefonte, Pennsylvania, USA) in sorbent tubes to collect the vapor phase and then stored in the dark at −20°C. For extraction, the Teflon filter was covered with acetonitrile/methanol (60/40 v/v) and treated in an ultrasonic bath for 60 min and shaken for 30 min. The XAD-2 tube was eluted with acetonitrile/methanol (60/40 v/v) and dichloromethane. Subsequently, XAD-2 material from sorbent tubes was extracted, mixed with both acetonitrile (2 mL) and dichloromethane (2 mL), and shaken again. The original filter extract and the extracts combined to the XAD-2 material were dried under vacuum. The residues were redissolved with acetonitrile in a 25-mL aliquot. Quantitative chemical analysis of eight carcinogenic PAHs (BaP, benzo[a]anthracene, chrysene, benzo[b]fluoranthene, benzo[k]fluoranthene, dibenz[a,-h]anthracene, benzo[g, h, i]perylene, indeno[1,2,3-cd]pyrene) was performed by high-performance liquid chromatography (HPLC; Shimadzu Corp, Japan) with fluorescence detectors according to method 5506 published by the National Institute for Occupational Safety and Health.
Cell cycle in peripheral blood lymphocytes
Aseptic transfer of 3 mL of lymphocyte separation medium (LSM) to a 15-mL centrifuge tube was done. Then, 2 mL of fasting venous blood was collected in sodium heparinized tubes and diluted the blood with physiological saline (1:1). Then, the diluted blood was carefully put over LSM in a 15-mL centrifuge tube, creating a sharp blood–LSM interface; centrifuge at 400×g at 4°C for 30 min. After centrifuge, lymphocytes in the middle layer were aspirated and washed by buffering. Cells were then treated with RNAse and stained with propidium iodide (50 µg/mL in PBS). Cell cycle distribution profiles were recorded with FACscan (Becton Dickinson, Franklin Lakes, New Jersey, USA) using a Cell Quest program. Data were analyzed with Modfit.2 software (Becton Dickinson, Franklin Lakes, New Jersey, USA).
Urinary creatinine and OH-PAH measurements
According to the recommendation of the American Conference of Governmental Industrial Hygienists, end-of-work-week urine samples were obtained. All urine samples were stored at −80°C until analysis. The detailed analytical method is described elsewhere. 20 –23 Briefly, aliquot amount of thawed urine was hydrolyzed with β-glucuronidase/sulfatase (Roche Diagnostics Ltd Indianapolis, IN, USA), purified with a Sep-Pak C18 cartridge (500 mg Sorbent per cartridge, 55–105 µm; Waters, Milford, Massachusetts, USA), and condensed by dry N2 purge to obtain 2 mL extract. The extract was analyzed by using HPLC (Shimadzu Corp) equipped with a fluorescence detector to determine 2-hydroxynaphthalene, 2-hydroxyfluorene, 9-hydroxyphenanthrene, and 1-hydroxypyrene levels. The linearity (expressing as R 2), limit of detection (LoD), reproducibility (expressing as coefficient of variation), and mean recovery rate were 0.9998–1, 0.04–0.12 μg/L, 2.04–4.27%, and 82.97–107.85%, respectively. Urinary creatinine was detected with alkaline picrate, and the creatinine–picrate complex was quantified by spectrophotometry (SpectraMAx M2; Molecular Devices, Sunnyvale, California, USA) using a wavelength of 520 nm. The concentrations of these four hydroxyl-PAHs were presented in units of micrograms per millimole of creatinine.
Determination of urinary 8-OHdG
The determination of urinary 8-hydroxydeoxyguanosine (8-OHdG) levels was carried out according to a method described elsewhere with minor modifications. 24 Briefly, 2 mL supernatant of the urine was adsorbed on a pretreated cartridge (10 mL/500 mg; Bond Elut LRC C18OH; Varian, Santa Clara, CA) and eluted twice with 0.1 mol/L KH2PO4 (pH = 6.0). Subsequently, each of the eluate was evaporated and then dissolved in 1 mL KH2PO4. Five urine samples were set as a batch. In each batch, one of the 8-OHdG standard solutions with concentration ranging from 28 to 1400 nmol/L was run for calibration and the value was added to the daily standard curve. Finally, 20 μL of sample was analyzed. We quantified urinary 8-OHdG according to the peak area by standard solutions of 0, 28, 70, 140, 350, 700, and 1400 nmol/L to establish the retention time. The concentrations of 8-OHdG were finally presented as nanomoles per millimole of creatinine.
Statistical analysis
Statistical analysis was done using SPSS 19.0 software. For our statistical calculations, results that were lower than the LoD of the methodology were expressed in values corresponding to the LoD divided by the square root of 2. Normal distribution test was examined using the Shapiro–Wilk normality test. Variables not fitting the normal distribution were compared using nonparametric tests. χ 2 tests were used to compare the frequencies of the variable between the coke oven and non-coke oven groups. The data were presented as median and range. We also stratified the workers by the quartiles (25th percentile and 75th percentile) of PAH metabolites into low exposure (<25th percentile), median exposure (≥25th percentile but <75th percentile), high exposure (≥75th percentile) subgroups. Workers with low exposure were used as the reference group, and the multivariate logistic regression models with adjustment for confounders were used to investigate the associations. Differences were considered statistically significant for p values <0.05.
Results
Main characteristics of study subjects
The characteristics of the coke oven workers and non-coke oven workers are summarized in Table 1. There were no differences in smoking status, drinking status, education degree, and heating mode between coke oven workers and non-coke oven workers (p > 0.05). The median of age and employment time of subjects in the coke oven workers was significantly lower than the non-coke oven workers (p < 0.001). The distribution of males in the coke oven workers was significantly more than those in non-coke oven workers (94.05% vs. 75.46%, p < 0.001).
Basic characteristic of the coke oven workers and non-coke oven workers.
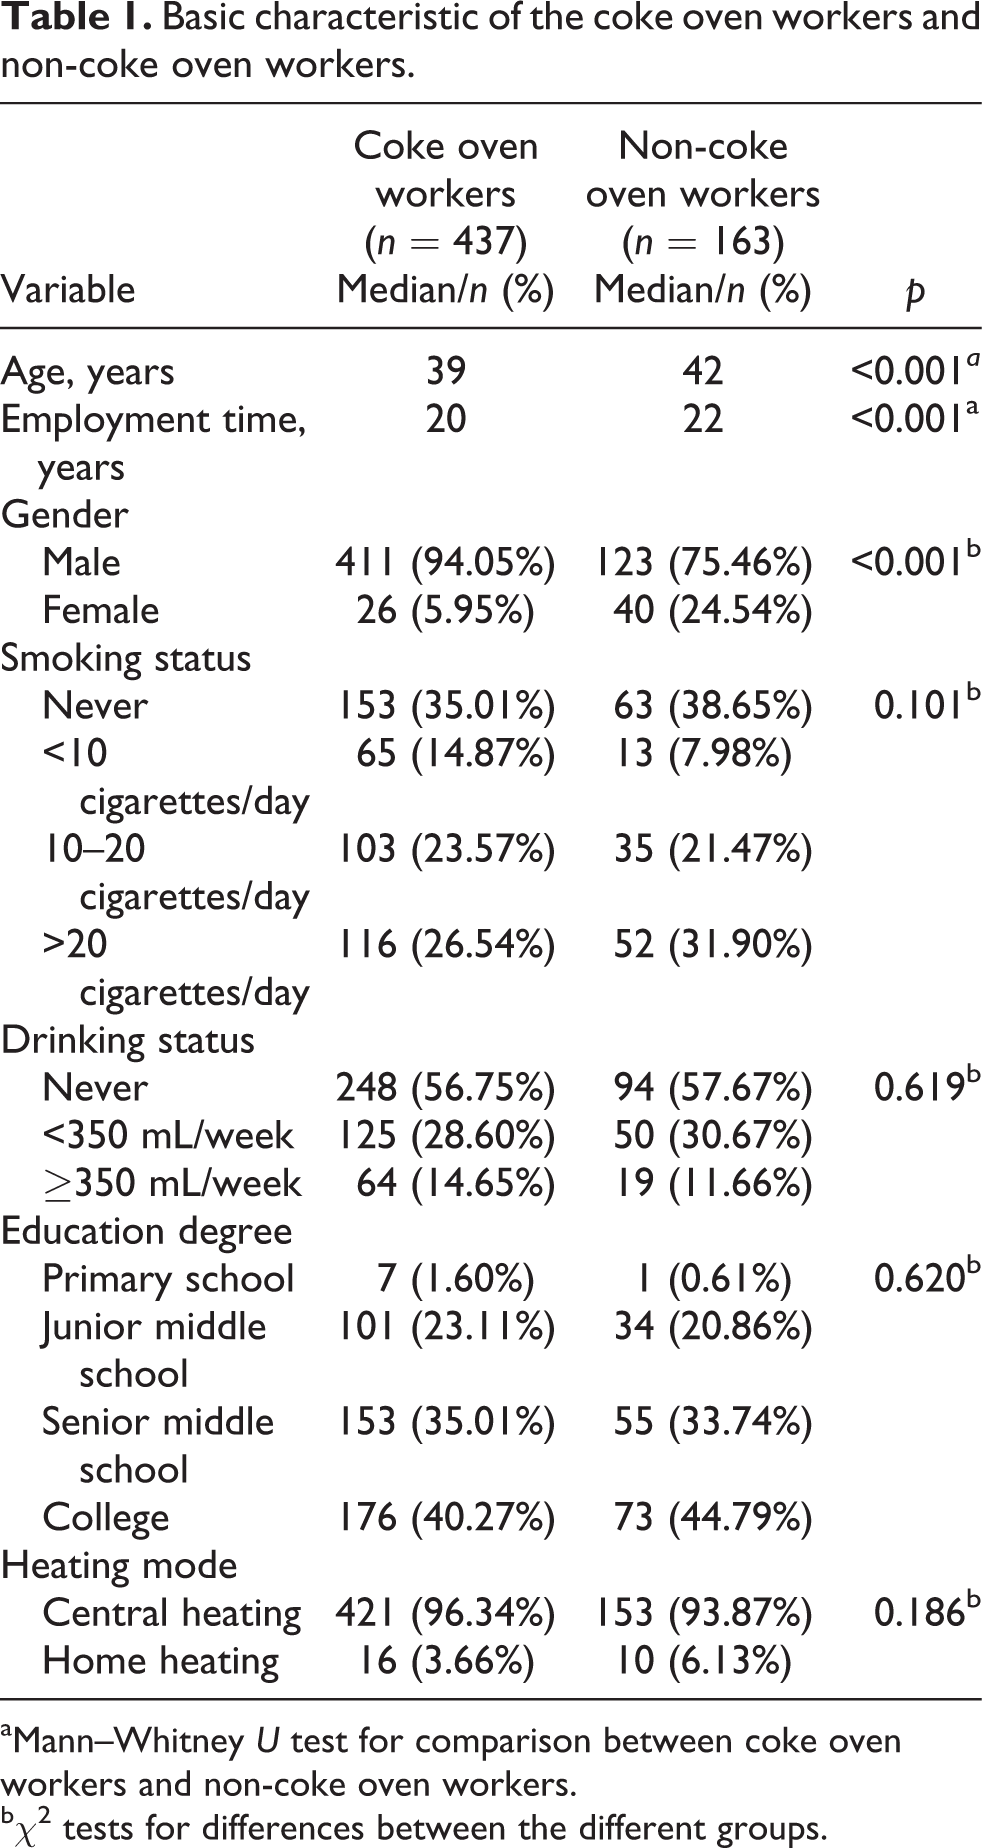
aMann–Whitney U test for comparison between coke oven workers and non-coke oven workers.
bχ2 tests for differences between the different groups.
Airborne PAHs monitoring
The results of airborne monitoring showed that the median value of the sum of eight carcinogenic PAHs in the air of the work places was 1.452 μg/m3 (range 0.286–3.682 μg/m3) for the exposed group and 0.384 μg/m3 (range 0.273–0.490 μg/m3) for the control group, and the difference was statistically significant (p = 0.008). The airborne median level of BaP alone was 0.181 μg/m3 (range 0.090–1.770 μg/m3) for the exposed group and 0.050 μg/m3 (range 0.030–0.060 μg/m3) for the control group, and the difference was also statistically significant (p = 0.001).
Distribution of PAH metabolites in urine and their correlations
In both smokers and nonsmokers, the concentrations of 2-hydroxyfluorene and 1-hydroxypyrene were significantly elevated in coke oven workers (p < 0.05). However, there was no significantly increased trend for the urinary levels of 2-hydroxyfluorene and 1-hydroxypyrene with increasing tobacco consumption in coke oven workers and non-coke oven workers, respectively (p > 0.05). The nonsmokers and light smokers had significantly higher levels of urinary 2-hydroxynaphthalene in coke oven workers than non-coke oven workers (p = 0.010 and 0.022), but the same results were not found in moderate and heavy smokers. There were significantly increased urinary levels of 2-hydroxynaphthalene with increasing tobacco consumption in coke oven workers and non-coke oven workers (p < 0.001). In addition to light smokers, the concentrations of 9-hydroxyphenanthrene were significantly increased in coke oven workers (p < 0.01). And there were significantly higher levels of 9-hydroxyphenanthrene in nonsmokers than smokers in both coke oven workers and non-coke oven workers, respectively (p < 0.001). In addition to moderate smokers, the urinary ΣOH-PAHs were significantly increased in coke oven workers (p < 0.05). And there were significantly increased urinary levels of ΣOH-PAHs with increasing tobacco consumption in both coke oven workers and non-coke oven workers, respectively (p < 0.001; Table 2).
Levels of urinary PAH metabolites in coke oven workers and non-coke oven workers.a

PAH: polycyclic aromatic hydrocarbon.
aAll values were median (5%–95%).
bMann–Whitney U test for comparison between coke oven workers and non-coke oven workers.
cKruskal–Wallis H test for comparison among workers with different levels of smoking.
The Spearson correlation coefficients (r) between ΣOH-PAHs and other PAH metabolites ranged from 0.522 to 0.925 in smokers (p < 0.001) and 0.630 to 0.838 in nonsmokers (p < 0.001). The Spearson r between 1-hydroxypyrene and other PAH metabolites ranged from 0.342 to 0.631 in smokers (p < 0.001) and from 0.264 to 0.656 in nonsmokers (p < 0.001).
Relationships of urinary PAH metabolites, smoking, and drinking status with oxidative damage to DNA
We stratified all workers by the quartile 1 and quartile 3 of each PAH metabolite and ΣOH-PAHs. The levels of urinary 8-OHdG were significantly increased with increasing exposure of 2-hydroxynaphthalene and 1-hydroxypyrene. However, the dose–response trends of 2-hydroxyfluorene, 9-hydroxyphenanthrene, and ΣOH-PAHs on 8-OHdG were not significant (p trend = 0.578, 0.545, and 0.070).
The linear regression analysis revealed that there was a significantly increased trend for levels of urinary 8-OHdG with the increase of smoking and alcohol consumption in all workers (p trend < 0.001 and 0.034, respectively; Table 3).
Concentrations of 8-OHdG of the workers stratified by each urinary PAH metabolite, ΣOH-PAHs, smoking, and drinking status.

aMultiple linear regression for the trend, with adjusted for age, gender, smoking status, and alcohol use.
Distribution of cell cycle in lymphocytes
The distributions of cell cycle in lymphocytes for all workers are shown in Table 4. We stratified all subjects by the quartile 1 and quartile 3 of each PAH metabolite and ΣOH-PAHs. The results showed that there were significant differences in the distribution of G0/G1 and S phase cells in workers stratified by urinary 1-hydroxypyrene. The workers who have high urinary 1-hydroxypyrene would have much lower G0/G1 phase cells and much higher S phase cells than those have low urinary 1-hydroxypyrene. The same tendencies were not found in other PAH metabolites and ΣOH-PAHs on distributions of cell cycle in lymphocytes. There were also significant differences in distribution of G0/G1 and S phase cell in workers stratified by drinking status, the heavy drinker would have much lower G0/G1 phase cells and much higher S phase cells than light drinker and never drinking. There were no significant differences in the distribution of cell cycle in lymphocytes in workers stratified by smoking status.
Distribution of lymphocyte cell cycle of the workers stratified by each urinary PAH metabolite, ΣOH-PAHs, smoking, and drinking status.

aKruskal–Wallis H test for comparison among workers with different levels of exposure.
Effects of urinary 1-hydroxypyrene and drinking on perturbation of cell cycle in lymphocytes
The odds ratio (OR) for perturbation of cell cycle with age, gender, smoking, alcohol drinking, and urinary 1-hydroxypyrene was assessed using the logistic regression model. From the results, we can find that there are no associations between G0/G1 arrest with any variable in the model. However, high level of urinary 1-hydroxypyrene was associated with a significantly increased risk of S phase arrest (OR = 1.316, 95% confidence interval (CI) = 1.024–1.692, p = 0.032), so as heavy drinking (OR = 1.309, 95% CI = 1.035–1.654, p = 0.024), respectively.
We also tested for trends in relation to drinking and urinary 1-hydroxypyrene by assigning median values of the exposure levels treated as continuous variable in the model (Table 5). The results showed the risk of S phase arrest will increase with increasing alcohol consumption and levels of urinary 1-hydroxypyrene, and p trend for both was found to be <0.05.
Multivariate logistic regression analyses of G0/G1, S phase arrest, and variables.a

ORc: crude odds ratio; ORa: adjusted odds ratio; CI: confidence interval.
aLow exposure: <0.03 μg/mmol creatinine; median exposure: 0.03–0.09 μg/mmol creatinine; high exposure: ≥0.09 μg/mmol creatinine.
Then, the effect on S phase arrest by interaction of alcohol drinking and urinary 1-hydroxypyrene was analyzed. We set nondrinkers and low urinary 1-hydroxypyrene levels (<0.03 μg/mmol creatinine) as reference (Figure 1). The results suggest that there are significantly increased risks of S phase arrest in workers who have heavy drinking and median or high urinary 1-hydroxypyrene levels (OR = 3.305, 95% CI = 1.208–7.627 and OR = 2.563, 95% CI = 1.083–6.064, respectively).

Interaction effects of urinary 1-hydroxypyrene and alcohol drinking on S phase arrest of lymphocyte. The levels of urinary 1-hydroxypyrene were stratified by the quartiles (25th percentile and 75th percentile) into low exposure (<25th percentile), median exposure (≥25th percentile but <75th percentile), and high exposure (≥75th percentile). The status of drinking was stratified by the median into light drinkers (< 250 mL/week) and heavy drinkers (≥ 250 mL/week). Values showed were medians.
Discussion
Our results indicated that urinary PAH metabolites and ΣOH-PAHs were significantly increased in coke oven workers. However, the effects of tobacco consumption on the metabolites of PAHs in urine were not consistent. The levels of urinary 1-hydroxypyrene and 2-hydroxyfluorene were less affected by smoking. These results may be related to the nature of coke oven work. PAHs in the air of the work places were significantly higher than the control places. Therefore, environmental exposure may obscure the effects of smoking on metabolites levels. Correlation analysis showed that there were significantly positive correlations between 1-hydroxypyrene and other PAH metabolites, so 1-hydroxypyrene is a suitable internal exposure for coke oven workers. This result is consistent with previous studies. 3,4,25,26
Measurement of 8-OHdG can offer a specific and quantitative biomarker indicating oxidative DNA damage caused by reactive oxygen species, which is a risk factor for cancer and cardiovascular disease. 27 Many studies have indicated that PAH exposure is associated with significantly higher levels of urinary 8-OHdG in various occupationally PAH-exposed populations, such as coke oven workers, 28,29 bus maintenances, 30 restaurant workers, 31 foundry workers, 32 and diesel exhaust emission inspectors, 33 as well as in the urban general population. 34 In this study, we observed that urinary 2-hydroxynaphthalene and 1-hydroxypyrene showed significant positive linear dose-dependent effect on 8-OHdG in all workers. However, these effects were not apparent for other PAH metabolites and urinary 8-OHdG levels.
Tobacco smoke contains numerous human carcinogens and oxidants and can cause oxidative damage to DNA and lipids. As a relevant source of PAHs, cigarette smoking has also been identified as a confounder for urinary levels of PAH metabolites among occupational subjects. 35 In the north of China, men prefer to drink hard liquor. Huang et al. reported chronic alcohol dependence has been associated with heightened oxidative stress and serum 8-OHdG levels are increased in alcohol-dependent patients. 36 Positive associations of urinary 8-OHdG with smoking and drinking have been demonstrated in our study. The levels of urinary 8-OHdG will increase along with heavy cigarette smoking and alcohol consumption.
DNA damage can cause a wide range of cell cycle perturbations. Because arrest of the cell cycle after DNA damage is believed to promote DNA repair before cells enter mitosis, abrogating cell cycle arrest presumably shortens the repair time and may thereby result in inefficient DNA repair. In our preliminary experiments, the results showed that BaP activated the S-phase checkpoint in a concentration- and time-dependent manner in 16HBE cells and WI38 cells. In S-phase arrest, DNA replication slows down as a consequence of the repair processes. The attenuated arrest in S phase strongly suggested that the cells were susceptible to genotoxic stress. 37,38 Other investigations and our study all showed DNA damage was significantly increased in coke oven workers, 1,2,6,17 so we explored the cell cycle of lymphocyte distribution. Kruskal–Wallis H analysis revealed that there were significant differences in the distribution of lymphocyte cell cycle of the workers stratified by urinary 1-hydroxypyrene and drinking status. The workers who have high urinary 1-hydroxypyrene or are heavy drinkers are more likely to have G0/G1 phase evasion and S phase arrest. After adjustment for potential confounders, multivariate logistic regression analyses suggested that urinary 1-hydroxypyrene and drinking were independent risk factors for lymphocyte S phase arrest.
It is particularly interesting that we observed interaction effects for combined 1-hydroxypyrene and drinking exposure on S phase arrest among subjects. In the present study, the risks of S phase arrest were 3.305- and 2.563-fold in workers exposed to both heavy drinking and moderate and high urinary 1-hydroxypyrene compared to the reference, respectively (nondrinkers and low urinary 1-hydroxypyrene levels as reference). This result indicated coke oven workers with heavy drinking may have more serious DNA damage; it will result in S phase arrest, so as to complete the repair of DNA damage.
However, there are some limitations in the present study. We did not have information on benzene and metals exposure among the subjects. Benzene and metals may induce cell arrest and oxidative damage. This is the problem that we should pay attention to in future research.
In conclusion, these data reinforce the notion that urinary 1-hydroxypyrene can be a useful biomarker for evaluating total PAH exposure and in assessing the effects of PAH exposure on oxidative damage in coke oven workers. The findings of our study also suggested that coke oven workers with heavy drinking will cause S phase arrest so as to repair more serious DNA damage, so it is important to encourage coke oven workers to quit alcohol drinking.
Footnotes
Declaration of Conflicting Interests
The author(s) declared no potential conflicts of interest with respect to the research, authorship, and/or publication of this article.
Funding
The author(s) disclosed receipt of the following financial support for the research, authorship, and/or publication of this article: This work was supported by research funding from the National Nature Science Foundation of China (NSFC 81273041, 30901180).