
Abstract
The wide application of silver nanoparticles (AgNPs) has pointed out the need to evaluate their potential risk and toxic effects on human health. Herein, the cytotoxic effects of Argovit™ AgNPs were evaluated on eight cancer cell lines. Further cytotoxic studies were performed in gynecological cancer cell lines from cervical (HeLa) and breast (MDA-MB-231 and MCF7) cancer. In both cases, the half maximal inhibitory concentration (IC50) of AgNPs produced the formation of reactive oxygen species (ROS) after 24 h of incubation, but it was not statistically significant compared with untreated cells. However, HeLa, MDA-MB-231, and MCF7 cells treated with the maximal IC of AgNPs induced the formation of ROS either at 12 or 24 h of incubation. Genotoxicity achieved by comet assay in HeLa, MDA-MB-231, and MCF7 cells revealed that exposure to IC50 of AgNPs does not induced noticeable DNA damage in the cells. However, the IC of AgNPs provoked severe DNA damage after 12 and 24 h of exposure. We conclude that, Argovit (polyvinylpyrrolidone-coated AgNPs) induce a cytotoxic effect in a time and dose-dependent manner in all the eight cancer cell lines tested. Nevertheless, the genotoxic effect is mainly restricted by the concentration effect. The results contribute to explore new therapeutic applications of AgNPs for malignances in murine models and to study in deep the cytotoxic and genotoxic effects of AgNPs in healthy cells at the surrounding tissue of the neoplasia.
Keywords
Introduction
Cancer is the leading cause of death worldwide, thus resulting in economic and life quality constraints at the different levels of society. In pursuit of an effective cancer treatment, chemotherapy represents an advantageous approach over radiotherapy and surgery; it ensures that anticancer drugs like vinblastine, doxorubicin, taxol, and cisplatin among others reach all the diseases sites including micrometastatic injuries. The systematic administration of cytotoxic drugs during chemotherapy currently faces two major problems (i) the dose-limiting toxicity against healthy tissues and (ii) the intrinsic or acquired multidrug resistance (MDR) by the patient. Moreover, it is known that anticancer drugs cause genotoxicity, thus producing DNA damage and prevent chromosomal replication. 1
In this regard, nanotechnology is expected to provide new avenues to overcome the genotoxicity associated with chemotherapy treatments. Suitable nanomaterials have been synthetized in an effort to improve the cell specificity of drug delivery and to reduce the DNA damage during chemotherapy treatment. Nanoparticles (NPs), such as silver nanoparticles (AgNPs), have been extensively applied in medical products like bandages, wound dressings, and linings catheters, due to their beneficial properties such as antibacterial, antifungal, and antiviral agents. 2 –5
AgNPs have gained increased attention because of their therapeutic properties and applications as anticancer agents. In this regard, and in the line with nanotoxicology, several studies have been devoted to the study of AgNPs cytotoxicity and genotoxicity on different types of mammalian cell culture lines that include among others, human glioblastoma (U251), pluripotent human testicular embryonic carcinoma cells (NT2), human hepatocarcinoma cell (HepG2), normal human lung fibroblast (IMR-90) cells, and primary normal human peripheral blood mononuclear cells. 6 –13 Moreover, AgNPs have been used to trigger antitumor effects in Dalton’s lymphoma ascites tumor models and human hepatoma cells. 14,15
On the other hand, raising concerns about reports on cytotoxic and genotoxic effects caused by the exposure of mammalian cell lines to AgNPs have led to intense research on the toxicity profile of AgNPs. Adverse effects include oxidative cell damage, apoptosis induced by the generation of reactive oxygen species (ROS), mitochondrial dysfunction, DNA damage, chromosomal aberrations, cell cycle arrest in the G2/M phase, activation of catabolic enzymes, cytoskeleton deformations, and inhibition of cell proliferation. 8,16,17 Also, it has been demonstrated that cyto- and genotoxic effects on mammalian cell lines exposed to AgNPs are time- and dose dependent. 9
At this stage, it is important to mention that diverse formulations of AgNPs available in the market differ in NP shape, size distribution, synthesis procedure, content of metallic silver, surface functionalization, and interactions with the capping agents. All these features affect the cytotoxicity as well as the chemical surface properties of AgNPs, which play a major role in the interaction of NPs with biological systems. Indeed, it has been reported that cytotoxic and genotoxic effects depend, among others, on the size of the AgNPs as well as on the nature of the capping material. 12,18,19 Taking into consideration the reported cytotoxic effects of different formulations of AgNPs, we decided to use the commercial preparation Argovit™ as a source of AgNPs. This product is currently approved in Russia and other countries for their use in veterinary and human applications (i.e. cosmetics, hemostatic sponges for surgeries, and nutritional supplement). 20 Therefore, in order to further investigate the potential medical applications of AgNPs formulated as Argovit as antiproliferative agent in cancer treatment, not only cytotoxic but also genotoxic effects must be addressed. In this study, Argovit AgNPs were thoroughly characterized by Fourier transform infrared spectroscopy by attenuated total reflectance (ATR-FTIR) and ultraviolet–visible (UV-Vis) spectroscopy, dynamic light scattering (DLS) and high-resolution transmission electron microscopy (HRTEM). Also, we tested the cytotoxic and genotoxic effect of Argovit AgNPs on a set of different cancer cell lines.
Materials and methods
Reagents
Cell culture media such as RPMI-1640, Dulbecco’s modified Eagle’s medium (DMEM) and Eagle’s minimum essential medium (EMEM), trypsin-ethylenediaminetetraacetic acid (EDTA), 1%
AgNPs suspension
AgNPs solution, named Argovit, was kindly donated by Professor Dr Vasily Burmistrov from the Scientific and Production Center Vector-Vita (Russia). Argovit is a preparation of highly dispersed silver NPs with an overall concentration of 200 mg/ml (20%) of polyvinylpyrrolidone (PVP)-coated AgNPs in water. The content of metallic silver in Argovit preparation is 12 mg/ml, which is stabilized with 188 mg/ml of PVP. AgNPs dilutions were calculated according to metallic silver content in Argovit preparation. Solutions were prepared either in RPMI-1640, DMEM, or EMEM media without supplements (FBS and antibiotics) and were kept at 4°C in darkness.
AgNPs characterization
Size distribution and morphology of AgNPs were determined on the base of the results obtained by HRTEM using a JEOL-JEM-2010 microscope (Japan). Hydrodynamic radius and zeta potential were measured using DLS (Malvern Instruments Zetasizer Nano NS model DTS 1060, UK) equipped with a green laser operating at λ = 532 nm at 25°C. AgNPs were characterized by UV–Vis spectroscopy in the range of 200–900 nm using a Cary 60 UV-Vis spectrophotometer (Agilent Technologies, Santa Clara, California, USA). Further characterization of lyophilized Argovit was performed with FTIR-ATR analysis in the range of 400–4000 cm−1 with a resolution of 2 cm−1 on a universal diamond ATR top plate accessory (PerkinElmer, Waltham, Massachusetts, USA); the sample spectrum was compared with that of standard solid PVP (M w: 100 kD).
Cell lines and cell culture
Cell lines used in this study were human epithelioid cervix carcinoma HeLa cells (CCL-2), human breast cancer cell lines MDA-MB-231 (HTB-26) and MCF7 (HTB-22), human prostate cancer cells DU-145 (HTB-81), human colorectal carcinoma cell line DLD-1 (CCL-221) and HT29 (HTB-38), lung cancer cell lines H1299 (CRL-5803), and H1437 (CRL-5872) and were purchased from the American Type Culture Collection (ATCC; Manassas, Virginia, USA). MCF7 cell line was cultured in EMEM media supplemented with 0.01 mg/ml human recombinant insulin, 10% FBS, 1% penicillin–streptomycin (Sigma-Aldrich), 1%
Cytotoxicity assay
Cell morphology after AgNPs treatment was visualized under an Axio LabA1 microscope (Zeiss, Germany). Cells were seeded in a 63 mm petri dish and treated with different amounts of AgNPs and incubated them for 12 and 24 h. Cell viability was assessed by the 3-(4,5-dimethyl-2-thiazolyl)-2,5-diphenyl-2H-tetrazolium bromide (MTT) method described by Mosmann. 21 In this method, the reduction of MTT to water-insoluble blue formazan crystals by the mitochondrial dehydrogenase enzymes is used to measure cell viability. 22 Cytotoxicity of AgNPs was tested on HeLa, MDA-MB-231, MCF7, DU-145, DLD-1, HT29, H1299, and H1437 cell lines. AgNPs dilutions were performed in RPMI-1640, DMEM, or EMEM media without supplements. Cells were exposed to solutions with different concentrations of AgNPs varying from 0.625 to 10 μg/ml for 12 and 24 h in a 96-well plate containing 10,000 cells per well. Cells with AgNPs were incubated for 12 and 24 h at 37°C under 5% CO2 atmosphere in RPMI-1640, DMEM, or EMEM media. After incubation, plates were rinsed with PBS and cell viability was assessed with the in vitro toxicology assay kit TOX-1 (Sigma Aldrich) based on the reduction of MTT reagent. Dimethyl sulfoxide (DMSO) was used to induce total cell death, while cell growth under ideal conditions was assayed with the incubation of cells in RPMI-1640, DMEM, or EMEM media without AgNPs. Absorbance measurement at 570 and 690 nm with a plate reader (Thermo Fisher Scientific, Waltham, Massachusetts, USA) allowed to compare controls of cell viability with the damage induced by different concentrations of the examined AgNPs.
Cell morphology evaluation
HeLa, MDA-MB-231, and MCF7 cells were seeded in a 63 mm petri dish in RPMI-1640, DMEM, or EMEM media and treated with different amounts of AgNPs (1.25, 2.5, 5, and 10 μg/ml) and incubated for 12 and 24 h at 37°C under 5% CO2 atmosphere. After this, cells were visualized under an Axio LabA1 microscope (Zeiss, Germany).
Alkaline single-cell gel electrophoresis (comet assay)
To evaluate whether the incubation of solutions with different concentrations of AgNPs with cancer cell lines can induce DNA damage (i.e. single and double-breaks in DNA), an alkaline single cell gel electrophoresis assay or comet assay was performed as described previously by Singh et al. 23
HeLa, MDA-MB-231, and MCF7 cancer cells were treated with solutions with different amounts of AgNPs from 1.25, 2.5, 5, and 10 μg/ml at 37°C under 5% CO2 atmosphere for 12 and 24 h. HeLa, MDA-MB-231, and MCF7 cells were incubated under the same conditions without AgNPs as a negative control. Then, cells were washed and harvested in PBS. After this, treated cells were embedded in 0.5% low melting point agarose on comet slides. Slides were covered with a cover glass and kept at 4°C to create a microgel. Each slide was immersed for 1 h in prechilled lysis solution containing 2.5 M NaCl, 100 mM Na2EDTA, and 10 mM Tris-base, at pH 10 with 1% Triton X-100 and 10% DMSO. Then, samples were subjected to denaturation in alkaline buffer (0.3 M NaCl, 1 mM EDTA) for 20 min in darkness. Electrophoresis was performed at 25 V and 300 mA for 20 min. Slides were immersed in a cold neutralizing buffer (0.4 M Tris-hydrochloric acid; pH 7.5) for 15 min and then dehydrated by incubation in 99% ethanol for 5 min. The slides were air-dried and stained with a solution of ethidium bromide (50 μl from a solution of 20 mg/ml ethidium bromide) in dark.
Sample slides were visualized with an Axio Lab A1 epifluorescence microscope equipped with an excitation filter of 365 nm and barrier filter of 455 nm connected to a digital camera (Axio Cam ICc5.D). A single analyst performed the visual scoring of slides to minimize scoring images variation.
Analysis was done using the free-software ImageJ developed by the National Institutes of Science (NIH), data were based on the analysis of 200 comets for each test visually scored. Comets were classified visually to belong into one of the five classes according to tail size. Class 0 were scored for undamaged cells showed as intact nuclei without tails, whereas damaged cells showed the appearance of a comet score as following: 1 = low damage; 2 = medium damage; 3 = high damage and 4 = cases when almost all DNA is represented as a tail or maximally damaged. The DNA damage index is based on the length of migration and on the amount of DNA in the tail and is given by the formula: DNA damage index = [(0 × n 0) + (1 × n 1) + (2 × n 2) + (3 × n 3) + (4 × n 4)], where n is the total amount of counts for each class. 24
Apoptosis and necrosis assay
Apoptosis and necrosis were assayed by flow cytometry with isothiocynate (FITC)-Annexin V and propidium iodide (PI) staining using the detection kit Annexin V-FITC apoptosis from Sigma-Aldrich. This kit was used to determine cell death induced by incubation with AgNPs.
HeLa, MDA-MB-231, and MCF7 cells were plated in a 63 -mm cell culture petri dish as described above. Cells without AgNPs were considered as negative control. Cells were incubated with 1.25, 2.5, 5, and 10 μg/ml of AgNPs in RPMI-1640, DMEM, or EMEM media for 12 and 24 h at 37°C under 5% CO2 atmosphere. Cells were harvested and washed with cold PBS and incubated in binding buffer. Following the manufacturer instructions, cells were incubated with annexin V-FITC in dark for 15 min. After this, PI was added to the cells and they were incubated for 5 min in darkness. Then, cells were rinsed three times with PBS and further analyzed by flow cytometry using an Attune™ NxT flow cytometer (Life Technologies, Carlsbad, California, USA). Recorded data from flow cytometry consist of 10,000 events (cells) analyzed with the BL1 channel for annexin V-FITC and BL2 for PI detection. Flow cytometry analysis was performed with the Attune NxT software (Life Technologies).
Detection of ROS production by flow cytometry
The generation of ROS was assessed using the DCFDA cellular ROS detection assay kit from Abcam (ab113851). The cell permeant reagent DCFDA is a fluorogenic dye used to measure the hydroxyl, peroxyl, and other ROS activity within the cell. Once in the cell, DCFDA is deacetylated by cellular esterases producing a nonfluorescent compound, which later is oxidized by ROS into DCF, that is highly fluorescent having a maximum excitation and emission spectra at 495 nm and 529 nm, respectively.
HeLa, MDA-MB-231, and MCF7 cells (4 × 10⁵) were incubated with AgNPs solutions with the following concentrations 1.25, 2.5, 5, or 10 μg/ml in media for 12 and 24 h at 37°C under 5% CO2 atmosphere. Afterward, following the instructions provided by the manufacturer, cells were incubated with 20 μM of DCFDA in DMSO for 30 min at 37°C in dark. Cells treated with 55 μM of tert-butyl hydrogen peroxide were taken as positive control for ROS generation, while cells without any treatment were used as a negative control. After being stained, the cells were harvested and resuspended in 1 ml of PBS. Then, 10,000 events (cells) were analyzed by flow cytometry using an Attune NxT Flow Cytometer (Life Technologies). DCF fluorescence was detected at 530 nm with a filter in BL1 channel. Data from flow cytometry was analyzed with the Attune NxT software (Life Technologies).
Detection of ROS production by confocal microscopy
Intracellular ROS generation was visualized by confocal microscopy using the DFCDA kit from Abcam with brief modifications. Cell culture petri dishes coated with Poly-
Images of cells were obtained with an inverted laser scanning microscope (Olympus FluoView FV1000, Japan), equipped with an argon laser for excitation at 488 nm with GFP filters for emission at 515–530 nm and a laser diode (LD) laser for excitation at 405 nm with DAPI filters for emission at 455 nm. A Plan Achromatic 60×/1.48 N.A. oil immersion objective was used. Laser intensity was kept at 20% to reduce photo bleaching. A photomultiplier module allows providing simultaneous view of the fluorescence in the entire cell. Confocal images were captured using the FV-10 ASW software and were analyzed with the FV-10ASW viewer version 4.1 from Olympus.
Statistical analysis
With exception of confocal imaging acquisition, all other experiments were done in a threefold-independent manner with internal triplicates. The results were expressed as mean ± standard deviation of three independent experiments. Data were evaluated by analysis of variance, followed by Tukey’s multiple comparison test using GraphPad Prism version 6.0c software. The results were considered statistically significant when p < 0.05.
Results
AgNPs characterization
Argovit AgNPs preparation was analyzed by UV-Vis, as depicted in Figure 1(a). The spectrum of Argovit preparation showed the characteristic peak due to surface plasmon resonance of AgNPs at 420 nm. Also, AgNPs were characterized by TEM with respect to morphology, AgNPs consisted of spheroidal particles as shown in Figure 1(b). The analysis of AgNPs size in Figure 1(c) reveals that average size diameter of AgNPs is 35 ± 15 nm; while the hydrodynamic radius corresponds to 70 nm. In Figure 1(d), the ATR-FTIR spectrum of AgNPs showed that they are covered by PVP as described by the supplier. The main characteristics peaks corresponding to vibration of unbound water (ν OH) at 3406 cm−1, symmetric C–H stretching at 2948 cm−1, asymmetric C–H stretching at 2915 cm−1 (ν s C–H and ν as C–H, respectively), carbonyl stretching at 1650 cm−1 (ν C=O) and stretching of nitrogen in the ring at 1269 cm−1 are observed both in AgNPs and in a PVP standard. Zeta potential measured by DLS was −15 mV, denoting a good stability of the AgNPs in solution. All these parameters are essential to compare the effect of AgNPs concentrations used in different studies. Therefore, in this study, we included a summary of the physicochemical parameters obtained from the characterization of our AgNPs (Table 1).
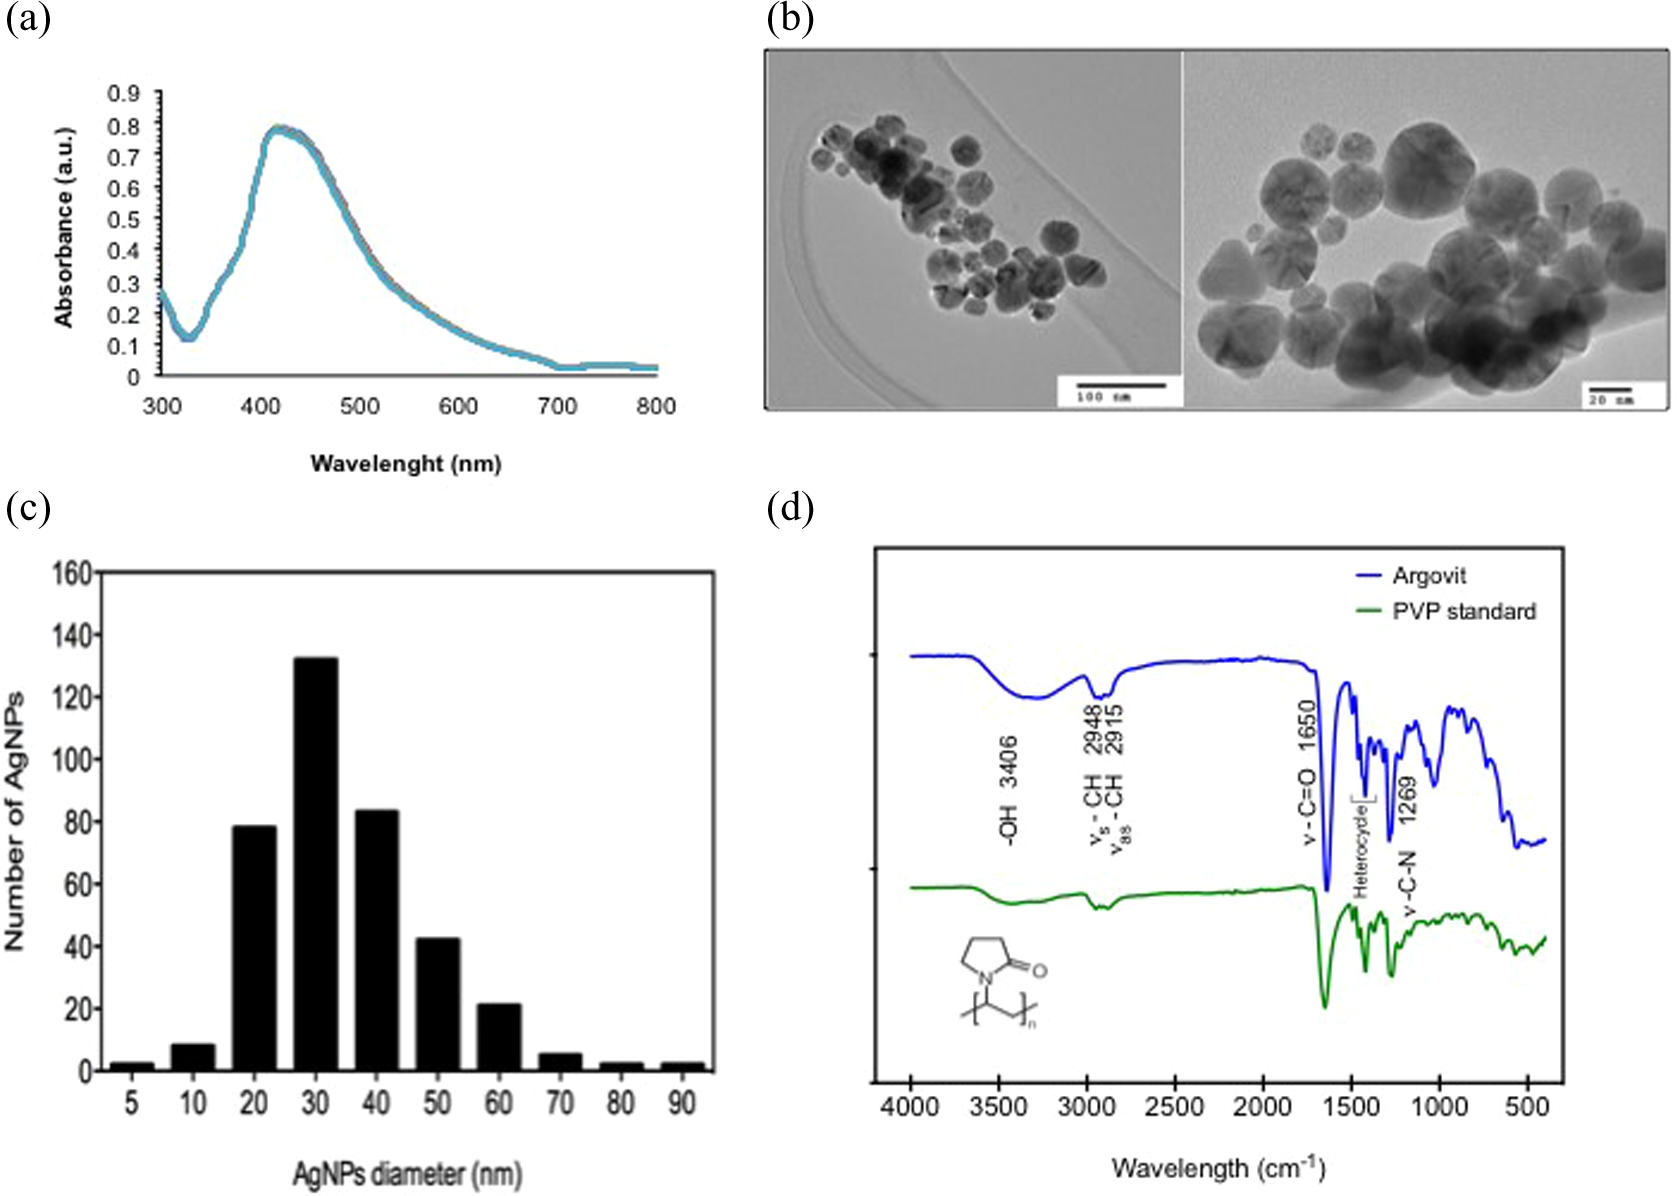
AgNPs characterization: (a) UV-Vis spectra of AgNPs preparation in deionized water, (b) TEM image of AgNPs using different magnifications, (c) size distribution of AgNPs, and (d) ATR-FTIR spectrum of lyophilized AgNPs Argovit™ compared with solid PVP. AgNPs: silver nanoparticles; UV-Vis: ultraviolet–visible; TEM: transmission electron microscopic; FTIR: Fourier transform infrared spectroscopy ATR: attenuated total reflectance.
Physicochemical characteristics of Argovit™ AgNPs.
PVP: polyvinylpirrolidone; TEM: transmission electron microscopic; FTIR: Fourier transform infrared.
Cell viability
In this work, we conducted the MTT reduction assay to evaluate whether the incubation of AgNPs with different cancer cell lines affects their viability. We used eight cancer cell lines as model systems for testing toxicity: human cervix carcinoma (HeLa), breast cancer cells (MDA-MB-231 and MCF7), lung cancer (H1299 and H1437), prostate cancer cells (DU-145), and colon adenocarcinoma (HT-29 and DLD-1). We assayed these cell lines to demonstrate that AgNPs effectively inhibit the cell viability of dependent and non-hormone-dependent cancer cell lines.
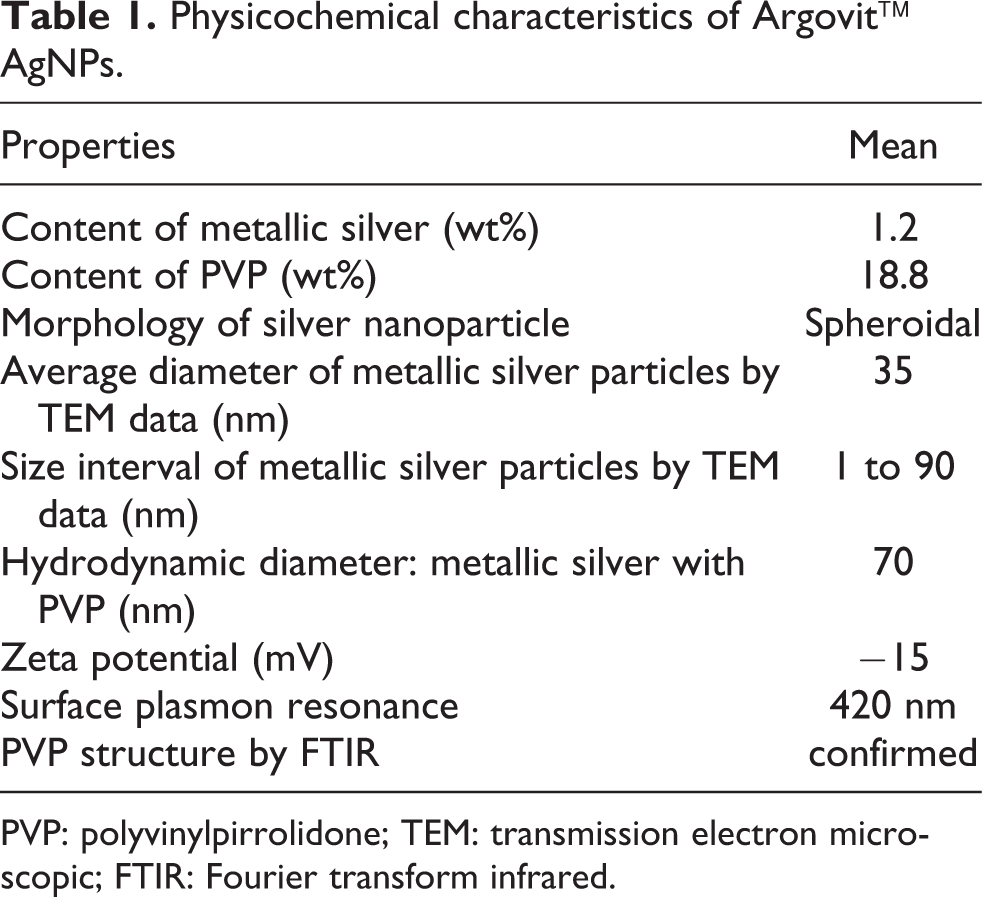
After exposition of cells to AgNPs for 12 and 24 h, cell viability was markedly decreased in a time- and dose-dependent manner, as it is shown in Figure 2. In all the cell lines tested, 20 μg/ml of metallic silver from AgNPs resulted to be highly cytotoxic in comparison to the control (***p < 0.001), either at 12 or 24 h of incubation time. Lower concentration of metallic silver from AgNPs (i.e. 10 μg/ml) incubated at 12 or 24 h provokes a dramatic diminishment in cell viability in most of the cell lines, except from DU-145 cells. Additionally, different susceptibility of cancer cell lines against AgNPs was observed at doses of 1.25 to 5 μg/ml of metallic silver. For example, human cervix carcinoma (HeLa), breast adenocarcinoma cell line MCF7, and lung cancer cells H1299 resulted to be more sensitive to cell death induced by AgNPs than prostate cancer cells (DU-145), colon cancer cells (DLD-1 and HT-29), and lung cancer cell line H1437.
Evaluation of cell viability by MTT assay in a set of cancer cell lines treated with AgNPs: (a) human epithelioid cervix carcinoma HeLa cells, (b) human breast cancer cell line MDA-MB-231 and (c) MCF7, (d) human prostate cancer cells DU-145, and human colorectal carcinoma cell lines (e) DLD-1 and (f) HT-29, lung cancer cell lines (g) H1299 and (h) H1437 were used to evaluate the effect of different concentrations of AgNPs in cell viability test based on the reduction of MTT reagent. (i) IC50 of each cell line treated for 12 and 24 h with AgNPs. Results represent the mean ± standard deviation of three independent experiments. *p < 0.05; **p < 0.01, and ***p < 0.001. MTT: 3-(4,5-dimethyl-2-thiazolyl)-2,5-diphenyl-2H-tetrazolium bromide; AgNPs: silver nanoparticles.
Besides to the concentration of metallic silver, incubation time plays an important role in increasing the half maximal inhibitory concentration (IC50) of tested cells to AgNPs. In this case, 24 h of incubation time in most of the cases decreases the IC50 by almost 1.5-fold (***p < 0.001), with the exception of breast cancer cells MDA-MB-231 and colon cancer cells DLD-1. In both cases, 12 h of incubation with 5 μg/ml of AgNPs was not enough to reduce cell viability at 50%, however, when both cell lines were incubated with the same amount of AgNPs for 24 h, cell viability diminished at 25% as shown in Figure 2(b) and (g). The IC50 values for all the eight cell lines at 12 and 24 h of exposure to AgNPs were calculated and presented in Figure 2(i).
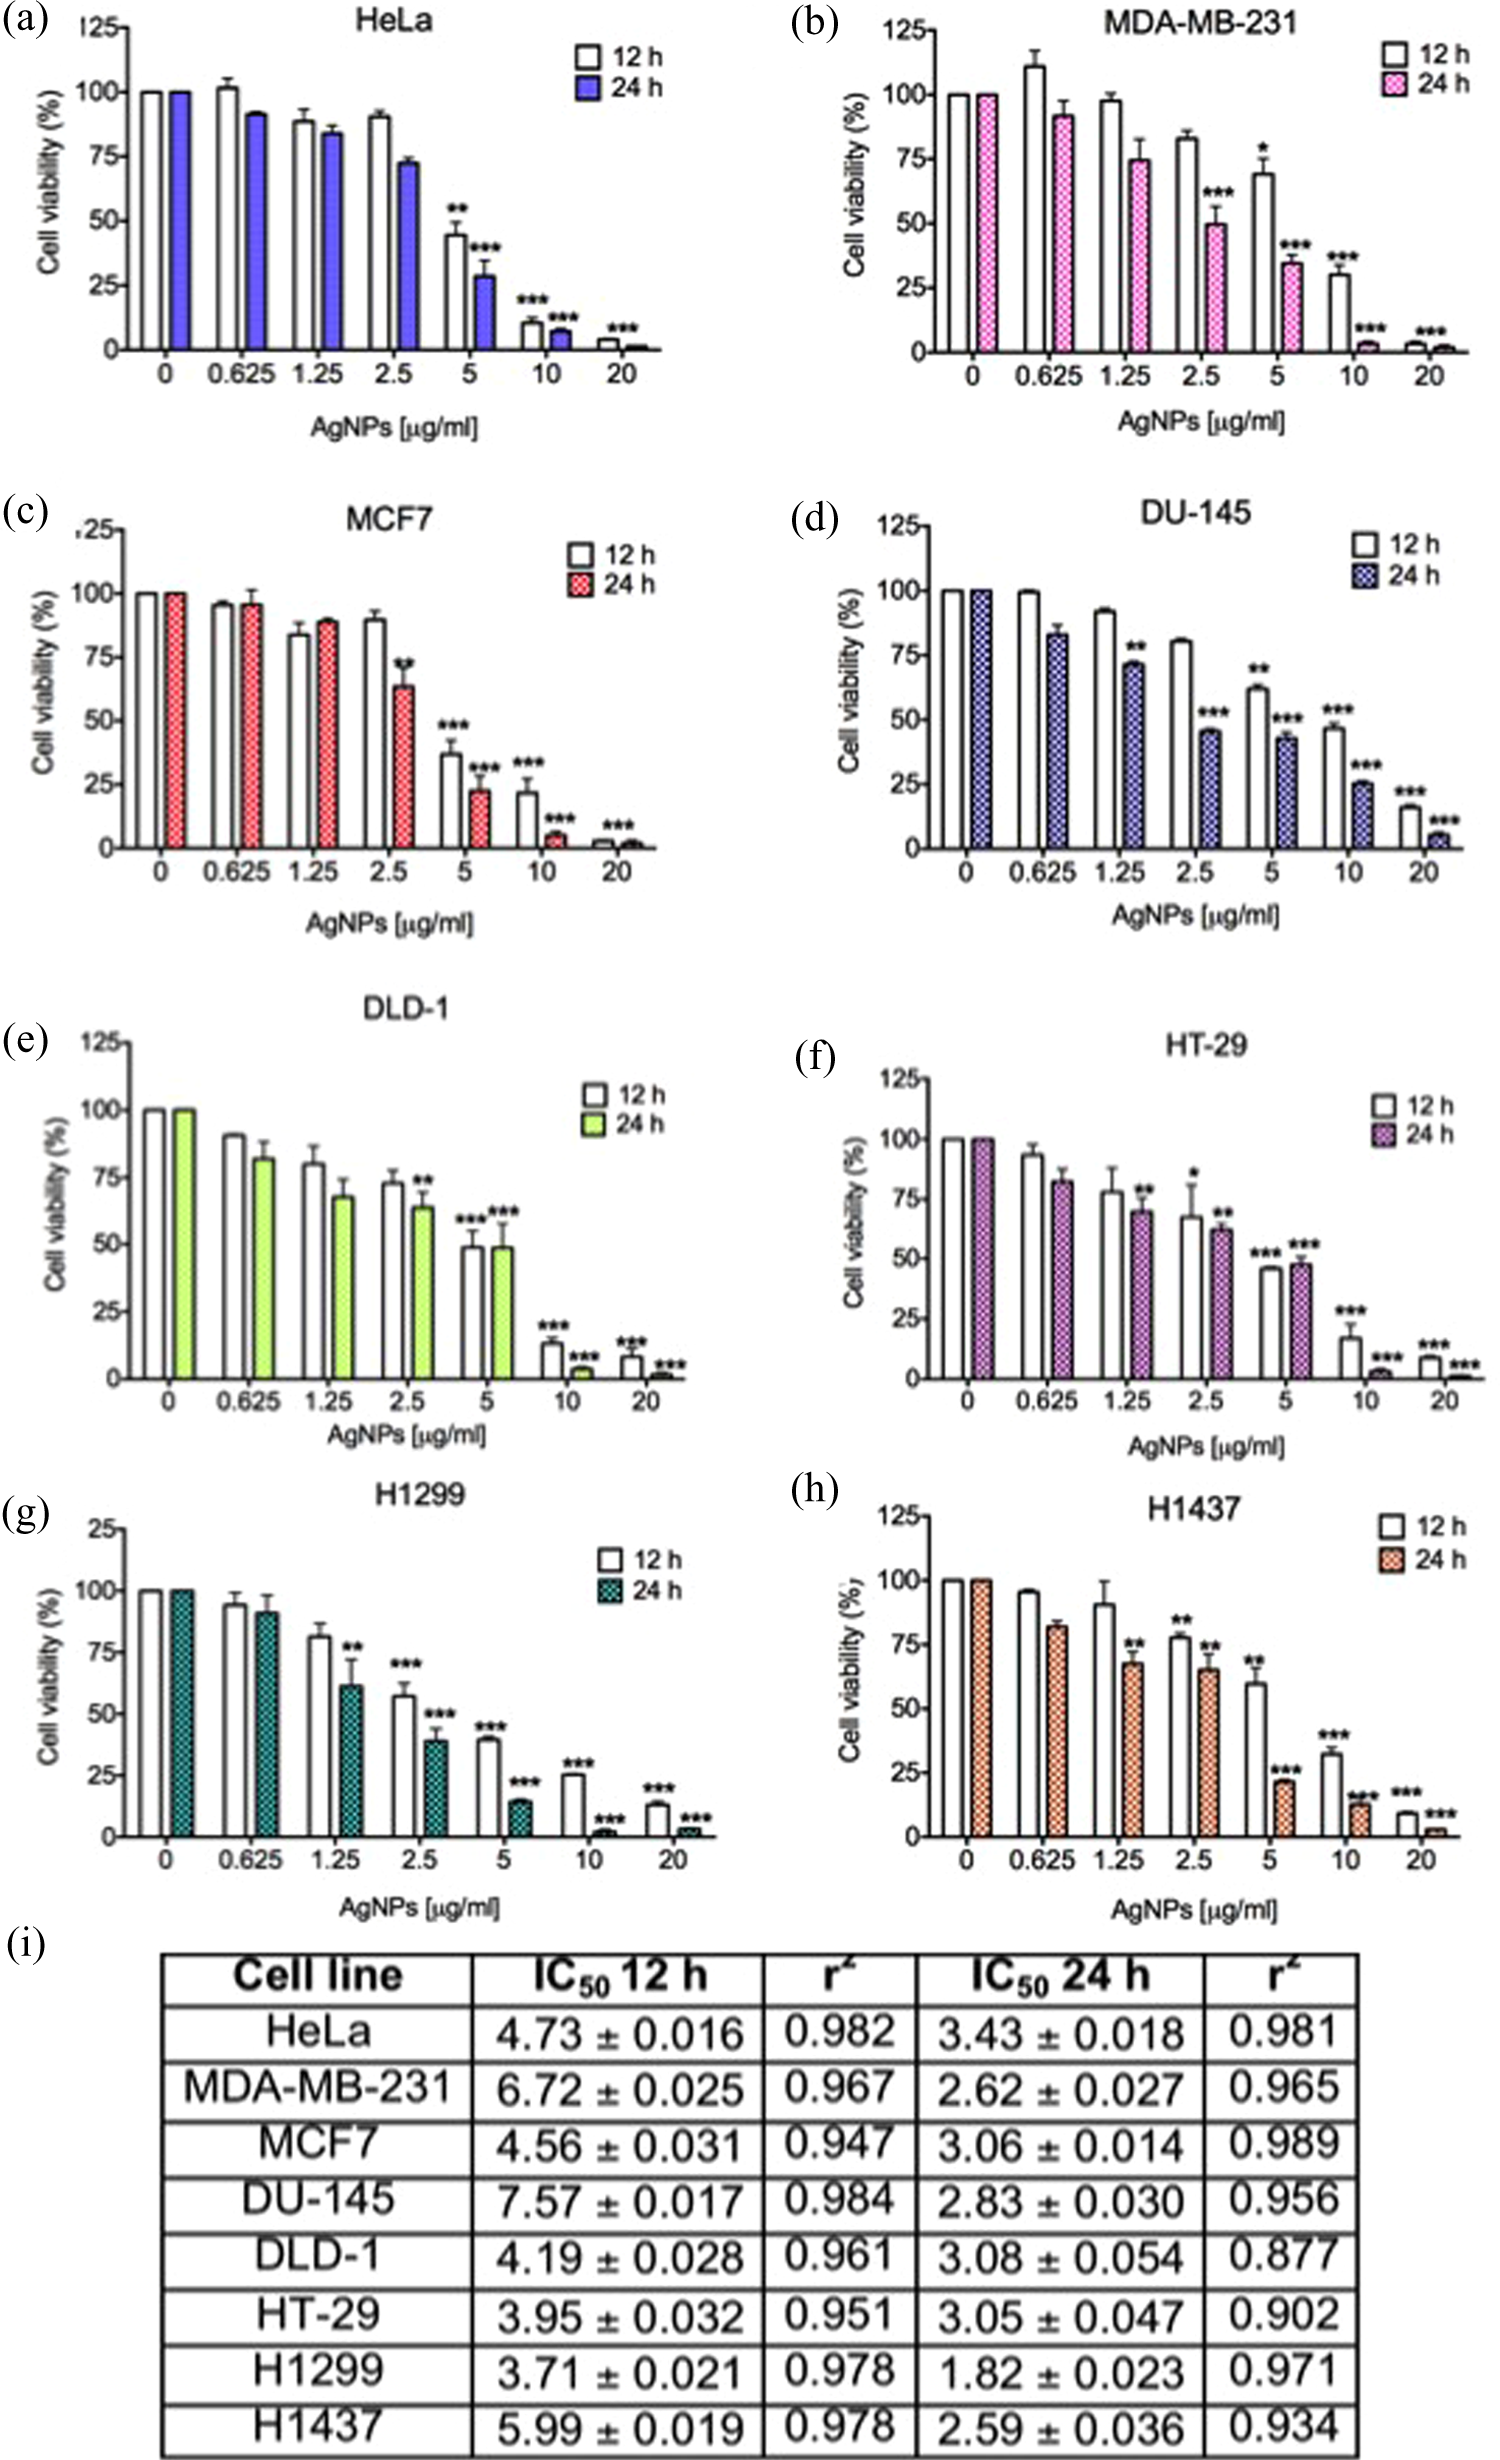
Because the cytotoxic effects of AgNPs were detected in all eight cancer cell lines tested, showing that AgNPs at 10 and 20 μg/ml were highly cytotoxic for most of the cell lines, we decided to further investigate the effects of different amounts of AgNPs ranging from 2.5 to 5 μg/ml in three cell lines: HeLa, MDA-MB-231, and MCF7 (Figure 3). These cell lines are representative of two of the main cancer types that cause the majority of women deaths worldwide which are cervix and breast cancer. Indeed, breast cancer cells MDA-MB-231 corresponds to a triple-negative breast cancer (TNBC) cell line that do not respond to hormone treatment, while MCF7 cell line represents the type of cells from breast cancers that are hormone dependent and sensitive to the conventional hormone therapies for cancer treatment.
Cell viability by MTT assay in HeLa, MDA-MB-231, and MCF7 cancer cell lines treated with AgNPs: (a) human epithelioid cervix carcinoma HeLa cells, (b) human breast cancer cell line MCF7, and (c and d) MDA-MB-231. Results represent the mean ± standard deviation of three independent experiments. *p < 0.05; **p < 0.01, and ***p < 0.001. MTT: 3-(4,5-dimethyl-2-thiazolyl)-2,5-diphenyl-2H-tetrazolium bromide; AgNPs: silver nanoparticles.
Thus, in Figure 3, it is shown the determination of cytotoxic effect of different amounts of AgNPs in a rank of 2.5 to 5 μg/ml. In the case of HeLa cell line (Figure 3(a)), IC50 value depends on the exposure time of cells with AgNPs, for example, IC50 for 12 h was detectable at 4.2 μg/ml and for 24 h was evident at 3.8 μg/ml. For the hormone-dependent breast cancer cell line MCF7, these cells showed also a susceptibility to the exposure time with AgNPs as observed in Figure 3(b). In this case, the IC50 for 12 h was 3.8 μg/ml and for 24 h it reduced to 3 μg/ml. In the case of MDA-MB-231 cells, the effect of AgNPs in cell viability is also determined by the incubation time. For example, 24 h of exposure to AgNPs decreased cell viability and caused an IC50 at 2.6 μg/ml. However, incubation with 2.6 to 4.6 μg/ml of AgNPs for 12 h do not caused any diminution of cell viability close to the IC50 (Figure 3(c)). Therefore, higher amounts of AgNPs were used, as shown in Figure 3(d); in this case, the IC50 value for 12 h of incubation was 6.4 μg/ml. Showing with this that MDA-MB-231 cell line is less sensitive to AgNPs effects at short exposure times (12 h) than HeLa and MCF7 cells.
The cytotoxic results obtained by the MTT method were confirmed by cell morphology. In the case of HeLa, MDA-MDB-231, and MCF7 cells, the treatment with AgNPs caused cytotoxicity in a dose- and time-dependent manner as it can be observed in Figure 4. For the entire cell lines tested, incubation of the cells with 1.25 and 2.5 μg/ml of AgNPs for 12 and 24 h do not caused any evident morphological changes in the cells. However, It is evident that cell morphology tends to shrink with the increase of AgNPs amounts in the media and the extension of the exposure time. In the case of HeLa cells incubated with 5 μg/ml of AgNPs for 12 h, cells seemed more granular but for 24 h of exposure, cells tend to shrink and start to lose their typical morphology (Figure 4, panel (iv) and (ix)). In the case of MDA-MB-231 cells, exposure to 5 μg/ml of AgNPs for 12 h do not caused any morphological changes in the cells. However, when the incubation time extends, MDA-MB-231 cells exposed to 5 μg/ml for 24 h lost their morphology and started to shrink and become granular (Figure 4, panel (xiv) and (xix)).
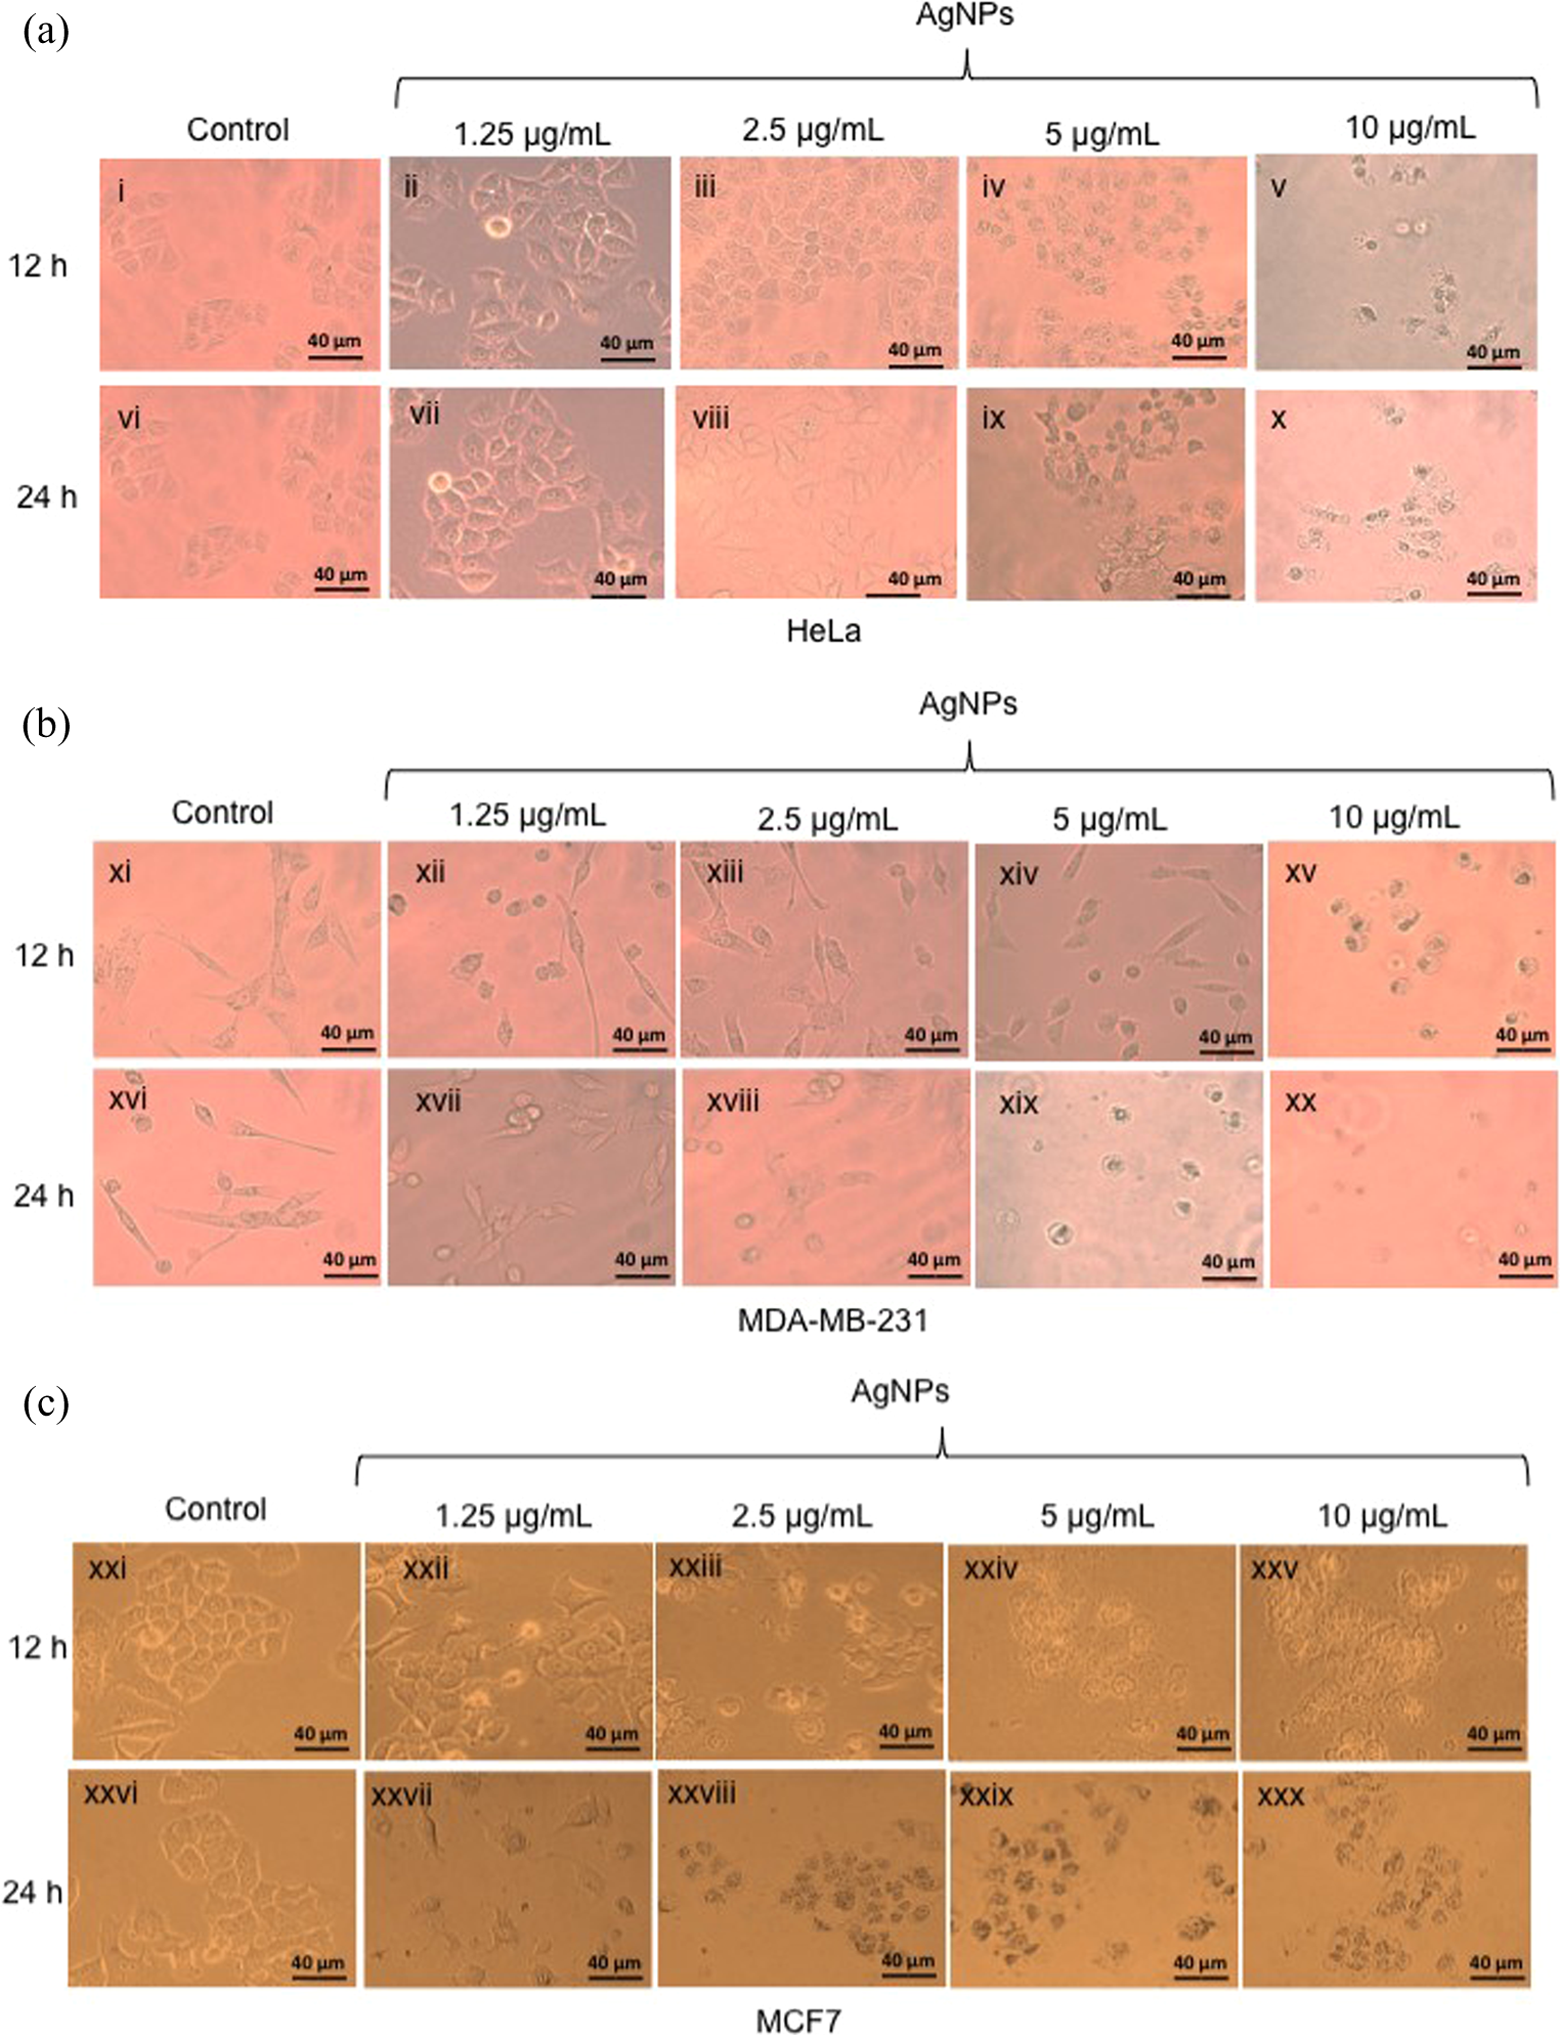
Cytotoxic effects in cell morphology of AgNPs in (a) HeLa, (b) MDA-MB-231, and (c) MCF7 cancer cell lines cells treated with 1.25, 2.5, 5, and 10 μg/mL of AgNPs for 12 and 24 h. Cells were visualized by inverted microscopy at ×40 objective. Scale bar represents 40 μm. AgNPs: silver nanoparticles.
Cell death modality
To elucidate the extent and cell death modality caused by AgNPs on HeLa, MDA-MB-231, and MCF7 cells, several parameters such as the number of living cells (unstained cells), the amount of cells undergoing through necrosis (red fluorescence), early apoptosis (green fluorescent), and late apoptotic cell death (dual stained cells) were measured by fluorescence-activated cell sorting after 12 and 24 h of incubation with AgNPs. As shown in Figure 5, HeLa and MCF7 cells treated with AgNPs were more susceptible for cell death than MDA-MB-231 cells either after 12 or 24 h of exposure to AgNPs.
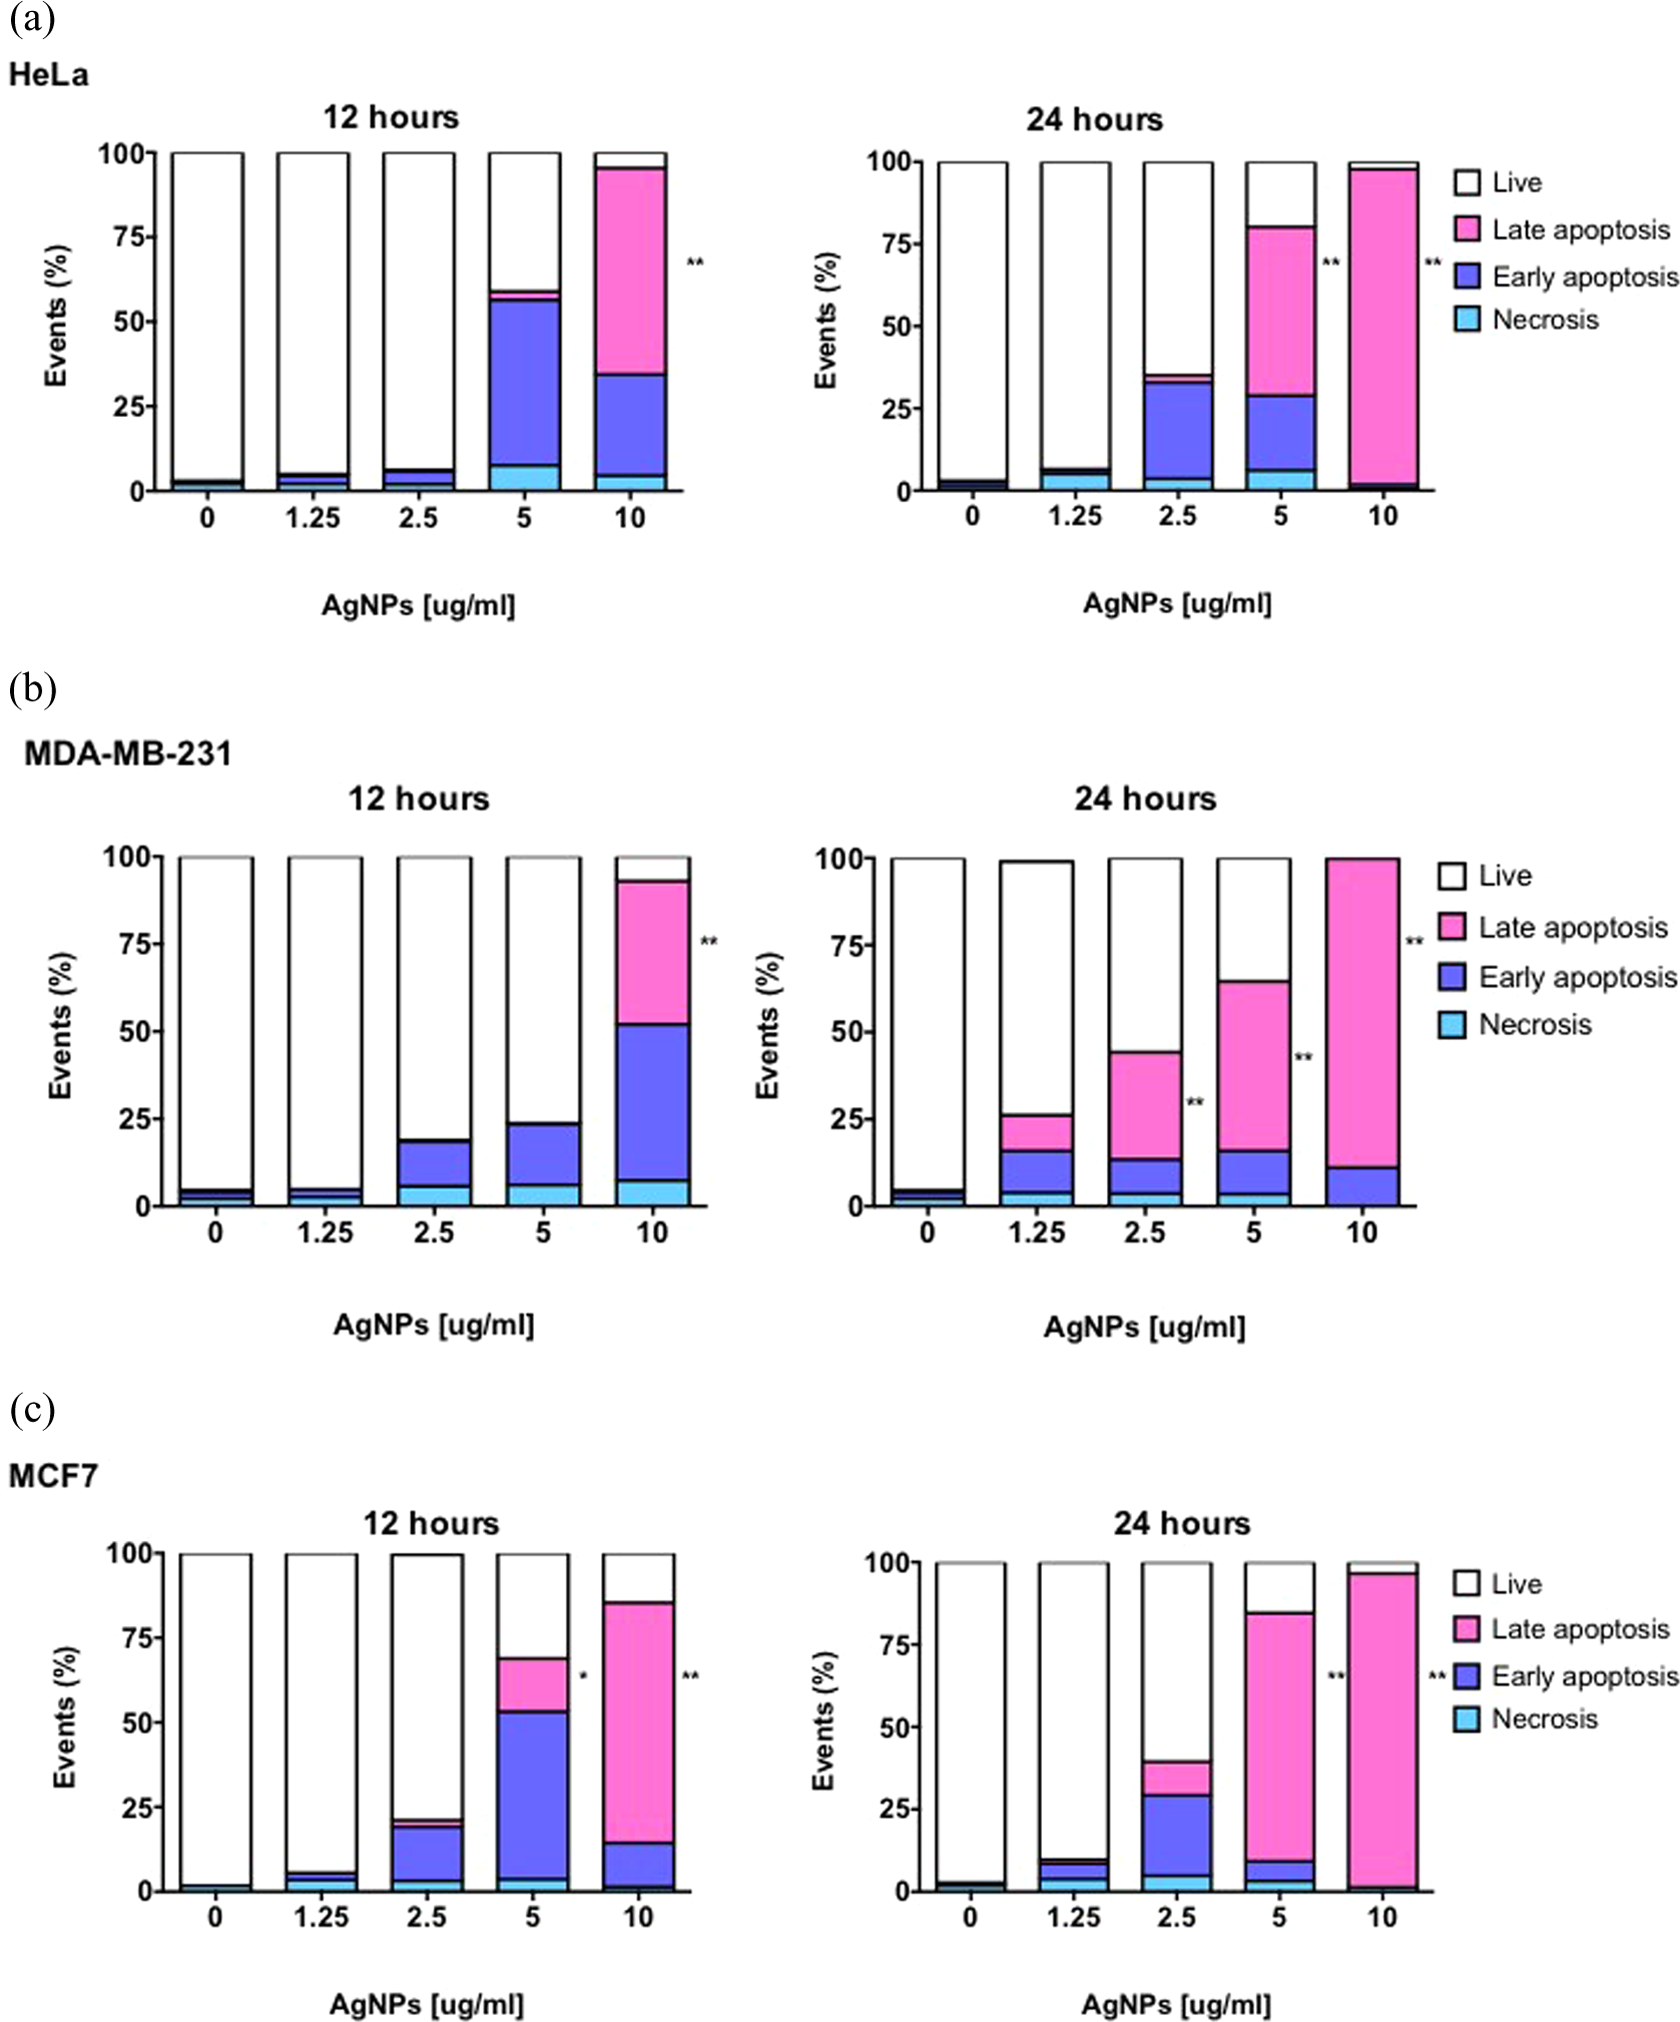
Annexin V-FITC and propidium iodide staining of human cervix carcinoma (a) HeLa cells and breast adenocarcinoma, (b) MDA-MB-231, and (c) MCF7 cells treated with AgNPs. Annexin V/PI staining was performed to evaluate the percentage of necrotic cells (annexin V−/PI+), early apoptotic (annexin V+/PI−) and late apopototic (annexin V+/PI+) cells. Control cells were cultivated in media without AgNPs. Results represent the mean ± standard deviation of three independent experiments where 10,000 events were analyzed. Results represent the mean ± standard deviation of three independent experiments. *p < 0.05; **p < 0.01, and ***p < 0.001. FITC: flow cytometry with isothiocynate; AgNPs: silver nanoparticles; PI: propidium iodide. Statistical significance was considered when *p < 0.05, **p < 0.001 and ***p < 0.001.
ROS formation
We decided to evaluate by flow cytometry whether the incubation of AgNPs with cervical adenocarcinoma HeLa cells or breast adenocarcinoma MDA-MB-231 and MCF7 cell lines induced the formation of ROS. The results obtained revealed that in HeLa cells, the generation of ROS was evident within the first 12 h of incubation with 2.5 μg/ml of AgNPs; however, this value was not statistically significant (p = 0.0216). Statistically significant increase of ROS production in HeLa and MDA-MB-231 cells occurs only when the cells were treated with 5 μg/ml of AgNPs for 24 h (p = 0.05) and at 10 μg/ml of AgNPs (p < 0.001), and also after 12 and 24 h of incubation as shown in Figure 6(a) and (b). The ROS formation was also measured in MCF7 cells as it is depicted in Figure 6(c). Breast adenocarcinoma cells MCF7 were more susceptible to ROS formation by AgNPs incubation, it was evident that ROS generation started within the first 12 h of incubation with 2.5 μg/ml of AgNPs, but when this value was compared with the control, no statistical significance was observed (p = 0.0601). MCF7 cells produced a significant increase in ROS amounts when cells were incubated with 5 and 10 μg/ml of AgNPs either after 12 or 24 h (p = 0.0001).
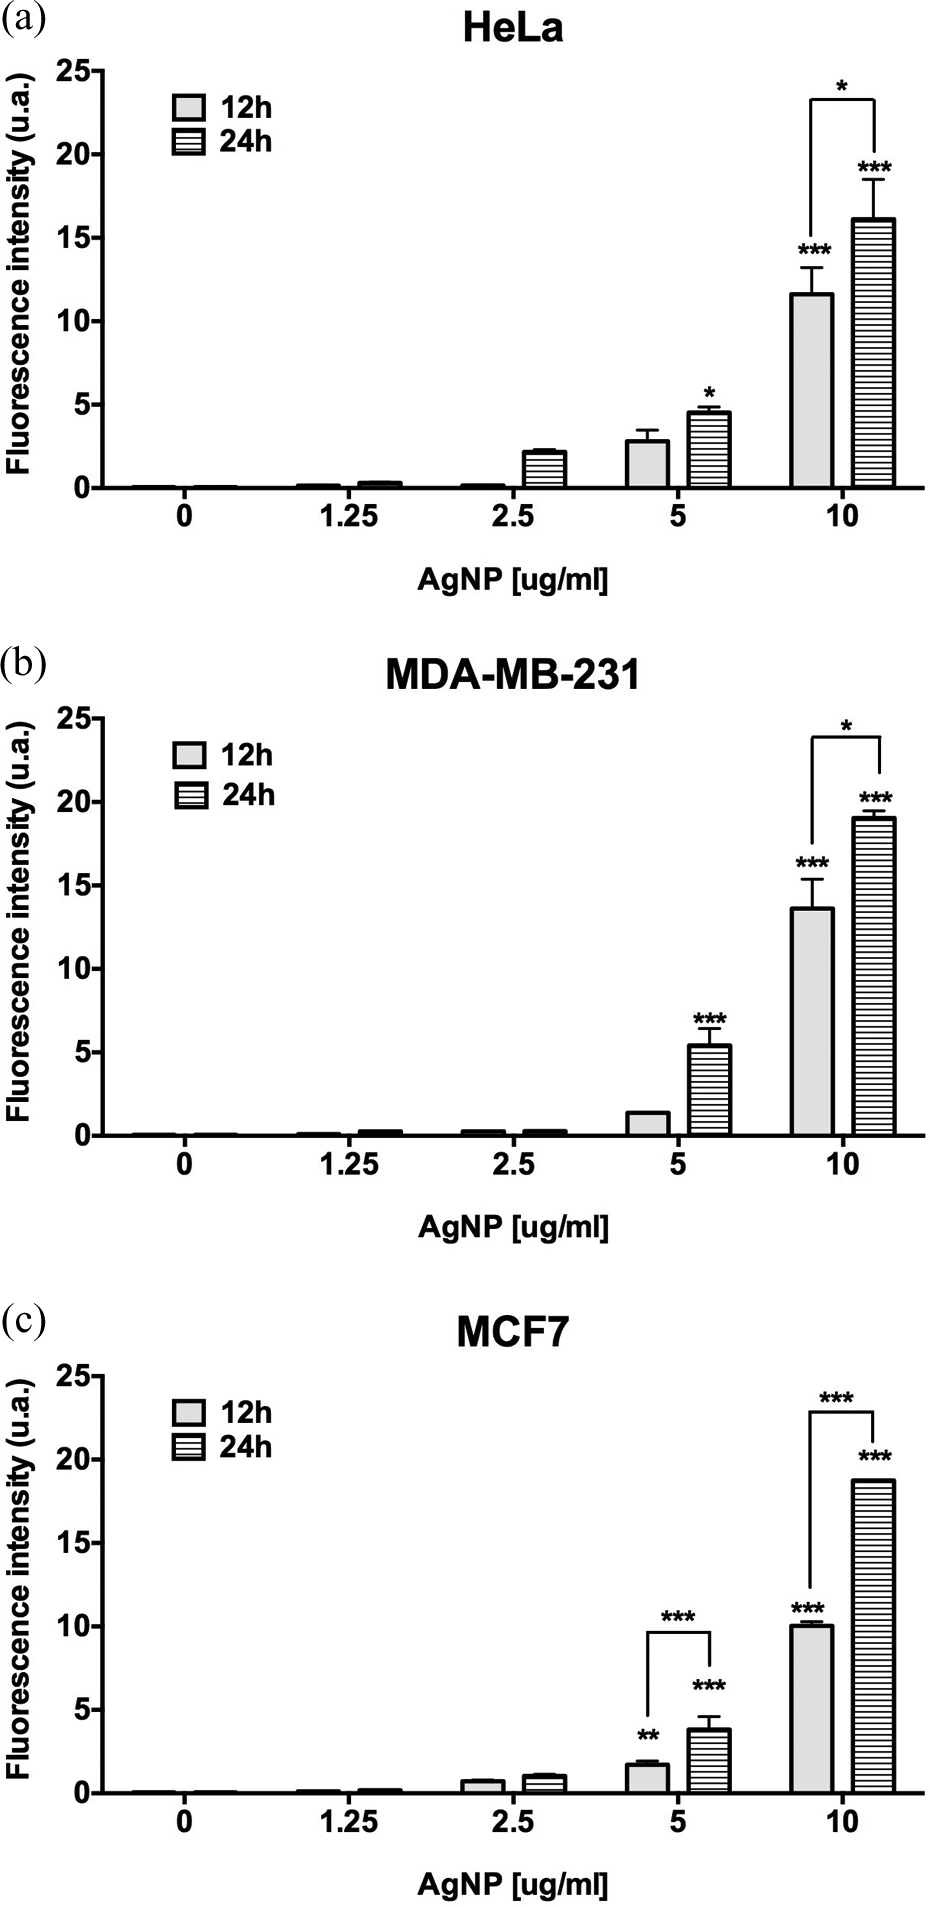
Generation of ROS in cells treated with AgNPs. The generation of hydroxyl, peroxyl, and other ROS within (a) HeLa, (b) MDA-MB-231, and (c) MCF7 cells after 12 and 24 h of incubation with 1.25, 2.5, 5, and 10 μg/ml of AgNPs was detected by flow cytometry following the transformation of DCFDA in the fluorescent DCF compound. Data represent the mean ± standard deviation of three independent experiments. Statistical analysis from negative control group (ANOVA, Tukey’s multiple comparison test represents *p < 0.05, **p < 0.01, and ***p < 0.001). ROS: reactive oxygen species; AgNPs: silver nanoparticles; DCFDA: 2′,7′-dichlorofluorescin diacetate; ANOVA: analysis of variance.
To corroborate that incubation with AgNPs induced the generation of ROS inside cells, further confocal imaging was conducted, as shown in Figure 7. In this case, only the ROS formation after 12 h of incubation is shown, because exposure of 24 h to AgNPs-induced cell death and detachment from the petri dish, making impossible to record any suitable image by confocal microscopy.
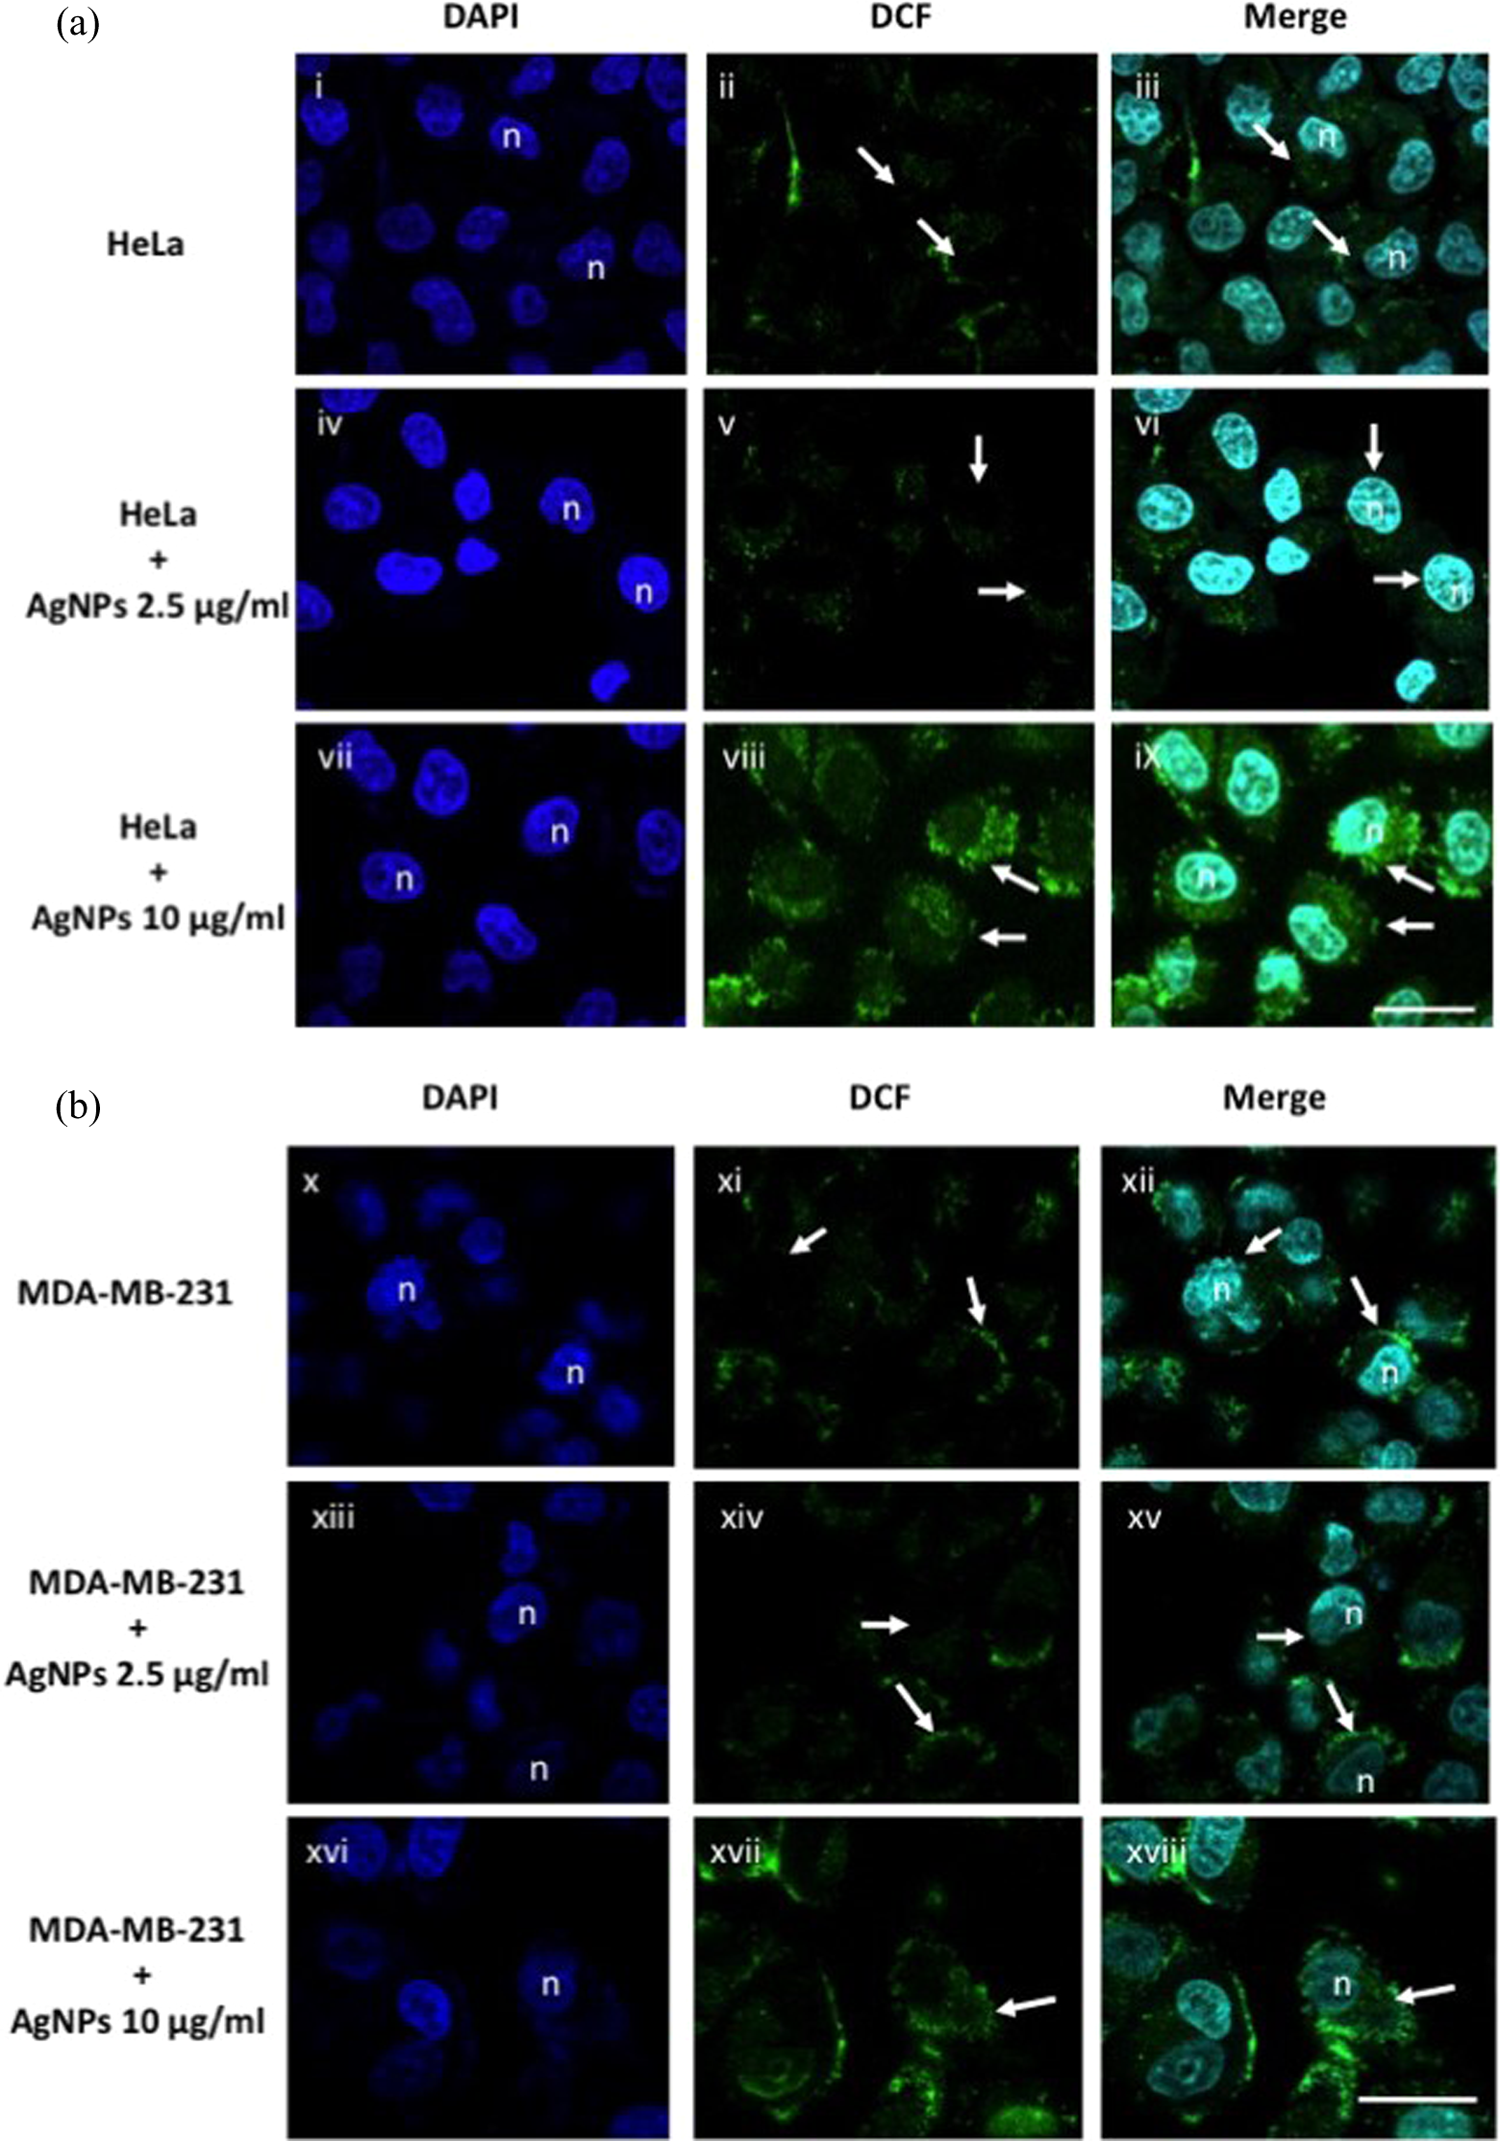
Generation of ROS in cancer cells treated with AgNPs. ROS generation in (a) cervical adenocarcinoma HeLa cells and in (b) MDA-MB-231 breast adenocarcinoma cell line, incubated with AgNPs for 12 h. Staining with DAPI shows nuclei of HeLa cells labeled as “n” (panels (i), (iv), (vii), (x), (xiii), and (xvi)). White arrows in panels (ii) and (xi) showed the endogenous ROS generation in the cytoplasmic region of untreated HeLa and MDA-MB-231 cells. Formation of ROS in both cell lines exposed to 2.5 μg/ml and 10 μg/ml of AgNPs is shown by the fluorescence of DCF in panels (v), (viii), (xiv), and (xvii). Overlay of DAPI and DCF localizes the ROS formation in the cytoplasm of HeLa and MDA-MB-231 cells in panels (iii), (vi), (viii), and (xii), (xv), (xviii), respectively. Scale bar represents 30 μm. ROS: reactive oxygen species; AgNPs: silver nanoparticles; DAPI: 4′,6-diamidino-2-phenylindole; DCF: 2′,7′-dichlorofluorescein.
Endogenous ROS formation of untreated HeLa cells was assessed by fluorescence as shown in Figure 7, panel (i) to (iii). The generation of ROS during the incubation with AgNPs at 2.5 μg/ml for 12 h was barely detected (Figure 7, panel (iv) to (vi)). Whereas, the incubation for 12 h of HeLa cells with 10 μg/ml of AgNPs generated a cytoplasmic fluorescence signal (Figure 7, panel (vii) to (viii)) that correlates with the intensity previously measured by flow cytometry.
Imaging of ROS formation inside MDA-MB-231 cells was also corroborated in Figure 7. Untreated cells produced a basal ROS formation barely detected as shown in Figure 7 panel (x) to (xii). Indeed, the generation of ROS in cells treated with 2.5 μg/ml of AgNPs was only evident after 12 h of incubation (Figure 7, panel (xiii) to (xv)). Moreover, the cytoplasmic ROS formation within MDA-MB-231 cells was consistently observed in cells incubated with 10 μg/ml of AgNPs (Figure 7, panel (xvi) to (xviii)).
DNA damage and genotoxicity
To assess the toxicity of a given nanomaterial, the DNA damage is an important parameter that can be measured by comet assay. This method allows the evaluation of the single and double-strand breaks fragmentation in DNA. Herein, the genotoxicity in HeLa and MDA-MB-231 cell lines exposed to different concentrations of AgNPs for 12 and 24 h was achieved by comet assay (Figure 8). The scored DNA damage for HeLa, MDA-MB-231, and MCF7 cells treated with 1.25, 2.5, and 3.5 μg/ml of AgNPs was similar to those values for untreated cells (p > 0.05) as shown in Figure 8(a) to (c). When cells were treated with higher concentrations of AgNPs, the three cell lines exhibited considerable DNA damage compared with untreated cells after 24 h of exposure to 5 and 10 μg/ml of AgNPs (p < 0.001).
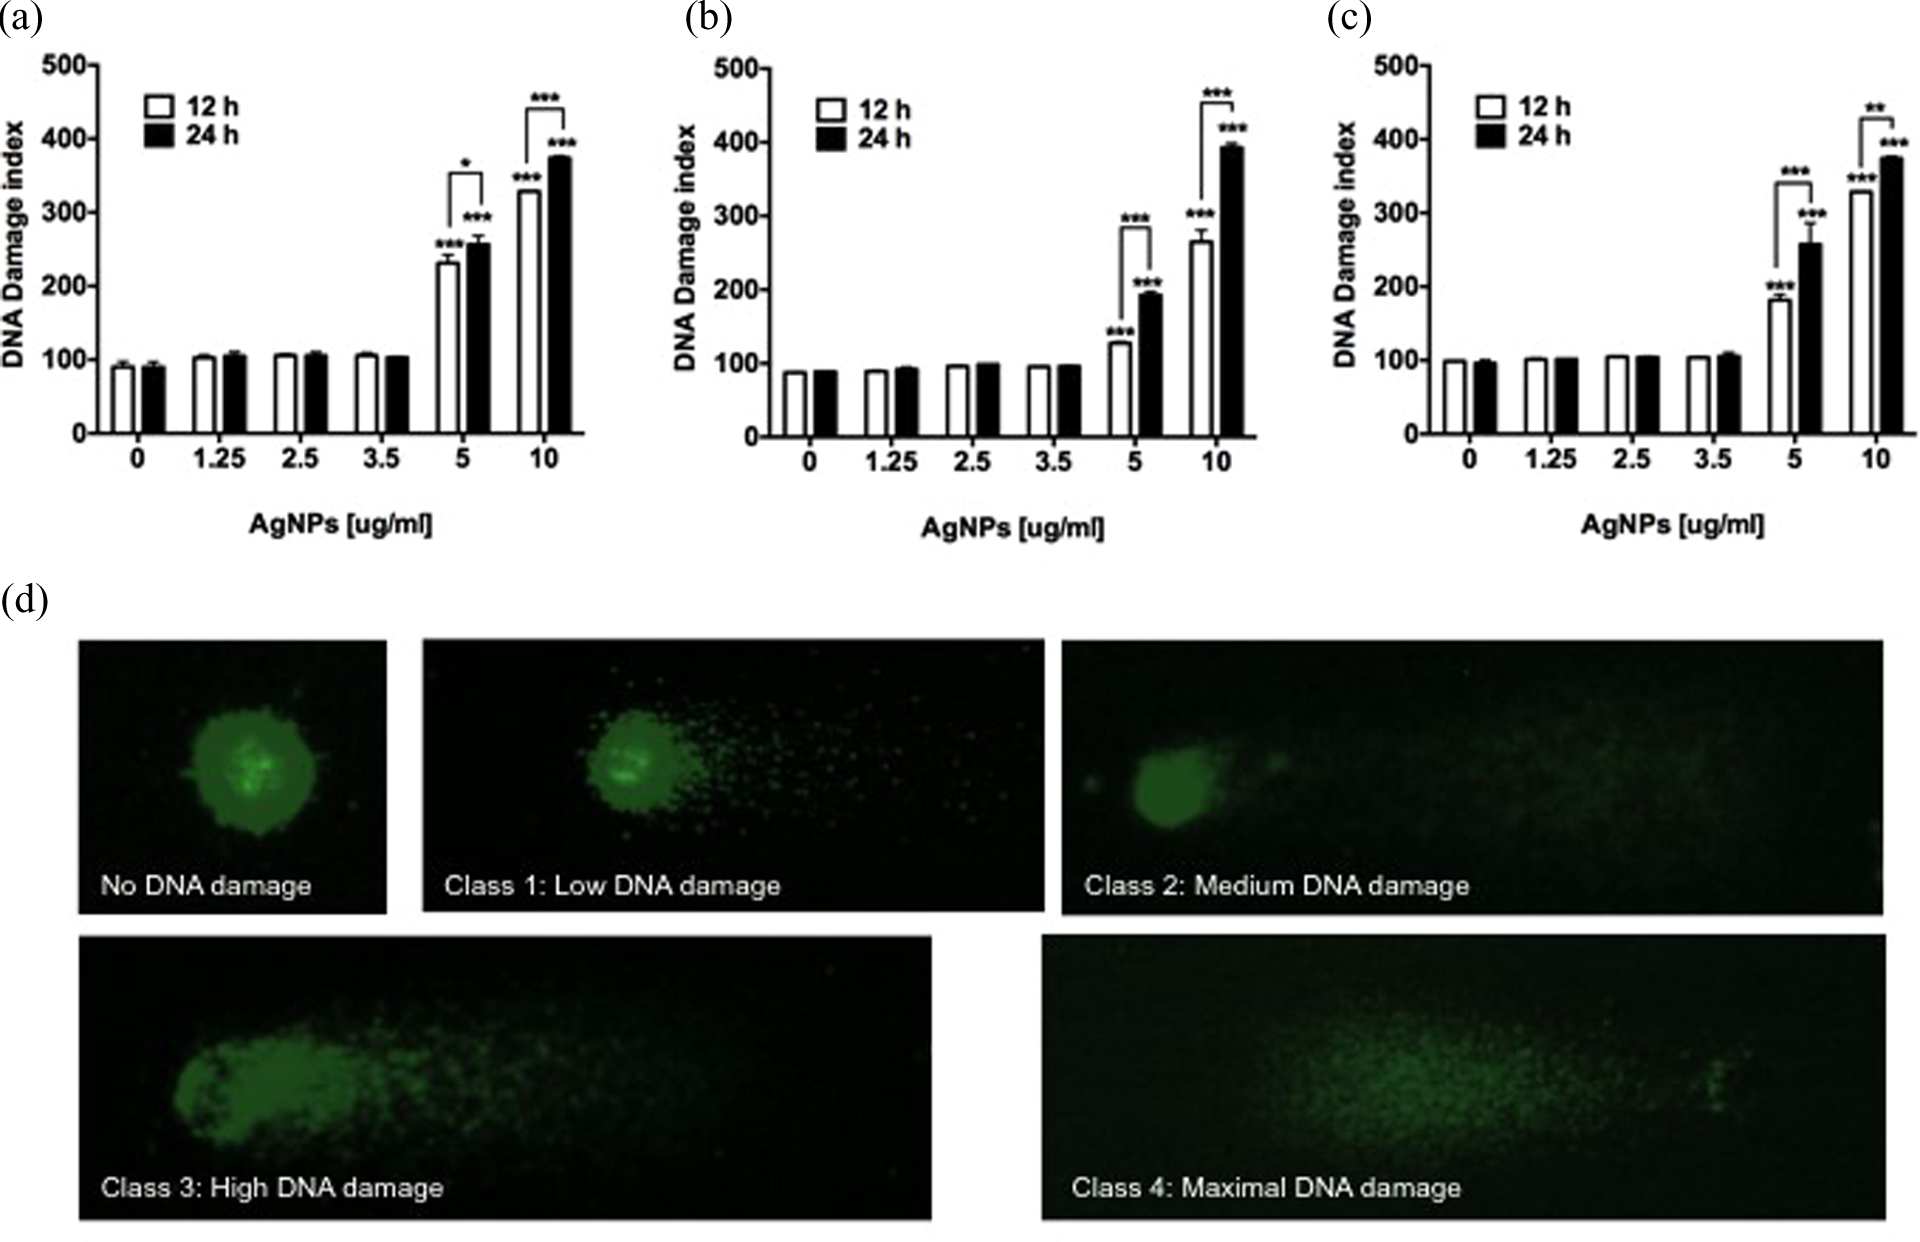
Genotoxic activity of AgNPs on HeLa, MDA-MB-231, and MCF7cells. DNA damage index of (a) HeLa, (b) MDA-MB-231, and (c) MCF7 cells exposed to different concentrations of AgNPs was assessed by comet assay. (d) DNA damage categorization by comet assay classified according to tail size. Cells were incubated with different amounts of AgNPs for 12 and 24 h. Non-treated cells were incubated with cell culture media to simulate normal conditions. Data represent the mean ± standard deviation of three independent experiments. Statistical analysis from negative control group (ANOVA, Tukey’s multiple comparison test represents *p < 0.05, **p < 0.01, and ***p < 0.001). AgNPs: silver nanoparticles; ANOVA: analysis of variance.
Discussion
Considering the multidisciplinary nature of this study, it is important to point out that in investigations related with biological applications of nanomaterials, especially those involving AgNPs, there is often a lack of information regarding their physicochemical properties. This must include data such as metallic silver and capping agent concentrations, NP size and size distribution, hydrodynamic diameter, and zeta potential. A common shortage in reported studies with AgNPs is related to metallic silver concentration. Therefore, a direct comparison between different results is not easy, since the nature of the preparations assayed normally differs. In this sense, our results are referred to metallic silver content in Argovit preparation, while other investigations often refer their results to the weight of NPs as a whole, that is, capping agent and metallic silver (Table 2).
Physicochemical parameters of different silver nanoparticles preparations.
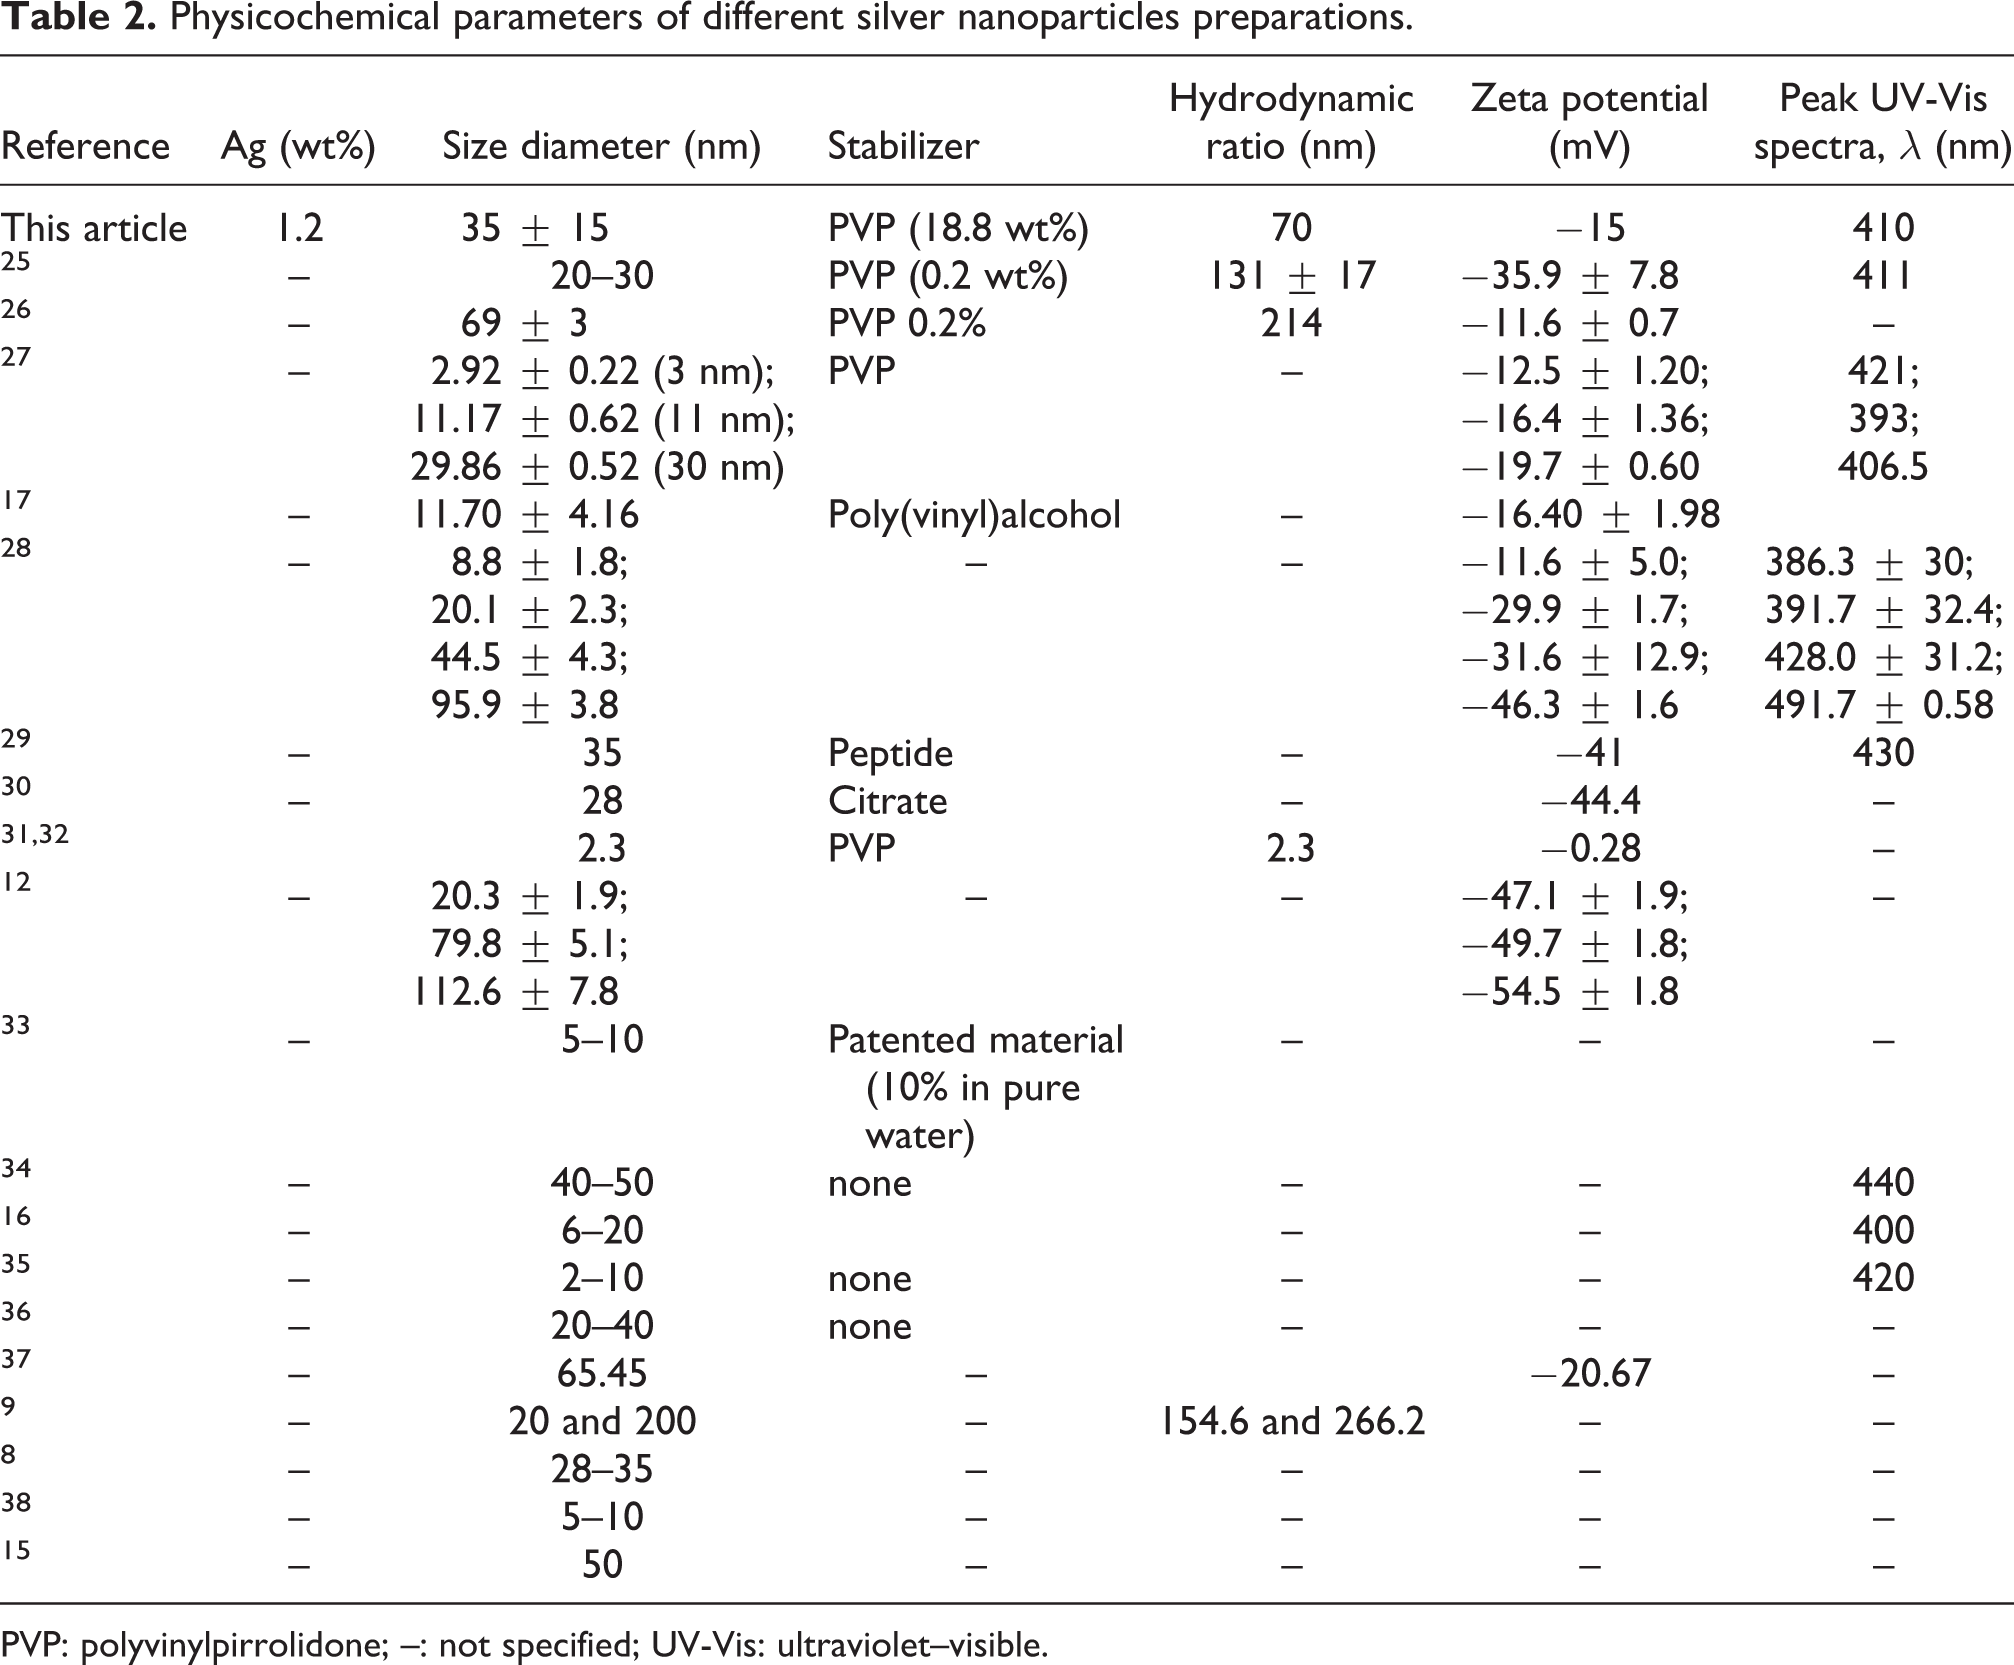
PVP: polyvinylpirrolidone; –: not specified; UV-Vis: ultraviolet–visible.
In addition, if AgNPs are coated with polymers, this must be indicated to calculate their total mass in a given formulation, this information is critical since silver either in its metallic or ionic form, is responsible to exert the biological effect, for example, the IC50. Furthermore, AgNPs surface chemistry plays a major role into their interaction with biological systems. 39 AgNPs in Argovit are coated with PVP and exhibit a zeta potential of −15 mV, which confers them stability in solution for up to 2 years at 4°C. 40 It has been reported that AgNPs functionalized with PVP showed better performance in several biological assays than those non-capped or capped with other agents. 20,41
During the evaluation of nanomaterials, cell viability tests are fundamental to provide information related with cell survival, metabolic status, and cell death modality of treated cells. All cancer cell lines treated herein with AgNPs showed a reduction in cell viability, independently of their hormone sensitivity, indicating that exposure to AgNPs causes cytotoxicity in a dose- and time-dependent manner. This metabolic activity diminishment has also been observed in cancer cells, fibroblasts, and hepatocytes incubated with higher concentrations of others AgNPs formulations (25–400 μg/ml). 6,8
Besides cell viability, a noticeable effect of toxicity in cells exposed to nanomaterials is the alteration of the cell morphology in a monolayer culture. 16 In this study, it was clear that 24 h of exposition time of HeLa, MDA-MB-231, and MCF7 cancer cells to AgNPs caused damage and a massive cell death, evidenced by the presence of floating and unattached cells, while untreated cells appeared normal. Thus, both colorimetric assay and cell morphology observations by light microscopy corroborated that cytotoxic damage in cancer cells is caused by AgNPs in a dose- and time-dependent manner.
It is known that the resistance to cell death and the deregulation of apoptosis are classical hallmarks of cancer. 42 In this study, the modality of cell death was evaluated in cervix carcinoma and breast adenocarcinoma cell lines. We choose these cell lines because cervical and breast cancer are the most common cause of cancer-related death in women worldwide. The fact that AgNPs induce apoptosis rather than cytostasis is desirable, since the former reduces the opportunity of relapsing by cancer cells. Besides, cell death mediated by apoptosis is preferable over necrosis, because apoptosis is an efficient process that does not induce inflammation or damage to the healthy cells that surrounds the cells from a neoplasia.
It has been suggested that the general trend of cytotoxicity is similar among various types of NPs, being the main cause the production of free radicals and the oxidative stress in the cells. 43 –46 The results presented here, support that ROS production within the cells is clearly evident after 24 h of incubation with concentrations of AgNPs above 5 μg/ml. Asharani et al. suggested that ROS production leads to DNA damage as a consequence of ATP synthesis interruption and disruption of the mitochondrial respiratory chain. 6 Actually, free radicals can destabilize the mitochondria and induced cell death by apoptotic pathways. 8,31,47
There is an increased concern about the hazards of nanomaterials in biological systems, especially those used in a variety of applications including biomedicine and food. At this point, it is worthy to mention that the majority of the studies related to cytotoxicity of AgNPs in mammalian cells converge in the fact that prolonged incubation times with AgNPs may induce the generation of toxicological effects including irreversible DNA damage and genotoxicity. 9,37,48
Similarly, conventional anticancer drugs produce cellular damage and are mutagenic; this allows the possibility of acquiring additional mutations following DNA damage in the cells, which could become more malignant and less sensitive to subsequent therapies, causing an acquired MDR and a bad prognosis for the patients. 49 There is, therefore, a necessity for more alternative approaches for the future treatment of cancer that allows overcoming the toxic side effects of anticancer drugs.
Argovit has already shown to possess a broad spectrum of antimicrobial activity at concentrations that are not toxic for mammalian cells and tissues, for example, immune cells, several organs in mice, and in in vivo experiments in rats. 50 –52 So the use of AgNPs from Argovit has been approved by international instances as food supplement, cosmetic, and medical devices for veterinary and human use. 20
The genotoxic effects of several NPs have been fully studied, it has been reported that there is a strong consistency between the genotoxic effects of NPs measured by the comet assay with those obtained by the micronucleus assay. 53 In this regard, to evaluate the genotoxicity of AgNPs here studied, we decided to perform a comet assay in HeLa, MDA-MB-231, and MCF7 cancer cells treated with different amounts of AgNPs including the IC50 value. Contrary to other studies, the IC50 values of AgNPs here studied do not cause a significant DNA damage. As expected, the IC values of AgNPs caused an increase of the damage in the DNA of cancer cell lines.
The fact that AgNPs studied here were able to induce cell death through apoptosis in the cell line of breast adenocarcinoma MDA-MB-231 is a relevant result, because this type of cells belongs to the TNBC. TNBC is a highly proliferative and aggressive heterogeneous subclass of breast cancer associated with metastasis. 54,55 TNBC is associated with a shorter median time to relapse and death, thus representing a clinical challenge because it does not respond to the endocrine therapy or other available targeted agents. TNBC subtypes are more vulnerable to agents that cause oxidative stress and DNA damage than other breast cancer subtypes, mainly because of their defects with the DNA damage response. 56 This vulnerability has been exploited to test effective therapeutic compounds, for example, it has been reported that AgNPs caused a differential cytotoxic and radio-sensitizing effects in TNBC than in non-triple negative breast cells. 25 Intratumoral injection of AgNPs in TNBC xenograft reduced the growth of tumor and caused an improvement in radiation therapy in vivo. 25
AgNPs have proven to be effective in the treatment of MDR cancer. Kovacs et al reported the usage of AgNPs causing an antiproliferative effect inducing apoptosis and a synergistic effect in MDR cancer cell lines when administered in combination with six different antineoplastic agents. 30 This synergistic effect of AgNPs has also been reported with Argovit in combination with traditional antimicrobial drugs in a set of MDR strains of tuberculosis isolated from patients. 52
Thus, we proposed that AgNPs formulated as Argovit could be further investigate as anticancer agent for the treatment of TNBC in murine models and to overcome MDR in cancer cells. Also, important is to exploit their physicochemical properties for the development of imaging agents based on this type of AgNPs as reported by Braun et al. 57 Finally, the use of this AgNPs formulation to treat multidrug resistant cancer cells in combination with antiproliferative drugs can potentially enhance their activity and avoid the DNA damage caused by chemotherapy drugs.
Conclusions
To our knowledge, this is the first systematic study where cytotoxicity of the same type of AgNPs formulation was investigated on a set of eight cancer cell lines from lung, cervix, breast, colon, and prostate. It was shown that after 24 h of cell exposition to AgNPs, the IC50 value was below 3.5 μg/ml and this value was independent of the cancer cell type. Contrary to other studies, the exposition for 24 h of cancer cells to the IC50 value of AgNPs resulted to be non-genotoxic and does not induce DNA damage in HeLa, MDA-MB-231, and MCF7 cancer cells. It was established a non-genotoxic concentration of AgNPs suitable for the diminishment of cancer cell viability in vitro.
The results of biological experiments were supported by an entire characterization of the physicochemical properties of applied AgNPs.
It was revealed that cytotoxicity caused by AgNPs used in this study for all eight-cancer cell lines is not related with cancer cell hormone dependency but with the intracellular generation of ROS and apoptotic cell death.
This study paves the way to further testing the usage of this type of AgNPs formulation together with chemotherapy drugs in murine models of cancer. AgNPs could potentiate the antiproliferative properties of chemotherapy drugs by decreasing their actually used dosage so that genotoxic damage in cancer patients will be decreased or even avoided.
Footnotes
Acknowledgments
Authors are thankful to Dr. Rosa Mouriño from the Centro de Microscopia Avanzada at Centro de Microscopia Avanzada at Centro de Investigación Científica y de Educación Superior de Ensenada (CICESE) for the facilities provided to use the confocal microscope and Dr Olga Callejas for her technical support in confocal imaging. Authors wish to thank Dr Oxana Martyniuk, Dr Katrin Quester, and Mr Francisco Ruiz Medina for their technical support.
Declaration of Conflicting Interests
The author(s) declared no potential conflicts of interest with respect to the research, authorship, and/or publication of this article.
Funding
The author(s) disclosed receipt of the following financial support for the research, authorship, and/or publication of this article: This work was supported through the Consejo Nacional de Ciencia y Tecnología (CONACYT) project no. 269071, the International Network of Bionanotechnology with impact in Biomedicine, Food and Biosafety (CONACYT project no. 270242), and DGAPA PAPIIT-UNAMIT200114 project. K. Juarez-Moreno was awarded by the National Council of Science and Technology of Mexico as a CONACYT research fellow (CONACYT project no.1073). A. Pestryakov is funded by the Govermental Program “Science” of Tomsk Polytechnic University.