
Abstract
There are many discrepancies among the results of studies on the genotoxicity of lead. The aim of the study was to explore lead-induced DNA damage, including oxidative damage, in relation to oxidative stress intensity parameters and the antioxidant defense system in human leukocytes. The study population consisted of 100 male workers exposed to lead. According to the blood lead (PbB) levels, they were divided into the following three subgroups: a group with PbB of 20–35 μg/dL (low exposure to lead (LE) group), a group with a PbB of 35–50 µg/dL (medium exposure to lead (ME) group), and a group with a PbB of >50 μg/dL (high exposure to lead (HE) group). The control group consisted of 42 healthy males environmentally exposed to lead (PbB < 10 μg/dL). A comet assay was used to measure the DNA damage in leukocytes. We measured the activity of superoxide dismutase (SOD), catalase, glutathione reductase (GR), glucose-6-phosphate dehydrogenase (G6PD), and glutathione-S-transferase (GST) as well as the concentration of malondialdehyde (MDA), and the value of the total antioxidant capacity. The level of PbB was significantly higher in the examined subgroups than in the control group. The percentage of DNA in the tail was significantly higher in the LE, ME, and HE subgroups than in the control group by 10% (p = 0.001), 15% (p < 0.001), and 20% (p < 0.001), respectively. The activity of GR was significantly lower in the LE and ME subgroups than in the control group by 25% (p = 0.007) and 17% (p = 0.028), respectively. The activity of G6PD was significantly lower in the ME subgroup by 25% (p = 0.022), whereas the activity of GST was significantly higher in the HE subgroup by 101% (p = 0.001) than in the control group. Similarly, the activity of SOD was significantly higher in the LE and ME subgroups by 48% (p = 0.026) and 34% (p = 0.002), respectively. The concentration of MDA was significantly higher in the LE, ME, and HE subgroups than in the control group by 43% (p = 0.016), 57% (p < 0.001), and 108% (p < 0.001), respectively. Occupational lead exposure induces DNA damage, including oxidative damage, in human leukocytes. The increase in DNA damage was accompanied by an elevated intensity of oxidative stress.
Introduction
Despite technological developments, exposure to lead remains a serious problem. There are many well-described symptoms and signs of lead poisoning. Lead impairs the functioning of all systems of the human body resulting in a complex clinical picture in poisoned subjects. Many mechanisms have been proposed to explain the effects of lead. Some mechanisms of lead poisoning are better understood than others, and some possible mechanisms require further investigation and verification. 1
The interaction between lead and some enzymes of the heme biosynthesis pathway is one of the best-known mechanisms of lead toxicity. Lead has a high affinity for the thiol groups of proteins that are present in the active sites of enzymes, and lead suppresses the activity of delta-aminolevulinic acid dehydratase (ALAD) and ferrochelatase. Heme biosynthesis is impaired, which causes anemia. Increased levels of delta-aminolevulinic acid (ALA) and zinc-protoporphyrin (ZPP) occur. Both substances serve as biomarkers for lead effect. 1,2
Much of the newest research on lead toxicity focuses on the ability of lead to induce oxidative stress. Some authors postulate that lead is able to directly generate reactive oxygen species (ROS). Other studies indicate the pivotal role of the indirect mechanisms, such as lead-induced modification of the antioxidant defense system function associated with depletion of the antioxidant reserves. Under oxidative stress conditions, all structures of a cell might be damaged. The damage to lipids is lipid peroxidation, which leads to the formation of many toxic metabolites, including malondialdehyde (MDA), a widely used biomarker of oxidative stress intensity. The ability of lead to promote lipid peroxidation has been widely investigated in many human and animal studies. 3 However, little is known regarding the oxidative DNA damage indirectly induced by lead.
The oxidative damage to DNA is predominantly caused by the hydroxyl radical. This radical forms adducts to double bonds of DNA bases and abstracts a hydrogen atom from the methyl group of thymine and each of the carbon–hydrogen bonds of 2′-deoxyribose. These reactions lead to the formation of modified DNA bases and sugar moieties, alkali-labile sites, single and double strand breaks, and protein–DNA cross-links. 4,5 The products of lipid peroxidation have a genotoxic potential to form adducts to DNA. 6 Similarly, 4,5-dioxovaleric acid, a product of the auto-oxidation and enolization of ALA, is an effective alkylating agent of DNA bases. 7
Several studies have indicated that exposure to lead could be associated with an increased incidence of malignant neoplasms of the lung, stomach, and bladder. The International Agency for Research on Cancer classified inorganic lead compounds into the 2A group of probable human carcinogens. One of the proposed mechanisms of possible lead genotoxicity might be related to increased oxidative stress resulting in oxidative damage to DNA. The results of animal and human studies in this field are not consistent. 8,9 The aim of this study was to explore the associations between occupational exposure to lead and oxidative stress intensity, the DNA damage level, including oxidative damage, and the activities of selected enzymes that are involved in antioxidant defense.
Material and methods
Study population
The exposed population consisted of 100 healthy male volunteers employed in zinc and lead production facilities in Miasteczko Śląskie, Poland. All participants were recruited by an occupational medicine specialist during prophylactic medical examinations and provided informed consent to the study. Their age ranged between 20 and 58 years, and they were exposed to lead from 6 months to 37 years.
The inclusion criteria were the following: male sex, occupational exposure to lead (PbB > 20 µg/dL). The exclusion criteria included significant findings in physical examination, a history of any chronic disease, such as malignant neoplasms, diabetes, hypertension, and coronary artery disease.
Blood concentration of lead (PbB) served as a lead exposure marker, while zinc protoporphyrin (ZPP) level served as a marker for lead exposure effect. On average, the levels of PbB and ZPP were measured every 3 months for 2 years of observation prior to the study. The mean level of lead (PbBmean) and zinc protoporphyrin (ZPPmean) in the blood were calculated.
Taking into account the obtained PbB, the examined group was divided into three subgroups: low exposure to lead (LE), medium exposure to lead (ME), and high exposure to lead (HE). The first group included 31 workers with PbB from 20 to 35 μg/dL, whereas the second group consisted of 47 workers with PbB from 35 to 50 μg/dL. The last group included 22 workers with PbB > 50 μg/dL.
In addition, to estimate the possible role of confounders on measured parameters, the exposed group was divided into smokers and nonsmokers and subgroups of subjects divided based on median of age, years of work number, and body mass index (BMI).
In the final blood samples, the levels of PbB, ZPP, MDA, total antioxidant capacity (TAC) value, and activities of superoxide dismutase (SOD), catalase (CAT), glucose-6-phosphate dehydrogenase (G6PD), glutathione reductase (GR), and glutathione-S-transferase (GST) were determined in leukocytes. To evaluate damage to DNA, including oxidative damage, comet assay tests were performed concomitantly with biochemical analysis and the last measurement of PbB and ZPP was done.
The control group comprised of 42 male administrative workers with an age range of 21–60 years and PbB < 10 μg/dL. None of the individuals from this group was occupationally exposed to lead. The medical reports of the control subjects revealed no history of any chronic disease.
The experimental protocol was approved by the Bioethics Committee of the Medical University of Silesia in Katowice (no. NN-6501-36/I/06).
Laboratory procedures
Sample collection and preparation of the lysates of erythrocytes and leukocytes
To obtain whole blood, erythrocytes and leukocytes, 14 mL of blood was drawn by venipuncture into tubes containing an ethylenediaminetetraacetic acid (EDTA) solution as an anticoagulant. Immediately after blood sampling, 5 mL of the whole blood was centrifuged. The plasma supernatant was removed. The sedimented erythrocytes were washed three times through centrifugation with 0.9% sodium chloride (NaCl) solution and then lysed with bidistilled water. Finally, 10% (v/v) hemolysate was prepared. To isolate the leukocytes, 3 mL of the whole blood was layered over Histopaque-1077 (Sigma-Aldrich, St Louis, Missouri, USA) in a 1:1 ratio and centrifuged for 30 min. Leukocytes (1.5 mL) were collected from the interface and washed three times through centrifugation with 0.9% NaCl solution. Finally, the lysate of leukocytes was prepared in 1.5 mL of bidistilled water.
Isolation of leukocytes and comet assay method
The isolation of leukocytes from whole blood was performed by the gradient density centrifugation method using Histopaque solution 1077 (Sigma-Aldrich). Four milliliter of whole blood was carefully layered on top of 4 mL of Histopaque 1077 and then centrifuged for 30 min. The leukocytes were collected (about 1 mL) from the intermediate zone between Histopaque and plasma. The leukocytes were then washed in a 0.9% NaCl and centrifuged. The 900 μL of serum (Gibco®, Thermo Fisher Scientific, Waltham, Massachusetts, USA) and 100 μL of dimethyl sulfoxide medium were added to the cell pellet and mixed. The cell suspension was stored at −80°C.
Comet assay method
DNA damage was analyzed in blood leukocytes using an alkaline comet assay according to the method of Singh et al., 10 with some modifications. The slides were prepared in duplicate per subject. A 100 μL suspension of leukocytes and 1% low melting point agarose (Sigma-Aldrich) dissolved in phosphate-buffered saline was placed on a microscope slide that had been pre-coated with 0.5% normal melting point agarose (Sigma-Aldrich). Coverslips were placed on the gels, which were left to set on ice. After gently removing the coverslips, the slides were immediately submersed in a lysis solution (2.5 M NaCl, 100 mM EDTA, 10 mM Tris, 1% Triton X-100, pH 10) at 4°C for 1 h in the dark. The slides were then washed with a cold buffer solution (40 mM Hepes, 0.1 M potassium chloride, 0.5 mM EDTA, and 0.2 mg/mL bovine serum albumin). To detect oxidative damage, the slides were covered with 50 μL of formamidopyrimidine-DNA glycosylase (FPG) in a buffer solution and incubated for 30 min at 37°C. Then, the slides were placed in a horizontal electrophoresis tank filled with electrophoresis buffer (300 mM sodium hydroxide and 1 mM EDTA) for 40 min at 4°C to unwind and denature the DNA. Electrophoresis was performed for 30 min at 1.2 V/cm. All the steps were performed under red light to reduce additional light-induced DNA damage. After the electrophoresis, the slides were washed three times with a neutralization buffer (0.4 M Tris-HCl, pH. 7.5), dried, and stained with A 4,6-diamidino-2-phenylindole solution (1 μg/mL). The slides were stored in a closed humid chamber at 4°C for 20 h. The slides were then analyzed by the Comet, version 5.5, image analysis system (Kinetic Imaging, Ltd, Liverpool, UK). To quantify the DNA damage, the following comet parameters were evaluated: the percentage of DNA in the tail (% DNA T); the tail length (TL), and the tail moment (TM), which was calculated as the TL × the percentage of DNA in the tail (in arbitrary units).
Determination of lead exposure indices
Analysis of PbB was performed by graphite furnace atomic absorption spectrophotometry using Unicam 929 and 939OZ Atomic Absorption Spectrometers (ATI, Unicam, Cambridge, UK) with GF90 and GF90Z Graphite Furnaces. In this method, a mixed matrix modifier solution containing 0.1% v/v nitric acid, 0.2% m/v ammonium dihydrogen phosphate, and 0.5% m/v Triton X-100 was used. One hundred microliters of whole blood was mixed with 900 mL of the mixed matrix modifier solution. The mixed matrix modifier solution stabilized the lead to 900°C and resulted in well-shaped lead peaks. The alternative lead resonance line of 283.3 nm was used to overcome any possible phosphate interference. An injection temperature of 75°C was used to reduce the furnace dry phase time. The calibration curves were done automatically by the spectrometer. A standard solution ClinCal® and ClinChek® controls (Recipe Chemicals, Germany) were used. Coefficient of variation was between 1.64% and 2.18%. Standard deviation (SD) was between 0.70 μg/dL and 0.93 μg/dL. The detection limit was 0.5 μg/dL and recovery 95–105%. Data were expressed as micrograms per deciliter. ZPP levels were measured using the Aviv Biomedical Hematofluorometer Model 206 (Lakewood, New Jersey, USA). In this method, light is filtered by means of an interference filter transmitting at a wavelength of 415 nm. The excitation light is focused on a drop of blood. The emitted light passes through a narrow band interference filter, which transmits at a wavelength of 596 nm. The instrument measures the ratio of fluorescent substance (ZPP) to the absorption of the light in the sample (hemoglobin (Hb)) and displayed as micrograms of ZPP per gram of Hb (µg/g Hb). Hb level was measured in hemolystate by the cyanmethemoglobin assay.
Biochemical analysis
The levels of MDA were determined as per Ohkawa et al. 11 The results were recorded as micromoles per gram of protein (µmol/g P). TAC was measured according to Erel. 12 Data are shown as micromoles per liter. The method of Oyanagui 13 was used to measure the activity of SOD in leukocytes. The enzymatic activity of SOD was expressed in nitric units (NU). The activity of SOD is equal to 1 NU when it inhibits nitric ion production by 50%. Activities of SOD were normalized to milligrams of protein (NU/mg protein). The CAT in leukocytes was measured by the Aebi 14 kinetic method. CAT activity was expressed as international units per milligram of protein in leukocytes (IU/mg protein). The activities of G6PD and GR in leukocytes were measured according to Richterich. 15 G6PD activity was expressed as micromoles of reduced form of nicotinamide adenine dinucleotide phosphate (NADPH) produced per minute normalized to 1 g of protein (IU/g P), whereas the activity of GR was expressed as micromoles of NADPH utilized per minute normalized to 1 g of protein (IU/g P). The activity of GST in leukocytes was measured according to the kinetic method of Habig and Jakoby. 16 The activity of GST was expressed as micromoles of thioether produced per minute normalized to 1 g of protein (IU/g P). The amount of protein in the serum was measured by the biuret method by Richterich. 15
Statistical analysis
Statistical analysis was performed using Statistica 10.0 PL software. The statistical methods included the mean and SD. The Shapiro–Wilk test was used to verify normality, whereas Levene’s test was used to verify the homogeneity of variances. Statistical comparisons between groups were made by analysis of variance (ANOVA), non-parametric post hoc test, Student’s t test, a t test with separate variance estimates, or a Mann–Whitney U test. Additionally, a multivariate regression analysis was performed and Spearman correlations were calculated. An α value of p < 0.05 was considered to be statistically significant.
Results
The percentage of smokers, mean height, and body mass did not differ between examined subgroups and the control group. BMI was not different in the LE and HE subgroups and control group, while in the ME group BMI was higher by 8% compared to the controls. Analogically, mean age was not different in the LE and ME subgroups and control group, while in the HE group BMI was higher by 14% compared to the controls. Number of years of work under lead exposure did not differ among the exposed subgroups (Table 1). The results of multivariate regression showed that the influence of confounding factors, such as age, years of work number, BMI, and smoking habits, on comet assay parameters was not confirmed in this analysis.
Demographic data.a
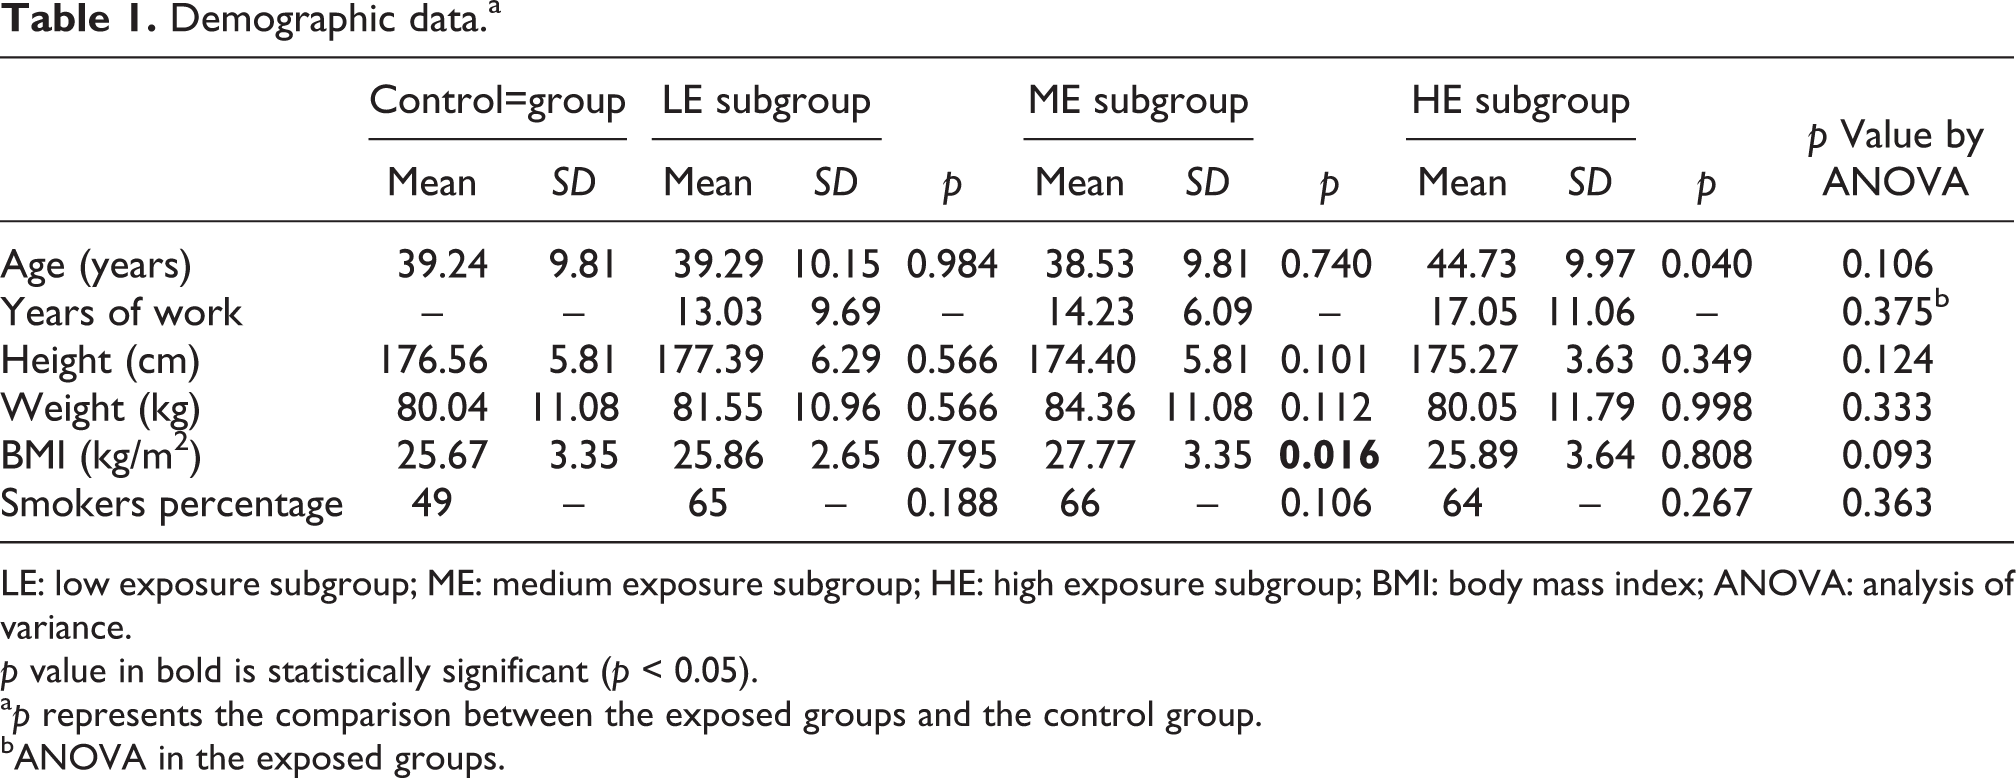
LE: low exposure subgroup; ME: medium exposure subgroup; HE: high exposure subgroup; BMI: body mass index; ANOVA: analysis of variance.
p value in bold is statistically significant (p < 0.05).
a p represents the comparison between the exposed groups and the control group.
bANOVA in the exposed groups.
Values of the lead exposure indices were significantly higher in the exposed subgroups than in the control group, what is a result of the study design and the division of the study population (Table 2).
Markers of lead exposure.a

LE: low exposure subgroup; ME: medium exposure subgroup; HE: high exposure subgroup; ZPPmean: the mean level of zinc-protoporphyrin in the blood calculated based on measurements performed every 3 months for 2 years of observation prior to the study; ZPP: current level of zinc-protoporphyrin in the blood; PbBmean: the mean level of lead in the blood calculated based on measurements performed every 3 months for 2 years of observation prior to the study; PbB: current level of lead in the blood; ANOVA: analysis of variance; Hb: hemoglobin. p value in bold is statistically significant (p < 0.05).
a p represents the comparison between the exposed groups and the control group.
bANOVA in the exposed groups.
The values of % DNA T were significantly higher in the LE, ME, and HE subgroups compared to the control group by 10%, 15%, and 20%, respectively. The values of TL in the ME and HE groups were significantly higher by 22% and 41%, respectively. Similarly, the values of TM were significantly higher in these subgroups by 38% and 65%, respectively (Table 3).
Comet assay parameters.a

LE : low exposure subgroup; ME: medium exposure subgroup; HE: high exposure subgroup; % DNA T: the percentage of DNA in the tail; ANOVA: analysis of variance; TL: tail length; TM: tail moment. p value in bold is statistically significant (p < 0.05).
a p represents the comparison between the exposed groups and the control group.
The activity of GR was significantly lower in the LE and ME subgroups compared to the control group by 25% and 17%, respectively. Analogically, the activity of G6PD was significantly lower in the ME group by 25%, while the activity of GST was significantly higher in the HE subgroup by 101% compared to the control group. The activity of SOD was significantly higher in the LE and ME subgroups by 48% and 34%, respectively, whereas the activity of CAT did not differ between each of exposed subgroups and the control group (Table 4).
The activities of antioxidant enzymes, the level of MDA, and the TAC value.a

LE: low exposure subgroup; ME: medium exposure subgroup; HE: high exposure subgroup; SOD: superoxide dismutase, CAT: catalase; GR: glutathione reductase; G6PD: glucose-6-phosphate dehydrogenase; GST: glutathione-S-transferase; MDA: malondialdehyde; TAC: total antioxidant capacity; ANOVA: analysis of variance. p value in bold is statistically significant (p < 0.05).
a p represents the comparison between the exposed groups and the control group.
The MDA level was significantly higher in the LE, ME, and HE subgroups compared to the control group by 43%, 57%, and 108%, respectively. However, the values of TAC did not differ between each of examined subgroups and the control group (Table 4).
ANOVA and a non-parametric post hoc test showed that the values of % DNA T were significantly different between the HE and LE subgroups, the values of TL and TM were significantly different between the ME and LE as well as HE and LE subgroups, the activities of GST were significantly different between the HE and ME as well as HE and LE subgroups, the levels of MDA were significantly different between the HE and LE subgroups.
The comparison made between the subgroup of subjects younger than 40 years and older than 40 years showed that the values of ZPP and ZPPmean were higher in the second group compared to the first by 26% and 27%, respectively. When comparing subgroups of subjects with BMI < 26.1 kg/m2 and BMI ≥ 26.1 kg/m2, smokers and nonsmokers, and subjects working for 11 years or less and subjects working for more than 11 years, we did not report any significant differences.
Spearman correlations showed positive correlations between PbB and % DNA T (R = 0.48; p < 0.001), TL (R = 0.45; p < 0.001), TM (R = 0.49; p < 0.001), SOD activity (R = 0.28; p < 0.001), GST activity (R = 0.21; p = 0.002), MDA level (R = 0.41; p < 0.001), and TAC value (R = 0.24; p = 0.006). However, negative correlations are shown between PbB and the activities of G6PD (R = −0.19; p = 0.019) and GR (R = −0.21; p = 0.002). Analogical correlations are shown for other measured lead exposure indices (Table 5).
Spearman correlations between lead exposure indices and other measured parameters.

NS: non significant; ZPPmean: the mean level of zinc-protoporphyrin in the blood calculated based on measurements performed every 3 months for 2 years of observation prior to the study, ZPP: current level of zinc-protoporphyrin in the blood; PbBmean: the mean level of lead in the blood calculated based on measurements performed every 3 months for 2 years of observation prior to the study; PbB: current level of lead in the blood; % DNA T: the percentage of DNA in the tail; SOD; superoxide dismutase; CAT: catalase; GR: glutathione reductase; G6PD: glucose-6-phosphate dehydrogenase; GST: glutathione-S-transferase; MDA: malondialdehyde; TAC: total antioxidant capacity.
a p < 0.001.
b p < 0.01.
c p < 0.05.
Positive correlations were shown also between % DNA T and the activity of SOD (R = 0.20; p = 0.024) and MDA level (R = 0.43; p < 0.001), between TL and the activities of SOD (R = 0.31; p < 0.001), GST (R = 0.54; p < 0.001), CAT (R = 0.25; p = 0.004), and MDA levels (R = 0.55; p < 0.001), and between TM and the activities of SOD (R = 0.30; p < 0.001), GST (R = 0.45; p < 0.001), CAT (R = 0.19; p = 0.029), and MDA level (R = 0.56; p < 0.001). However, TM correlated negatively with G6PD (R = −0.24; p = 0.032; Table 6).
Spearman correlations between comet assay parameters and markers of oxidative stress and the antioxidant defense.

NS: non significant; % DNA T: the percentage of DNA in the tail; SOD: superoxide dismutase; CAT: catalase; GR: glutathione reductase; G6PD: glucose-6-phosphate dehydrogenase; GST: glutathione-S-transferase; MDA: malondialdehyde; TAC: total antioxidant capacity.
a p < 0.05.
b p < 0.01.
c p < 0.001.
Discussion
The values of the comet assay parameters in the examined subgroups and their correlations with the PbB level and ZPP indicate that lead exposure induces DNA damage, including oxidative damage, in a dose-dependent manner. Other studies on this topic support our results. Chinde et al. 17 showed a higher % DNA T in 200 battery-manufacturing workers (PbB = 30.1 ± 4.13 µg/dL) than that in the unexposed controls (PbB = 6.71 ± 0.97 µg/dL). Consistent results were shown in other studies on industry workers. 18 –24
The analysis of the confounding factors in the above-mentioned studies is not conclusive. In this study, to evaluate the role of confounders, a multivariate regression analysis and comparisons between subgroups of smokers and nonsmokers and subgroups of subjects divided on the basis of the median age, years of work, and BMI were performed. The results showed that the examined confounders did not affect the DNA damage intensity or the values of the measured biochemical parameters, except for ZPP. We showed that subjects older than 40 years had a significantly higher concentration of ZPP and ZPPmean than did the younger subjects. This observation might be associated with the possibility of an age-related greater susceptibility to toxic action in the enzymatic pathways or higher total lead body burden due to the accumulation of lead in bones. The results of the other studies are difficult to compare because of the completely different demographic and epidemiological characteristics of the examined populations, the different study protocols, and the complexity of the involved pathophysiological mechanisms. 17 –21 Additively, associations between lead exposure and DNA damage may be modified by gene polymorphisms. For instance, it has been shown that workers, who had the ALAD1-1 genotype, were more susceptible to the DNA damage development than those carrying the ALAD1-2 genotype. 25 This higher susceptibility of ALAD1 homozygotes is likely due to the toxicity of ALA, which is believed to mediate the genotoxic effects of lead and accumulates in a greater amount in ALAD1 homozygotes than in heterozygotes. 26,27
A comet assay was used to evaluate the DNA damage from lead poisoning in several animal studies as well. In these studies, different species of animals in different developmental stages were poisoned with lead salts administered orally or parenterally. Despite the mentioned differences between the protocols of the experimental studies, their results consistently confirm the ability of lead to induce DNA damage. The level of damage was related to the lead dosage, the time of exposure, and the examined tissues. 28 –31 The results of in vivo and in vitro studies are in agreement. Lead nitrate increased the % of DNA T in human lymphocytes in a dose-dependent manner. 22 In another study on human lymphocytes, a comet assay modified by the inclusion of FPG showed that lead acetate induces oxidative damage to DNA, which is shown in this study. 32
The genotoxicity of lead was investigated in many in vivo and in vitro studies by means of methods other than the comet assay. The results of these papers are discordant, whereas the results of papers using the comet assay are much more consistent. 8 These discrepancies might be because cytogenetic tests and comet assays detect different types of DNA damage. The cytogenetic tests detect cumulative damage, whereas the comet assay provides information on a type of damage that could be easily repaired and reflects recent exposures. The divergent results of cytogenetic tests might be a result of the interference between lead and the DNA repair system which was postulated in a study of Jannuzzi and Alpertunga, 20 who showed decreased DNA repair capacity due to lead toxicity. However, the consistency of the data obtained in studies using a comet assay might result from the stronger relationship between DNA damage, which these assays detect, and PbB, which reflects rather short-term exposure and is commonly measured in these studies. This hypothesis is supported by our study. The parameters of a comet assay have stronger correlations with PbB (R = 0.48, R = 0.45, R = 0.49) than with PbBmean (R = 0.38, R = 0.33, R = 0.37). The correlations with ZPP and ZPPmean, which reflect long-term exposure, were weaker as well (0.20 ≤ R ≤ 0.30).
Several mechanisms have been proposed to explain how lead induces damage to DNA. 33 However, the results of this study indicate that lead might exert its genotoxicity though the promotion of oxidative stress. We showed that the MDA levels increase with increasing PbB in a dose-dependent manner and correlate positively with the DNA damage measured by a comet assay (R = 0.43, R = 0.55, R = 0.56). The results of our previous studies on a similar group of workers 34 and other research evaluating the levels of lipid peroxidation markers in lead exposed workers support our study. 17,19,35– 37 Although the MDA level was higher in the exposed subgroups than in the control group, the value of TAC did not differ between the groups of exposed and unexposed subjects. This result might suggest that postulated lead-induced overproduction of ROS is not accompanied with adequate response of the antioxidant defense system.
The associations of DNA damage and lead exposure with the activities of the enzymes related to antioxidant defense are markedly more complicated than the association with MDA levels. The first line of defense against ROS is SOD, which utilizes superoxide anions to hydrogen peroxide. In this study, the activity of SOD was significantly higher in the LE and ME subgroups than in the control group. Simultaneously, positive correlations between the SOD activity and the markers of exposure were shown (0.28 ≤ R ≤ 0.32). These results suggest that low and medium doses of lead induce SOD activity, whereas high doses of lead might be able to override this defense mechanism. This hypothesis is supported by the results of our previous study on a similar group of workers. In this study, an elevated expression of the SOD1 gene (Sod1) was shown in workers with PbB = 42.93 ± 10.26 μg/dL compared to that in the unexposed controls, whereas in the workers with PbB = 48.50 ± 7.7 μg/dL Sod1 expression was the same as in the controls. 3 In light of this finding, positive correlations between the % DNA T, TL, and TM and the SOD activity (R = 0.20, R = 0.31, R = 0.30) should be interpreted as a part of the compensatory defense mechanism against oxidative damage. However, an analysis of the results of the studies conducted on other populations is not conclusive. In a group of 60 workers exposed to high doses of lead (53.41 ± 1.21 μg/dL), a higher activity of SOD in erythrocytes was shown than in the control group, 38 whereas in another group of 63 workers with low lead exposure (PbB = 17.8 ± 11.5 μg/dL), the plasma SOD activity was the same as that in the control group. 39 Additionally, the results of animal studies are inconsistent. 3
The discrepancies between these studies are probably because the SOD activity measured at the end point of a particular study is a result of the simultaneous action of antagonistic mechanisms triggered by lead. Lead increases the level of superoxide anions, which in turn induce Sod expression. Sod might be inactivated by toxic metabolites of lipid peroxidation or its expression might be modified by lead interference with transcription factors or by lead-induced changes in DNA methylation. Lead might interact with SOD1 and SOD3 cofactors (copper and zinc) and bind to the thiol groups of its active site, which are necessary for the maintenance of catalytic properties. 3
CAT is a heme-containing enzyme that utilizes hydrogen peroxide produced by SOD. 40 The activity of CAT in lead exposure might be determined by antagonistic mechanisms, which is similar to the SOD activity. Lead might indirectly induce the expression of the CAT gene (Cat) by increasing the level of its substrate. However, the activity of CAT might be impaired by the interference of lead with its cofactor (iron), heme biosynthesis, and the thiol groups of the active site of the enzyme. 3 In this study, the activities of CAT in the exposed subgroups and in the control group did not differ significantly. This result could be due to the dynamic balance of the mechanisms promoting increases and decreases of CAT activity. Consistent results were obtained in studies on workers exposed to low doses of lead, in whom the activities of CAT were unchanged compared to those of the controls. 37,41 –43 However, the activity of CAT was significantly elevated in workers exposed to high doses of lead, 35 whereas in workers exposed to medium doses of lead the activity of CAT was significantly decreased. 17,19 Similarly, decreased CAT activity has been reported by many experimental studies on animals. 3
Three lasting enzymes that were investigated in this study are related to the metabolism and functioning of glutathione, one of the most important thiol antioxidants in the human body. G6PD provides NADPH, which is necessary for the oxidized glutathione reduction catalyzed by GR. 1,2 In the ME subgroup, a significantly decreased activity of G6PD compared to that of the control group was shown. Moreover, a negative correlation (R = −0.24) between the G6PD activity and TM value was reported. These results should be interpreted as a harmful action of lead on the antioxidant defense system. This hypothesis is supported by our previous studies on a similar group of workers. In these studies, we showed decreased activity of G6PD in the erythrocytes of lead exposed subjects, which was normalized by the administration of antioxidants, such as N-acetylcysteine and β carotene. 44,45 Analogical results were obtained in a study on rats. 46 An in vitro study by Lachant et al. 47 confirms that lead inhibits G6PD by binding to the thiol groups at its active site. On the other hand, lead might induce G6PD activity through a decrease in the NADPH/NADP+ ratio. This possible mechanism explains the results of a study by Gurer-Orhan et al., 35 who reported elevated G6PD activity in workers exposed to high doses of lead. These results suggest that the association between the lead level and G6PD activity is as complex as in the case of SOD and CAT.
GR is an enzyme related to G6PD activity. In the LE and ME subgroups, a significant decrease in GR activity was reported. Negative correlations between the GR activity and the marker levels of lead exposure were observed. These results suggest the ability of lead to reduce GR activity with a medium level of lead exposure. Malekirad et al. 42 showed that very low exposure to lead (PbB = 9.6 ± 3.2) might induce GR activity. However, experimental studies on rats and mice show a negative effect of lead on GR activity. 48 –51
The GST activity was significantly higher in the HE subgroup than in the control group and correlated positively with the lead exposure markers (0.16 ≤ R ≤ 0.21). Besides, the activity of GST in the HE subgroup was significantly higher than in the ME and LE subgroups. This elevation might be a part of a defense system against lead toxicity because GST is responsible for utilization of toxic metabolites or xenobiotics. 45 In light of this information, a positive correlation between the GST activity and TL or TM (R = 0.54, R = 0.45) should be interpreted as a manifestation of the compensatory defense mechanism against oxidative stress, which seems to be efficient when lead exposure level is relatively high. This hypothesis is confirmed by Tsai et al., 52 who showed that a decrease in the glutathione level induces elevation of the pi class of GST in rat hepatocytes. Consistent results were shown by Conterato et al., 53 who reported elevated GST activity in battery-manufacturing workers (PbB = 49.8 ± 4.0 µg/dL) and painters (PbB = 5.4 ± 0.4 µg/dL).
The results from this study need to be evaluated within the context of its strengths and limitations. A major limitation was the fact that the total lead body burdens of examined subjects and ALA levels were not estimated. Besides, the possible confounding role of other pollutants was not taken into consideration. On the other hand, selection of an adequate control group was a major study strength. As the next study strengths should be regarded the homogeneity of the examined group and correlating the results of comet assay with biochemical markers of both oxidative stress and the antioxidant defense measured in leukocytes (a minority of papers on the oxidative stress in lead exposure focus on leukocytes).
Conclusions
Lead exposure with PbB above 20 µg/dL results in elevated DNA damage, including oxidative damage and elevated oxidative stress, measured as the MDA level, in leukocytes. The level of the pro-oxidative action of lead is dose dependent. Lead exposure is associated with modifications of the activities of the enzymes related to the antioxidant defense system. The obtained results suggest that workers exposed to lead might have an increased risk of developing cancer because of lead-induced DNA damage. This hypothesis must be verified in epidemiological studies.
Footnotes
Declaration of Conflicting Interests
The author(s) declared no potential conflicts of interest with respect to the research, authorship, and/or publication of this article.
Funding
The author(s) received no financial support for the research, authorship, and/or publication of this article.