
Abstract
Pentavalent antimonial (Sb5+) drugs such as meglumine antimoniate (MA) are the mainstay treatment of leishmaniases in developing countries. The effects of these compounds on drug-metabolizing enzymes have not been characterized and their potential pharmacokinetic interactions with other drugs are therefore unknown. The present study investigated whether treatment with MA (300 mg Sb5+/kg body weight/day, subcutaneously) for 24 days affected the activities of cytochrome P450 (CYP)1A (ethoxyresorufin-O-deethylase), CYP2A5 (coumarin 7-hydroxylase), CYP2E1 (p-nitrophenol-hydroxylase), CYP2B9/10 (benzyloxy-resorufin-O-debenzylase), or CYP3A11 (erythromycin-N-demethylase) in the livers of Swiss Webster (SW) and DBA-2 male and female mice. The results showed that CYP2A5-, CYP2E1-, and CYP3A11-catalyzed reactions were unaffected by MA treatment. A decrease in CYP2B9/10 activity was noted in DBA-2 females (but not males) and was not observed in SW males or females. However, repeated MA administration reduced mouse liver CYP1A activity. CYP1A2 messenger RNA (mRNA) levels were not affected by MA and in vitro exposure of mouse liver microsomes to Sb3+ and Sb5+ did not reduce CYP1A activity. These findings suggested that in vivo treatment with Sb5+ drugs depressed CYP1A activity, without downregulating CYP1A2 mRNA expression. Since in vitro treatment of liver microsomes failed to inhibit CYP1A activity, this effect may require intact cells.
Keywords
Introduction
Pentavalent antimonial (Sb5+) drugs such as meglumine antimoniate (MA; Glucantime®, Sanofi-Aventis Farmacêutica Ltd., Suzano, Sao Paulo, Brazil) have long been used to treat leishmaniases. 1 A small number of clinical and experimental findings suggest that Sb5+ drugs may alter the activity of some drug-metabolizing enzymes. Hepburn et al. 2 noted that a 20-day course of treatment with sodium stibogluconate (SSB) markedly delayed the elimination of caffeine in patients with cutaneous leishmaniasis. Caffeine clearance in humans and rodents is governed by the activity of the cytochrome P450 (CYP) 1A enzyme subfamily. In addition, rats exposed to potassium antimony tartrate (Sb3+) via drinking water (500 ppm) for 90 days showed enhanced liver activities of ethoxyresorufin-O-deethylase (EROD, a marker for CYP1A) and glutathione S-transferase. 3
To date, the most striking indication that Sb compounds could alter CYP-mediated drug metabolism has come from an experimental study published over 30 years ago. Drummond and Kappas (1981) 4 demonstrated that a single dose (10 mg Sb/kg body weight (bw), subcutaneously) of Sb3+-containing parasiticidal drugs resulted in a strong induction of heme oxygenase (HO) activity, a decline in total CYP and microsomal heme contents, and marked depression of CYP-mediated activities in the rat liver. However, the authors found no alteration of HO activity, total CYP content, or monooxygenase activities after administration of a single dose of SSB to rats. The progressive accumulation of residual Sb in hepatocytes during a 21-day course of treatment with Sb5+ would be expected to reduce CYP activities, as proposed by Drummond and Kappas. 4 No further work, however, has been undertaken to test whether the induction of HO, the degradation of heme, and the consequent decline in monooxygenase activities reported by these authors correlated with Sb accumulation in liver cells.
In contrast to most other CYP forms, the activity of murine CYP2A5 (homologous to human CYP2A6), has been shown to be induced by a number of inflammatory and/or toxic conditions, which are commonly associated with liver injury, endoplasmic reticulum stress, and HO-1 overexpression. 5 –7 Additionally, metals (Cd2+, cobalt (Co), and tin) and some metalloids (As3+) were reported to induce HO in the liver and/or kidney 8 and some metals such as Co, Cd, and others were demonstrated to induce CYP2A5 activity in the mouse liver.
Based on these observations, we investigated whether a course of treatment with MA would lead to changes in the activities of CYP monooxygenases in the mouse liver. An ancillary hypothesis tested in this study was that residual Sb in the liver would enhance CYP2A5 activity in a similar manner to that reported previously for other metals, hepatotoxins, and HO inducers. In this context, we also evaluated whether MA treatment altered HO-1 expression or markers of liver tissue injury: serum alanine transferase (ALT) activity, serum aspartate aminotransferase (AST) activity, and liver glutathione (GSH) levels.
Materials and methods
Animals
Male and female Swiss Webster (SW) and DBA-2 mice were obtained from the Oswaldo Cruz Foundation breeding stock, aged 8–10 weeks. Upon arrival at our laboratory, 5–6 mice of the same sex and strain were housed per standard plastic cage with stainless steel coverlids and white Pinus wood shavings as bedding. Mice were maintained under controlled environmental conditions (12 h photoperiod with lights on from 8:00 a.m. to 8:00 p.m.; room temperature of 23 ± 2°C; relative humidity of approximately 70%) and had unlimited access to a commercial rodent diet (Nuvital CR1, Nuvilab®, Curitiba, Parana, Brazil) and filtered tap water. All procedures were conducted in accordance with Brazilian animal protection and welfare legislation and international guidelines. The study protocol was cleared by the Ethics Committee on the Use of Animals of the Oswaldo Cruz Foundation (License—LW-31/14).
Treatment
MA was administered by subcutaneous injections into the mouse back skin. According to the manufacturer, each ampoule (5 mL) of Glucantime contained 425 mg N-methyl MA/mL, or 85 mg Sb5+/mL. Analysis of ampoules of the same lot used in the study found levels of total Sb, Sb5+, and Sb3+ as high as 90.1, 86.9, and 3.2 mg/mL, respectively. Additional details can be found in our previous publications. 9,10
The animals were treated at 24-h intervals with subcutaneous injections (mouse back skin) of MA (300 mg Sb5+/kg bw/day) or its vehicle (potassium metabisulfite, 1.6 mg/mL and sodium sulfite, 0.18 mg/mL) for 24 days. The injected volume was 3.5 mL/kg bw/day. The animals were euthanized 24 h after the last injection.
To serve as a positive control of coumarin 7-hydroxylase (COH) induction, a group of SW was treated with cadmium chloride (CdCl2; 16 µmol/kg bw intraperitoneally, Cd) 6 h prior to euthanasia.
ALT and AST assays
ALT and AST activities were determined in the blood serum by a colorimetric method using a commercially available kit (Bioclin®, Belo Horizonte, Minas Gerais, Brazil). Blood was taken from the retro-orbital sinus immediately before euthanasia. Absorbance was read at 505 nm in a spectrophotometer, Spectramax Plus® (Molecular Devices, Sunnyvale, California, USA).
Determination of residual Sb levels
Levels of Sb in the liver tissue were determined by inductively coupled plasma mass spectrometry (ICP-MS), as described in detail elsewhere. 9,11,12 The limit of detection of the method was 1.0 ng Sb/g, while the limit of quantification was 3.3 ng Sb/g.
Measurement of liver monooxygenase activities
The livers were quickly removed from the euthanized mice, freed from fat and other tissues, weighed, and frozen in liquid nitrogen until further use. The liver microsomal fraction (LMF) was prepared as described previously 13 and the microsomal protein concentration was determined by Bradford assay 14 using bovine serum albumin as the standard.
Ethoxy (EROD) and benzyloxy (BROD)-resorufin-O-dealkylase activities were assayed in 96-well microplates using the method described by Kennedy and Jones, 15 with some modifications, as described by De-Oliveira et al.. 16 Substrate (ethoxy or benzyloxy resorufin) concentration was 5 µM and 0.025 mg of microsomal protein was added to each well. The reduced form of nicotinamide adenine dinucleotide phosphate (NADPH) regenerating system (G6P 5 mM; β-nicotinamide adenine dinucleotide phosphate (NADP) 0.25 mM; magnesium chloride (MgCl2) 2.5 mM and glucose-6-phosphate dehydrogenase (G6PD) 0.5 U/mL) was used. The reaction product (resorufin) was quantified using a fluorescence plate reader (Spectramax Gemini XS, Molecular Devices) with excitation and emission wavelengths of 530 nm and 590 nm, respectively.
COH activity was determined as previously described, 17 with modification for microplate. 16 Substrate (coumarin) concentration was 10 µM and 0.040 mg of microsomal protein was added to each well. The NADPH regenerating system (G6P 10 mM; β-NADP 0.4 mM; MgCl2 10 mM; and G6PD 0.5 U/mL) was used. Umbelliferone (7-hydroxycoumarin) was quantified using a fluorescence plate reader (Spectramax Gemini XS, Molecular Devices), with excitation and emissions wavelengths of 355 nm and 460 nm, respectively.
p-Nitrophenol-hydroxylase (PNPH) activity was assayed using the real-time kinetic method reported by Allis and Robinson (1994). 18 The substrate (0.1 mM p-nitrophenol) and microsomal protein (0.2 mg) were added to quartz cuvettes, where the reaction took place. The NADPH regenerating system (G6P 5 mM; β-NADP 0.25 mM; and G6PD 1 U/mL) was used. The activity was determined using a spectrophotometer Shimadzu UV1601 (China), and the wavelength was setted in 480 nm.
Erythromycin-N-demethylase (END) activity was determined as previously described, 19 with some modifications. Erythromycin (1 mM), microsomal protein (1 mg), and NADPH regenerating system (G6P 10 mM; β-NADP 0.4 mM; MgCl2 10 mM and G6PD 1 U/mL) were used. The formaldehyde, a product of Nash 20 reaction, was quantified using the absorbance at 412 nm using a spectrophotometer (Spectramax Plus, Molecular Devices).
In vitro inhibition of CYP1A by Sb3+ and Sb5+
SW male mice were treated with β-naphthoflavone (βNF), an aryl hydrocarbon receptor (AhR) ligand, and inducer of CYP1A1/2. Mice received three intraperitoneal injections of βNF (80 mg/kg bw/day) at 24-h intervals and were euthanized 24 h after the last injection. Hepatic microsomes were prepared from these mice and used to investigate whether Sb3+ (C4H4KO7Sb (1/2) H2O) or Sb5+ (K[Sb(OH)6]) inhibited the catalytic activity of CYP1A. Inhibition EROD tests were carried out in 96-well plates. α-Naphthoflavone (ANF, 10 and 50 µM) was used as a positive control substance.
Determination of GSH levels
GSH levels were measured as described previously, 7 with a few modifications to adapt to microplate. Briefly, the liver was removed immediately after euthanasia, washed in ice-cold phosphate-buffered saline, dried, and homogenized in 100 mM disodium phosphate (Na2HPO4) with 5 mM ethylenediaminetetraacetic acid (EDTA). The hepatic homogenate was centrifuged at 10,000g at 4°C for 15 min and the supernatant was frozen and kept at −70°C until further use. After thawing, the supernatant (10 μL) was incubated with 12.5 μL of 25% phosphoric acid and 37 μL of 0.1 M disodium phosphate with 5 mM EDTA, pH 8.0, for 10 min at 4°C. It was centrifuged again at 13,000g for 10 min at 4°C, and the resulting supernatant was incubated with 0.1% o-phthaldialdehyde methanol solution and the same basic buffer solution for an additional 10 min at room temperature. GSH concentration was then measured using a spectrofluorometer (Spectramax Gemini XS, Molecular Devices) with excitation and emission wavelengths of 365 nm and 420 nm, respectively.
Quantification of CYP1A2 and HO-1 mRNA levels by real-time reverse transcription polymerase chain reaction
Liver RNA was extracted using Trizol® reagent according to the manufacturer’s instructions. The RNA was quantified in a Biodrop® spectrophotometer and 3 µg were used as a template for complementary DNA synthesis using the Superscript II® system (Invitrogen®, Carlsbad, California, USA) and oligo DT primers (Promega®, Madison, Wisconsin, USA). This reaction was conducted in a T100™ Thermal Cycler (Bio-Rad®, Herculus, California, USA). Relative messenger RNA (mRNA) expression levels were determined using pre-developed Taqman® assays (Applied Biosystems®, Fostercity, California, USA) Mm00487224_m1, and Mm00516005_m1 for CYP1A2 and HO-1, respectively, and the assay EUK 18 S rRNA for the endogenous control. Real-time reverse transcription polymerase chain reaction (RT-PCR) reactions were performed in a 7500 Fast real-time thermocycler (Applied Biosystems). Calculation of the relative level of each target genes was carried out using the ΔΔCt method.
Statistical analyses
Data were analyzed by Student’s t-test or by the Mann–Whitney U-test. For the in vitro inhibition experiment, statistical comparisons were performed using one-way analysis of variance and Dunnett’s test using Graph Pad Prism version 5 for Windows, (GraphPad software, San Diego, California USA). A difference was considered statistically significant when p ≤ 0.05.
Results
Toxicity and residual Sb levels after multiple doses of MA
The 24-day course of treatment with MA (300 mg Sb5+/kg bw/day subcutaneously) did not alter body weight gain compared to vehicle-controls nor did it cause death or any other sign of overt toxicity in SW and DBA-2 mice of either sex. As shown in Table 1, repeated administration of MA resulted in an increased liver Sb level; at the end of the treatment period, this was somewhat greater in DBA-2 than in SW mice. Nonetheless, accumulation of residual Sb apparently caused no liver toxicity in either strain. Although the liver weight was slightly decreased in MA-treated SW mice, differences were no longer detected when organ weight data were expressed as relative (%) liver weights (i.e.
Levels of antimony (ppm) in the livers of female SW (Swiss) and DBA-2 mice.a

CO: vehicle-treated group; MA: meglumine antimoniate; SW: Swiss Webster.
aData are shown as the mean ± standard deviation of Sb concentrations (ppm or mg/kg dry weight) determined by inductively coupled plasma mass spectrometry. MA-treated group (300 mg Sb5+/kg body weight/day, subcutaneously).
b p < 0.05 using Student’s t-test.
Effects of a 24-day course of treatment with MA (300 mg Sb5+/kg bw/day, subcutaneously) in SW and DBA-2 mice.a
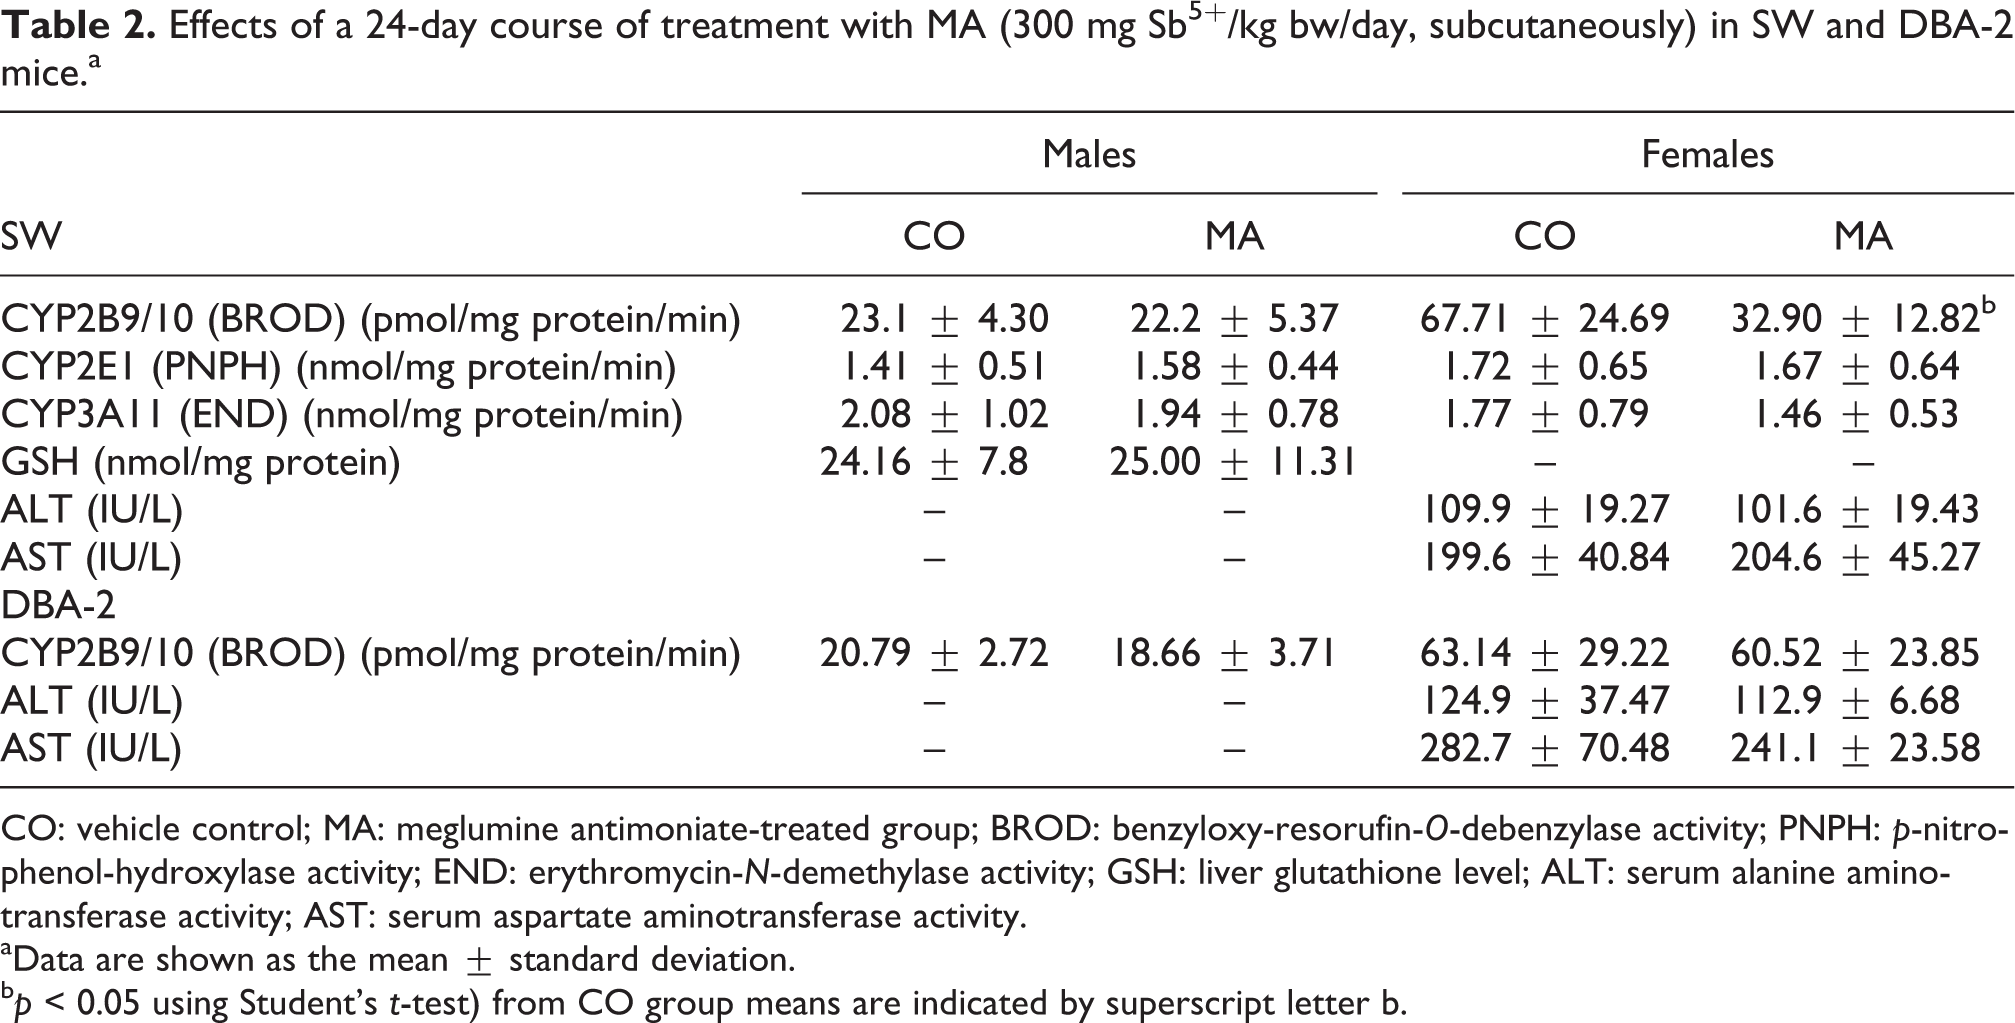
CO: vehicle control; MA: meglumine antimoniate-treated group; BROD: benzyloxy-resorufin-O-debenzylase activity; PNPH: p-nitro-phenol-hydroxylase activity; END: erythromycin-N-demethylase activity; GSH: liver glutathione level; ALT: serum alanine aminotransferase activity; AST: serum aspartate aminotransferase activity.
aData are shown as the mean ± standard deviation.
b p < 0.05 using Student’s t-test) from CO group means are indicated by superscript letter b.
Effects of MA on liver monooxygenase activities
Liver constitutive activity of COH, a marker for CYP2A5, was 15–20 times higher in the DBA-2 strain than in SW mice. As illustrated in Figure 1, a one-injection exposure to cadmium (CdCl2) caused an approximately 2.5-fold enhancement of COH activity. However, liver COH activity remained virtually unaltered after a 24-day course of MA treatment, irrespective of the mouse strain and sex (Figure 1). Liver activities of PNPH (CYP2E1) and END (CYP3A11) were also unaffected by MA treatment in male and female SW mice (Table 2).

Effects of a 24-day course of treatment with MA (300 mg Sb5+/kg bw/day, subcutaneously) or vehicle (CO) on the COH activity of CYP2A5 in the liver of SW (Swiss) and DBA-2 (DBA) mice (males and females). Histogram bar heights represent means ± SEM. A positive response to treatment with CdCl2 (16 μmol/kg bw intraperitoneally 6 h prior to euthanasia; Cd) is indicated in the right-hand panel (females). Differences (*p < 0.05, Student’s t-test) from CO group means are indicated by an asterisk. CO: vehicle control; COH: coumarin 7-hydroxylase; SW: Swiss Webster; CdCl2: cadmium chloride; MA: meglumine antimoniate; Cd: cadmium.
The repeated administration of MA decreased the hepatic activity of EROD (a marker for CYP1A) in male and female SW mice and in female DBA-2 mice. EROD activity was also lower in MA-treated DBA-2 males, as compared to the activity recorded in controls, but this difference did not reach statistical significance (Figure 2). A decline of BROD activity (a marker for CYP2B9/10) was noted in female SW mice treated with MA, but no treatment-related change in BROD activity was seen in male SW mice or in male or female DBA-2 mice (Table 2).
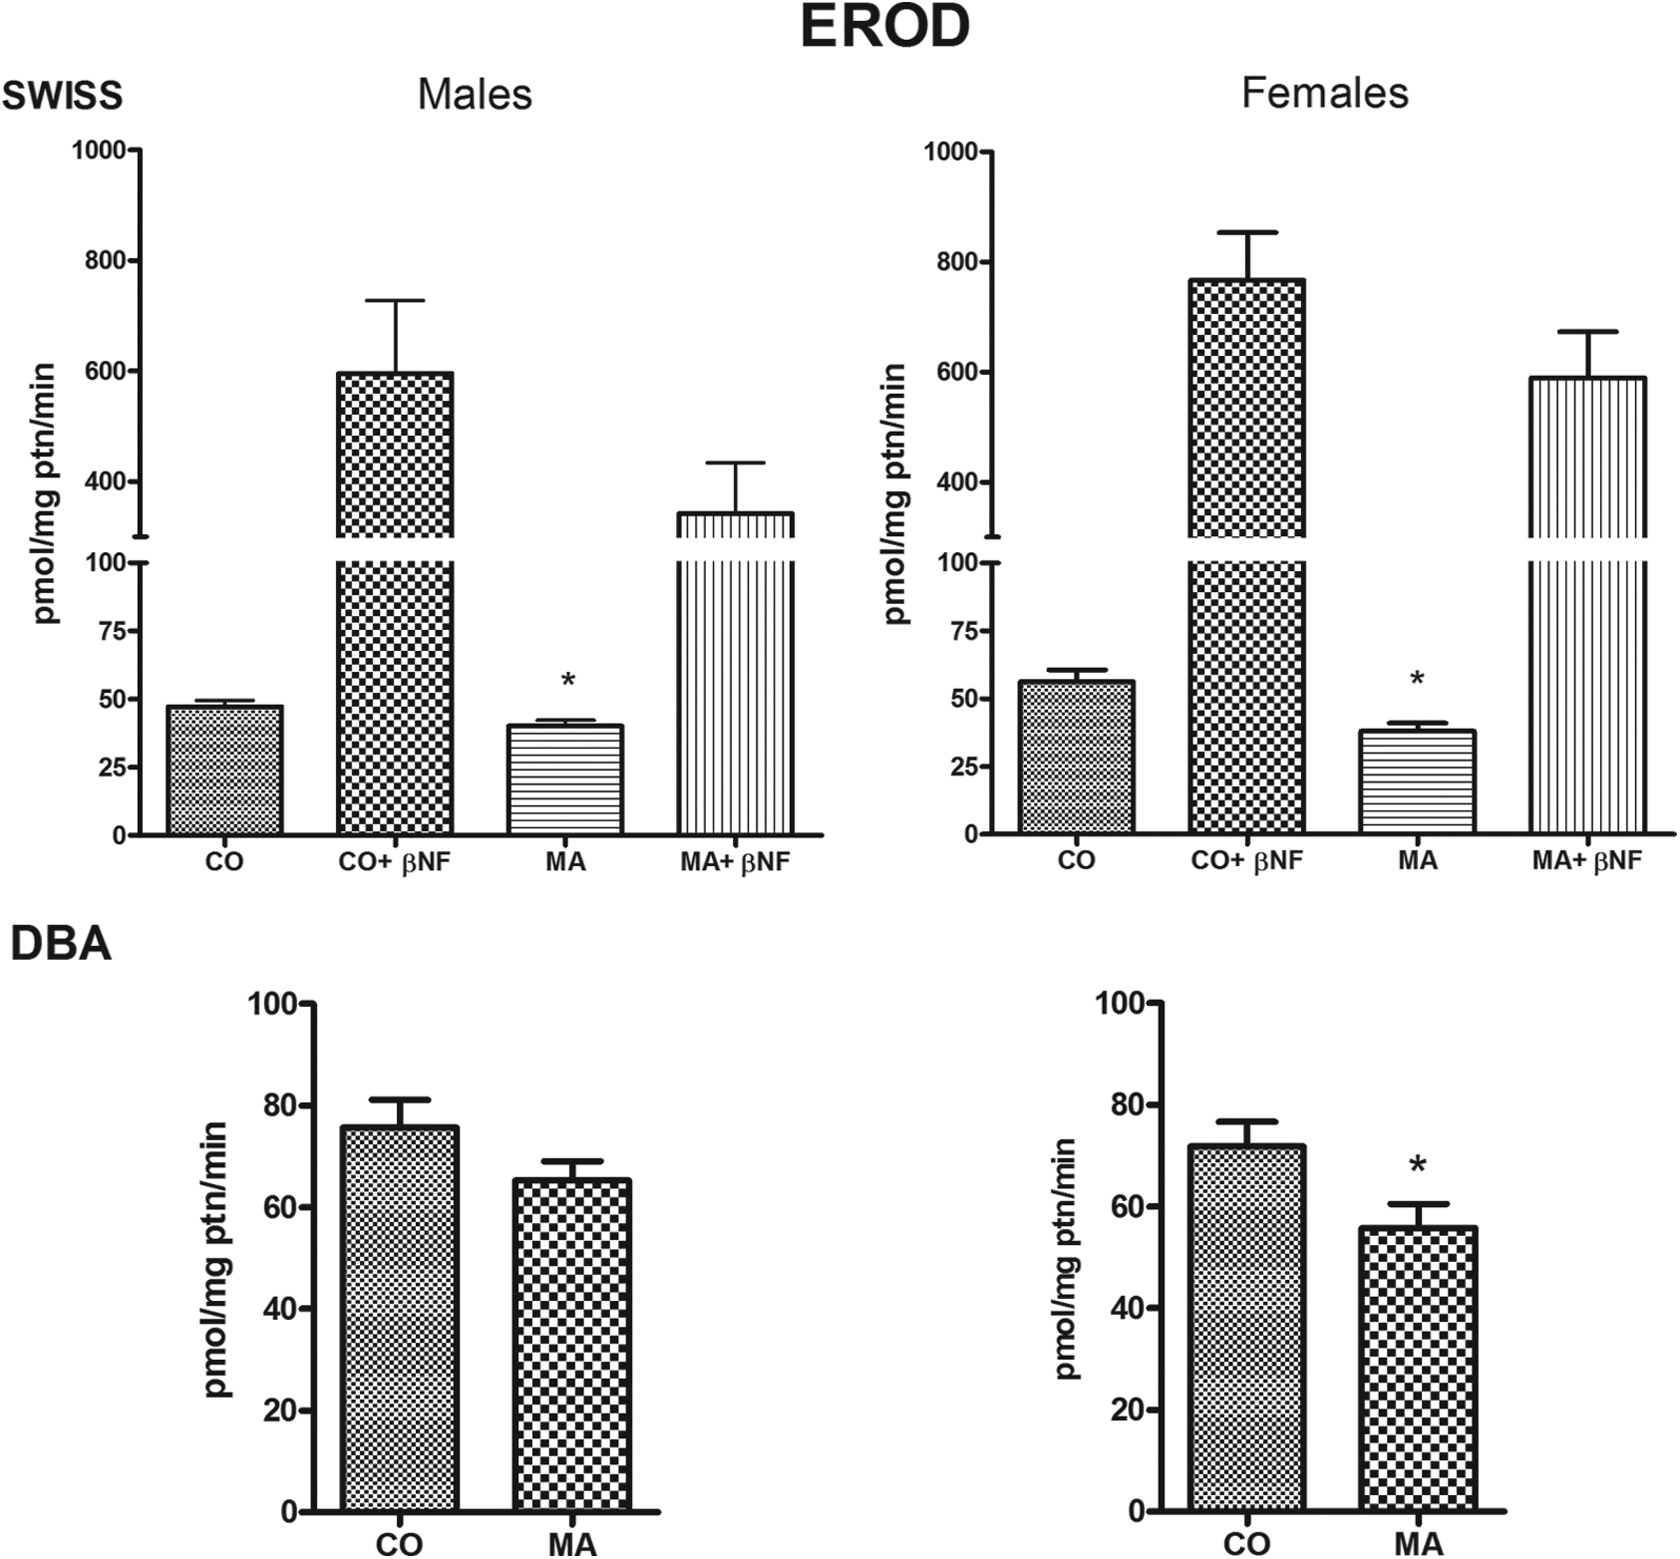
Effects of a 24-day course of treatment with MA (300 mg Sb5+/kg bw/day, subcutaneously) on the activity of CYP1A1/2 (EROD) in the liver of SW and DBA-2 mice. Histogram bar heights are means ± SEM. Histograms on the right (upper part) show the response of vehicle- (CO) and MA-treated mice to βNF (80 mg/kg bw/day intraperitoneally for 3 days prior to euthanasia). *p < 0.05, Student’s t-test. EROD: ethoxyresorufin-O-deethylase; MA: meglumine antimoniate; βNF: β-naphthoflavone.
Since MA depressed the constitutive activity of CYP1A (EROD) in the mouse liver, we investigated whether MA treatment, or the resulting Sb accumulation, impaired AhR-mediated CYP1A induction. SW mice receiving a 24-day course of treatment with MA and the respective controls were co-treated with a known AhR ligand (βNF, 80 mg/kg bw/day, intraperitoneally) for the last 3 days prior to euthanasia. As shown in Figure 2, EROD activity was similarly augmented in MA-treated and vehicle-control mice, suggesting that AhR-mediated upregulation of CYP1A expression was not impaired by MA. It is of note that βNF-induced EROD activity in MA-treated mice was lower than that observed in the control animals (βNF-treated only), although this difference did not achieve statistical significance.
In vitro inhibition of CYP1A by Sb3+ and Sb5+ compounds
A tentative explanation for the MA-associated depression of CYP1A activity is that Sb forms that accumulated within the liver cell would inhibit the catalytic activity of this protein. To test this hypothesis, we exposed mouse liver microsomes to a broad range of concentrations of Sb3+ and Sb5+ salts in vitro. To enrich the level of CYP1A protein, relative to other CYP forms (thereby making EROD a more selective marker of CYP1A1/2 activity in the microsomal fraction), microsomes were prepared from livers of SW mice that had been treated with βNF, a potent inducer of CYP1A. As shown in Figure 3, Sb3+ and Sb5+ compounds were tested at concentrations as high as 1000 µM but failed to cause any inhibition of EROD, whereas a known inhibitor of CYP1A (ANF, 10 or 50 µM), caused a pronounced and concentration-dependent inhibition of the microsomal catalytic activity.

In vitro effects of the indicated concentrations of Sb3+ and Sb5+ salts or water (CO) on CYP1A activity (EROD) in the SW mouse LMF. Histogram bar heights are means ± SEM. Bars on the right show the response to ANF, a known inhibitor of CYP1A. Microsomes were prepared from mice treated with the CYP1A inducing agent, βNF (80 mg/kg bw/day intraperitoneally for 3 days prior to euthanasia). Differences from the CO group mean are indicated by an asterisk (*p < 0.05, ANOVA and Dunnett’s test). CO: vehicle control; βNF: β-naphthoflavone; EROD: ethoxyresorufin-O-deethylase; SW: Swiss Webster; LMF: liver microsomal fraction; ANF: α-naphthoflavone; ANOVA: analysis of variance.
Effects of MA on the expression of CYP1A2 and HO-1 mRNAs in the liver
Figure 4 shows (box plot) that the hepatic levels of HO-1 mRNA in SW mice that received a 24-day course of treatment with MA did not differ from those observed in the control animals. In the same animals, the levels of CYP1A2 mRNA, the most abundant CYP1A form in the mouse liver, also remained virtually unaffected by MA treatment.

Effect of a 24-day course of treatment with MA (300 mg Sb5+/kg bw/day, subcutaneously) on the mRNA expression of CYP1A2 and HO-1 in the SW mouse liver. Data are displayed as box plots. CO and MA-treated groups did not differ statistically (N = 6 per group; p > 0.05, two-tailed Mann–Whitney U-test). CO: vehicle control; MA: meglumine antimoniate; Sb5+: pentavalent antimonial; HO: heme oxygenase.
Discussion
Antileishmanial Sb5+ drugs (MA and SSB) exhibit unique clinical pharmacokinetics. 21 –24 It is believed that the organic moieties of the MA (n-methyl-glucamine) and SSB (gluconate) structures serve as carriers of Sb5+ and play no other role in the efficacy and toxicity of these compounds. 22 –24 Moreover, most researchers consider Sb5+ compounds to be prodrugs that are reduced to active leishmanicidal Sb3+ form intracelluarly. 22 –24
The decrease in blood Sb concentrations following injections of Sb5+ drugs fits a two-compartment or multi-compartment model, the slow elimination phase of which has a half-life longer than 24 h. 9,11,12,24 Therefore, during a course of 21–30 injections spaced at 24-h intervals Sb nadir levels gradually rise so that 24 h after the last daily injection, the residual levels are substantially higher than those observed 24 h after the first injection. 9,11,12,21 Both the therapeutic and toxic effects of Sb5+ drugs apparently depend on the accumulation of residual antimony that takes place during courses of 20 days or longer, with injections at 24-h intervals. Studies of the tissue distribution of residual Sb in nonhuman primates 12 and in rats 9 showed that the liver was the organ that accumulated the highest level of Sb during MA treatment. The liver Sb content was also shown to decline very slowly after treatment discontinuation. 9,10,12
Data from the present study showed that a 24-day course of MA treatment did not alter the monooxygenase activities mediated by CYP2A5 (COH), CYP2E1 (PNPH), or CYP3A11 (END) in the mouse liver. However, the activity catalyzed by CYP1A1/2 (EROD) was consistently depressed in SW and DBA-2 mice treated with MA. A posttreatment decline in the activity of CYP2B9/10 was noted only in SW females. No change of BROD was found in SW males or in DBA-2 mice. Taken together, these findings were not consistent with the hypothesis that Sb5+ causes generalized depression of liver CYP activities, an effect that would be expected if repeated administration of Sb5+ drugs were in fact associated with heme degradation, as suggested by Drummond and Kappas. 4 It should be borne in mind, however, that Drummond and Kappas data indicated that the total liver microsome CYP content was decreased after a single dose of Sb3+ (tartar emetic and SbCl3), while no change in total CYP levels was noted after a single dose (82 µmol/kg bw, subcutaneously) of Sb5+ or SSB. Moreover, since we investigated the effects of a 24-day course of treatment on CYP activities, rather than acute treatment, it is possible that adaptive alterations might have occurred during the treatment period; acute dosing effects may differ from those elicited by repeated dosing. No effects of MA treatment on HO-1 mRNA expression or GSH levels were observed.
CYP2A5 activity is induced by conditions or chemical exposures that induce HO expression and activity as well as by endoplasmic reticulum stress and liver injury. 5 –8 Transient elevations of ALT and AST have been reported in patients treated with MA. 25 In nonhuman primates treated with standard and low-dose regimens, we previously reported dose-related liver histopathology findings (of slight to mild severity) that indicated enhanced hepatocyte necrosis. 26 However, the present study found no indication of liver damage and no induction of HO-1 in mice treated with MA. Therefore, these data were not consistent with the hypothesis that repeated MA administration and consequent accumulation of Sb within liver cells would lead to HO-1 induction and upregulation of CYP2A5 activity.
MA treatment reduced CYP1A activity in the mouse liver, an observation that was consistent with a previous report of reduced caffeine clearance in patients treated with Sb5+ drugs. 2 Caffeine clearance depends on an oxidation reaction catalyzed by liver CYP1A1/2 and is often used as an indicator of in vivo CYP1A activity. 2 The effective induction of CYP1A activity by βNF, a known AhR ligand, suggested that AhR-mediated regulation of CYP1A1/2 expression was not impaired in MA-treated mice. The notion that Sb5+ and/or Sb3+ (produced by intracellular reduction of Sb5+) could directly inhibit CYP1A catalytic activity was tested in liver microsomes, but no inhibitory effects were noted at concentrations of up to 1 mM. Future research could investigate whether inhibition of CYP1A protein by Sb5+ and/or Sb3+ can be observed in intact cell systems.
In conclusion, the results from the present study demonstrated that mouse CYP2A5-, CYP2E1-, and CYP3A11-mediated reactions were unaffected by a 24-day course of treatment with the antileishmanial Sb5+ drug, MA. However, repeated administration of MA consistently downregulated the activity of CYP1A2 and produced a less consistent inhibition of CYP2B9/10. In vitro treatment with Sb3+ and Sb5+ did not alter the CYP1A activity in mouse liver microsomes. The in vivo inhibition of CYP1A catalytic activity by Sb5+ drugs may involve mechanisms that are not operational in the isolated LMF.
Footnotes
Acknowledgments
The authors thank the Program for Technological Development in Tools for Health (PDTIS-FIOCRUZ) for providing its facilities. We are also grateful to Rafael CC Rocha (ICP-MS analysis), Maithê GP Magalhães and Paula Cristina C Andrade (RT-PCR) for their technical assistance.
Declaration of Conflicting Interests
The author(s) declared no potential conflicts of interest with respect to the research, authorship, and/or publication of this article.
Funding
The author(s) disclosed receipt of the following financial support for the research, authorship, and/or publication of this article: This study was supported by grants from the Rio de Janeiro State Agency for Supporting Research (FAPERJ, grant: E-26/103.00/2011), the Brazilian National Research Council (CNPq, grant: 478226/2011-0), and the National School of Public Health (INOVA-ENSP-002-FIO-14). DRC and FJRP are recipients of a PhD student and a senior researcher fellowship from CNPq, respectively. LF das Chagas and BSL were the recipients of Introduction to Scientific Research Fellowships from CNPq and FAPERJ respectively.