
Abstract
The purpose of this study was to characterize the zinc oxide nanoparticles (ZnO-NPs) and their bulk counterpart in suspensions and to access the impact of their acute oral toxicity at doses of 300 and 2000 mg/kg in healthy female Wistar rats. The hematological, biochemical, and urine parameters were accessed at 24 and 48 h and 14 days posttreatment. The histopathological evaluations of tissues were also performed. The distribution of zinc content in liver, kidney, spleen, plasma, and excretory materials (feces and urine) at 24 and 48 h and 14 days posttreatment were accessed after a single exposure at dose of 2000 mg/kg body weight. The elevated level of alanine amino transferase, alkaline phosphatase, lactate dehydrogenase, and creatinine were observed in ZnO-NPs at a dose of 2000 mg/kg at all time points. There was a decrease in iron levels in all the treated groups at 24 h posttreatment as compared to control groups but returned to their normal level at 14 days posttreatment. The hematological parameters red blood cells, hemoglobin, hematocrit, platelets, and haptoglobin were reduced at 48 h posttreatment at a dose of 2000 mg/kg ZnO-NPs and showed hemolytic condition. All the treated groups were comparable to control group at the end of 14 days posttreatment. The zinc concentration in the kidney, liver, plasma, feces, and urine showed a significant increase in both groups as compared to control. This study explained that ZnO-NPs produced more toxicological effect as compared to their bulk particles as evidenced through alteration in some hemato-biochemical parameters and with few histopathological lesions in liver and kidney tissues.
Introduction
The term nanomaterial actually refers to a diverse group of materials that vary in their physical and chemical properties, such as their size, composition, shape, and charge. Among the nanoparticles (NPs), zinc oxide (ZnO) are the most frequently used engineered NPs in consumer products. 1 They are widely used as an additive in various materials and products including textiles, cosmetics, rubbers, plastics, ceramics, glass, cement, lubricants, paints, and ointments. 1 –3 ZnO-NPs were also used as fillers in orthopedic and dental implants to enhance the hardness and mechanical properties. 4,5 The antimicrobial activity of dental products (toothpaste and an endodontic cement) was also increased by adding nanoparticulate ZnO, hence they inhibited the growth of bacteria (Enterococcus faecalis), which adhere to tooth surface. 6 It is also used as an anticancer agent in medical science. 7 Zinc (Zn) is an essential trace element in the human body further more used in food industries as a food additive and in packaging of food product because it has fungicidal and antimicrobial activity. 8,9 Along with extensive application of ZnO-NPs in the industrial field, it is conceivable that the human body may be intentionally or unintentionally exposed to NPs via several possible routes, including ingestion, inhalation, and dermal (direct contact with skin). 10 Among these, intake of NPs via gastrointestinal tract is one of the most important routes. 11,12 Few researchers have investigated the acute oral toxicity of ZnO in laboratory animals. 11,13,14 Wang et al. observed that ZnO (20 nm) exhibited toxicity at 2 g/kg body weight and found the incidence of lesions in liver, pancreas, heart, and stomach. 14 Baek et al. described the tissue distribution pattern and excretion profile of Zn in a single oral dose (2000 mg/kg) of ZnO-NPs in rats. 10 Rather few studies have shown that hemolytic anemia is caused by Zn or ZnO administration though the oral route. Such as Noel et al. reported that hemolytic anemia were caused in dog due to the exposure of ZnO, 15 chronic exposure of ZnO (640 mg/kg body weight/day) decrease the iron level in rats. 16 Most of the novel properties of NPs are related to their size. As decreasing size results in increasing NPs specific surface area to mass ratios, which promotes not only the accumulation of NPs but also increase of reactivity and enhanced interaction between NPs and biomolecules of target animal. 17 It is also reported that small NPs are more toxic to aquatic organism as compared to their bulk formulation. 18 For understanding ZnO-NPs toxicity, it is essential to identify the key factor of ZnO such as size, dissolution, surface charges, aggregation, and concentration. Hence, a study was planned for characterization of ZnO (bulk and nano) particles and their acute oral toxicity study at different time points (i.e. 24 and 48 h and 14 days) at two defined doses, that is, 300 and 2000 mg/kg. These doses were selected based on the Organisation for Economic Co-operation and Development (OECD) guideline for testing of chemicals. 19 In this study, the toxicological evaluation was performed in the context to understand the amount of variation exhibited in blood hemato-biochemical, histopathological, tissue distribution, and excretion profile. Additionally, we also studied the status of haptoglobin (an acute phase protein and a biomarker of hemolytic anemia) in terms of expression and quantification. The aim of the study was to conclude the toxicity of ZnO-NPs versus bulk particles and explore their immediate (24 and 48 h) and delayed (14 days) toxicological effect.
Materials and methods
Characterization of ZnO
Transmission electron microscopic analysis
The ZnO-NPs (<50 nm) and ZnO-bulk were purchased from M/s Sigma Aldrich (St. Louis, Missouri, USA) having purities of 97.0% and 99.0%, respectively. These particles were characterized after suspension (100 µg/mL) in milli-Q water through transmission electron microscope. To obtain a homogenous suspension, the suspension was sonicated using a probe sonicator (Sonics & Material Inc., Newtown, Connecticut, USA) for 15 min prior to use. The characterization of samples was done under FEI Tecnai G2 spirit twin transmission electron microscope (Hillsboro, Oregon, USA) equipped with Gatan digital CCD camera (the Netherland) at 80 kV and sample was prepared onto fomvar coated grid. The size was obtained by measuring fifty numbers of particles in random field of view.
Dynamic light scattering analysis
Zinc oxide particles nano and bulk, both were separately suspended in 0.5% carboxymethyl cellulose (CMC) at a final concentration of 100 µg/mL and subjected to probe sonication for 15 min at 30 watt, pulse 45 s on and 15 s pulse off cycles. The average hydrodynamic size and zeta potential of ZnO-NPs were analyzed using dynamic light scattering (DLS) technique in a Zetasizer Nano-ZS (model ZEN 3600; Malvern Instruments Ltd., Malvern, UK).
Animals and their housing
Female Wistar rats of 8–9 weeks age (230–260 g) used in this study were obtained from the animal facility division of our own institute after approved from Institutional Animal ethical committee (IAEC, approval no. CSIR/IITR/IAEC/42/2013). These animals were kept for acclimatization in experimental room for 5 days. They were fed with standard maintenance pellet diet (Altromin 1324, an International Maintenance diet for Rat/Mice, Germany) ad libitum with free access of aqua guard filtered water. These diet contained the nutritional additives (per kg ratio) as: 15 IU Vitamin A, 600 IU Vitamin D3, 100 mg iron, 1.14 mg iodine, 0.32 mg cobalt, 6.25 mg copper, 25.30 mg manganese, 25 mg Zn, and 0.11 mg selenium. These animals were housed in polycarbonate cage (sized 425 × 266 × 175 mm) and maintained in an environmental controlled condition at 20–24°C, 12-h light/12-h dark cycles and relative humidity of 60–70%.
Experimental design and dosing of animal
After competition of 5 days acclimatization, the rats were randomly divided into 5 groups (G1–G5) consisting of 15 rats in each group. The test items (ZnO-bulk and ZnO-NPs) were suspended in 0.5% CMC for dosing. In order to avoid the aggregation, these suspensions were properly ultrasonicated for 10 min and vortexed before every treatment of rats. Amount of suspension was administered at 2 mL/100 g body weight. Group 1 (G1) represented control animals treated with only 0.5% CMC suspension. Group 2 (G2) and group 4 (G4) animals were administered with 2000 mg/kg body weight where group 3 (G3) and group 5 (G5) were administered with 300 mg/kg body weight with ZnO-NPs and ZnO-bulk, respectively. All the animals were allowed for fasting for approximately 15 h before dosing. Dosing of animals was performed between 10.30 a.m and 11.00 a.m. During the time of dosing, the suspensions containing the test items were constantly stirred on magnetic stirrer. Five animals from each group were killed at 24 and 48 h of post dosing to know the immediate effect of test items and remaining five animals of each group were killed after 14 days for assessment of their delayed effect.
Cage-side observation, clinical examination, and record of body weight
Cage-side observations of animals were recorded for mortality, changes in gait, posture, and presence of any abnormal behavior. For detailed clinical examinations, the rats of all groups were observed for changes in skin, fur, eye, mucous membrane, occurrence of any abnormal secretion, and excretion. The body weights of animals were recorded before administration of test items (ZnO-NPs and ZnO-bulk) weekly there till completion of experiment. Food consumption for each group was also recorded.
Collection of samples (urine and blood)
For collection of urine and fecal materials animals were housed in a polycarbonate cage having a wire mesh at the bottom of the cage. Fecal materials were accumulated on wire mesh and urine was deposited at the bottom surface of cage. The fecal and urine samples were collected daily (24-h intervals) for their total quantity and further used for estimation of Zn content.
The blood and freshly voided urine samples were collected from each group at defined time point of necropsy for biochemical analysis. For sampling of blood, the animals were anesthetized with thiopentone sodium and then blood samples were collected via the cardiac puncture through syringe attached with 22 gauge needle in K2-EDTA-coated vacutainer for hematology and in plain vacutainer for biochemical analysis. Additionally, 250 µL (approximately) of blood samples were also collected through sinus orbital plexus from each animal of high-dose group at 0, 12, 24, 48, and 72 h time point for estimation of Zn content in plasma.
Necropsy–pathology
After collection of blood sample the rats were exsanguinated and subjected to complete necropsy. Any changes in the gross pathology were recorded.
Hematology and biochemical analysis
The hematological parameters, namely, red blood cell (RBC), white blood cell (WBC), hemoglobin (Hb), monocytes, lymphocytes, eosinophils, basophils, neutrophils, mean corpuscular volume (MCV), mean corpuscular hemoglobin (MCH), hematocrit (HCT), mean cell hemoglobin concentration (MCHC) and platlets were analyzed with the help of automated hematology analyzer (Sysmax-1800i, Japan). For biochemical analysis, the collected blood samples were allowed to clot for 1 h at room temperature and then centrifuged at 4000 r/min for 10 min in a refrigerated centrifuge (Sigma). The biochemical parameters , namely, glucose, creatinine, urea, aspartate amino transferase (AST), cholesterol, uric acid, triglycerides, total protein, albumin, globulin, iron, calcium, inorganic phosphitase, total bilirubin, lactate dehydrogenase (LDH), alkaline phosphatase (ALP), alanine amino transferase (ALT), sodium, potassium, and chloride were analyzed using fully automated Clinical chemistry analyzer (Rx Daytona, Randox, UK). Before analysis the automated analyzer was calibrated for the analytes with the help of calibrator and control sera.
Urine analysis
The total volume of collected urine at 24 and 48 h posttreatment was recorded for each group and then centrifuged at 3000 r/min for 10 min. The supernatant were used for estimation of glucose, creatinine, uric acid, urea, and total bilirubin through automated clinical chemistry analyzer (Rx Daytona). The creatinine clearance
20
Histopathology
The tissues (liver, kidney, spleen, stomach, and intestine) of control group and treated groups were processed for histopathological evaluation. The formalin preserved tissues were fixed in paraffin blocks, then sectioned into 4–5 µm in thickness and spread on glass slides. The prepared slides were stained with hematoxylin-eosin staining. The photographs were taken using optical microscope (Leica DM 500, Heerbrugg, Switzerland).
Zinc analysis by inductively coupled plasma-atomic emission spectroscopy
Samples of liver, kidney, and spleen tissues were collected during necropsy at defined time point for estimation of Zn content. One gram of each sample (liver, kidney, spleen, urine, and feces) and 0.2 g of plasma from high dose (NPs and bulk) and control group’s animals were taken for Zn analysis. These samples were digested with ultrapure nitric acid and perchloric acid in 10:1 ratio. The sample was predigested overnight and then heated at 190°C until the clear colourless solution was obtained. Sample volume was raised to 10 mL with ultrapure water for quantitative determination. Inductively coupled plasma-atomic emission spectroscopy (ICP-AES; Thermo Electronic Corporation, IRIS Intrepid II XDL; Waltham, Massachusetts, USA) was used for the analysis of Zn content in the samples. Quantification of the sample was done by five-point external calibration standard (0, 1, 3, 5, and 10 μg/mL) prepared using NIST standard stock (Acuu standard, New Haven, Connecticut, USA). The calculated Zn contents in the samples were reported.
RNA extraction and haptoglobin gene expression through reverse transcriptase polymerase chain reaction
The liver tissues were taken for RNA extraction. These tissues were ground in liquid nitrogen, using a pestle and mortar. The RNA was extracted using commercial kit (Quick-RNA MiniPrep, Zymoresearch, Irvine, California, USA). The oligonucleotides primers (F 5′-TGATCAAGCTCAAACAGAAAGTG-3′ and R 5′-CATAGCAAGTGTCTTCCTCATACTT-3′) for rat haptoglobin were selected from published article. 21 The reverse transcription reaction was carried out with 2 µg of RNA using AMV reverse transcriptase (MP Biomedicals, Santa Ana, California, USA) according to the manufacturer’s protocol for complementary DNA (cDNA) synthesis. The polymerase chain reaction (PCR) amplification was performed using 10 µL cDNA, 200 µM deoxyribonucleotide triphosphate, 2.5 U Taq DNA polymerase, and 1 µM of each primer. The reaction was performed in an Eppendroff thermal cycler consisting of 38 cycles (with initial denaturation at 95°C for 10 min and extension at 72°C for 15 min). Each cycle was programmed such as 94°C (45 s) for denaturation, 53.5°C (45 s) for annealing and 72°C (1 min) for extension. The amplified PCR product was run on 2.5% agarose gel and stained with ethidium bromide and gel was analyzed through gel documentation system (Syngene, Cambridge, UK).
Statistical analysis
The data were expressed as the mean with standard deviation. The statistical analysis of the experimental data of quantitative variables was subjected to two-way analysis of variance followed by the Bonferroni post hoc test (compare each group to the other entire group at each time point) using the graph pad prism 5, version 5.1 (San Deigo, California, USA). All the analyses and comparisons were evaluated at 5% (p < 0.05) level of significance. The pharmacokinetics parameters (area under curve, plasma concentration–time curve and % absorbance) of zinc in plasma were also estimated through graph pad prism 5.
Results
Characterization of ZnO
The size of the bulk and nano ZnO particle was measured through TEM and the sizes were obtained in a range of 94–199 nm and 13–68 nm in diameter for bulk and nano particles, respectively (as shown in Table 1). The morphology of ZnO-NPs was found to be mostly in hexagonal shape (some spherical and rod shaped) as presented in Figure 1(a) whereas bulk particles revealed the shape of spherical and elliptical (Figure 1(b)). The ZnO-NPs and ZnO-bulk particles in suspensions gathered into large aggregates forming irregular shapes, due to the aggregation of particles and a certain amount of uncertainty during the manufacturing process. In CMC suspension the mean hydrodynamic size of ZnO-NPs and ZnO-bulk was 449.8 nm & 1344.0 nm and poly diversity index was 0.21 and 0.27 with zeta potential of −31.6 and −55.8 mV, respectively (Figure 2(a) and (b)).
Characterization of Zinc oxide (nano and bulk) particles through Transmission electron microscope and dynamic light scattering.
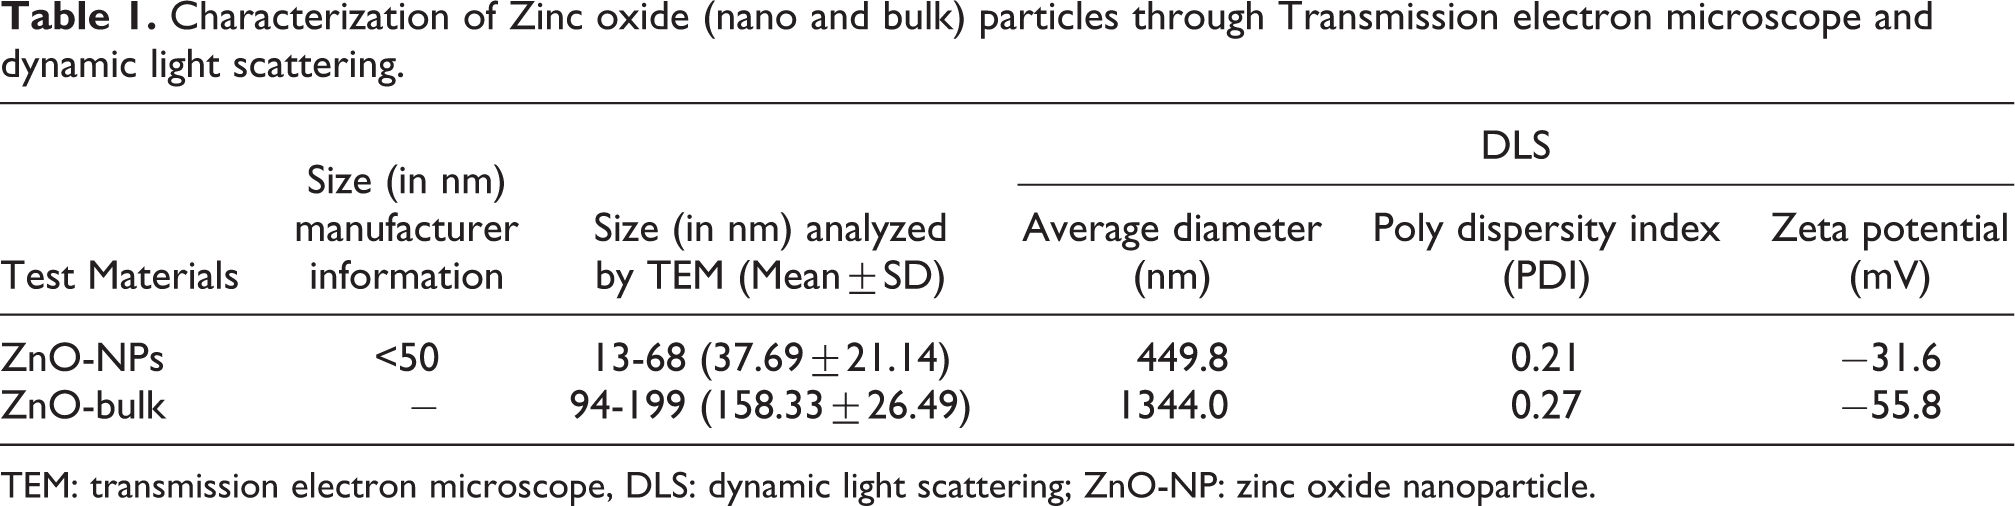
TEM: transmission electron microscope, DLS: dynamic light scattering; ZnO-NP: zinc oxide nanoparticle.

(a) Transmission electron microscope image of ZnO-NPs showing diameter in range of 13 to 68 nm. ZnO-NP: zinc oxide nanoparticle. (b) Transmission electron microscope image of bulk ZnO showing diameter in range of 94–199 nm. ZnO: zinc oxide.

(a) DLS showing mean hydrodynamic size, PDI and zeta potential of nano ZnO. DLS: dynamic light scattering; PDI: poly diversity index; ZnO: zinc oxide. (b) DLS showing mean hydrodynamic size, PDI and zeta potential of bulk ZnO. DLS: dynamic light scattering; PDI: poly diversity index; ZnO: zinc oxide
Animal observation, food consumption, and body weight
There were no adverse clinical signs of toxicity observed in any group of animals except high-dose (2000 mg/kg) group animals. The animals treated with high dose of ZnO-NPs and ZnO-bulk showed dullness and lethargy till 48 h of posttreatment, there after they recovered to their normal condition. The mean feed consumption was found to be reduced till day 7 in G2 group (2000 mg/kg NPs) as compared to all groups (Figure 3). The body weight and gain in percent body weight of different groups are presented in Figure 4. In high-dose group (G2) animals, the mean body weight was significantly decreased as compare to control group on day 7 whereas on day 15 showed reduced level as compared to control as well as their lower dose treated group. The % gain in body weight was increased by 1.23% at day 7 and 8.35% at day 15, which was also statistically lower as compared to control and other treated groups.

Mean Food consumption per group was measured before 2 days, day1, day 7, and day15. Data represented as mean ± SD; n = 5 animals per groups for each time point, a, b, c, and d denotes statistically significant differences (p < 0.05) compared to control, low dose nano, low dose bulk and high-dose bulk respectively.

Body weight growth pattern of rats treated with ZnO-NPs and ZnO-bulk, (a and b); showing body weight growth and % body weight growth respectively. Data were represented as mean ± SD; n = 5 animals per groups for each time point, a, b, c & d denotes statistically significant differences (p < 0.05) compared to control, low-dose nano, low-dose bulk and high-dose bulk respectively. ZnO-NP: zinc oxide nanoparticle.
Blood hematology and clinical chemistry
In this study, statistically significant reduced value were observed in the hematological parameters such as RBC, hemoglobin, HCT, and platelets at 48 h of posttreatment in group (G2) as compared to control and other treated group. High-dose bulk-treated group (G4) showed reduced level of platelets as compared to control group at 24 h posttreatment. At the end of 14 days posttreatment lower values for hemoglobin, HCT, and platelets were observed in high-dose treated group (nano) as compared to other groups but these values were statistically non-significant. The mean values of other hematological parameters (WBC, MCV, MCH, MCHC, neutrophil, eosinophils, basophils, lymphocytes, and monocytes) did not show any changes in any groups at the end of 14 days posttreatment (Table 2).
Blood hematological parameters of female Wistar rats at 24 and 48 h and 14 days post-treatment of ZnO (nano and bulk). a
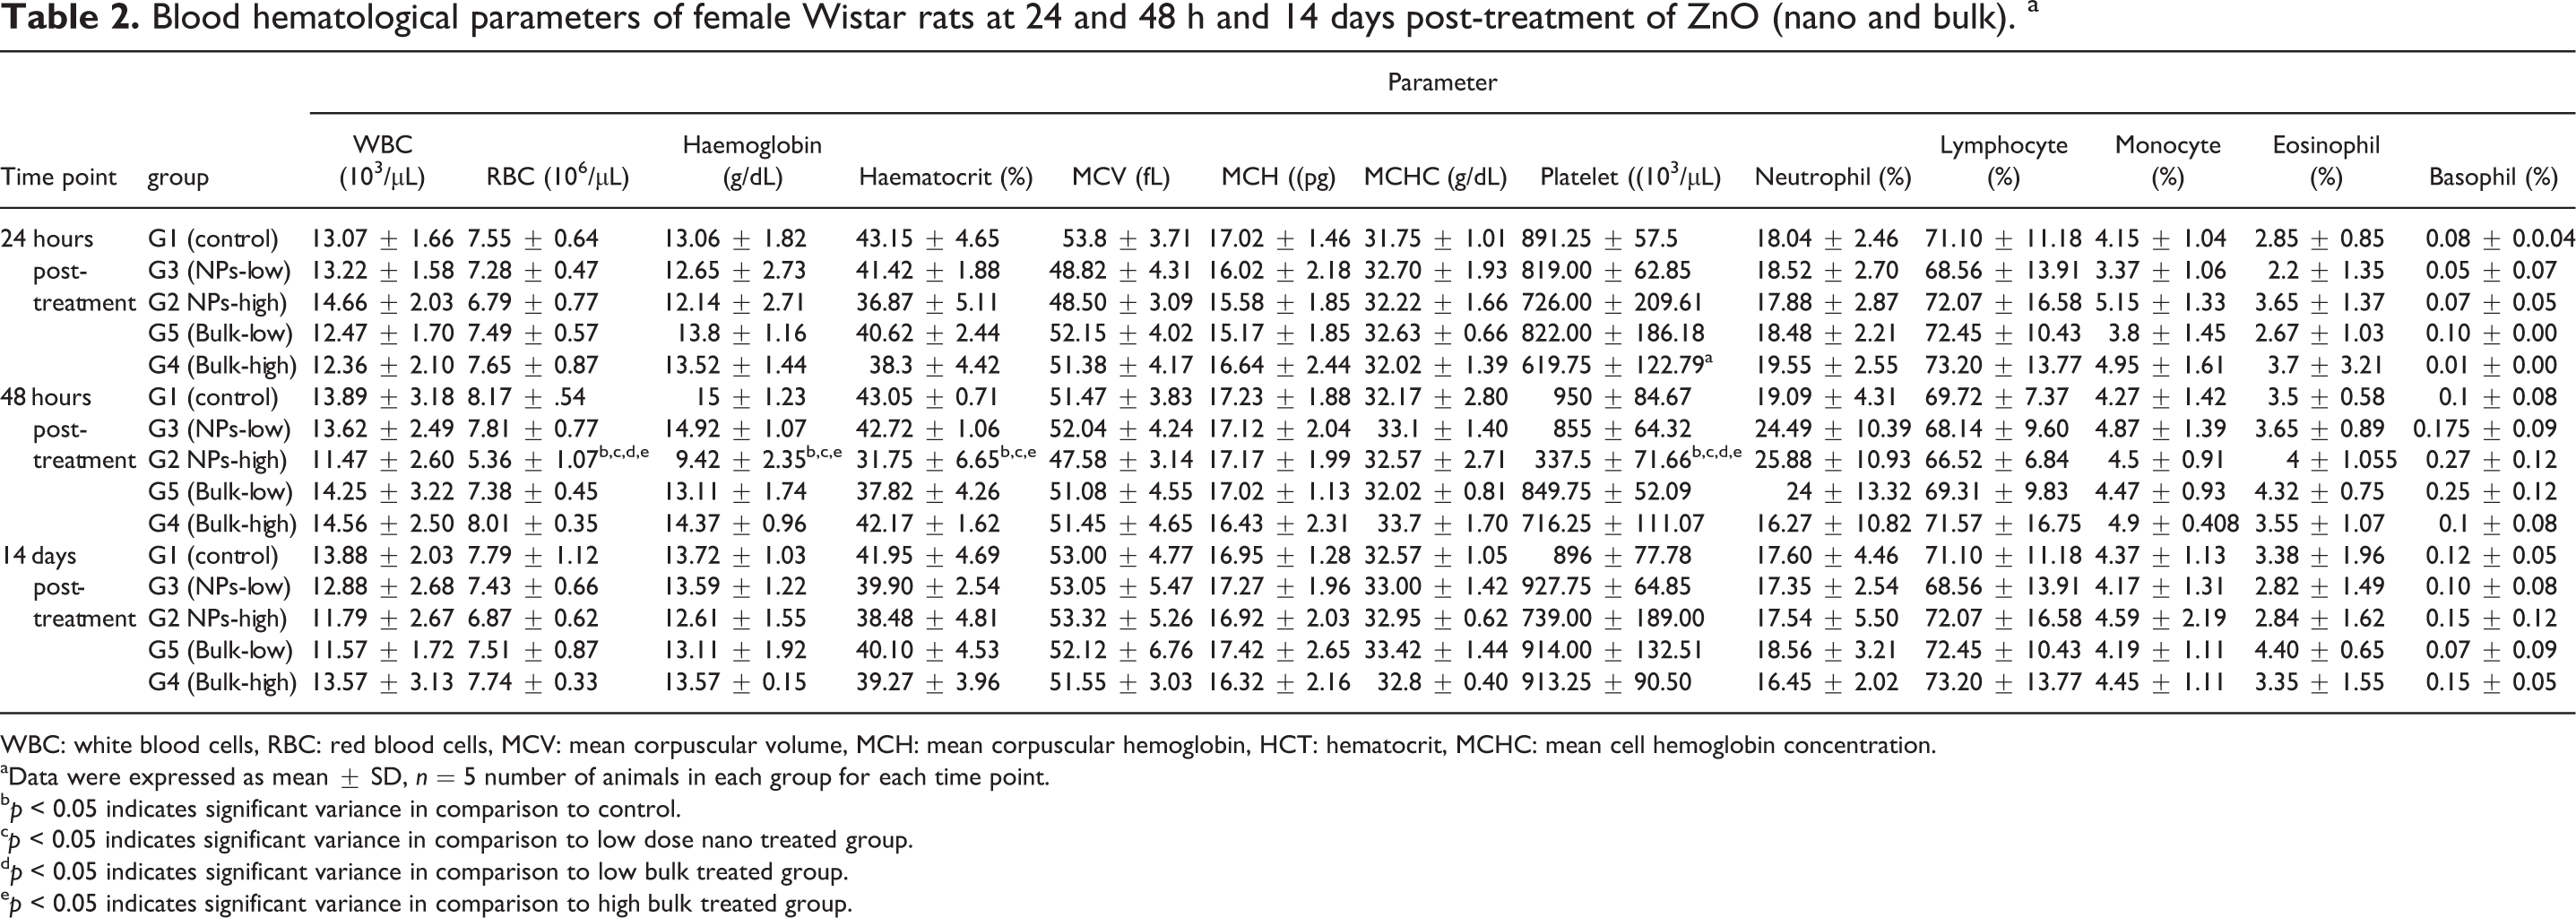
WBC: white blood cells, RBC: red blood cells, MCV: mean corpuscular volume, MCH: mean corpuscular hemoglobin, HCT: hematocrit, MCHC: mean cell hemoglobin concentration.
aData were expressed as mean ± SD, n = 5 number of animals in each group for each time point.
bp < 0.05 indicates significant variance in comparison to control.
cp < 0.05 indicates significant variance in comparison to low dose nano treated group.
dp < 0.05 indicates significant variance in comparison to low bulk treated group.
ep < 0.05 indicates significant variance in comparison to high bulk treated group.
Biochemical analysis of serum showed significantly increased (p < 0.05) ALT, LDH, and ALP parameters in nano high-dose treated group as compared to all other groups at 24 and 48 h time point but at the same time point only LDH and AST levels were increased in high-dose bulk group when compared to control and G5 group. Serum creatinine were significantly increased in high-dose nano group (G2) at 48 h and 14 days posttreatment as compared to all other groups but at 24 h increased only as compared to their low-dose group. The decreased level of iron in all the treated groups were recorded at 24 h posttreatment as compared to control group, however high-dose nano group (G2) constantly showed reduced value of iron at 48 h and day 15 as compared to other groups. Further on day 15 creatinine, ALT, and ALP showed increased level (p < 0.05) only in high-dose nano group (G2) as compared to other group, however, the AST value showed increased level in high dose along with their low-dose nano group (G2 and G3) as compared to control group (Tables 3 and 4).
Serum biochemistry of female Wistar rats at 24 and 48 h and 14 days posttreatment of ZnO (nano and bulk).
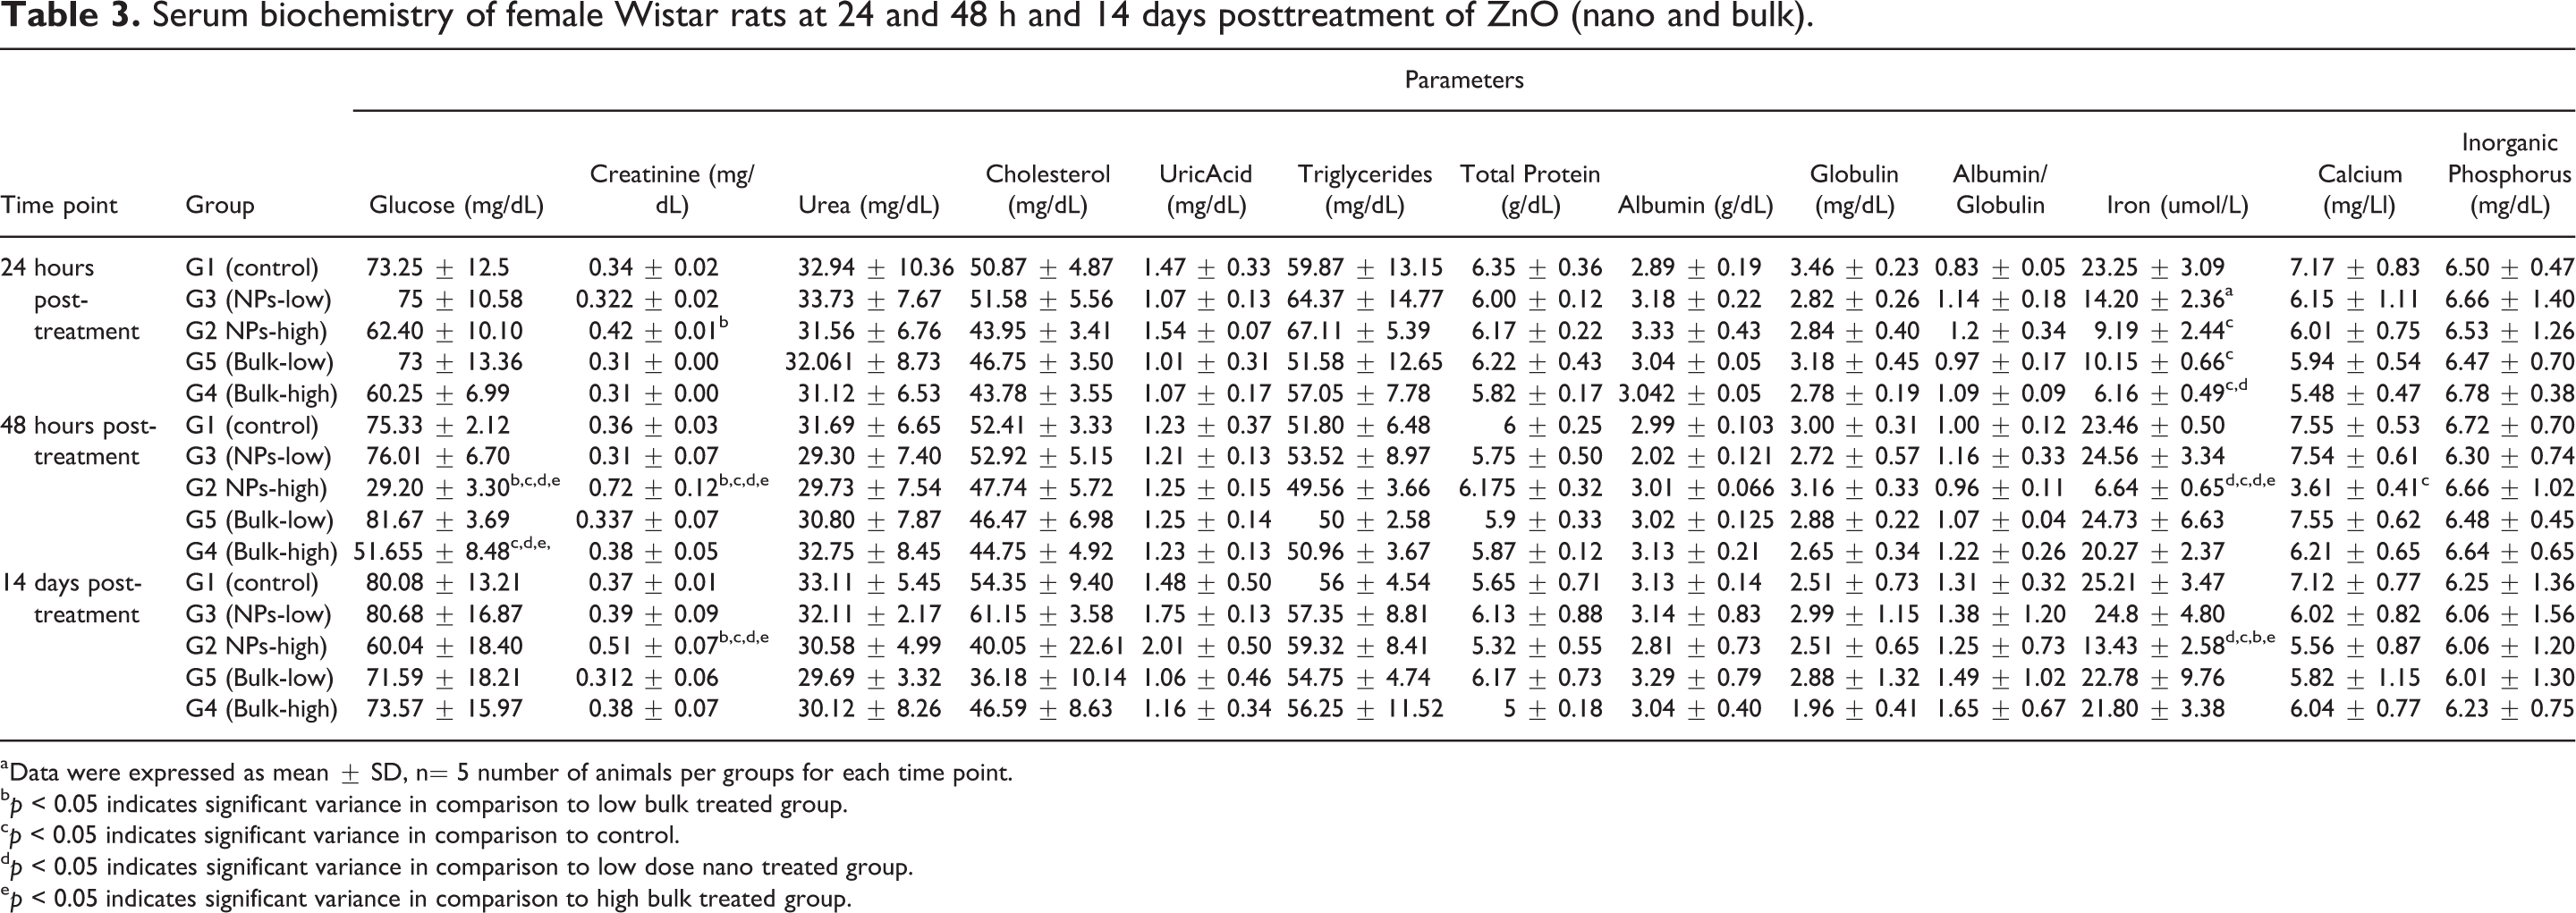
aData were expressed as mean ± SD, n= 5 number of animals per groups for each time point.
bp < 0.05 indicates significant variance in comparison to low bulk treated group.
cp < 0.05 indicates significant variance in comparison to control.
dp < 0.05 indicates significant variance in comparison to low dose nano treated group.
ep < 0.05 indicates significant variance in comparison to high bulk treated group.
Serum biochemical parameters of female Wistar rats at 24 and 48 h and 14 days posttreatment of ZnO (nano and bulk).a

AST: aspartate amino transferase, LDH: lactate dehydrogenase, ALP: alkaline phosphatase, ALT: alanine amino transferase.
aData were expressed as mean ± SD, n= 5 number of animals per groups for each time point.
bp < 0.05 indicates significant variance in comparison to control.
cp < 0.05 indicates significant variance in comparison to low dose nano treated group.
dp < 0.05 indicates significant variance in comparison to low bulk treated group.
ep < 0.05 indicates significant variance in comparison to high bulk treated group.
The level of bilirubin in urine was increased in high-dose nano group at 24 and 48 h posttreatment as compared to control (Figure 5). The creatinine clearance was found to be decreased (p < 0.05) at 24 and 48 h posttreatment in high-dose nano group (G2) as compared to control (G1) and low-dose bulk treated group (G5).

Urine biochemistry of female Wistar rats at 24 and 48 h posttreatment of ZnO (nano and bulk), (a to d) show urine biochemical parameters of glucose, creatinine, uric acid, and total bilirubin, whereas (e and f) show total urine volume and creatinine clearance at 24 and 48 h post-treatment. Data are represented as mean ± SD; n = 5 animals per groups for each time point, (a to d) denote statistically significant differences (p < 0.05) compared to control, low-dose nano, low-dose bulk and high-dose bulk respectively. ZnO: zinc oxide.
Haptoglobin protein in serum
Haptoglobin (an acute phase protein) level in high-dose nano group (G2) showed increased (p < 0.05) level at 24 h, decreased at 48 h, and again increased at days 15 as compared to all other group. The low-dose nano and high-dose bulk treated group also showed increased value at 24 and 48 h posttreatment (Figure 6).

Serum haptoglobin levels per groups were measured at 24 and 48 h and 14 days posttreatment. Data represented as mean ± SD; n = 5 animals per groups for each time point, (a to d) denote statistically significant differences (p < 0.05) compared to control, low-dose nano, low-dose bulk, and high-dose bulk, respectively.
Haptoglobin expression in tissue
The expression of haptoglobin in liver tissues was found to be more in high-dose nano treated group (G2) as compared to other groups (Figure 7).

Haptoglobin expression of liver tissue: lane 1–negative control; lane 2–control; lane 3 – low-dose bulk at day 15, lane 4 – low-dose bulk at 48 h, lane 5 – low-dose nano at day 15, lane 6 – high-dose bulk days 15, lane 7 – high-dose bulk at 48 h, lane 8 – low-dose nano at 48 h, lane 9 – high-dose nano at day 15, lane 10 – high-dose nano at day 48 h, lane 11 – high-dose nano at 24 h.
Necropsy finding
At necropsy, all tissues appeared normal at 24 h, some gross pathological lesions (petechial hemorrhage) were seen in liver and kidney of high-dose (2000 mg/kg, bulk and nano) treated animals at 48 h posttreatment. These lesions were observed in only three animals in nano group and one animal in bulk group. However, on day 15, no gross internal findings were observed at necropsy in any group.
Histopathological examination
The histopathological observation of liver, kidney, stomach, and small intestine containing Peyer’s patches tissues are shown in Figures 8, 9, 10, and 11, respectively. No pathological lesions were seen in any tissue except liver, stomach, and kidney. Hepatocyte degeneration (shown in intersect in liver tissue, Figure 8) observed in G2 groups at 48 h time point whereas at 24 h post-treatment cell atrophy was observed. Inflammation and necrosis appeared in kidney tissues at 24 h posttreatment in high-dose nano treated group, whereas at 48 h posttreatment the renal tubules also showed shrunken lumen in addition to this marked inflammation and hemolysis, but high-dose bulk group (48 h) showed slight sclerotic glomeruli (Figure 9). Slight inflammation (mucosa cells) observed in stomach tissue of G2 group (2000 mg/kg) at 48 h (Figure 10). At 14 days posttreatment no pathological lesions were observed in studied tissue.
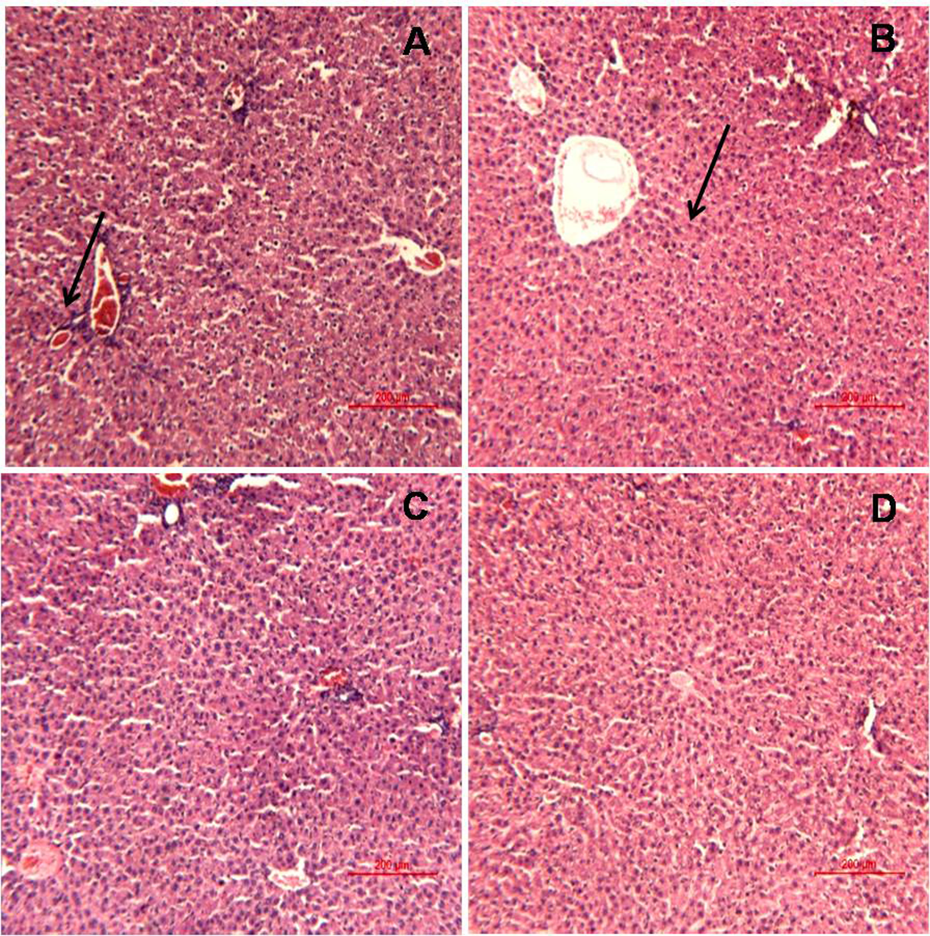
Histopathological observation in liver tissues of rats showing (a) cell atrophy (indicated by arrow) in G2 group (2000 mg/kg ZnO-NPs) at 24 h, (b) hepatocyte degeneration (shown in intersect) in G2 group (2000 mg/kg ZnO-NPs) at 48 h, (c) no change in G1 group (control), (d) no change in G4 group (2000 mg/kg ZnO-bulk) at 48 h. ZnO-NP: zinc oxide nanoparticle.

Histopathological observation in kidney tissue of rats showing (a) slight sclerotic glomeruli (indicated by arrow) in G4 group (2000 mg/kg ZnO-bulk) at 48 h, (b) shrunken lumen of renal tubules in addition to marked inflammation and hemolysis (shown by arrows) in G2 group (2000 mg/kg ZnO-NPs) at 48 hours, (c) inflammation in G2 group (2000 mg/kg ZnO-NPs) at 24 h, (d) no changes in control (G1) group. ZnO-NP: zinc oxide nanoparticle.

Histopathological observation in stomach tissue of rats showing, (a) normal structure in G4 group (2000 mg/kg ZnO-bulk) at 48 h, (b) slight inflammation of mucosa cells in G2 group (2000 mg/kg ZnO-NPs) at 48 h, (c and d) no changes in G2 group (24 h) & control group (G1). ZnO-NP: zinc oxide nanoparticle.

Histopathological observation of intestine tissue (containing Peyers patches) of rats showing, (a & b) normal structure in G2 group (2000 mg/kg ZnO-nano) at 24 and 48 h respectively, (c and d) no changes in G4 group(2000 gm/kg ZnO-bulk) & control group (G1) at 24 h. ZnO: zinc oxide.
Tissue distribution of ZnO-NPs and bulk
The distribution patterns of Zn in liver, spleen, and kidney of high-dose (2000 mg/kg) treated group (bulk and nano) were measured using ICP-AES at defined time points (i.e. 24 and 48 h and 14 days). The Zn concentration in the kidney, liver, and plasma showed a significant increase at 24 and 48 h in both groups (G2 and G4) as compared to control group, but there were no significant changes observed on day 15 (Figures 12 and 13). The Zn content in liver and plasma were more as compared to spleen and kidney. For measuring oral bioavailability, plasma concentration time curve were plotted (Figure 14) and area under curve (AUC), C max, T max, and % absorbance were measured for plasma as shown in Table 5. Absorption (%) was calculated based on AUC values in the total volume of plasma were divided by the total amount of Zn administered. 10 The distribution pattern of Zn in all groups was comparable to control on day 15.

Zinc concentration in plasma after single oral dose (2000 mg/kg) of ZnO-NPs and ZnO- bulk at 24 and 48 h and 14 days posttreatment. Data represented as mean ± SD; n = 5 animals per groups for each time point, a, b, c and d denotes statistically significant differences (p < 0.05) compared to control, low-dose nano, low-dose bulk and high-dose bulk, respectively. ZnO-NP: zinc oxide nanoparticle.
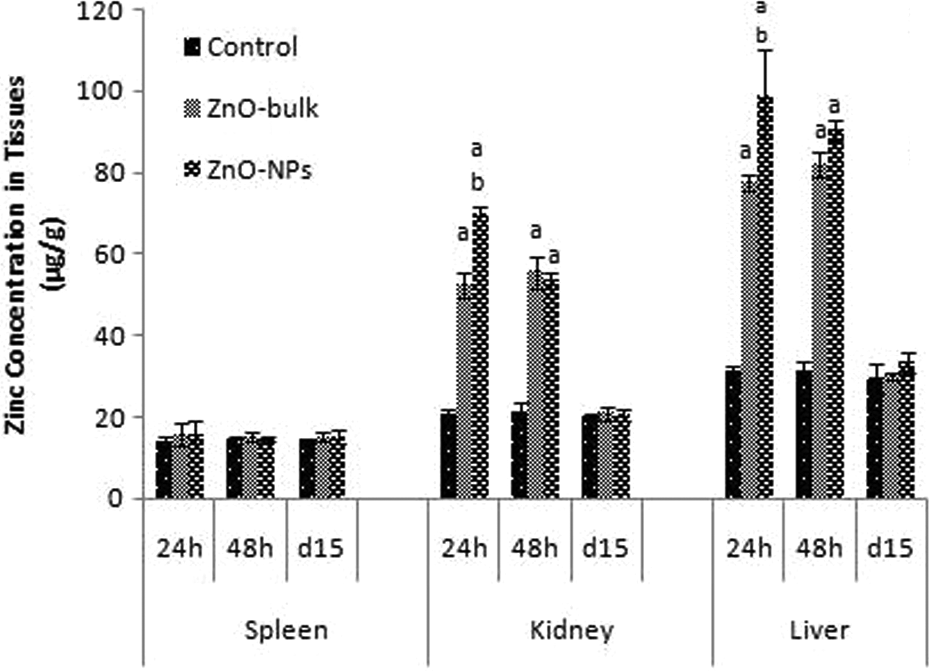
Zinc concentration in liver, kidney, and spleen after single oral dose (2000 mg/kg) of ZnO-NPs and ZnO-bulk at 24 h, 48 h and 14 days posttreatment. Data represented as mean ± SD; n = 5 animals per groups for each time point, a, b, c and d denote statistically significant differences (p < 0.05) compared to control, low-dose nano, low-dose bulk and high-dose bulk, respectively. ZnO-NP: zinc oxide nanoparticle.

Plasma concentrations of Zn after single oral administration of (2000 mg/kg) ZnO-NPs and ZnO-bulk in female Wistar rats (a and b) respectively. Data represented as mean ± SD; n = 5 animals per groups for each time point. ZnO-NP: zinc oxide nanoparticle.
Area Under curve and % absorbance in plasma dosed with (2000 mg/kg) of ZnO-NPs and ZnO-bulk.a

Cmax: maximum concentration in plasma, Tmax: time where maximum concentration of zinc (time of peak), AUC: area under curve, h: times in hour.
aData were expressed as mean ± SD, n = 5 number of animal per group.
bp < 0.05 indicates significant variance in comparison to ZnO-bulk.
cAbsorbance calculated based on AUC value.
Excretion profile
The Zn content in urine and feces of ZnO-NPs and bulk (at dose 2000 mg/kg body weight) animals were measured using ICP-AES (Figures 15 and 16). Large amount of Zn was detected in the feces as compared to urine. Statistically increased level of Zn was detected in the feces and urine at 24 and 48 h in treated group as compared to control but at day 15 its values were comparable to control. The Zn concentration in feces was found to be comparatively more in bulk-treated group (G4) than nano-treated group (G2). On the other hand Zn content in urine was found to be more in ZnO nano-treated group (G2) than bulk-treated group (G4).
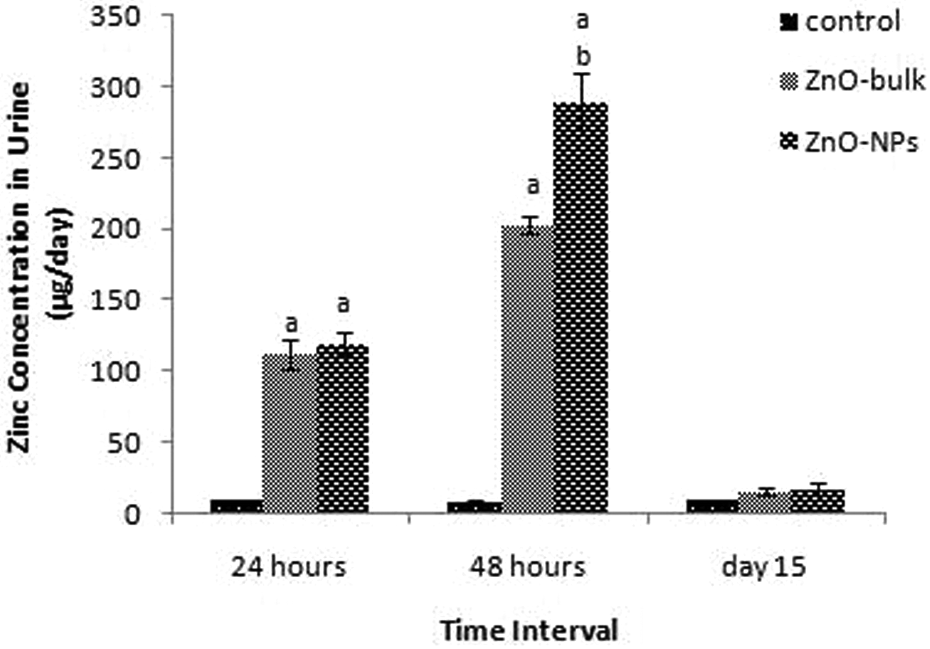
Zinc excretion through urine after single oral dose (2000 mg/kg) of ZnO-NPs and ZnO- bulk at 24 and 48 h and 14 days posttreatment. Data represented as mean ± SD; n = 5 animals per groups for each time point, a, b, c, and d denote statistically significant differences (p < 0.05) compared to control, low-dose nano, low-dose bulk and high-dose bulk, respectively. ZnO-NP: zinc oxide nanoparticle.

Zinc excretion through feces after single oral dose (2000 mg/kg) of ZnO-NPs and ZnO- bulk at 24 and 48 h and 14 days posttreatment. Data represented as mean ± SD; n = 5 animals per groups for each time point, a, b, c, and d denote statistically significant differences (p < 0.05) compared to control, low-dose nano, low-dose bulk and high-dose bulk respectively. ZnO-NP: zinc oxide nanoparticle.
Discussion
This study describes the acute oral toxicity of nano and bulk particles of ZnO in female Wistar rats at two dose level (300 and 2000 mg/kg). Apart from this, the characterization of bulk and nano particles was also studied because the particle size, dissolution property, aggregation of particles, stability, and concentration of particles in suspension are the key factor for hazard evaluation after exposure of NPs. 22 The absorption of NPs are estimated to be about 15–250 times higher than bulk particles. 23 In this study measured bioavailability (AUC and % absorbance) of Zn in plasma also indicated that absorption of the total amount of administered ZnO in blood was found to be higher in NP-treated group than their bulk. The barriers for entries consist of cellular (epithelium) and acellular parts (dead cells and mucus). The mucus of stomach and intestines is mainly produced by intraepithelial cells. The pore size in (cervical) mucus is approximately 100 nm, it is suggested that small particles might also be capable of diffusing through mucus. So due to their small size, toxicity of NPs was found to be maximum. In this study, the size of NPs was less than 50 nm as per manufacturer data sheet. But when we analyzed nano and bulk particles through TEM, the size was found to be 13–68 nm (37.69 ± 21.14) and 94–200 nm (158.33 ± 26.49) respectively. The mean value obtained from TEM analysis was almost correlated with the manufacturer statement. ZnO nano and bulk particles were also characterized by Zhu et al., through TEM and they reported in the range of 50–360 and 100–690 nm for nano and bulk, respectively. 24 These observed differences in size were mainly due to the aggregation of the particles and an amount of uncertainty during the manufacture and the experimental process (e.g., the shearing action of ultrasonication). 25,26 In the present study, hydrodynamic size was measured through DLS for identifying their aggregation. The results obtained through DLS indicated an increased size over TEM analysis. This was observed due to property of agglomeration in suspension. Metal oxide NPs also formed aggregate in natural water, which is likely driven by the divalent ion and low zeta potential. 27 As size decreases, the surface energy of the particles is expected to increase, which result in enhanced dissolution and solubility of NPs as compared to bulk. 28 The NPs are also less stable and form aggregates in suspension due to high surface area relative to mass, small size, and high surface energy. 29 Toxicity of ZnO-NPs is higher as compared to their bulk due to more dissolution of NPs as compared to bulk. 17 Role of solubility on nanotoxicity is arguable. It was reported that if release of metal ions from NPs was minimal, then such low concentration of copper and Zn ion did not cause any cytotoxic effect. 30 The dissolution and solubility of ZnO-NPs and copper oxide NPs is related to solution pH and temperature. 17 In oral treatment, the ZnO might be dissolved in stomach due to the acidic condition and as a result forming Zn ion, which might cause significant toxicity. Therefore the concern of this investigation was whether the ZnO-NPs or their bulk particles were producing more toxicological effect. At dose of 2000 mg/kg body weight nano particles of ZnO were capable of producing more toxic effect than at dose of 300 mg/kg body weight on 24 and 48 h posttreatment. Higher dose treated groups showed significant loss in feed consumption nearly at all time points with respect to control but at 48 h posttreatment as compared to all other group whereas at 300 mg/kg nano-treated group showed reduction as compared to control group only. All the animals survived till study termination period, no mortality was observed at the highest dose (2000 mg/kg) tested. Thus, the median lethal dose of ZnO particles (nano and bulk) was found to be greater than 2000 mg/kg body weight. Hence, bulk and nano ZnO was considered to be in Acute Toxic Category 5 in the Globally Harmonized System as per OECD guideline 420. Kumari et al., also reported the low feed intake in high-dose treated group (2000 mg/kg) of iron oxide group within 7 days posttreatment. 31 Wang et al. reported (22%) lower gain in body weight of mice treated with 5000 mg/kg Zn-NPs than the control after 3 days posttreatment. 14 Baek et al., also reported slightly decreased body weight of rats treated with (2000 mg/kg body weight) 70-nm sized ZnO. 10 An acute oral treatment of ZnO-NPs at dose of 5000 mg/kg body weight on mice was caused significant weight loss, with symptoms of nausea and diarrhea. 14 Our findings demonstrated that the animals treated with high-dose NPs were showed significantly loss in body weight gain as compared to other group. The gain in body weight (G2) was found to be 1.23% and 8.35% at day 7 and 15, which is significantly (p < 0.05) lower than other groups.
The toxicity effect of ZnO might be differed significantly according to the particle type. The toxicity mechanism of ZnO-NPs and ZnO-bulk was described by Yu P et al. 32 The toxicity caused by ZnO is mainly due to release to Zn+2 ions and through somewhat mechanical damage in zebrafish. 32 In vitro studies also showed that ZnO-NPs induced elevation of intracellular Zn2+ concentration, leading to the over generation of intracellular reactive oxygen species, leakage of plasma membrane, dysfunction of mitochondria, and cell death. 33 These statement demonstrated that the cell uptake, intracellular dissolution and thereafter release of Zn2+ are the intrinsic reasons for the high toxicity of ZnO-NPs. Orally administered ZnO-NPs are mostly dissolved in the stomach to form Zn2+ ions and are then taken up in the tissues by interaction between Zn and sulfur-containing ligands in proteins. 10 The membrane permeability of hepatocyte cells of liver might be affected due to the Zn+2 ions. Because the membrane protein are highly cation-binding protein having cystein-rich residue, which might be form Zn-S bond. If released, Zn2+ could rapidly bind to cell membranes as suggested by its high affinity for phospholipids, or it may interact with membrane-bound enzymes through reactions with sulfhydryl groups to form stable mercaptides. 34 So the forming of Zn-S bond of membrane protein might be disturbed the cell membrane permeability. This is reliable with previous evidence for Zn ions bonding to sulfur in the liver as determined by X-ray absorption spectroscopy analysis. 35 In the present study, the membrane permeability disturbance might be the reason for adverse change in hemato-biochemical parameters. The AST, ALT, and LDH parameters are potent biochemical assay for detection of liver tissue damage. 36 ALT, LDH, and ALP in serum significantly increased in nano high-dose treated group as compared to all other groups at 24 and 48 h posttreatment but in high-dose bulk at same time point only LDH and AST level were increased as compared to control and low-dose treated group. This enzyme is present in high concentrations in the cytoplasm of hepatocytes, elevated level of AST and ALT in serum can occur with altered hepatocellular membrane permeability. 37 Hepatocellular necrosis and hepatocyte proliferation, which is essentially an irreversible change causes of altered membrane permeability. 38 In the present study, the increase level of these enzymes in serum might be due to the injury in the hepatocyte cells at high dose of ZnO. The loss of membrane permeability might be due to the Zn ion of ZnO. Singh et al. reported that covalent binding of the drug to intracellular proteins cause a decrease in adenosine triphosphate levels leading to actin disruption and rupture of the membrane. 37 The hepatocyte degeneration and cell atrophy in histopathological finding also confirmed that liver injury might be caused due to the ZnO at higher dose. This revealed that ZnO-NPs might be inducing liver damage comparatively more than their bulk particles in acute oral study. LDH found at high levels in tissues that utilize glucose for energy 39 so an increase in LDH can be a sign of damage to a number of different tissues (skeletal or cardiac muscle, kidney, and liver). In our study, LDH level in serum were found to be increased at 2000 mg/kg dose level at 24 and 48 h, again confirmed that hepatocytes had been damaged. Wang et al., reported that increased level of ALT and LDH were found in the serum of mice treated with ZnO-NPs of size 20 nm at dose of 1 g/kg body weight but elevated level of ALP and LDH were noticed in mice treated with 120 nm size ZnO particles at dose of 3 g/kg body weight. 11 An increased level of AST, LDH, ALT, and ALP were also reported by Wang et al., as they studied the acute effect of Zn on mice treated with 5 g/kg body weight. 14
The serum creatinine and urea are the good indicators for renal function and their level increases in serum during kidney dysfunction. In the present study, serum creatinine were significantly increased in high-dose nano-treated group at 48 h and 14 days posttreatment as compared to all other groups. Creatinine and urea are freely filtered by the glomerulus and clearance from the plasma to the urine can be used to provide an approximation of the glomerular filtration rate. The rate of creatinine clearance shows the kidney’s ability to filter the blood. As renal function declines, creatinine clearance also goes down. 40 In the present study, creatinine clearance had been also declined in high-dose treated group as compared to control. Histopathological findings of kidney also showed slight sclerotic glomeruli, inflammation, and necrosis at 48 h posttreatment in high-dose nano-treated group whereas high-dose bulk treated group also revealed renal tubules inflammation and hemolysis. Thus the above findings confirmed that high dose of ZnO caused kidney tissue damage. Wang et al., also reported that creatinine level were increased in mice treated with ZnO-bulk sized at dose 5 g/kg body weight on 14 days post-treatment. 14 Llobet et al., also reported that the level of creatinine in plasma significantly rise after high-dose administration of zinc acetate dihydrate in drinking water. 16
Hematological parameters observed at 48 hours post-treatment in high dose of NPs (2000 mg/kg body weight) treated rats showed decreased level of R.B.C., hemoglobin, HCT and platelets as compared to all other groups, the high dose bulk treated group showed reduced level of platelets as compare to control group at 24 hours. Similarly in a study on mice, the hemoglobin & HCT values were reported to be decreased at a single dose of 5 g/kg Zn-NPs. 14 Activity of heme biosynthesis might be effected by the NPs would be the main reason of the decreased level of these hematological parameters. 41 The decreased level of RBC, HCT, platelets and hemoglobin in blood might be due to the hemolytic condition. In the present study LDH level in serum was also increased in highest dose at 48 hours time point. Erythrocytes have high levels of LDH therefore; even slight hemolysis can alter the serum activity considerably. 42 LDH might be diffused out of the RBC’s into the serum. So in the present study decreased level of R.B.C. and increased level of LDH indicated that hemolytic anemia might be possible at 2000 mg/kg body weight. This induced hemolytic condition was more clearly confirmed after haptoglobin analysis. The measurement of serum haptoglobin is used as one of the laboratory markers for the diagnosis of hemolytic anemia. 43 The haptoglobin protein, is an acute phase protein and their levels are increased at the time of inflammation or liver injury. 44 In the present research work more expression of haptoglobin in liver tissue was seen at 2000 mg/kg at all time point as compare to control. This result suggesting that the liver tissue might be injured due to the high dose level of NPs was the reason for expression of Hp gene in high amount in liver and these acute phase protein Hp might be secreted from the injured liver into the serum. But haptoglobin protein in serum were found to be increased at 24 hours rather decreased at 48 hours it might be due to the binding of these Hp with free hemoglobin which will have been released from degraded RBC. In hemolytic anemia, the RBC degrade and release free hemoglobin, the acute phase protein haptoglobin binds with these free hemoglobin in the form of Hp-Hb complex these Hp-Hb complex removed from the circulation by a specific receptor in the liver parenchymal cell membrane. 45 Gupta et al., also reported that the presence of free hemoglobin formed hemoglobin haptoglobin complex which is rapidly cleared from the serum through the monocyte-macrophage that causes low level of haptoglobin in serum. 43 According to the above findings, it was confirmed that ZnO-NPs at 2000 mg/kg body weight caused anemic condition in an acute oral study at 48 hours post-treatment but it was recovered at days 15. The decreased level of iron in all the treated groups were recorded at 24 hours post-treatment as compared to control group but at 48 hours and 14 days post-treatment in high dose nano group iron were also found to be decreased as compare to control and other treated group. High zinc oxide induced copper deficiency and copper are the trace element which use as a co-factor for enzymes multi-copper ferrooxidase (hephaestin and ceruluplasmin), decreased these enzyme activity leads to defects in mobilization of liver iron and recycling of iron from erythrocytes by Kupffer cells and showed low iron absorption. 46,47 So deficiency of copper might be the reason of dysfunction of ferrooxidase enzyme and that leads to decreased level of iron in serum. Wang et al., also reported that ZnO-NPs caused anemia in mice at 5 g/kg body weight dose. 11 It is known that toxicant usually act on numerous target organs and the identification of the target organ plays an important key role in establishing a mechanism underlying the toxicity of materials. 48 Beak et al., reported that the uptake of the NPs in vivo is performed mainly through macrophases in liver and spleen, because the process of phagocytosis occurs mainly in liver and spleen, and also an increased level of zinc in kidney indicates that renal pathway might play a role in the clearance of these zinc. 10 In present study the Zn concentration in the kidney, liver and plasma showed a significant increase at 24 and 48 hours in both high dose treated group. A few studies of NPs on animal model concluded that the main target organs of tissue distribution of NPs were kidney, liver and spleen. Lankveld et al., found that silver NPs intravenously injected with 20 nm size distributed primarily to the liver followed by the kidney and spleen whereas with 80 and 110 nm were mainly found in spleen followed by liver and lung. 49 Intra gastric administration of magnetic iron oxide NPs were primarily distributed in liver and spleen. 50 Fabian et al., also reported that intravenously injected TiO 2 NPs at day 1 after post-treatment mainly distributed in kidney, liver, spleen and lung. 51 We found that the absorbed concentration of zinc in liver, plasma and kidney were more in ZnO-NPs treated group as compare to their bulk treated group. Oberdorster et al., reported that NPs interrelate with biological systems through different mechanisms of action than their bulk chemicals. 52 NPs are absorbed more highly into the respiratory, skin and gastrointestinal systems than bulk sized particles because of their unique physicochemical properties, such as their size and surface modifications. 53 So as per finding of tissue distribution pattern it was confirmed that nano zinc oxide absorb, circulate and cause toxicity more as compare to bulk at same dose level. The excretion profile of ZnO-NPs showed that only a small amount of the NPs administered were excreted via the urine, and that the majority was excreted via feces. This result also confirms that a small amount of orally administered ZnO-NPs are absorbed into the body and most of them were not able to be absorbed and were cleared directly from the body through excretion. In a study researcher shown that Orally administered silver NPs are less absorbed in the gastrointestinal tract and are excreted directly via the feces, showing extremely low silver levels in the urine. 54,55 It seems that the dissolution property of both ZnO and silver NPs into ions contributes to the similar pattern of tissue distribution as well as the excretion pathway. 10 The Zn content in urine were found to be comparatively more in ZnO-NPs than bulk. whereas zinc content in feces were found more in bulk than nano, suggesting that small ZnO-NPs tend to be more cleared through kidney while bulk particles excreted through feces and gone in kidney very less amount.
Conclusion
Our result concluded that acute oral treatment of ZnO-NPs produced more toxicological effect as compared to their bulk particles as evidenced through retardation in food consumption, alteration in some hemato-biochemical parameters and few histopathological lesions in liver and kidney tissues.
Footnotes
Declaration of Conflicting Interests
The author(s) declared no potential conflicts of interest with respect to the research, authorship, and/or publication of this article.
Funding
The author(s) disclosed receipt of the following financial support for the research, authorship, and/or publication of this article: This research work was supported by a grant from (NanoSHE) project and communicated for publication through institutional manuscript number 3272.