
Abstract
The aim of this study was to investigate histological changes in hepatic tissue and effects of pentoxifylline (PTX) and caffeic acid phenethyl ester (CAPE) on these changes using histochemical and biochemical methods in rats, in which hepatitis was established by
Introduction
Acute hepatitis is a medical condition defined by the inflammation of the liver and characterized by the presence of inflammatory cells in the organ caused by several factors, such as viruses, bacterium, parasite, toxic substances, drugs, and various metabolic and autoimmune diseases.
1
Various experimental hepatitis models that have similar morphological and pathophysiological characteristics to viral hepatitis have been developed so far.
Pentoxifylline (PTX, nonselective phosphodiesterase inhibitor) is a methyl xanthine derivative that has been used for its regulatory effect on blood flow. PTX increases the flexibility of red and white blood cells, reduces blood viscosity by decreasing plasma fibrinogen concentrations, and decreases platelet aggregation and thrombus formation. Polymorphonuclear leukocyte-mediated effects, such as superoxide production, chemotaxis, phagocytosis, and TNF production, are inhibited by PTX. 8,9
Caffeic acid phenethyl ester (CAPE), an active component of honeybee propolis, is structurally similar to flavonoids. 10 CAPE is known to have antioxidant properties as well as antitoxic, anti-inflammatory, antiviral, immunomodulatory, neuroprotective, and cytostatic effects. 11,12
The aim of this study was to investigate the effects of PTX and CAPE on
Material and methods
Animals
Forty male Wistar albino rats (3–4 months old) weighing 200–250 g obtained from the Experimental Animal Research Center of Inonu University were used in the present study. The animals were housed in individual cages for 21 days in a well-ventilated room with a 12-h light/12-h dark cycle at 21°C. Animals were fed with standard rat chow and tap water ad libitum. The experiments were performed in accordance with the guidelines for animal research from National Institute of Health and were approved by the Committee on Animal Research at Inonu University, Malatya, Turkey.
Experimental induction of hepatotoxicity
Hepatotoxicity was induced in animals by an intraperitoneal (i.p.) injection of
Experimental protocol
The animals were randomly divided into five groups each consisting of eight rats.
Group I: Control
Group II (
Group III (
Group IV (
Group V (
At the end of the experiment, rats were killed by ketamine anesthesia. After blood samples were collected from tail vein, livers were removed and divided into two portions. One sample was used for histopathological examination, and the other was used for evaluation of oxidative stress parameters by biochemical methods.
Histopathological evaluation
Liver tissue was fixed in 10% formalin and was embedded in paraffin. Tissue sections were cut at 5μm, mounted on slides, stained with hematoxylin–eosin (H-E) for histopathological grading on the number of local areas of inflammation consisting inflammatory, necrotic, and apoptotic cells, periodic acid–Schiff (PAS) for demonstrating hepatic glycogen content, and toluidin blue for indicating mast cells. The number of mast cells was calculated and glycogen loss was scored as follows: 0 = Normal, 1 = Mild, 2 = Moderate, and 3 = Severe. The local area was counted in 10 microscopic fields under 20× objective magnification using Leica Q Win Image Analysis System (Leica Micros Imaging Solution Ltd. Cambridge, UK). Sections were examined using a Leica DFC280 light microscope.
Immunohistochemical methods
For immunohistochemical analyses, thick sections cut at 5 μm were mounted on polylysine-coated slides. After rehydrating, the samples were transferred to citrate buffer (pH 7.6) and heated in a microwave oven at 65°C for 20 min. After cooling for 20 min at room temperature, they were washed with phosphate-buffered saline (PBS). Then the sections were kept in 0.3% hydrogen peroxide (H2O2) for 7 min, followed by a wash with PBS. Subsequently, the sections were incubated with primary rabbit-polyclonal cysteine aspartate specific proteinase (caspase-3; Neomarker, Fremont, California, USA) and Ki-67 (Lab Vision, Fremont, California, USA) rinsed in PBS and then incubated with biotinylated goat antipolyvalent for 10 min and streptavidin peroxidase for 10 min at room temperature. The staining procedure was completed with chromogen + substrate for 15 min and the slides were counterstained with Mayer’s hematoxylin for 1 min. Caspase-3 and Ki-67 (+) cells were counted in the 10 microscopic areas under 40× objective magnification using Leica Q Win Image Analysis System (Leica Micros Imaging Solution Ltd). Sections were examined using a Leica DFC280 light microscope.
Biochemical evaluation
Determination of AST and ALT levels
Blood samples were centrifuged for 10 min at 3000 r/min (1500g centrifugal force) and plasma samples were stored at −20°C until the measurement. Cobas Integra 800 (Roche, Nutley, New Jersey, USA) was used for measuring aspartate aminotransferase (AST) and alanine aminotransferase (ALT) levels.
Preparation of tissue homogenates
Tissues were homogenized (PCV Kinematica Status Homogenizator, Switzerland) in ice-cold PBS (pH 7.4). The homogenate was sonicated with an ultrasonicator (Branson sonicator 450, Branson Ultrasonics Corporation, Danbury, CT, USA) by three cycles (20 s sonications and 40 s pause on ice) and centrifuged (15,000g, 10 min, 4°C), and cell-free supernatant was subjected to enzyme assay immediately.
Determination of protein
Protein levels of the tissue samples were measured by the Bradford method. 13 The absorbance measurement was taken at 595 nm using an ultraviolet–visible spectrophotometer. Bovine serum albumin was used as protein standard.
Determination of MPO levels
Tissue myeloperoxidase (MPO) activity was measured using a procedure similar to that documented by Hillegas et al. 14 One unit of enzyme activity was defined as the amount of MPO present that caused a change in absorbance measured at 460 nm for 3 min. MPO activity was expressed as units per gram tissue.
Determination of MDA levels
The analysis of lipid peroxidation was carried out as described by Buege and Aust 15 with a minor modification. The reaction mixture was prepared by adding 250 μL homogenate into 2 mL reaction solution (15% trichloroacetic acid:0.375% thiobarbituric acid:0.25 N hydrochloric acid, 1:1:1, w/v) and heated at 1000°C for 15 min. The mixture was cooled to room temperature, centrifuged (10,000g for 10 min), and absorbance of the supernatant was recorded at 532 nm. 1,1,3,3-Tetramethoxypropane was used as malondialdehyde (MDA) standard. MDA results were expressed as nanomoles per milligram protein in the homogenate.
Determination of GSH levels
The formation of 5-thio-2-nitrobenzoate was followed spectrophotometrically at 412 nm. 16 The amount of glutathione (GSH) in the extract was determined as nanomoles per milligram protein utilizing a commercial GSH as the standard.
Determination of GPx activities
Glutathione peroxidase (GPx) activity was measured according to Lawrence and Burk. 17 In brief, 1.0 mL of 50 nmol/L PBS solution (pH 7.4) including 5 mmol/L ethylenediaminetetraacetic acid, 2 µmol/L nicotinamide adenine dinucleotide phosphate (NADPH, 20 µmol/L GSH, 10 µmol/L sodium azide, and 23 mU of glutatione reductase was incubated at 37°C for 5 min. Then 20 µL of 0.25 mmol/L H2O2 solution and 10 µL of supernatant were added to the assay mixture. The change in absorbance at 340 nm was monitored for 1 min. A blank with all ingredients except for supernatants was also monitored. Specific activity was calculated as micromole NADPH consumed per minute per milligram of protein (i.e. U/mg protein) using an appropriate molar absorptivity coefficient (6220 M/cm). GPx levels were expressed as a micromole per milligram of protein (U/mg protein).
Determination of SOD activities
Superoxide dismutase (SOD; copper and zinc-SOD) activity was measured in the supernatant fraction using xanthine oxidase/cytochrome c method according to the method followed by McCord and Fridovich, 18 where one unit of activity is the amount of enzyme needed to cause half-maximal inhibition of cytochrome c reduction. The amount of SOD in the extract was determined as nanograms of enzyme per milligram protein utilizing a commercial SOD as standard.
Statistical analysis
Statistical analysis was carried out using the Statistical Package for Social Sciences for Windows version 13.0 (SPSS Inc., Chicago, Illinois, USA) and MedCalc (SBB Consulting 10, UK) statistical programs. All data are expressed as arithmetic mean ± standard error. Normality for continued variables in groups was determined by the Shapiro–Wilk test. The variables didn’t show normal distribution (p < 0.05). So, Kruskal–Wallis and Conover tests were used for comparison of variables among the studied groups. The value of p < 0.05 was regarded as significant.
Results
Histopathology
Control group showed normal histological appearance (Figure 1(a)). In

Control group. Histological appearance was normal (a)
The number of affected local areas in

Glycogen storage
Hepatic glycogen content was marked by the presence of a granular magenta staining called PAS-positive reaction (Figure 3(a)). The glycogen content of hepatocytes was decreased in the

(a) Control group. The PAS-positive reaction shows a magenta staining where glycogen is present within hepatocytes, (b)
Mast cells
The number of mast cells was significantly higher in the

(a) Control, (b)
The results of semiquantitative histological assessment.a

aResults are expressed as mean ± SD.
bSignificant increase (p = 0.0001), versus control.
cSignificant decrease (p = 0.0001), versus
dSignificant decrease (p = 0.0001), versus
Immunohistochemistry
Ki-67 immunoreactivity
Hepatocyte nuclei showing positive reaction by Ki-67 immunostaining method were stained brown (Figure 5(a)). Statistical significant increase in the number of Ki-67 (+) cells was detected in

(a) Control, (b)
Caspase-3 (+) immunoreactivity
In the control group, positive cells for caspase-3 have been not detected (Figure 6(a)). However, a statistical significant increase in the number of caspase (+) cells in

(a) Control, (b)
The results of immunohistochemical assessment.a
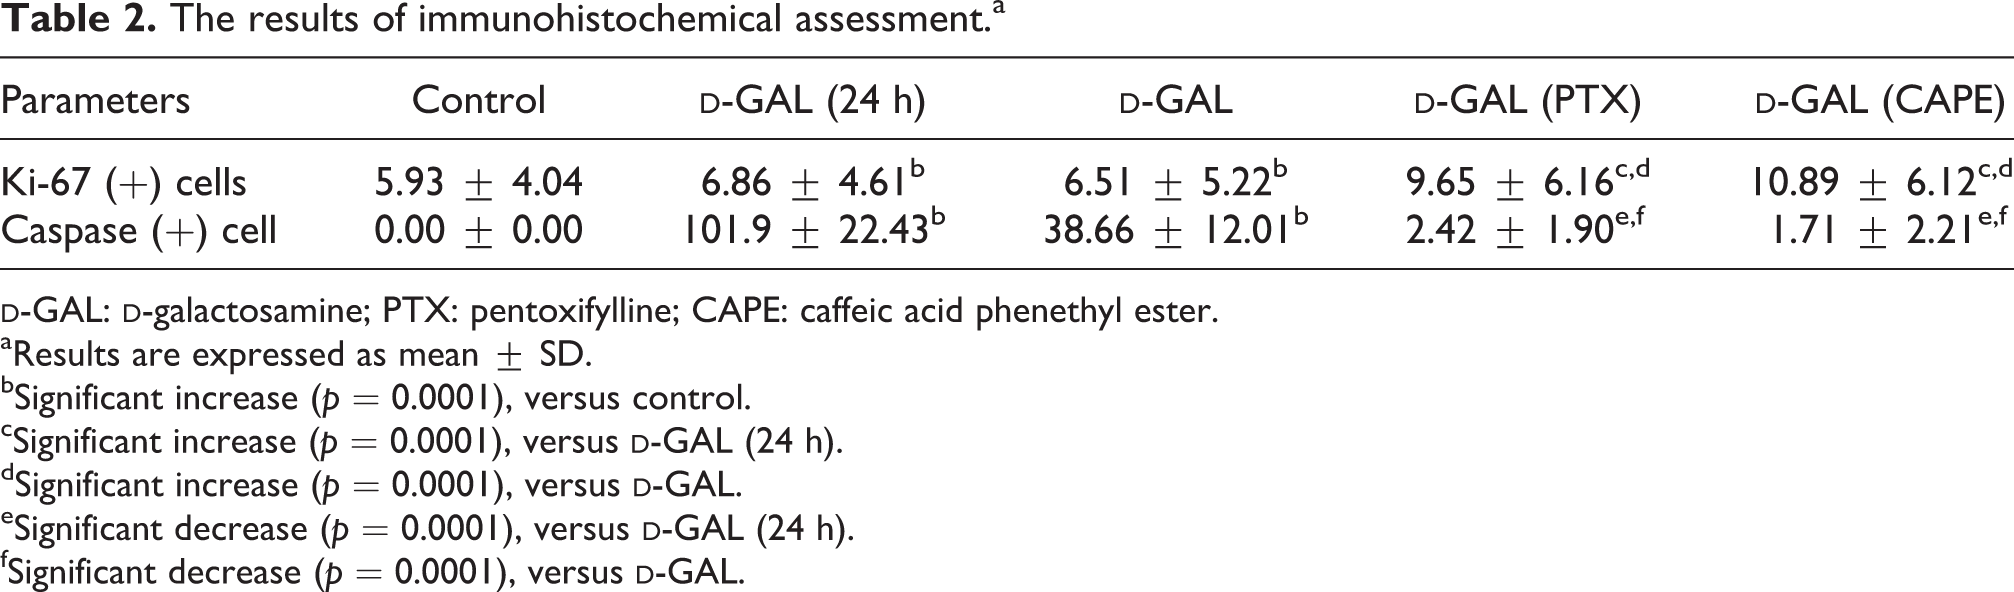
aResults are expressed as mean ± SD.
bSignificant increase (p = 0.0001), versus control.
cSignificant increase (p = 0.0001), versus
dSignificant increase (p = 0.0001), versus
eSignificant decrease (p = 0.0001), versus
fSignificant decrease (p = 0.0001), versus
Biochemical assessment
Mean AST and ALT levels were significantly increased in
The levels of liver function tests of all groups.a

AST: aspartate transaminase; ALT: alanine transaminase;
aResults are expressed as mean ± SD.
bSignificant increase (p = 0.0001), versus control.
cSignificant decrease (p = 0.0001), versus
dSignificant decrease (p = 0.0001), versus
Mean tissue MDA and MPO levels of
Mean tissue GSH level of
Mean tissue SOD activities of all the groups were similar, so no significant difference was detected. GPx activity of
The levels of biochemical parameters of all groups.a
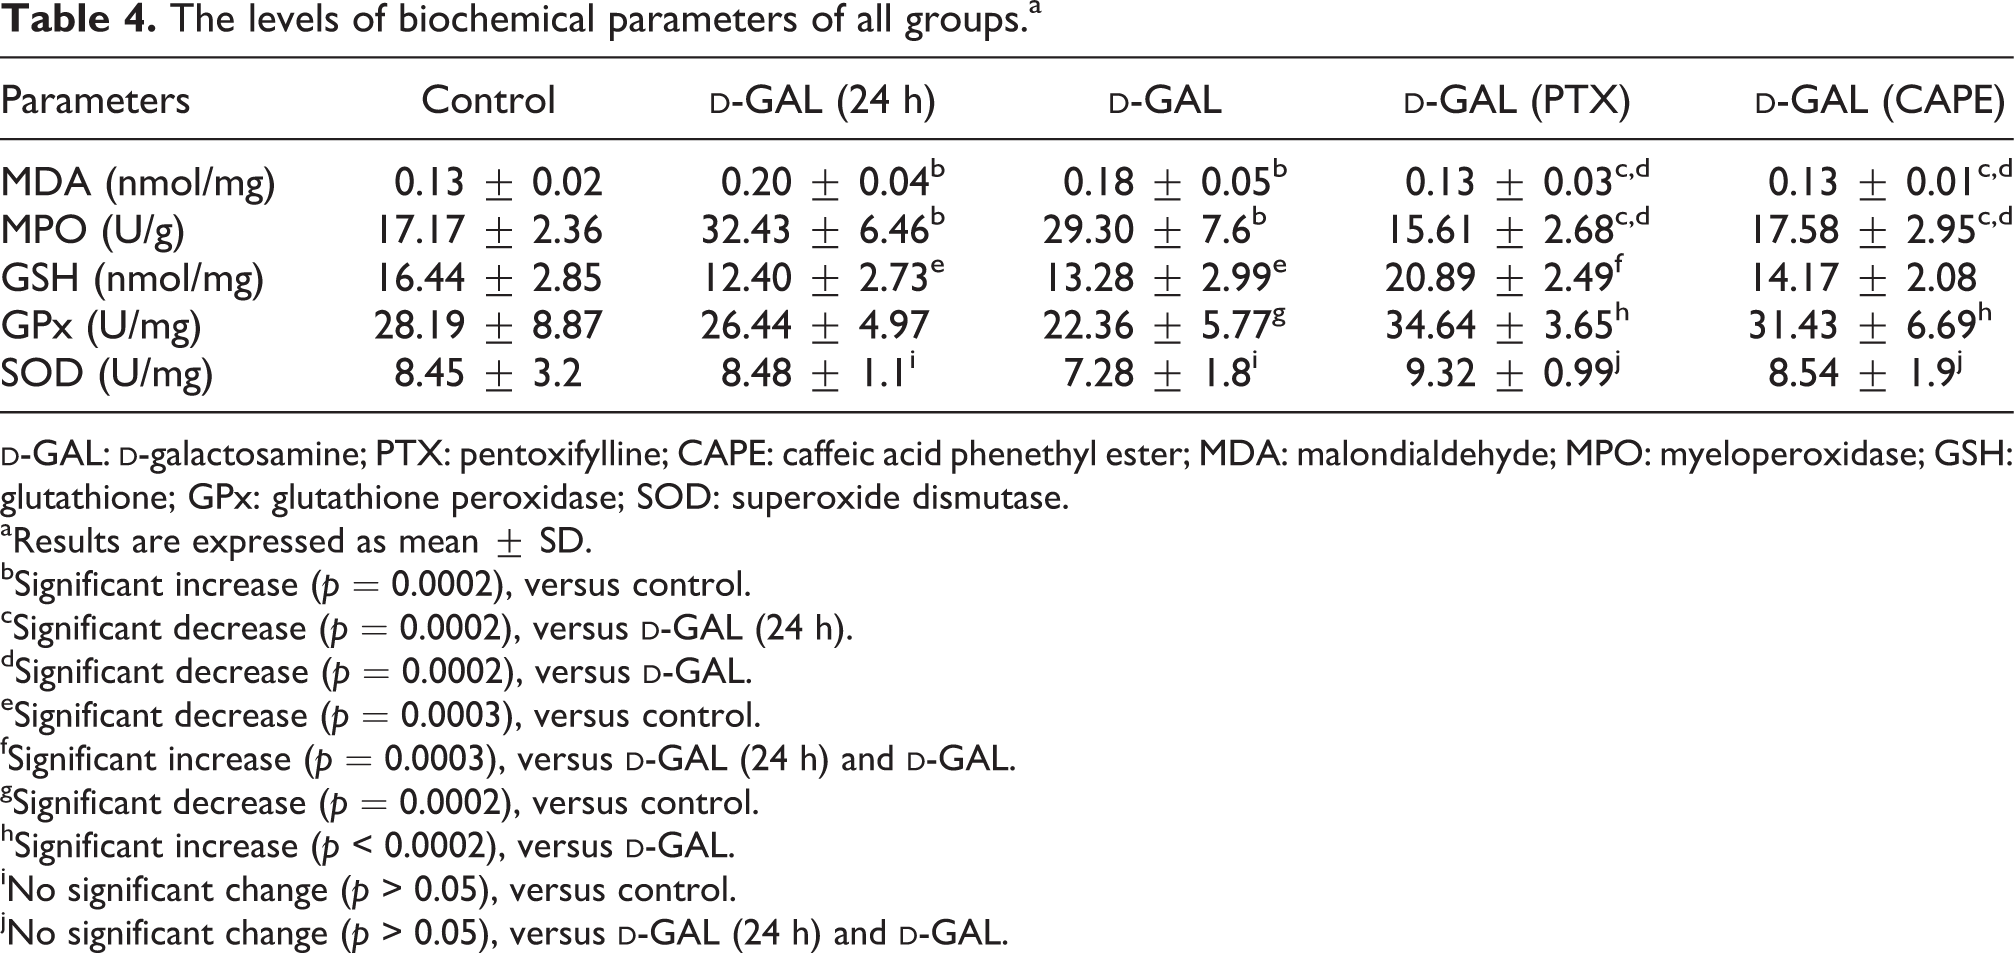
aResults are expressed as mean ± SD.
bSignificant increase (p = 0.0002), versus control.
cSignificant decrease (p = 0.0002), versus
dSignificant decrease (p = 0.0002), versus
eSignificant decrease (p = 0.0003), versus control.
fSignificant increase (p = 0.0003), versus
gSignificant decrease (p = 0.0002), versus control.
hSignificant increase (p < 0.0002), versus
iNo significant change (p > 0.05), versus control.
jNo significant change (p > 0.05), versus
Discussion
Development of hepatocellular injury following the administration of D-GAL in rats has been demonstrated by several authors.
21,22
In the present study, we also observed focal parenchymal areas consisting of inflammatory, necrotic, and apoptotic cells in the sections from
In vitro and in vivo studies show that
Ki-67 immunostaining method is used to determine the hepatocytes undergoing mitosis when Ki-67 antibody reacts with Ki-67 epitope located in the nucleus of cells in G1, S, G2, and M phases of mitotic cycle.
32,33
We observed in our study that only in the
AST and ALT are the most frequently used enzymes for determining liver damage and necrosis.
35,36
Although these enzymes normally exist in hepatocyte cytoplasm, they pass into the blood after cell injury.
37
Long-term application of high doses of
In order to investigate membrane damage and capacity of cellular antioxidant system, we evaluated lipid peroxidation status by analyzing tissue MDA levels and GSH (nonenzymatic) levels and GPx and (enzymatic) SOD activities. In addition, we investigated tissue MPO levels for assessing severity of inflammation. Increase in MDA levels has been reported as an indicator of lipid peroxidation in previous studies conducted with
SOD dismutates superoxide radical and provides its molecular conversion to H2O2 and molecular oxygen. 45 Taye et al. and Shi et al. revealed a decrease in SOD activity after administration of D-GAL in their studies. 43,46 However, we did not find any significant difference in terms of SOD activity between groups in our study.
GSH, a free radical scavenger, is one of the most important intracellular mechanisms as a substrate in GSH redox cycle to protect normal cells from oxidative damage.
47
It exists at a high concentration in the liver.
48
Shi et al. demonstrated significant reduction in hepatic GSH level in
We observed that histological and biochemical damage induced by
PTX supports tissues by accelerating blood flow and increasing tissue oxygenation.
43
Additionally, PTX ameliorates microvascular perfusion by protecting the integrity of the vascular system and preventing adhesion of leukocytes along the endothelium of postcapillary venules, which is thought to be the most important step of inflammation.
24
Moreover, PTX acts as a TNF-α inhibitor by inhibiting TNF-α release from macrophages. Thus it reduces production of chemotactic mediators including Interleukin 1 (IL-1) and IL-6.
49
Novick et al. reported that polymorphonuclear leukocytes activated by TNF-α became deactivated after exposure to PTX.
50
PTX was shown to have hepatoprotective effects in different models of hepatotoxicity.
51
A research on the therapeutic effects of PTX on carbon tetrachloride (CCl4)-induced liver damage revealed that vacuolization, necrosis, and apoptosis were significantly decreased in PTX-treated rats.
52
Usta et al. reported significant reduction in apoptosis on kidney damage induced by adriamycine following PTX administration.
53
We also detected caspase-3 cell decrease in PTX-treated group in comparison with
Different results of the effect of CAPE on apoptosis were obtained in several studies. CAPE was shown to induce apoptosis in human colon and prostate cancer cell cultures. 54,55 On the contrary, anti-apoptotic properties of CAPE have been shown in an experimentally induced apoptosis model in neuron cultures. 56 Cagli et al. reported that CAPE inhibited apoptosis in myocardial ischemia-reperfusion injury. 57 In our study, we observed that the number of caspase-3 (+) cells was significantly reduced in CAPE-treated group compared with D-GAL-treated groups.
Total number of inflammatory areas in
In the present study, both PTX and CAPE induced cell proliferation. We found that the number of KI-67 (+) cells in
In the present study, increases in MDA levels but decreases in GSH levels and GPx activities in D-GAL-treated groups indicate oxidative stress and resulting injury. These findings were diminished by administration of PTX and CAPE. One of the most important properties of PTX
63
and CAPE
64
is the protection of tissues from H2O2 and superoxide anion produced by neutrophils. Lipid peroxidation has been reported to be reduced by administration of PTX
65
and CAPE
66
on CCl4-induced liver damage. Studies have shown that antioxidant agents on hepatic lesions induced by
Superoxide and H2O2 radicals synthesized from neutrophils are the sources that increase the oxidative damage caused by
Our study demonstrated that PTX and CAPE have some healing effects on
Footnotes
Conflict of interest
The authors declared no potential conflicts of interest with respect to the research, authorship, and/or publication of this article.
Funding
The author(s) disclosed receipt of the following financial support for the research, authorship, and/or publication of this article: This study was financially supported by a grant from Scientific Research Fund of Inonu University (grant number: 2011/55).