
Abstract
Ethanol (EtOH) exposure during embryonic development causes dysfunction of the central nervous system (CNS). Here, we examined the effects of chronic EtOH on gene expression during early stages of neuronal differentiation. Human embryonic carcinoma (NCCIT) cells were differentiated into neuronal precursors/lineages in the presence or absence of EtOH and folic acid. Gene expression profiling and pathway analysis demonstrated that EtOH deregulates many genes and pathways that are involved in early brain development. EtOH exposure downregulated several important genes, such as PCDHB14, GABRB1, CTNND2, NAV3, RALDH1, and OPN5, which are involved in CNS development, synapse assembly, synaptic transmission, and neurotransmitter receptor activity. GeneGo pathway analysis revealed that the deregulated genes mapped to disease pathways that were relevant to fetal alcohol spectrum disorders (FASD, such as neurotic disorders, epilepsy, and alcohol-related disorders). In conclusion, these findings suggest that the impairment of the neurological system or suboptimal synapse formation resulting from EtOH exposure could underlie the neurodevelopmental disorders in individuals with FASD.
Introduction
Heavily drinking during pregnancy may cause various developmental disorders, collectively called fetal alcohol spectrum disorders (FASD). 1 Fetal alcohol syndrome (FAS) is a severe form of FASD in which the affected child is diagnosed with growth retardation, abnormal central nervous system (CNS) development, abnormal facial features, and organ dysmorphology. 2 Ethanol (EtOH) exposure at any point during a pregnancy can present a risk of fetal brain damage. Differences in the dose and timing are known to contribute to variations in the phenotypic spectrum of FASD. 3 The prevention and treatment of FASD require a thorough understanding of its pathophysiology; however, the mechanisms underlying the developmental neurotoxicity of EtOH remain unclear. Thus, understanding the pattern of gene alterations during different stages of development could provide valuable insights into these mechanisms.
Various mechanisms have been proposed to explain the deleterious effects of alcohol on the developing brain, such as alterations in neuronal proliferation and migration, disruptions in axonal and dendritic connectivity, increases in astrocytic and oligodendrocytic differentiation, and reduction in the number of cortical neurons. 4 –6 Moreover, disruptions of the complex molecular cascades that regulate embryonic morphogenesis are likely responsible for the neuroteratogenic effects of alcohol. Retinoic acid (RA) is known to be essential for the normal development of the CNS, eyes, limbs, and heart. The systems involved in FASD are similar to those observed in hypovitaminosis A, supporting the hypothesis that the features observed in FASD are due to decreased RA signaling. 7,8 EtOH is thought to act by inhibiting the enzymes that catalyze the synthesis of retinaldehyde and RA, and continued embryonic development with abnormally low RA levels results in complex developmental phenotypes that are reminiscent of FAS. 7,9,10 The effect of EtOH on RA-mediated neural differentiation is of particular interest in this study.
Additionally, the maternal folate requirement increases during pregnancy due to the proliferation of cells in the placenta and fetus. The addition of folic acid (FA) to the diet before and during pregnancy is associated with decreased rates of neural tube defects. 11 The early development of the fetus is highly dynamic throughout the gestation period, and alteration of this process may cause birth defects, as reported by Zhou et al. 12 in mice. In this study, we investigated the effects of alcohol exposure on genome-wide gene expression. We also examined the combined effect of EtOH and FA during the early neuronal differentiation of embryonic carcinoma (EC) cells, NCCIT cells. By employing a transcriptomic approach, we identified a set of genes that function in CNS development as well as neurological processes. Gene clustering and pathway analysis revealed that most of these genes are related to CNS development, neural lineage induction, neurological system processes, synaptogenesis, and synaptic transmission.
Materials and methods
Cell culture and EtOH treatment
Human EC cells (NCCIT) were obtained from the American Type Culture Collection (CRL-2073) and grown in Roswell Park Memorial Institute 1640 media supplemented with 10% fetal bovine serum, 100 IU/mL penicillin, and 10 µg/mL streptomycin. The cells were induced to differentiate with 10 µM RA in the presence or absence of EtOH and FA for up to 3 weeks as follows. First, to induce embryoid body (EB) formation, 1 × 10 6 NCCIT cells were plated in 90-mm bacterial culture dishes under non-adherent culture conditions for 1 week. Next, the EBs were transferred to normal culture petri dishes and treated with RA for 2 weeks in the presence or absence of EtOH (50 mM) and FA (0.5 mM). To prevent EtOH evaporation from the culture dishes, the EtOH-treated cells were cultured in a separate carbon dioxide incubator that was saturated with 50 mM EtOH, as previously described by our group. 13 An EtOH concentration of 50 mM (230.414 mg/dL) was selected based on the range previously described by Ogawa et al. 14 An FA concentration of 0.5 mM (9 mg/L) was selected from the range reported previously by Zhang et al. 15
Immunocytochemistry analysis
Immunocytochemistry was performed as previously described by our group. 13 Briefly, differentiated cells were incubated overnight at 4°C with primary antibodies against NESTIN (mouse; Chemicon, Temecula, California, USA), TUBB3 (mouse; Chemicon), and glial fibrillary acidic protein (GFAP; rabbit; Santa Cruz Biotechnology, Dallas, Texas, USA). The cells were incubated with fluorescein isothiocyanate-conjugated secondary antibodies (anti-rabbit; Santa Cruz Biotechnology) for 2 h at room temperature in the dark. Stained cells were mounted on slides in a solution containing 4′-6-diamidino-2-phenylindole (VECTASHIELD, Vector Laboratories Inc., Burlingame, California, USA) and observed using a phase-contrast microscope.
Microarray and gene expression analysis
Total RNA was isolated using the TRIzol® reagent (Invitrogen, Carlsbad, California, USA) according to the manufacturer’s instructions. Microarray analysis was performed for different samples using an Affymetrix GeneChip® Human Gene 1.0 ST Array (Santa Clara, California, USA). The sample preparation, labeling, and hybridization were performed according to the manufacturer’s instructions and recommendations. Image acquisition was performed with an Affymetrix GeneChip Scanner 3000 7G. The image data were analyzed with GeneChip Operating Software using the Affymetrix default analysis settings.
Real-time quantitative reverse-transcriptase polymerase chain reaction (qRT-PCR) was used to confirm the differentially expressed genes identified by microarray and pathway analysis. To measure gene expression, messenger RNA was reverse transcribed into complementary DNA using PrimeScript™ Reverse Transcriptase (Takara Bio Inc., Otsu, Japan). The real-time SYBR green method was used for gene expression analysis. The primer sequences are listed in Table 1.
List of qRT-PCR primers and their sequences used in this experiment.

qRT-PCR: quantitative reverse-transcriptase polymerase chain reaction.
Correlation clustering and pathway analysis of differentially expressed genes
Functional annotations for the significantly up- or downregulated genes identified by the microarray analysis were searched using the Web-accessible Database for Annotation, Visualization and Integrated Discovery (DAVID) program (http://david.abcc.ncifcrf.gov). Hierarchical clustering of differentially expressed genes (1.5-fold change) was conducted using R-GPlot Version 2.10.1. Integrated pathway enrichment analysis was performed as previously described 16 using MetaCore™ pathway analysis software (GeneGo). In brief, the probes-set identification numbers (IDs) of differentially expressed genes were uploaded into the database. For enrichment analysis, the gene IDs of the uploaded files were matched with the functional ontologies in MetaCore, which included canonical pathway maps (GeneGo maps), GeneGo cellular processes, and disease categories.
Statistical analysis
In this study, three replicates were run for each assay. The results are presented as the mean ± SEM (n = 3). All data were assessed via the Statistical Package for Social Sciences (SPSS) Version 18.0 program (SPSS Inc., Chicago, Illinois, USA; http://www.spss.com). Chi-square tests were conducted to observe the association between two samples, and a p-value lower than 0.05 was accepted as statistically significant in all analyses.
Results
Characterization of NCCIT cell differentiation
NCCIT cells are developmentally pluripotent stem cells with the ability to differentiate into neural cells, and this cell system has been shown to be a useful tool for studying the early steps of neural differentiation in vitro. 17 In our study, NCCIT cells were stimulated with RA, and the differentiation potential of the NCCIT cells was analyzed by qRT-PCR and immunocytochemistry. The stimulation of NCCIT cells with 10 µM RA strongly downregulated OCT4 (90-fold) and NANOG (54-fold) expression and activated the transcription of NESTIN (181-fold), an early marker of neuronal differentiation (Figure 1(a) and Figure S1). Among cells that had been induced and plated, a majority expressed the early neuronal marker NESTIN, whereas relatively few cells expressed the neuronal marker TUBB3 or the astrocyte marker GFAP (Figure 1(a) and (b)). Together, these results indicate that after NCCIT cells were subsequently differentiated into neuronal precursor/progenitor cells after 3 weeks.

NCCIT cells were stimulated with RA, and the differentiation potential of these cells was analyzed by (a) qRT-PCR and (b) immunocytochemistry. Among the cells that had been induced and plated, a majority expressed the early neuronal marker NESTIN, while relatively few cells expressed the neuronal marker TUBB3 or the astrocyte marker GFAP. Values represent the mean ± SEM (n = 3). *Significantly different from Cont sample (p < 0.05). RA: retinoic acid; qRT-PCR: quantitative reverse-transcriptase polymerase chain reaction; Cont: non-treated differentiated cells; GFAP: glial fibrillary acidic protein.
The effects of chronic EtOH exposure on differentially expressed genes
We employed the Affymetrix GeneChip Human Gene 1.0 ST array to explore the effects of EtOH exposure on global gene expression during early neuronal differentiation. Microarray analysis revealed that, of the genes that were differentially expressed in the EtOH-treated cells, 109 were downregulated and 123 were upregulated at the 1.5-fold change cutoff value. The top 50 down- and upregulated genes in the EtOH-treated cells (non-treated differentiated cells (Cont) vs. EtOH) are presented in Tables S1 and S2, respectively. The majority of these downregulated genes are involved in cell–cell adhesion, extracellular structure organization, synaptogenesis, synaptic transmission, synapse organization, and nerve impulse transmission. The upregulated genes are involved in cell–cell signaling, regulation of cell death, synaptic transmission, nerve impulse transmission, and behavior. The downregulated genes included those encoding important regulators of early neuronal differentiation, such as protocadherin-β genes (PCDHB10, PCDHB12, PCDHB14, and PCDHB16); dachshund family transcription factor 1 (DACH1); sema domain, immunoglobulin domain (Ig), short basic domain, secreted, (semaphorin) 3E (SEMA3E); cortexin 3 (CTXN3); γ-aminobutyric acid A receptor; β-1 (GABRB1); neuron navigator 3 (NAV3); catenin (cadherin-associated protein); δ-2 (CTNND2); orthodenticle homeobox 2 (OTX2); glutamate decarboxylase 2 (GAD2); achaete-scute family bHLH transcription factor 1 (MASH1); and opsin 5 (OPN5). EtOH also affected the expressions of neurotransmitter receptors and neuron projection-related genes on neuronal differentiation. In addition, of the genes that were differentially expressed upon combined treatment with EtOH and FA (Cont vs. EtOH + FA), 206 genes were downregulated and 85 were upregulated at the 1.5-fold change cutoff value. The top 50 down- and upregulated genes in the combined treatment group are presented in Tables S3 and S4, respectively. In addition, we presented the differentially expressed genes of Cont versus EtOH and Cont versus EtOH + FA using Venn diagrams according to the probes for the differentially expressed genes (Figure 2(a)). In Cont versus EtOH treatment, 232 genes were deregulated, of which 123 were upregulated and 109 downregulated. In Cont versus EtOH + FA-treated cells, a total of 291 genes were altered due to the combined effect of EtOH and FA. Among the 85 upregulated genes, 33 were common in both the EtOH treatment and the combined treatment of EtOH and FA. Among the downregulated genes (206 genes) in the combined treatment, 52 genes were decreased in the EtOH-treated cells. We observed the gene expression profile that FA treatment did not ameliorate the effect of EtOH. Our validation results (Figure 5(a) and (b)) also support this notion. Together, these results suggest that chronic EtOH treatment altered the expression of several neural-specific genes and that the addition of FA did not compensate for these changes during early neuronal differentiation of NCCIT cells.

Analysis of the genes that were differentially expressed in different samples. (a) Venn diagram representing the number of genes deregulated during different treatments. (b) Hierarchical cluster analysis of the differentially expressed genes. FA: folic acid; Cont: non-treated differentiated cells; EtOH: ethanol-treated cells; EtOH + FA: combination treatment with ethanol and folic acid.
Correlation clustering and pathway analysis of differentially expressed genes
Hierarchical clustering analysis showed that the genes expressed in the EtOH-treated samples were significantly different from the genes expressed in the control (Figure 2(b)). The functional annotations of the differentially expressed genes (fold change >1.5) classified the gene ontology categories (false discovery rate < 0.05) into biological process (BP) using DAVID (Figure 3(a) and (b)). We observed that the genes that were differentially expressed in the EtOH-treated cells are involved in several important BPs such as cell signaling, synaptogenesis, synaptic transmission, synapse organization, and nerve impulse transmission. In pathway analysis, we found that the most significant pathway for Cont versus EtOH was nicotine signaling (general scheme), while cell adhesion (synaptic contact) was reported as the most significant process network in these cells (Figure 4 and Figure S2). GeneGo pathway analysis also revealed the disease profiles of differentially expressed genes in different samples. Statistically significant diseases (by biomarkers) associated with the downregulated genes were relevant to FASD (neurotic disorders, epilepsy, alcoholism or alcohol-related disorders, and Angelman syndrome; Figure S3). Together, these results indicate that EtOH affects early neuronal differentiation by altering several critical pathways/networks that are required for proper CNS development.

Functional annotation of the differential gene expression in different samples. Pie charts represent the gene ontology analysis (BP) of up- and downregulated genes in (a) Cont versus EtOH and (b) Cont versus EtOH + FA. FA: folic acid; Cont: non-treated differentiated cells; EtOH: ethanol-treated cells; EtOH + FA: combination treatment with ethanol and folic acid; BP: biological process.
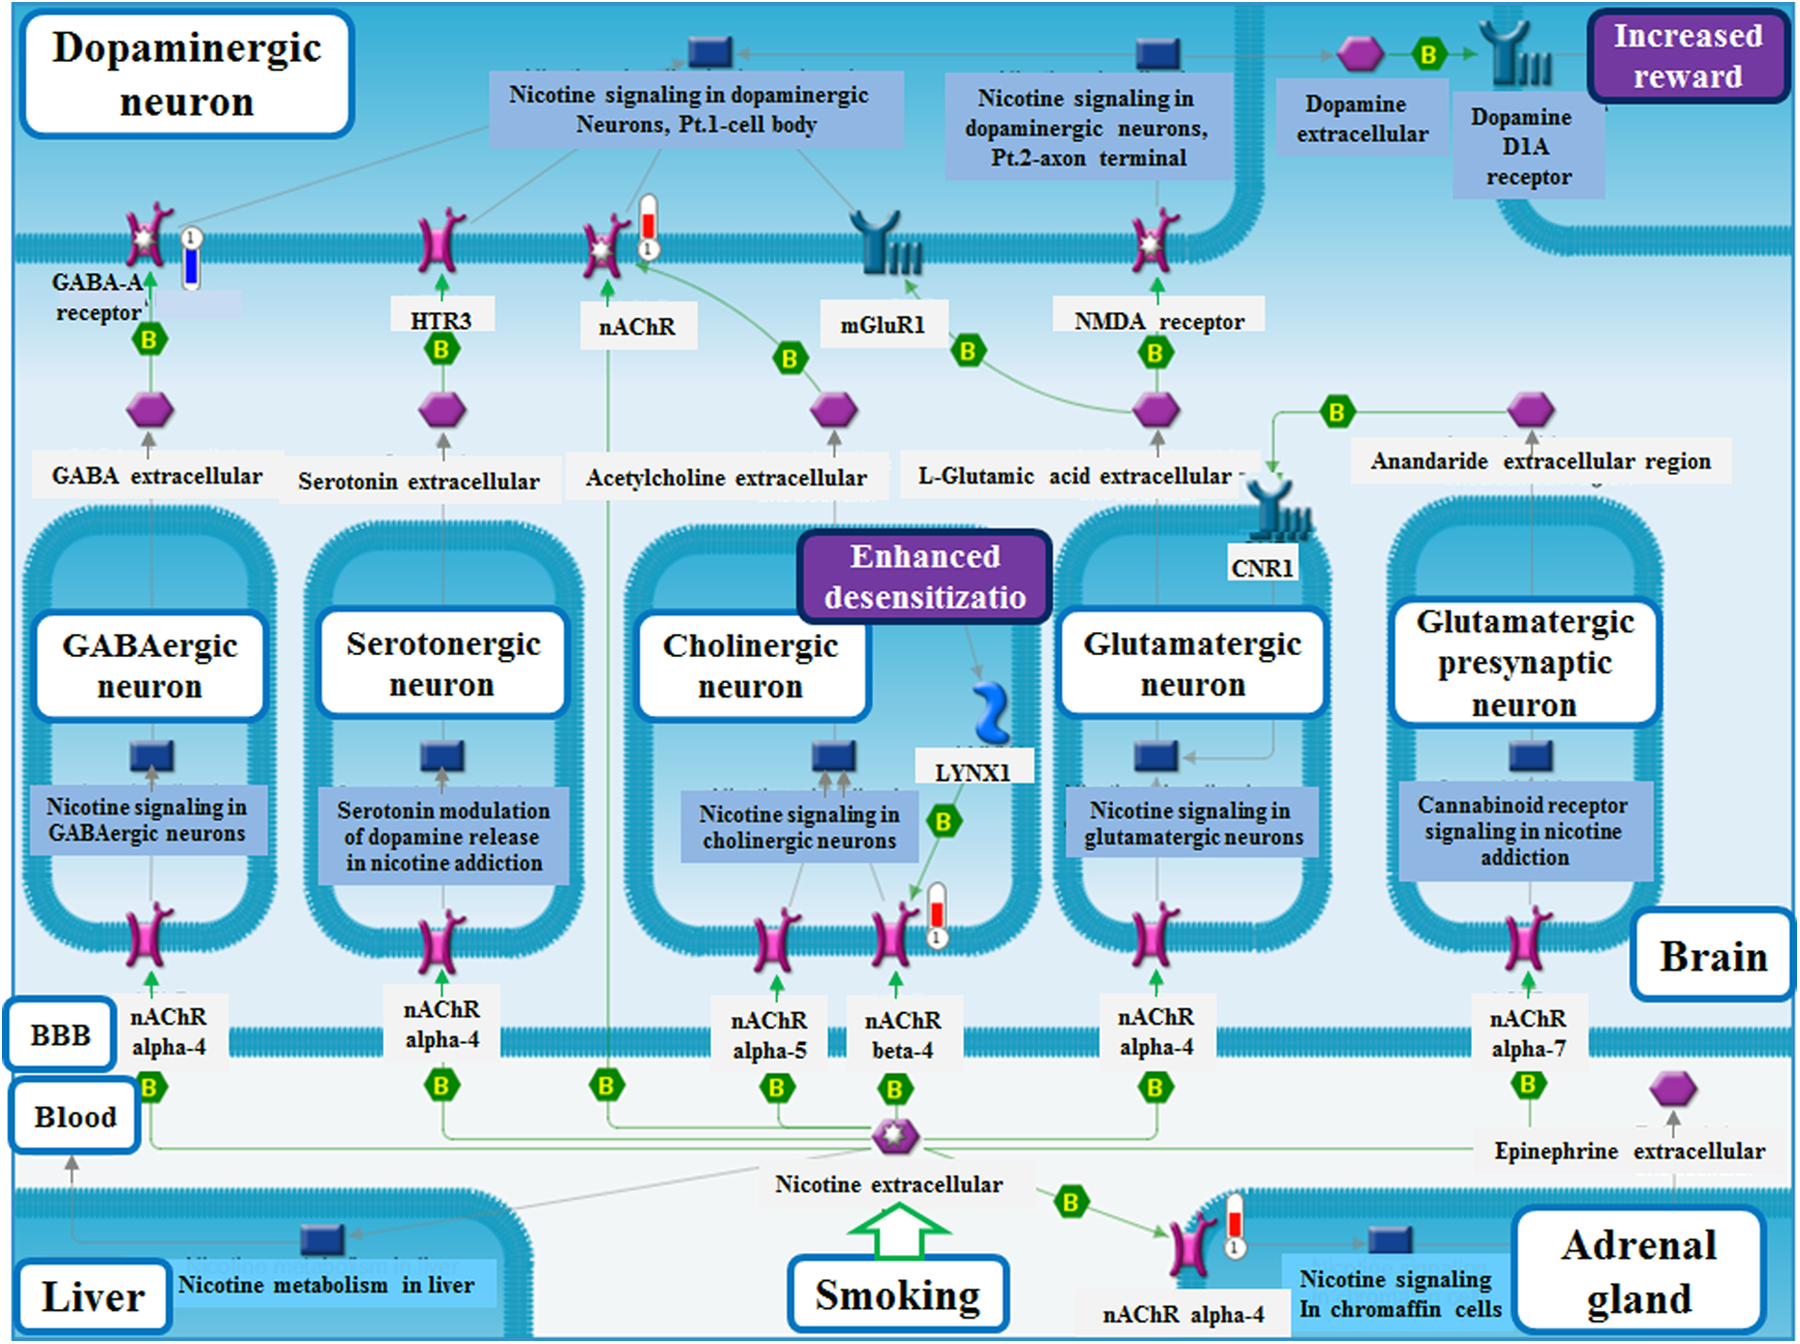
The top-scoring map (lowest p-value) based on the enrichment distribution sorted by GeneGo pathway software. Comparative experimental data from ethanol or/and FA-treated cells were linked to and visualized on the map as thermometer-like figures. Upregulated genes are marked with red thermometers, while downregulated genes are marked with blue thermometers. FA: folic acid.

Confirmation of differential gene expression by qRT-PCR. (a) Chronic ethanol exposure decreased the expression levels of PCDHB14, GABRB1, OPN5, NAV3, and CTNND2 in comparison with control cells. (b) Ethanol also decreased the expression levels of OTX2, CTXN3, and GAD2, whereas it induced the expression of CHRNB4 during early neuronal differentiation. Gene expression was normalized to the level of GAPDH. Values represent the mean ± SEM (n = 3). *p < 0.05: significantly different from Cont sample. qRT-PCR: quantitative reverse-transcriptase polymerase chain reaction; FA: folic acid; Cont: non-treated differentiated cells, EtOH: ethanol-treated cells, EtOH + FA: combination treatment with ethanol and folic acid.
Validation of differential gene expression by qRT-PCR
qRT-PCR was used to confirm the differential gene expression observed in the microarray analysis. A total of 10 genes were selected from the list of differentially expressed genes and key pathways that were affected by chronic EtOH exposure. Among the analyzed genes, we confirmed the altered gene expressions that are relevant to the transcriptomic analysis (Figure 5(a) and (b)). We found that EtOH exposure decreased the expression of several important genes, such as PCDHB14, GABRB1, NAV3, CTNND2, OTX2, GAD2, MASH1, OPN5, and CTXN3 (Figure 5(a) and (b)). Moreover, EtOH treatment increased the expression of pluripotency genes, such as the cholinergic receptor, nicotinic, β-4 (neuronal; CHRNB4); developmental pluripotency-associated 3 (DPPA3); and cadherin 1, type 1, E-cadherin (epithelial) (CDH1), during early neuronal differentiation (Figure 5(b), data not shown). With the progress of differentiation, the pluripotency should be reduced and the existence of the pluripotent state might be the reason for altering differentiation dynamics.
We also examined the combined effect of EtOH and FA in this study. Among the observed genes, the expression level of some genes was restored by the treatment of FA; however, most of them were not (Figure 5(a) and (b)). In addition, we focused on RA-signaling responsive genes because RA is known to have competitive functions with EtOH. RA synthesis and catabolism-related genes were deregulated in EtOH-treated cells during early neuronal differentiation (Figure S4). Although the precise mechanisms are yet to be investigated, this study suggests that deregulation of RA signaling could be a part of EtOH-induced abnormal CNS development.
Discussion
As a teratogen, alcohol is capable of directly inducing developmental abnormalities in the fetus, and the main effect of FAS is permanent CNS damage, especially in the brain. There are several ways in which alcohol can disturb the normal brain development process. These include changes in DNA methylation, apoptosis, neural migration, neurotransmitters and their receptors, and the interference in neurotransmission. 18,19 Here, we utilized NCCIT cells as a robust experimental model that mimics human embryonic development. EC cells are pluripotent stem cells derived from teratocarcinomas and are considered the malignant counterparts of human embryonic stem cells. Several of the existing human EC stem cell lines provide robust and simple culture systems to study certain aspects of cellular differentiation in a manner pertinent to human embryogenesis. 20 Upon RA treatment, NCCIT cells lose their pluripotency and undergo morphological changes, flattening, and, in some cases, acquiring the branched and elongated cytoplasmic processes typical of neurons. 21 This study focused on the effects of chronic EtOH exposure during neuronal differentiation that might be correlated with early CNS development. By employing a transcriptomic approach, we identified a number of genes that were deregulated by EtOH exposure.
Protocadherins, a large family of cadherin-related molecules that are expressed in the CNS, have been suggested to play roles in the formation and maintenance of these synaptic connections. They play important roles in neuronal survival, axonal projection, and several brain functions, including learning and memory. 22,23 EtOH treatment decreased the expression of PCDHB14 during neuronal differentiation. Previous studies have suggested that EtOH impairs neuronal differentiation by altering adhesion molecule gene expression, neuronal migration, and neurite outgrowth. 24,25 Thus, consistent with previous studies, our results suggest that the EtOH-induced downregulation of the protocadherin gene may alter synaptic function and impair CNS development.
During embryonic development, γ-aminobutyric acid (GABA) appears at the beginning of neurogenesis when the CNS is primarily composed of proliferating neuroepithelium. 26 In the later phase, GABAergic neurons become widespread in all the regions of the brain 27 and act as a trophic signal during neurogenesis. One of the most important targets of EtOH in the CNS is the GABA receptor-β, which has a binding site for EtOH. 28,29 GAD2 is an enzyme that converts synaptic glutamate into the inhibitory GABA. In an animal model, GAD2 was neuroprotective against excitotoxic damage by reducing levels of available glutamate in presynaptic neurons. 30 Our results clearly showed the decreased expression of GABRB1 and GAD2 during early neuronal differentiation, and this reduction may cause reduced neuroprotection. Moreover, we reported that EtOH reduces the expression of MASH1, an enhancer of GABAergic differentiation. Together, these data indicate that the EtOH-induced deregulation of GABRB1, GAD2, and MASH1 may alter the GABAergic system, which could lead to abnormal brain development.
Neuronal nicotinic acetylcholine receptors (nAChRs) have recently received significant attention because the cholinergic system plays an important role in modulating many other transmitter systems. Maintaining the levels and function of nAChRs during development and in adulthood is critical for proper circuit function. Here, we demonstrated that EtOH increased the expression of CHRNB4 during early neural differentiation of EC cells. Because over-activation of nAChRs can lead to epilepsy 31 and, in even more extreme cases, to neurodegenration, 32 EtOH-induced induction of CHRNB4 could contribute to impaired neural plasticity.
NAV3 is a member of the neuron navigator protein family expressed predominantly in the central and peripheral nervous systems. 33 Although the biological function of mammalian NAV3 in the brain remains totally unknown, a Caenorhabditis elegans gene named unc-53 that is highly homologous to NAV3, plays a key role in axon guidance. 34 Importantly, NAV2, a paralog of NAV3, plays a central role in neurite outgrowth and axonal elongation in human neuroblastoma cells. 35 In this study, we observed a significant downregulation of NAV3, and this reduction may responsible for the improper brain development.
The OTX2 gene encodes a transcription factor essential for the normal development of the brain, cerebellum, pineal gland, and eye. In the retina, OTX2 has essential functions from early embryogenesis to adulthood. In the visual cortex, the gene modulates the neuronal plasticity through a paracrine mechanism. OTX2 heterozygous mutations in humans have been linked to severe ocular malformations associated with brain abnormalities and pituitary dysfunction. 36 In this study, we observed a significant downregulation of OTX2, and this reduction may be responsible for the brain abnormalities previously reported.
CTNND2 encodes an adhesion junction-associated protein of the β-catenin superfamily that has been implicated in brain and eye development. 37 The Opn5 (neuropsin) group was first identified in mouse and human genomes and found to be expressed in neural tissues, but its function had remained uncharacterized. 38 The CTXN3 gene encodes a brain-specific integral membrane protein that is highly enriched in the cortex. It is expressed in fetal brains and is indicated to play a role in normal brain function. 39
Furthermore, EtOH exposure also affects RA signaling and its responsive genes. We found that EtOH treatment inhibited RA synthesis- and metabolism-related genes. RA is an established signaling molecule that is involved in neuronal patterning, neural differentiation, and axon outgrowth. 40 In its absence, these events may not occur properly. Here, we reported RA signaling-related genes that are differentially expressed in the EtOH-treated cells. Although the exact mechanism for the effects of external RA is yet to be investigated, our results may indicate that EtOH-impaired RA signaling may lead to abnormal neural differentiation.
Conclusion
In conclusion, this study supported a neuroteratological response to EtOH exposure during early development. We reported the downregulation of several genes that have functions in CNS development, neurological system processes (neurogenesis), synaptogenesis, and synaptic transmission during neuronal differentiation of NCCIT cells. These results suggest that it would be possible that impairment of the neurological system or suboptimal synapse formation resulting from EtOH exposure in FASD individuals may be due to the downregulation of CNS developmental genes as found in our experimental model.
Footnotes
Authors' Note
Authors DH and CM contributed equally to this work.
Funding
This work was supported by the National Research Foundation (NRF) grant funded by the Korean government (MSIP) (No. 2013R1A1A3011026 to KHJ and No. 2011-0030049 to YGC) and by part of the Korean Alcohol Research Foundation.