
Abstract
Artemisinin is an antimalarial drug previously reported to induce neurotoxicity and embryotoxicity in animal models. This study investigated the erythrocytes and reproductive toxicity potentials of artemisinin in female rats. Animals were randomly divided into four study groups of eight rats each. The control group (group I) received corn oil, the vehicle, while groups II–IV were orally exposed to 7, 35 and 70 mg kg−1 day−1 of artemisinin, respectively, by gastric intubation for 7 consecutive days. Subsequently, we evaluated the impact of artemisinin on the endocrine environment and selected markers of oxidative damage and antioxidant status of the erythrocytes, ovary and uterus. Artemisinin significantly increased hydrogen peroxide (H2O2) and malondialdehyde (MDA) levels and decreased catalase, glutathione peroxidase and superoxide dismutase activities in erythrocytes and uterus of rats compared with control group (p < 0.05). However, artemisinin did not alter ovarian MDA, H2O2, glutathione levels and catalase activity, while ovarian and uterine histological assessment revealed absence of visible lesions. Moreover, artemisinin significantly decreased follicle-stimulating hormone and increased progesterone levels compared with control (p < 0.05). Thus, these data suggest that in the absence of malarial parasite infection, artemisinin induced hormonal imbalance and oxidative damage in the erythrocytes and uterus but spared the ovary of rats.
Introduction
Malaria is one of the world’s leading infectious killer diseases, 1 which results in the death of about 2 million people yearly. Therefore, researchers have employed several efforts to “roll back malaria” in order to prevent/eradicate the disease. In spite of this, the disease still affects about 3 billion people in 109 countries including several African regions. 2 Malaria is caused by four species of intracellular protozoans of the genus Plasmodium. 3 Among these species, Plasmodium falciparum is the most deadly and widespread. It produces certain proteins that move to the surface of infected red blood cells (RBCs), in order to be adhered to the vascular endothelium, thereby evading spleen clearance. 4 Indeed, the scourge of malaria is attributed to the emergence of drug-resistant parasites. 5 Artemisinin and its derivatives are active and effective antimalarials against multiresistant strains of Plasmodium falciparum. Artemisinin is an endoperoxide sesquiterpene lactone isolated from the aerial parts of Artemisia annua. 6,7
The antimalarial mechanism of action of artemisinin is due to the presence of the endoperoxide bridge (Figure 1). In this case, C-centered free radicals 2,8 are generated as a consequence of Fe2+-induced cleavage of the peroxide bond. In addition, peroxides are a known source of reactive oxygen species (ROS) such as hydroxyl and superoxide radicals, 9 which can cause damage to tissues. For instance, several studies have reported that the treatment of membranes (in the presence of haeme) with artemisinin caused lipid peroxidation (LPO), a consequence of free radical damage. 10,11 In spite of the in utero toxicities of artemisinin and its derivatives reported in animal models, 12 –15 studies that focused on erythrocytes and the reproductive toxicities of artemisinin prior to pregnancy in the absence of malarial parasite infection are scarce.

Chemical structure of artemisinin.2
Oxidative stress affects erythrocytes largely due to the presence of high concentration of cellular oxygen, haemoglobin and polyunsaturated fatty acids in their membrane. Consequently, antioxidants scavenge ROS in order to maintain the integrity of the RBCs membrane. 16 Considering the facts that artemisinin-induced reduction in reticulocytes is more pronounced in healthy volunteers than in malarial patients, 17 and the artemisinin-induced ROS production, this study was carried out to investigate the erythrocyte antioxidant response to artemisinin exposure in the rats.
Further, the artemisinin-induced generation of ROS can exacerbate ROS production in reproductive tissues above the normal physiological range, if the antioxidative systems fail to curtail the ROS generated. 18 This increased ROS production can consequently result in the modification of susceptible molecules including DNA, lipids and proteins in these tissues due to oxidative stress. In addition to this, the reported neurotoxic effects of artemisinin and its derivatives in different animal models 19 –21 have generated issues of concern lately. In this case, exposure to neurotoxic agents such as artemisinin can cause dysfunction of the female reproductive system because of the hypothalamic–pituitary–gonadal axis connection. 22 Thus, due to the reported artemisinin-induced neurotoxicity and ROS production in animal models, we also assessed the impact of artemisinin on the levels of reproductive hormones as well as ovarian and uterine ROS-antioxidants relationship in the rats.
Materials and methods
Drugs and chemicals
Artemisinin (98%) (Sigma Chemical Co., Missouri, USA) was provided through the courtesy of Molecular Bio/Sciences Limited (Calabar, Nigeria). Epinephrine, glutathione (GSH), 5′,5′-dithio-bis-2-nitrobenzoic acid, hydrogen peroxide (H2O2), thiobarbituric acid (TBA) and 1-chloro-2,4-dinitrobenzene (CDNB) were also purchased from Sigma Chemical Co.. All other reagents were of analytical grade and were obtained from the British Drug House (Poole, Dorset, UK).
Experimental design
Adult female albino Wistar rats (age about 3 months; weight 150–220 g) obtained from the Central Animal House Facility, College of Medicine, University of Ibadan, Nigeria, were used in the present study. Acclimatization of animals and treatment were carried out in a ventilated room. They were placed in plastic cages and kept under controlled conditions of natural photoperiod of about 12-h light–dark cycle daily and allowed free access to water and standard rat pellet chow diet. This study was approved by the Institutional Ethical Committee and carried out in accordance with the guidelines of the National Institute of Health for laboratory animal care and use. 23 After 1 week of acclimatization, the rats were randomly divided into four groups of eight rats each. Different doses of artemisinin (7–70 mg kg−1 day−1) were administered for 7 consecutive days to the different groups of rats based on the recommendation for artemisinin monotherapy regimen. 24 Rats in group I, the control group, received corn oil alone. Groups II–IV rats received 7, 35 and 70 mg kg−1 of artemisinin, respectively, and weighed before and after exposure to artemisinin. We used artemisinin as a prototype of other antimalarials in the same class, because unlike others, it is not metabolised to dihydroartemisinin. 25 The 7 mg kg−1 day−1 dose was selected based on the therapeutic dose of artemisinin in adult humans (500 mg day−1). 26,27 The 35 and 70 mg kg−1 doses represent 5 and 10 times the therapeutic dose of artemisinin, respectively, and they are still low when compared with the lethal dose 50 that is greater than 5000 mg kg−1. 28 In this study, we attempt to simulate a situation in which artemisinin is used in a non-pregnant state without malarial parasite infection. This is common in environments where drug abuse is a common practice.
Blood and organ collection
At the end of the experimental period, animals were fasted overnight and killed by cervical dislocation. Blood was collected by cardiac puncture into anticoagulant bottles and centrifuged at 3000g at room temperature for 15 min to obtain the plasma used for hormonal analysis. The ovaries and uteri were quickly removed, washed in cold 1.15% potassium chloride (KCl), weighed and homogenized in 50 mM of Tris-hydrochloric acid buffer (pH 7.4) containing 1.15% KCl and centrifuged at 10,000g for 10 min to obtain the post-mitochondrial supernatant fractions used for biochemical assays. In addition, samples from the ovaries and uteri were fixed in Bouin’s fixative for histopathological examination.
Preparation of erythrocytes
After the separation of plasma from the blood obtained above, the erythrocytes were washed three times with ice cold phosphate-buffered saline (PBS: 145 mM sodium chloride (NaCl), 1.9 mM monosodium phosphate (NaH2PO4) and 8.1 mM disodium phosphate (Na2HPO4), pH 7.4) and centrifuged at 3000g for 10 min. The erythrocyte pellets obtained were thereafter resuspended in PBS (NaCl, NaH2PO4, 0.1 M Na2HPO4, pH 7.4) at 1:9 dilutions and used for the evaluation of erythrocyte biochemical assays.
Biochemical investigations
Protein concentration
The method of Lowry et al. 29 was used to determine protein concentration in the samples.
Determination of LPO
LPO was assayed as malondialdehyde (MDA) using the method of Farombi et al. 30 and Buege and Aust. 31 Aliquot of 0.4 mL sample was mixed with 1.6 mL of Tris-KCl buffer after which 0.5 mL of 30% trichloroacetic acid (TCA) was added. Subsequently, 0.5 mL of 0.75% TBA was added and incubated for 45 min at 80°C. After cooling in ice, the mixture was centrifuged at 3000g. The absorbance of the clear supernatant was read against a reference blank at 532 nm. Lipid peroxidation in units per milligram of protein was thereafter computed using a molar extinction coefficient of 1.56 × 10⁵ m−1 cm−1.
H2O2 generation assay
H2O2 generation was assayed by the method of Wolff 32 and expressed as micromole per milligram of protein.
Determination of superoxide dismutase activity
The superoxide dismutase (SOD) activity was determined by the method of Misra and Fridovich. 33 Briefly, 200 μL of the sample and 2.5 mL of 0.05 M carbonate buffer (pH 10.2) were equilibrated in the spectrophotometer. The reaction was allowed to commence by adding 300 µL of freshly prepared 0.3 mM adrenaline to the mixture mixed by inversion. Increase in absorbance at 480 nm was monitored every 30 s for 150 s. The specific activity of SOD is expressed as unit per milligram of protein.
Determination of catalase activity
Catalase activity was assayed using the method of Clairborne. 34 Briefly, the assay mixture contains 2.40 mL of phosphate buffer (50 mM, pH 7.0), 10 μL of 19 mM of H2O2 and 50 μL of sample allowed to run for 3 min at 30-s interval and thereafter terminated by the addition of 2 mL of dichromate/acetic acid solution, followed by heating for 10 min in a boiling water bath. After cooling the mixture at room temperature, decreases in absorbance was read with a spectrophotometer at 570 nm. Values are expressed as micromole of H2O2 consumed per minute per milligram of protein.
Determination of glutathione-S-transferase activity
The glutathione-S-transferase (GST) activity was determined by the method of Habig et al. 35 Briefly, the reaction mixture of 1.7 mL of 100 mmol L−1 of phosphate buffer (pH 6.5) and 0.1 mL of 30 mmol L−1 of CDNB was pre-incubated for 5 min at 37°C followed by the addition of 20 μL of the sample. The absorbance of the reaction mixture was monitored for 5 min at 340 nm against the blank. The specific activity of GST is expressed as micromole per minute per milligram of protein using an extinction coefficient of 9.6 mm−1 cm−1.
Determination of glutathione peroxidase activity
The method of Rotruck et al. 36 was used to determine glutathione peroxidase (GPx) activity. Briefly, the assay mixture of 500 μL of sodium phosphate buffer, 100 μL of 10.0 mM of sodium azide, 200 μL of 4.0 mM of GSH, 100 μL of 2.5 mM of H2O2 and 50 μL of the sample was made up to 2.0 mL with distilled water, incubated at 37°C for 3 min, and terminated by adding 0.5 mL of 10% TCA. The supernatant obtained after centrifugation was used to determine residual GSH content by the addition of 4.0 mL of 0.3 M disodium hydrogen phosphate solution and 1 mL of DTNB reagent. The absorbance was read in a spectrophotometer at 412 nm against a reagent blank.
Determination of reduced GSH
The GSH was determined using the method of Jollow et al. 37 Briefly, an aliquot of the sample was deproteinized by the addition of an equal volume of 4% sulfosalicylic acid and centrifuged at 10,000g for 15 min at 4°C. The supernatant (50 μL) was then added to 4.5 mL of DTNB and the absorbance read at 412 nm.
Determination of plasma follicle-stimulating hormone, prolactin, progesterone and estrogen concentrations
We evaluated luteinising hormone, follicle-stimulating hormone (FSH), prolactin, progesterone and estrogen concentrations using commercial enzyme immunoassay kits specific for rats according to the manufacturers’ procedures. Luteinising hormone and FSH kits were obtained from Amersham, UK. Prolactin and progesterone kits were obtained from Cayman Chemical (USA), while estrogen kit was obtained from MyBioSource Inc. (USA).
Histological evaluation
The ovary and uterus specimens were fixed in Bouin’s solution, dehydrated in ethanol, cleared in xylene and embedded in parafin. Sections of 4–5 µm were cut using a microtome and stained with hematoxylin and eosin stain. The slides were examined under a light microscope by investigators blinded to control and artemisinin-treated groups. 38
Statistical analysis
The results are expressed as Mean ± SD (standard deviation). Statistical analysis was performed using a one-way analysis of variance (ANOVA) followed by Tukey’s post hoc test. The results were considered statistically significant at p < 0.05.
Results
Body and reproductive organ weights of female rats treated orally with 7, 35 and 70 mg kg−1 of artemisinin for 7 days
As shown in Table 1, expected weight gains occurred in the control and artemisinin-exposed rats. However, artemisinin caused dose-dependent significant decreases in percentage of body weight changes across the treated groups compared with the control (p < 0.05). In addition, artemisinin significantly increased ovarian weights compared with the control group (p < 0.05).
Body and reproductive organ weights of female Wistar rats treated orally with 7, 35 and 70 mg kg−1 of artemisinin for 7 days.

The results are presented as mean
Effects of artemisinin on oxidative stress markers of female rats treated orally with 7, 35 and 70 mg kg−1 of artemisinin for 7 days
The effects of artemisinin on oxidative stress markers MDA and H2O2 after 7 days of oral exposure of female rats to artemisinin are depicted in Figures 2 and 3, respectively. Artemisinin did not alter ovarian MDA and H2O2 levels but caused significant dose-dependent elevations in uterine and erythrocyte MDA (p < 0.05) levels in the 35 and 70 mg kg−1 artemisinin groups compared with control (Figure 2). In addition, uterine H2O2 generation significantly increased in all the artemisinin-treated groups, while erythrocyte H2O2 generation significantly increased in the 35 and 70 mg kg−1 artemisinin groups compared with control (Figure 3).
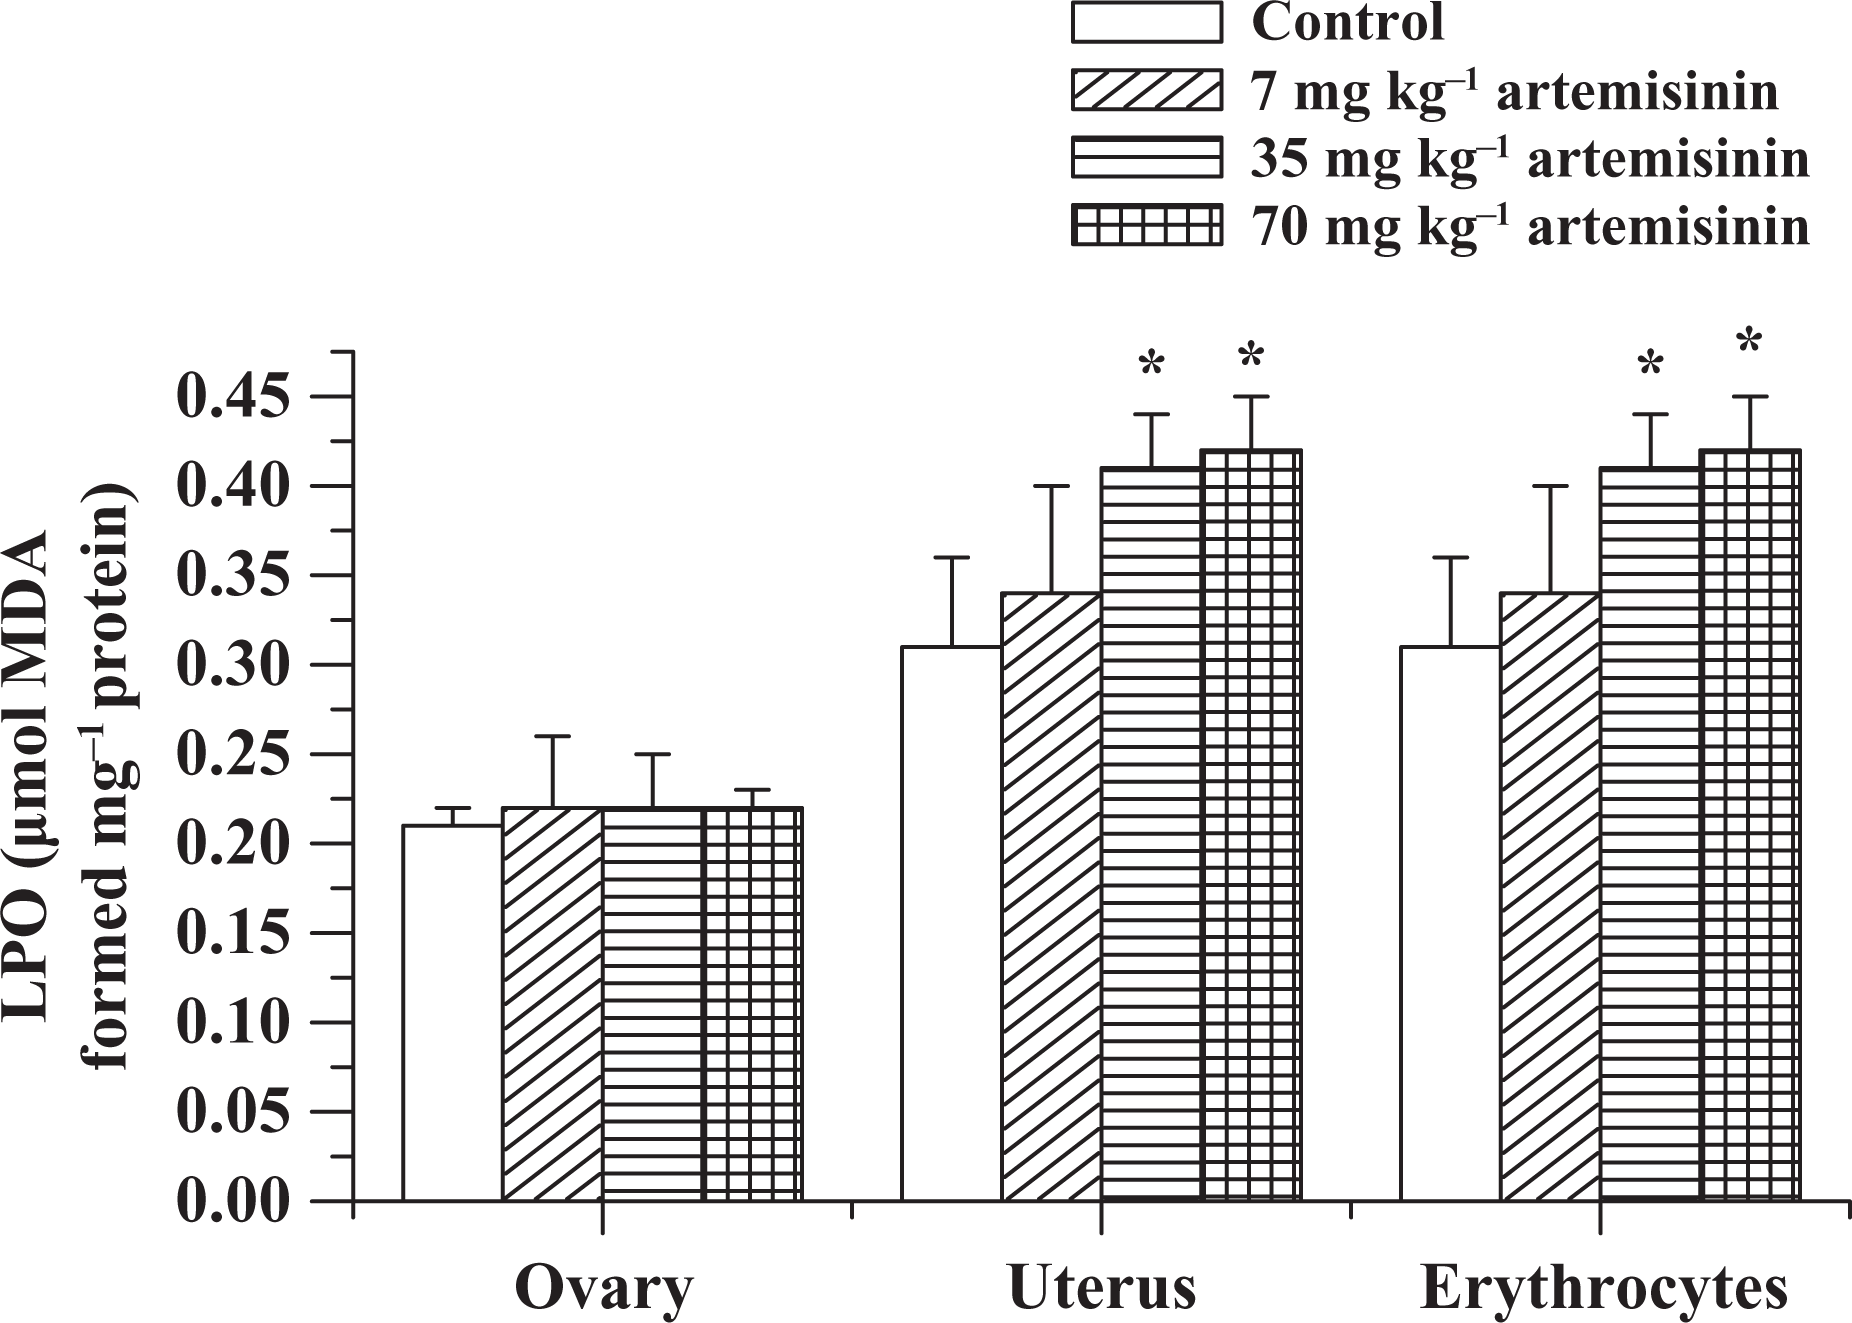
Ovarian, uterine, and erythrocyte LPO status of female rats treated with 7, 35 and 70 mg kg−1 of artemisinin for 7 days. The results are presented as mean ± standard deviation of 8 animals. Significant difference compared with control, *p < 0.05.

Ovarian, uterine, and erythrocyte H2O2 generated in female rats treated with 7, 35 and 70 mg kg−1 artemisinin for 7 days. The results are presented as mean ± standard deviation of 8 animals. Significant difference compared with control, *p < 0.05.
Ovarian, uterine and erythrocyte antioxidant levels of female rats exposed to artemisinin
The levels of antioxidant markers after 7 days of oral exposure of female rats to 7, 35 and 70 mg kg−1 artemisinin are shown in Figures 4 to 8. In the artemisinin-treated groups, there were significant reductions in the activities of uterine and erythrocyte SOD (Figure 4), catalase (Figure 5), and GPx (Figure 7) when compared with the control values (p < 0.05). The ovarian catalase activity (Figure 5) and GSH level (Figure 8) were not altered in the rats after 7 days’ treatment with artemisinin. The data also reflect significant increases in the activities of ovarian and erythrocyte GST in the 35 and 70 mg kg−1 artemisinin groups compared with control (Figure 6). Moreover, 7 days oral exposure of female rats to 7, 35, and 70 mg kg−1 artemisinin significantly decreased uterine GST activity (Figure 6) and GSH levels (Figure 8) when compared with the control group, while erythrocyte GSH levels (Figure 8) decreased in the 35 and 70 mg kg−1 artemisinin groups compared with control (p < 0.05).

Ovarian, uterine, and erythrocyte superoxide dismutase activity of female rats treated with 7, 35 and 70 mg kg−1 artemisinin for 7 days. The results are presented as mean ± standard deviation of 8 animals. Significant difference compared with control, *p < 0.05.

Ovarian, uterine, and erythrocyte catalase activity of female rats treated with 7, 35 and 70 mg kg−1 artemisinin for 7 days. The results are presented as mean ± standard deviation of 8 animals. Significant difference compared with control, *p < 0.05.

Ovarian, uterine, and erythrocyte glutathione-S-transferase activity of female rats treated with 7, 35 and 70 mg kg−1 artemisinin for 7 days. The results are presented as mean ± standard deviation of 8 animals. Significant difference compared with control, *p < 0.05.

Ovarian, uterine, and erythrocyte glutathione peroxidase activity of female rats treated with 7, 35 and 70 mg kg−1 artemisinin for 7 days. The results are presented as mean ± standard deviation of 8 animals. Significant difference compared with control, *p < 0.05.

Ovarian, uterine, and erythrocyte reduced glutathione levels in female rats treated with 7, 35 and 70 mg kg−1 artemisinin for 7 days. The results are presented as mean ± standard deviation of 8 animals. Significant difference compared with control group, *p < 0.05.
Plasma reproductive hormonal levels of female rats treated with artemisinin for 7 days
Figure 9(a)-(e) shows the effects of artemisinin on reproductive hormonal levels in female rats. Artemisinin did not alter the level of LH in the treated groups (Figure 9(a)) but significantly reduced FSH (Figure 9(b)), and increased progesterone levels in the artemisinin-exposed rats (Figure 9(d)) compared with the control (p < 0.05). In addition, artemisinin caused non-significant increases in prolactin (Figure 9(c)) and estrogen (Figure 9(e)) levels compared with the control.

Levels of (a) luteinizing hormone, (b) follicle-stimulating hormone, (c) prolactin, (d) progesterone and (e) estrogen in female rats treated with 7, 35 and 70 mg kg−1 artemisinin for 7 days. The results are presented as mean ± standard deviation of 8 animals. Significant difference compared with control, *p < 0.05.
Ovarian and uterine histology after exposure of female rats to artemisinin
Figure 10 shows the representative photomicrographs of ovarian and uterine sections after exposure of female rats to 7, 35 and 70 mg kg−1 artemisinin for 7 days. Artemisinin did not appear to cause any noticeable lesion in the ovarian and the uterine architecture under light microscopic examination.

Representative photomicrographs of haematoxylin–eosin-stained ovarian and uterine sections from control and artemisinin-treated rats after 7 days of exposure (×400). A1-D1 reflect ovary of control (A1) and artemisinin-treated rats administered with 7, 35 and 70 mg kg−1 artemisinin (B1, C1 and D1), respectively: No visible lesions were seen. A2-D2 reflect uterus of control (A2) and artemisinin-treated rats exposed to 7, 35 and 70 mg kg−1 artemisinin (B2, C2 and D2), respectively. No visible lesions were seen.
Discussion
In malaria-endemic regions of tropical Africa, the treatment of malaria is usually based on fever, rather than the confirmation of parasitemia. 39,40 This is because several other diseases have symptoms similar to malaria. 41 In the present study, we investigated the toxicity potential of artemisinin in erythrocytes, ovary and uterus of rats in the absence of pregnancy and malarial parasite infection. Our data demonstrated that artemisinin induced oxidative stress in the uterus and erythrocytes and disrupted hormonal balance in rats.
Oxidative stress has been implicated in the aetiology of reproductive and erythrocytic diseases. 42 In our study, the artemisinin-induced uterine and erythrocyte increases in MDA and H2O2 generation, suggest the induction of oxidative stress in these tissues. H2O2 has been reported to induce the peroxidation of polyunsaturated fatty acid to yield highly reactive MDA. 43,44 Thus, LPO can induce injury to tissues by altering the physicochemical properties of membrane lipid bilayers, leading to severe cellular dysfunction. 45 Our data corroborate several reports in which antimalarial drugs such as amodiaquine, 46 mefloquine and halofantrine, 47 artesunate, 48 artemether-lumefantrine, 49,50 artesunate-amodiaquine, 51 and artemisinin 52 caused elevated levels of MDA and/or H2O2 in different tissues. However, the current study showed that artemisinin did not cause elevation in ovarian MDA and H2O2.
Further, the artemisinin-induced LPO in the uterus and erythrocytes may be due to decreased activities of SOD and catalase as observed in this study. This is because SOD is the first line of defence enzyme against the deleterious effects of oxyradicals (O2 −), which causes damage to uterine and erythrocyte membrane structures. Indeed, catalase serves an important role in the ovary, uterus, and erythrocytes by scavenging H2O2 at high concentration, thereby converting it to water and molecular oxygen. Indeed, a decrease in SOD activity has been linked with increased O2 − and decreased catalase activity as observed in this study. 44 In conjunction with catalase, GPx scavenges H2O2 in order to protect uterine and erythrocyte membranes from LPO. If GPx fails to eliminate H2O2 from the cell, H2O2 accumulates leading to a reduction in SOD activity. 53 In contrast, the observed increases in ovarian GPx and catalase activities suggest an adaptive response that helps to protect the ovary from the toxicity of artemisinin and/or its metabolites.
The depletions in uterine and erythrocyte GSH as observed in this study, further confirm induction of oxidative damage in these tissues. GSH is essential in the detoxification of free radicals in the erythrocyte and female reproductive tissues by binding with the products of LPO and other toxic endogenous substances. In addition, our data indicated depletion in uterine GST activity after artemisinin exposure in the rats. As a phase II metabolising enzyme, GST conjugates with xenobiotics, thus increasing their polarity, in order to neutralize and eliminate them from the system. 54 The reduction in uterine GST activity in this study, therefore, may suggest impaired detoxification of artemisinin and/or its metabolites, which further implies uterine oxidative damage.
The endometrium is a tissue where considerable angiogenesis occurs on a regular physiological basis. 55 Oxidative stress in the uterus, as shown in the present study, is one of the possible causes of recurrent implantation failure and repeated miscarriages. For instance, elevated H2O2 has been linked with the disruption of uterine movement and homeostasis via several mechanisms. 56 Although this study reflected induction of oxidative stress in the uterus, histopathological examination under light microscope showed no significant damage to uterine and ovarian sections after the 7-day period of artemisinin exposure in rats.
The hormonal imbalance observed in this study is possibly due to the reported neurotoxic effect of artemisinin, 19 –21 since the female reproductive axis is regulated by the communication among the hypothalamus, pituitary, and the ovary. 57,58 The observed dose-dependent increase in progesterone level in all the artemisinin-treated rats may lead to a disruption in ovulation process. Indeed, progesterone inhibits the action of FSH, thereby preventing the development of new follicles and eggs. 59 This increase in progesterone concentrations in the rats might have elicited a negative feedback mechanism in the pituitary gonadotropin, FSH, thereby causing significant reduction in its level in the rats.
In conclusion, our data indicated that artemisinin-induced mechanism of uterine and erythrocyte toxicities seems to be associated with the induction of oxidative stress in these tissues. Furthermore, the disruption of hormonal balance caused by artemisinin exposure in the rats may perturb ovulation process. Considering these possible risks associated with artemisinin misuse, we, therefore, advice that confirmation of parasitemia should be ensured before the drug is taken.
Footnotes
Acknowledgement
The authors are grateful to Professor Brisibe Andi of the Molecular Biosciences Ltd, 124 MCC Road, Calabar, Cross River State, Nigeria for the generous gift of the artemisinin used in this study.
Conflict of Interest
The authors declared no conflicts of interest.
Funding
This research received no specific grant from any funding agency in the public, commercial, or not-for-profit sectors.