
Abstract
Di(2-ethyl hexyl)-phthalate (DEHP) is an endocrine disrupter and is the most abundantly used phthalate derivative, which is suspected to be an inevitable environmental exposure contributing to the increasing incidence of type-2 diabetes in humans. Therefore, the present study was designed to address the dose-dependent effects of DEHP on insulin signaling molecules in L6 myotubes. L6 myotubes were exposed to different concentrations (25, 50, and 100 μM) of DEHP for 24 h. At the end of exposure, cells were utilized for assessing various parameters. Insulin receptor and glucose transporter4 (GLUT4) gene expression, insulin receptor protein concentration, glucose uptake and oxidation, and enzymatic and nonenzymatic antioxidants were significantly reduced, but glutamine fructose-6-phosphate amidotransferase, nitric oxide, lipid peroxidation, and reactive oxygen species levels were elevated in a dose-dependent manner in L6 myotubes exposed to DEHP. The present study in turn shows the direct adverse effect of DEHP on the expression of insulin receptor and GLUT4 gene, glucose uptake, and oxidation in L6 myotubes suggesting that DEHP exposure may have a negative influence on insulin signaling.
Keywords
Introduction
Polyvinyl chloride (PVC) plastics are used extensively for a very wide range of purposes, such as interior surfaces, food wrappers, and covering of crops in agriculture. Extensive use of PVC is related to its stability and flexibility, which is achieved by incorporation of plasticizers. More than 300 different types of plasticizers have been identified, and between 50 and 100 are used commercially. Phthalates, diesters of benzenedicarboxylic acid (phthalic acids), constitute the most commonly used plasticizers. Phthalates are multifunctional chemicals used to hold color and scent in consumer and personal care products. 1 The probability of nonoccupational exposure to phthalates is high given their use in a vast range of consumables, including personal care products (e.g. perfumes, lotions, and cosmetics), paints, industrial plastics, and certain medical devices and pharmaceuticals. In humans, phthalates are rapidly metabolized to their monoesters, which can be further transformed to oxidative products, conjugated, and eliminated. 2 Di(2-ethylhexyl)phthalate (DEHP), one of the most commonly used phthalates, leaches from blood storage bags, intravenous and dialysate bags, and tubing made with PVC. 3 There is widespread exposure to DEHP in the general population. Diet, particularly fatty food (e.g. dairy, fish, and oils), is the main source of DEHP exposure in the general public. 4 Since DEHP is not chemically bound to the polymer, it leaches out of the plastic matrix and therefore can be found to be nearly ubiquitous in the environment; it has been detected in air, water, soil, and food. As a consequence, DEHP is incorporated into the human body and can be detected in body fluids and tissues. 5 Phthalates are known as endocrine disrupters, an exogenous substance or mixture that alters function(s) of the endocrine system, and consequently causes adverse health effects in an intact organism or its progeny.
Evidences have accumulated for association of harmful health effects with exposure to phthalates, particularly DEHP, 6 raising public concerns and debates. Although emphasis has been given to potential adverse reproductive and carcinogenic effects, phthalates may have adverse effects on glucose homeostasis, but the evidence has not been examined systematically. This basic insight is supported by a number of independent studies. For example, phthalate metabolite mono(ethylhexyl)phthalate (MEHP), which is a breakdown product of the plasticizer DEHP, was associated with diabetes in this study. 7 In one study, levels of several phthalate metabolites were associated with increased insulin resistance and abdominal obesity in US men. 8 In another study in the US, people aged 6–80 yeras, various phthalate metabolites were associated with higher body mass index and waist circumference in men aged between 20 and 59 years. 9
In a study of Mexican women, levels of three types of DEHP metabolites were higher in adult women with diabetes than those without diabetes, suggesting that phthalate exposures may play a role in diabetes development. 10 While the type of diabetes was not specified, it was presumably type-2, since the subjects were older adults and many were overweight. Rats administered with the phthalate DEHP developed symptoms of diabetes, including higher blood sugar, impaired glucose tolerance, altered insulin signaling molecules, and lower insulin levels. 11 –13
Based on several studies, it has been suggested that the onset of metabolic syndrome could be favored by prolonged exposure to low concentrations of environmental pollutants, including phthalates. However, the mechanisms involved in these new aspects of metabolic impact of phthalate remain poorly understood. In view of this, the present study was designed to study the impact of DEHP on insulin signal transduction in L6 myotubes in vitro. Quantification of enzymatic, nonenzymatic antioxidant, lipid peroxidation (LPO), reactive oxygen species (ROS), nitric oxide (NO), glutamine fructose-6-phosphate (F-6-P) amidotransferase (GFAT), insulin receptor, and glucose transporter4 (GLUT4) would pave way for a better understanding of the possible effect of DEHP on the induction of insulin resistance. In addition, functional aspects like glucose uptake, oxidation, and glycogen concentration were assessed to delineate the impact of DEHP. L6 muscle cell line can be differentiated with high reliability into a myotube muscle cell phenotype that naturally expresses the GLUT4 glucose transporter protein and has a significant insulin-stimulated glucose uptake, biological response, thus providing an efficacious alternative to isolated skeletal muscle tissues or primary skeletal muscle cell cultures. 14 The L6 myotubes cell line is the best characterized cellular model of skeletal muscle origin to study glucose uptake and GLUT4 translocation.
Materials and methods
Reagents
All chemicals and reagents used in the present study were of molecular and analytical grade and were purchased from Sigma Chemical Company (St Louis, Missouri, USA; Amersham Biosciences, UK; and Sisco Research Laboratories, Mumbai, Maharashtra, India. Dulbecco’s modified Eagle’s medium (DMEM), DEHP, porcine insulin, dimethyl sulfoxide (DMSO), penicillin sterptomycin solution, amphotericin B, cytochalasin B, insulin receptor, GLUT4, β-actin primers, and the β-actin monoclonal antibody were purchased from Sigma Chemical Co. (St Louis, Missouri, USA). Fetal bovine serum (FBS) and trypsin–ethylenediaminetetraacetic acid (EDTA) solution were purchased from HiMedia (Mumbai, Maharashtra, India). Total RNA isolation reagent and one-step reverse transcriptase-polymerase chain reaction (RT-PCR) kit were purchased from ABgene (Epsom, UK) and Qiagen (Hilden, Germany), respectively. Polyclonal insulin receptor β-subunit and GLUT4 antibodies were purchased from Santa Cruz Biotechnology Inc. (Dallas, Texas, USA). Iodine-125 ([125I]) were purchased from MP Biochemicals Pvt. Ltd. (Mumbai, India). 14C-glucose, and 14C-2-deoxyglucose were procured from the Board of Radiation and Isotope Technology (Mumbai, Maharashtra, India).
Cell line and cell culture
L6 myotubes cell line was procured from National Centre for Cell Science (Pune, Maharashtra, India). The culture was maintained in DMEM containing 10% FBS and 1% antibiotic/antimycotic in a humidified atmosphere of 5% carbon dioxide (CO2) at 37°C. Differentiation of myoblasts into myotubes was carried out as described previously. 15 L6 myoblast was seeded in 10% FBS-DMEM until it reached 80–90% confluence; the FBS content was reduced to 2% for a further 5–7 days to induce myotube formation. The medium was changed every 2 days, and differentiation was allowed to continue for up to 7 days before the experimentation period. Reduction of serum allowed cell-to-cell fusion and formation of myotubes. The cells were examined each day to evaluate the degree of differentiation, and it was determined as the percentage of nuclei present in the multinucleated myotubes under a phase contrast microscope (Eclipse-80i, Nikon, Tokyo, Japan). Before all experimental manipulations, L6 myotubes were deprived of serum for 1 h to render the cells quiescent.
DEHP exposure
L6 myotubes were incubated with FBS-free DMEM for 1 h and then exposed to different doses (0, 25, 50, 100, 200, 400, and 800 μM) of DEHP for 24, 48, and 72 h and a positive control Triton X-100 (0.1%) was used. The experiments lasted from 24 to 72 h, and test chemical DEHP was added to serum- and antibiotic-free medium and renewed every 24 h. DEHP was dissolved in DMSO, with a final concentration, respectively, keeping DMSO end concentration not exceeding 0.01%. At the end of incubation, cells were utilized for assessing various parameters.
Assessment of cell viability
Cell viability of L6 myotubes was assayed with 3-(4,5-dimethylthiazol-2-yl)-2,5-diphenyltetrazolium bromide (MTT) assay as described previously. 16 Briefly, cells were treated with different concentrations of DEHP for 24, 48, and 72 h and then the medium was aspirated from the wells of the culture plates, and the cells were washed with phosphate-buffered saline (PBS). Then, the cells were incubated with 200 ml of DMEM containing 5 mg/ml MTT for a further period of 4 h at 37°C. Medium was then removed, and 200 μl of DMSO was added and agitated for 10 min to dissolve the formazan crystal formed. Then, 100 μl from each well was transferred into an enzyme-linked immunosorbent assay reader plate, and the absorbance of the converted dye was read at 570 nm with background substitution at 630 nm. Data are expressed as a percentage of untreated control.
Determination of cell and nuclear morphological changes of cells
Analysis of cell morphology was performed using a phase contrast microscope. To this, 3 × 10⁴ cells were seeded in six- well plates and treated with DEHP for 24 h. Protocol was as mentioned for MTT assay. At the end of the incubation period, the medium was removed, and cells were washed once with PBS at pH 7.4. The plates were observed under a phase contrast microscope (Eclipse-80i, Nikon, Tokyo, Japan).
Cytotoxicity assay
Lactate dehydrogenase (LDH) is a stable cytosolic enzyme that is released in the culture medium upon cell lysis and the released LDH is measured colorimetrically with maximum absorbance read at 440 nm. 17 LDH catalyzes the readily reversible reaction involving the oxidation of lactate to pyruvate, forming oxidized nicotinamide adenine dinucleotide (NAD+) from NADH, and the determination of LDH is based on the detection of NADH in the reaction. The treatment protocol was as mentioned for MTT assay, and the conditioned medium alone was taken for LDH leakage assay. To 1 ml of buffered substrate, 0.1 ml of conditioned media was added and kept in water bath at 37°C. Then, 0.2 ml of NAD+ solution was added, mixed gently, and incubated at 37°C for 15 min. To this, 1 ml of 2,4-dinitrophenylhydrazine reagent was added and incubated for further 15 min. Finally, 10 ml of sodium hydroxide (NaOH; 0.4 N) was added, and after 1–5 min, the absorbance was read at 440 nm. Standards were also run simultaneously and treated for assays with sodium pyruvate to prepare the standard graph. The amount of color formed is proportional to the number of lysed cells. LDH activity = OD of unknown/OD of known × standard concentration = microgram of Lactate liberated/milliliter of conditioned media.
DNA fragmentation assays
L6 myotubes treatment protocol was as mentioned for MTT assay. The medium of serum-deprived cells was collected and added to the scraped cells to allow centrifugation of both adhering and floating cells. Cell pellets were resuspended in lysis buffer (10 mM Tris-hydrochloric acid (HCl), pH 8.0, 25 mM EDTA, 100 mM sodium chloride (NaCl), 0.5% sodium dodecyl sulfate (SDS), and 0.5 mg/ml proteinase K) and incubated overnight at 56°C. Afterward, samples were treated with 50 μg/ml RNase A for 2 h followed by a phenol/chloroform extraction. The DNA was precipitated using 0.3 M final concentration of sodium acetate, pH 5.2, and isopropyl alcohol. The DNA pellet was then rinsed with 75% cold ethanol and resuspended in water. After being spun for 20 min in a microcentrifuge, samples were loaded onto a 1.8% agarose and Tris-boric acid-EDTA buffer gel containing ethidium bromide to allow electrophoretic separation of the fragmented DNA. The separated fragments were visualized on the agarose gel using an ultraviolet transluminator scanning, and profiles of oligonucleotides were taken using a digital camera (Bio Rad, Hercules, California, USA).
Determination of ROS and enzymatic and nonenzymatic antioxidants
The medium was removed by suction from the dishes, and the cells were washed three times at 1–2°C with Hanks’ balanced salt solution. Glycyl-glycine buffer (1200 μl) was added to each dish, and the cells were scraped loose with a rubber policeman and homogenized with the dish on ice by ultrasonication at 50 W for 5 s. The homogenates were kept frozen at −80°C until analyzed. LPO was measured by the method described by Devasagayam and Terachand. 18 The malondialdehyde (MDA) concentration of the sample is expressed in nanomoles of formed per minute per milligram protein. Hydrogen peroxide (H2O2) generation was assessed by spectrophotometric method. 19 The H2O2 concentration is expressed in micromoles per minute per milligram protein. Hydroxyl radical (OH*) production was quantified by the method of Puntarulo and Cederbaum 20 and expressed in micromoles per minute per milligram protein. Superoxide dismutase (SOD) was assayed by the method of Marklund and Marklund. 21 The enzyme activity is expressed in units per milligram protein. One enzyme unit corresponds to the amount of enzyme required to bring about 50% inhibition of pyrogallol auto-oxidation. Catalase activity was assayed by the method followed by Sinha. 22 Catalase activity is expressed in micromoles of H2O2 consumed per minute per milligram protein. Glutathione peroxidase (GPx) was assayed by the method described by Rotruck et al. 23 GPx activity is expressed in microgram of glutathione (GSH) utilized per minute per milligram protein. Reduced GSH was determined by the method described by Moron et al. 24 The amount of GSH is expressed in microgram per milligram protein. Vitamin C was estimated by the method followed by Omaye et al. 25 Vitamin C level is expressed in milligram per 5 × 10⁵ cells. Vitamin E was estimated by the methoddescribed by Quaife and Dju 26 and expressed in milligram per 5 × 10⁵ cells.
Nitrite determination using Griess reaction as an assay of NO production (iNOS activity)
Nitrite, a stable oxidation product of NO, was used as a measure of NOS activity. Nitrite present in the conditioned culture media was determined by a spectrophotometric method based on the Griess reaction. 27 For determination of nitrite concentration, 24-well plates were used, each well containing 1.5 × 10⁵ cells cultured in 0.5 ml DMEM free of phenol red. Then, 100 μl of the conditioned medium was incubated with the same volume of Griess reagent (0.1% N-(1-naphtyl)-ethylenediamine and 1% sulfanilamide in 5% orthophosphoric acid) at room temperature for 10 min. The absorbance at 540 nm was measured using a microplate reader, and the nitrite concentration was determined from a standard curve generated with dilutions of sodium nitrite in DMEM free of phenol red.
Insulin receptor assay
For insulin receptor assay, insulin was radioiodinated with [125I] by lactoperoxidase method, according to the procedure described by Thorell and Johansson. 28 Cell-surface insulin receptors were quantified following the method of Habberfield et al. 29 Briefly, the cells were exposed to different doses (0, 25, 50, and 100 μM) of DEHP using FBS-free DMEM for 24 h. After the exposure period, medium was aspirated, and the cells were incubated with saturating concentration of [125I]-insulin-containing medium in the presence or absence of unlabeled insulin at 4°C for 16 h to determine the total and nonspecific binding. After the incubation period, the medium was aspirated from all the wells, and the cells were washed twice with ice-cold fresh medium to remove any unbound radioactivity. The cells were then solubilized with 500 μl of ice-cold 1 N NaOH, pipetted out into radioimmuno assay vials and the radioactivity was counted in a gamma counter for 1 min. Specific binding of [125I]-insulin was calculated by subtracting nonspecific binding from the total cell-surface-bound radioactivity, and the results are expressed in femtomole per 5 × 10⁵ cells.
Reverse transcriptase-polymerase chain reaction
For reverse transcriptase (RT)-polymerase chain reaction (PCR), 5 × 10⁵ cells were seeded in 8 ×8 cm2 cell culture plate after differentiation and treatment protocol was followed. Total RNA was isolated from control and experimental samples, concentration and purity of RNA were determined spectrophotometrically at an absorbance of A260/280. The purity of RNA obtained was 1.8–1.9. The yield of RNA is expressed in microgram. Total RNA (2 μg) extracted from L6 myotubes of control and experimental samples were reverse transcribed in a reaction volume of 20 μl using 1 μM oligo dT primer, 0.5 μM deoxynucleotide triphosphates, 10 U ribonuclease inhibitor, and 4 U omniscript reverse transcriptase (Qiagen, Hilden, Germany). The reaction was carried out in an autorisierter (Eppendorf, Hamburg, Germany) thermocycler (37°C for 60 min). The resulting complementary DNAs were stored at −20°C until used for PCR. The rat-specific primer sequences used in this study for RT-PCR are listed in Table 1. Each RT-PCR products (10 μl) was analyzed by gel electrophoresis on a 2% agarose gel. The molecular size of the amplified products (GLUT4, insulin receptor (IR), and β-actin) was determined by comparison with molecular weight marker (100 bp DNA ladder) run in parallel with RT-PCR products. Then, the gels were subjected to densitometric scanning (Bio Rad, Hercules, California, USA) to find out the optical density units of each band and then normalized against that of internal control (β-actin).
List of primer sequences used in the study.
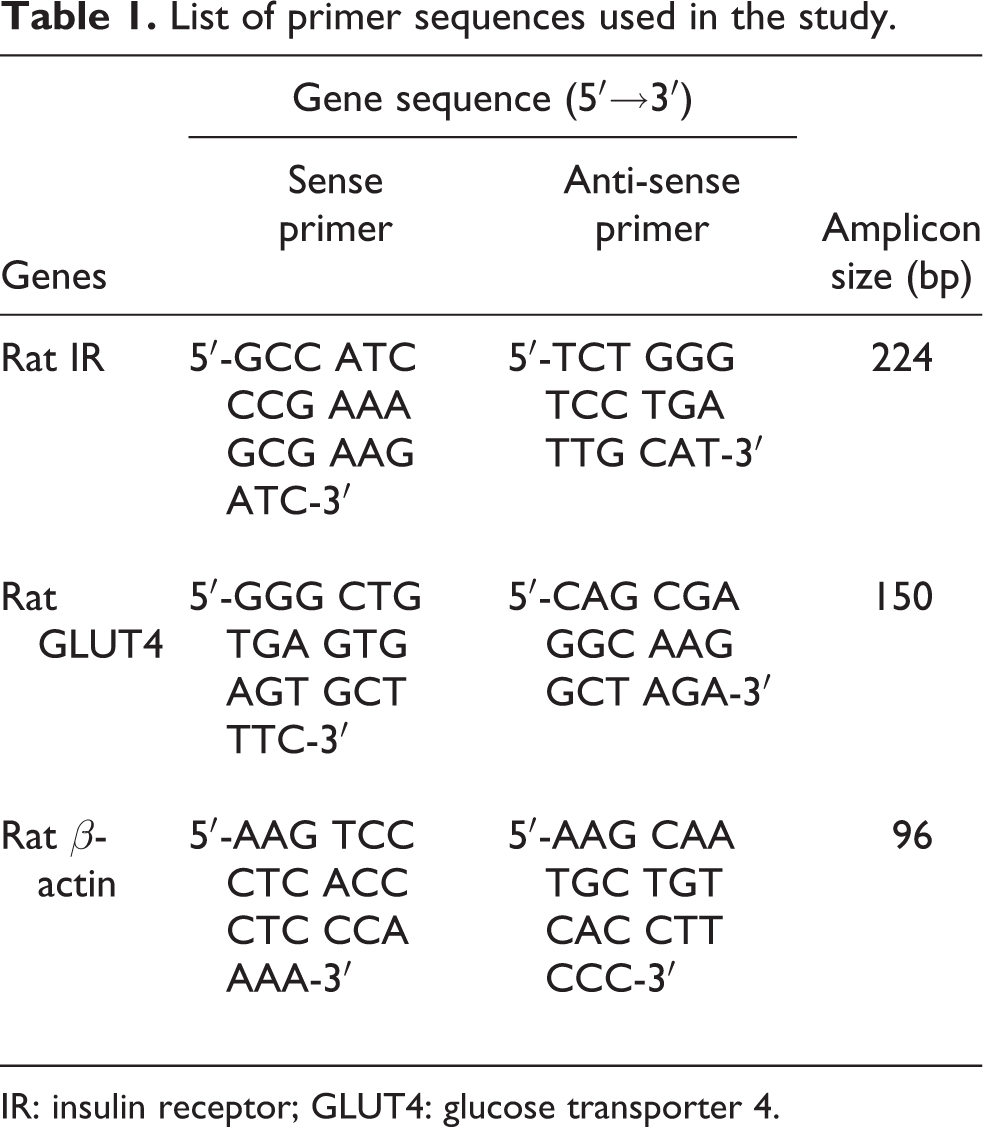
IR: insulin receptor; GLUT4: glucose transporter 4.
Myotubes subcellular fractionation
Treated cells were washed with ice-cold PBS and scraped in homogenization buffer containing 20 mM Tris-HCl (pH 7.4), 2 mm ethylene glycol tetraacetic acid, 2 mM EDTA, 1 mm phenylmethylsulfonyl fluoride, 10 mM β-mercaptoethanol, 10 μg/ml aprotinin, and 10 μg/ml leupeptin. After 10 min of incubation, cells were homogenized with 30 strokes of a Dounce homogenizer using a tight fitting pestle. Nuclei were collected by centrifugation at 500g for 5 min, and the low-speed supernatant was centrifuged at 100,000g for 30 min. The high-speed supernatant constituted the cytosolic fraction. The pellet was washed three times and extracted in ice-cold homogenization buffer containing 1% Triton X-100 for 60 min. The Triton-soluble component (plasma membrane fraction) was separated from the Triton-insoluble material (cytoskeletal fraction) by centrifugation at 100,000g for 15 min. 30 Plasma membrane and cytosolic fractions were kept at −80°C before protein quantification and Western blotting.
Western blot analysis
Cell lysates were separated via SDS-polyacrylamide gel electrophoresis and the separated proteins were blotted onto polyvinylidene fluoride (PVDF) membranes, which were subsequently blocked using Tris-buffered saline (TBS) containing 0.1% (v/v) Tween 20 (TBS-T) and 5% (w/v) milk. Membranes were probed with anti-β-actin/anti-GLUT4/anti-IRβ primary antibody and were diluted 1:1000 in TBS-T. The membranes were washed three times in TBS, TBS-T for 15 min prior to incubation with horseradish peroxidase (HRP)—conjugated mouse/rabbit secondary antibody—which was diluted 1:7500 with TBS-T as deemed appropriate. Protein bands on PVDF were visualized using enhanced-chemiluminescence detection kit.
Determination of 14C-2-deoxy glucose uptake
Briefly, the rat L6 myotubes were exposed to different doses (0, 25, 50, and 100μM) of DEHP using FBS-free DMEM for 24 h. After the exposure period, medium was aspirated and L6 myotubes were washed with DMEM supplemented with 0.5% bovine serum albumin. After washing, insulin (100 nM) was added to the serum-free medium and further incubated for 30 min. The above procedure was carried out without insulin also. Myotubes were washed with HEPES-buffered saline (HBS; 140 nM NaCl, 20 mM N-(2-Hydroxyethyl)piperazine-N'-(2-ethanesulfonic acid) (HEPES) pH 7.4, 5.0 mM potassium chloride (KCl), 2.5 nM magnesium sulfate, and 1.0 mM calcium chloride) and deoxy glucose uptake was measured as described by Blair et al. 31 Briefly, after insulin stimulation, myotubes were incubated with 14C-2-deoxy glucose (0.5 mCi/ml) in HBS for 10 min at 37°C. Radioactive medium was aspirated rapidly, and the cells were washed four times with ice-cold isotonic saline (0.9% NaCl). The cells were lysed in 0.05 M NaOH, and transferred to vials with scintillation cocktail. The radioactivity was determined by liquid scintillation counting. Nonspecific glucose uptake was determined in the presence of cytochalasin-B (50 mM), an inhibitor of facilitative glucose transport and was subtracted from total uptake. Results are expressed in counts per minute of 14C-2-deoxy glucose uptake per 5 × 10⁵ cells.
Determination of 14C-glucose oxidation
14C-glucose oxidation was estimated as per the method followed by Kraft and Johnson. 32 The treatment protocol was as mentioned above for deoxy glucose uptake (with/without 100 nM insulin). Briefly, 20 μl of cell suspension containing 5 × 10⁵ cells were pipetted and placed in a 2-ml ampule containing 170 μl DMEM (pH 7.4), 10 IU penicillin in 10 μl of DMEM and 0.5 μCi of 14C-glucose. After aeration with gas mixture (5% CO2 and 95% air) for 30 s, the ampule was tightly closed with a rubber cork containing CO2 trap and incubated at 37°C. The CO2 traps were replaced every 2 h. Upon removal of the second trap, 0.01 ml of 1 N sulfuric acid was added to the ampule to halt further metabolism. The system was again closed for 1 h before the third and final trap was removed and all the CO2 traps were placed in the scintillation vials containing 10 ml of scintillation fluid, and the samples were counted in a beta counter for 1 min. Results are expressed in counts per minute of 14CO2 released per 5 × 10⁵ cells.
Estimation of glycogen
The medium was removed from the dishes by suction (5 × 10⁵ cells), and 1000 μl of 0.4 N potassium hydroxide was added to each dish. After 5 min at room temperature, aliquots of the homogenates were stored frozen at −20°C until analyzed.
GFAT assay by glutamate dehydrogenase method
For GFAT assay, 34 5 × 10⁵ cells were seeded in 8 cm2 cell culture plate after differentiation and treatment protocol was followed. The myotubes were washed twice with ice-cold PBS and scraped with 180 μl ice-cold GFAT buffer. Then, the cells were sonicated. The samples were centrifuged at 5000g for 5 min, and the supernatants were centrifuged again at 60,000g for 30 min. All these procedures were carried out at 4°C. The supernatants were collected, and the protein concentrations were determined. In the typical assay, the total volume was 200 μl, and the reaction was held in 96-well plates. The reaction system included 100 μl reactive buffer (containing 0.8 mM fructose-6-phosphate; 6.0 mM glutamine; 0.3 mM acetylpyridine adenine dinucleotide (APAD); 50 mM KCl,; 0.1 mM monopotassium phosphate; and 6 U with pH 7.8 glutamate dehydrogenase,) and 100 μl GFAT buffer (containing 50 mM Tris; 5 mM EDTA; 5 mM GSH; 5 mM glucose-6-phophate disodium salt; 50 mM with pH 7.8 KCl). The plates were shaken at 37°C for 90 min; the changes in absorbance caused by reduction of APAD were measured at 370 nm by microplate spectrometers. The absorbance values of the reaction mixtures without F-6-P were considered as “blank values”. A unit of the enzyme activity is defined as one nanomole of glutamate formed per milligram protein per minute at 37°C.
Statistical analysis
Experiments were repeated three times, each time in triplicate. Values are expressed as mean ± SE. One-way analysis of variance followed by Turkey’s test was used to determine significant differences between groups. The values of p < 0.05 were considered as statistically significant.
Results
DEHP inhibits cell growth in L6 myotubes
The effect of DEHP on cell viability in a time- and dose-dependent manner was determined using MTT assay (Figure 1(a)). Percentage of cell viability was significantly decreased with increase in concentration of DEHP. In L6 myotubes, 50% inhibition was found at 200 μM at 24 h, and hence for further analyses 24 h was considered for treatment and also 25, 50, and 100 μM were considered to identify the effect of DEHP on the parameters studied. Morphological examinations of the L6 myotubes were observed and photographed using phase contrast microscope. The morphology of L6 myotubes treated with DEHP (25, 50, 100, 200, 400, and 800 µM) for 24 h compared to untreated cells and cells treated with 0.01% DMSO showed characteristic of apoptotic cells, such as cell shrinkage and reduced cell density (Figure 1(b)). Cells undergoing apoptosis also displayed other types of morphological changes such as rounded up cells that shrink and lose contact with neighboring cells. Some sensitive cells were even detached from the surface of plates.

Cytotoxicity of DEHP in L6 myotubes. Viability of the cells was assessed by MTT method (a) and morphology of the cells was analyzed using phase contrast microscope (×10 magnification; (b)). Each value represents the mean ± SEM of three experiments. *p < 0.05: compared with their respective control. DEHP: di(2-ethylhexyl)phthalate; MTT: 3-(4,5-dimethylthiazol-2-yl)-2,5-diphenyltetrazolium bromide.
Cytotoxic effects of DEHP
To evaluate cell membrane permeability and integrity, LDH activity was assayed. As shown in Figure 2(a), groups exposed to DEHP alone presented a significant increase in LDH release when compared with the control. As shown in Figure 2(b), apoptosis-inducible ability of DEHP was confirmed by DNA fragmentation in L6 myotubes. At lower doses (25 and 50 μM) of DEHP exposure, intact DNA was observed, whereas fragments of DNA were seen at higher dose (100 μM) of DEHP. The fragments of DNA have interval molecular weight of approximately180 bp suggesting an apoptotic event.

Dose-dependent effects of DEHP on cytotoxic (a) and DNA fragmentation (b) of L6 myotubes. Cytotoxic effect was assessed by LDH leakage method in conditioned media. Apoptosis was evaluated by assessing the presence of DNA laddering by gel electrophoresis. Each bar represents mean ± SEM of three experiments. p < 0.05: (a′) compared with control; (b′) compared with 25 μM; and (c′) compared with 50 μM. M: Marker; C: Control; DEHP: di(2-ethylhexyl)phthalate; LDH: lactate dehydrogenase.
DEHP increases in thiobarbituric acid reactive substance, OH*, H2O2, and NO levels in L6 myotubes
Oxidative stress plays a major role in the development of insulin resistance. LPO, OH*, H2O2, and nitrite status in the L6 myotubes are shown in Figure 3(a) to (d). Due to DEHP treatment, a significant increase in thiobarbituric acid reactive substance (irrespective of inducers such as H2O2, ascorbic acid, and ferrous sulfate) was seen in 50 and 100 μM doses (Figure 3(a)). A dose-dependent increase was observed in OH* and H2O2 levels in DEHP-treated L6 myotubes (Figure 3(b) and (c)). Nitrite present in the conditioned culture media was determined by a spectrophotometric method (Figure 3(d)). Dose-dependent significant increase in nitrite level was seen at 50 and 100 μM DEHP doses, whereas 25 μM dose had no effect on nitrite level.

Dose-dependent effects of DEHP on LPO(a), H2O2 (b), hydroxyl radical (c), and NO level (d) in L6 myotubes. LPO, H2O2, hydroxyl radical, and NO levels were assessed by spectrophotometric method. Each bar represents mean ± SEM of three observations. Significance at p < 0.05: (a′) compared with control; (b′) compared with 25 μM; (c′) compared with 50 μM. LPO: lipid peroxidation; DEHP: di(2-ethylhexyl)phthalate; H2O2: hydrogen peroxide; NO: nitric oxide; SEM: standard error mean.
DEHP suppresses activities of enzymatic antioxidants
Three groups of enzymes play significant roles in protecting cells from oxidant stress; SODs, catalase, and GPx. In the present study, the enzymatic antioxidants registered significant a dose-dependent decrease in DEHP-treated L6 myotubes (Figure 4).

Dose-dependent effects of DEHP on enzymatic antioxidants in L6 myotubes. SOD, catalase and GPx levels were assessed by spectrophotometric method. Each bar represents mean ± SEM of three observations. p < 0.05: (a′) compared with control; (b′) compared with 25 μM; and (c′)compared with 50 μM. DEHP: di(2-ethylhexyl)phthalate; SOD: superoxide dismutase; GPx: glutathione peroxidase; SEM: standard error mean.
DEHP reduces the level of nonenzymatic antioxidants
Nonenzymatic antioxidants of particular importance are GSH and vitamin C and E. DEHP treatment significantly decreased the GSH level at 50 and 100 μM doses, but it had no effect at 25 μM dose compared with the control. Vitamin C and E showed a significant decline in a dose-dependent manner (Figure 5).

Dose-dependent effects of DEHP on nonenzymatic antioxidants in L6 myotubes. GSH, vitamin C, and vitamin E levels were assessed by spectrophotometric method. Each bar represents mean ± SEM of three observations. p < 0.05: (a′) compared with control; (b′) compared with 25 μM; and (c′)compared with 50 μM. DEHP: di(2-ethylhexyl)phthalate; GSH: glutathione.
Effect of DEHP on IR and GLUT4 gene expression and IR concentration
IR and its downstream molecules play a vital role in insulin signal transduction in L6 myotubes. L6 myotubes exposed to DEHP showed a decline in IR concentration in a dose-dependent manner (Figure 6(a)). IR messenger RNA (mRNA; Figure 6(b)) registered a significant decrease at 25 and 100 μM doses of DEHP treatment, whereas no change was found at 50 μM dose compared with the control group. Plasma membrane IR protein in L6 myotubes was reduced significantly upon DEHP treatment (Figure 6(c)).

Effects of DEHP on insulin receptor concentration (a), insulin receptor mRNA (b), and insulin receptor protein (c) in L6 myotubes. The mRNA expression was analyzed by isolating total RNA using TRIR and converting into cDNA using RT-PCR, identified on AGE and quantified by densitometric scanning. IR protein was analyzed using Western blot. Total protein concentration was determined prior to Western blot analysis. Each bar represents the mean ± SEM of three observations. p < 0.05: (a′) compared with control; (b′) compared with 25 μM; and (c′)compared with 50 μM. DEHP: di(2-ethylhexyl)phthalate; TRIR: total RNA isolation reagent; cDNA: complementary DNA; RT-PCR: reverse transcriptase polymerase chain reaction; AGE: agarose gel electrophoresis; IR: insulin receptor; mRNA: messenger RNA; SEM: standard error mean.
Among the isoforms of glucose transporter proteins, GLUT4 is the one which is insulin sensitive /insulin responsive transporter. The dose-dependent effect of DEHP on GLUT4 mRNA in L6 myotubes is represented in Figure 7(a). DEHP treatment (50 and 100 μM dose) significantly decreased the GLUT4 mRNA but 25 μM dose of DEHP did not have any effect on GLUT4 mRNA. Figure 7(b) and (c) depicts the effect of DEHP on GLUT4 protein in the cytosolic and plasma membrane fractions in L6 myotubes. DEHP treatment caused a significant decrease in cytosolic and plasma membrane GLUT4 concentration in a dose-reliant manner compared with the coeval control.
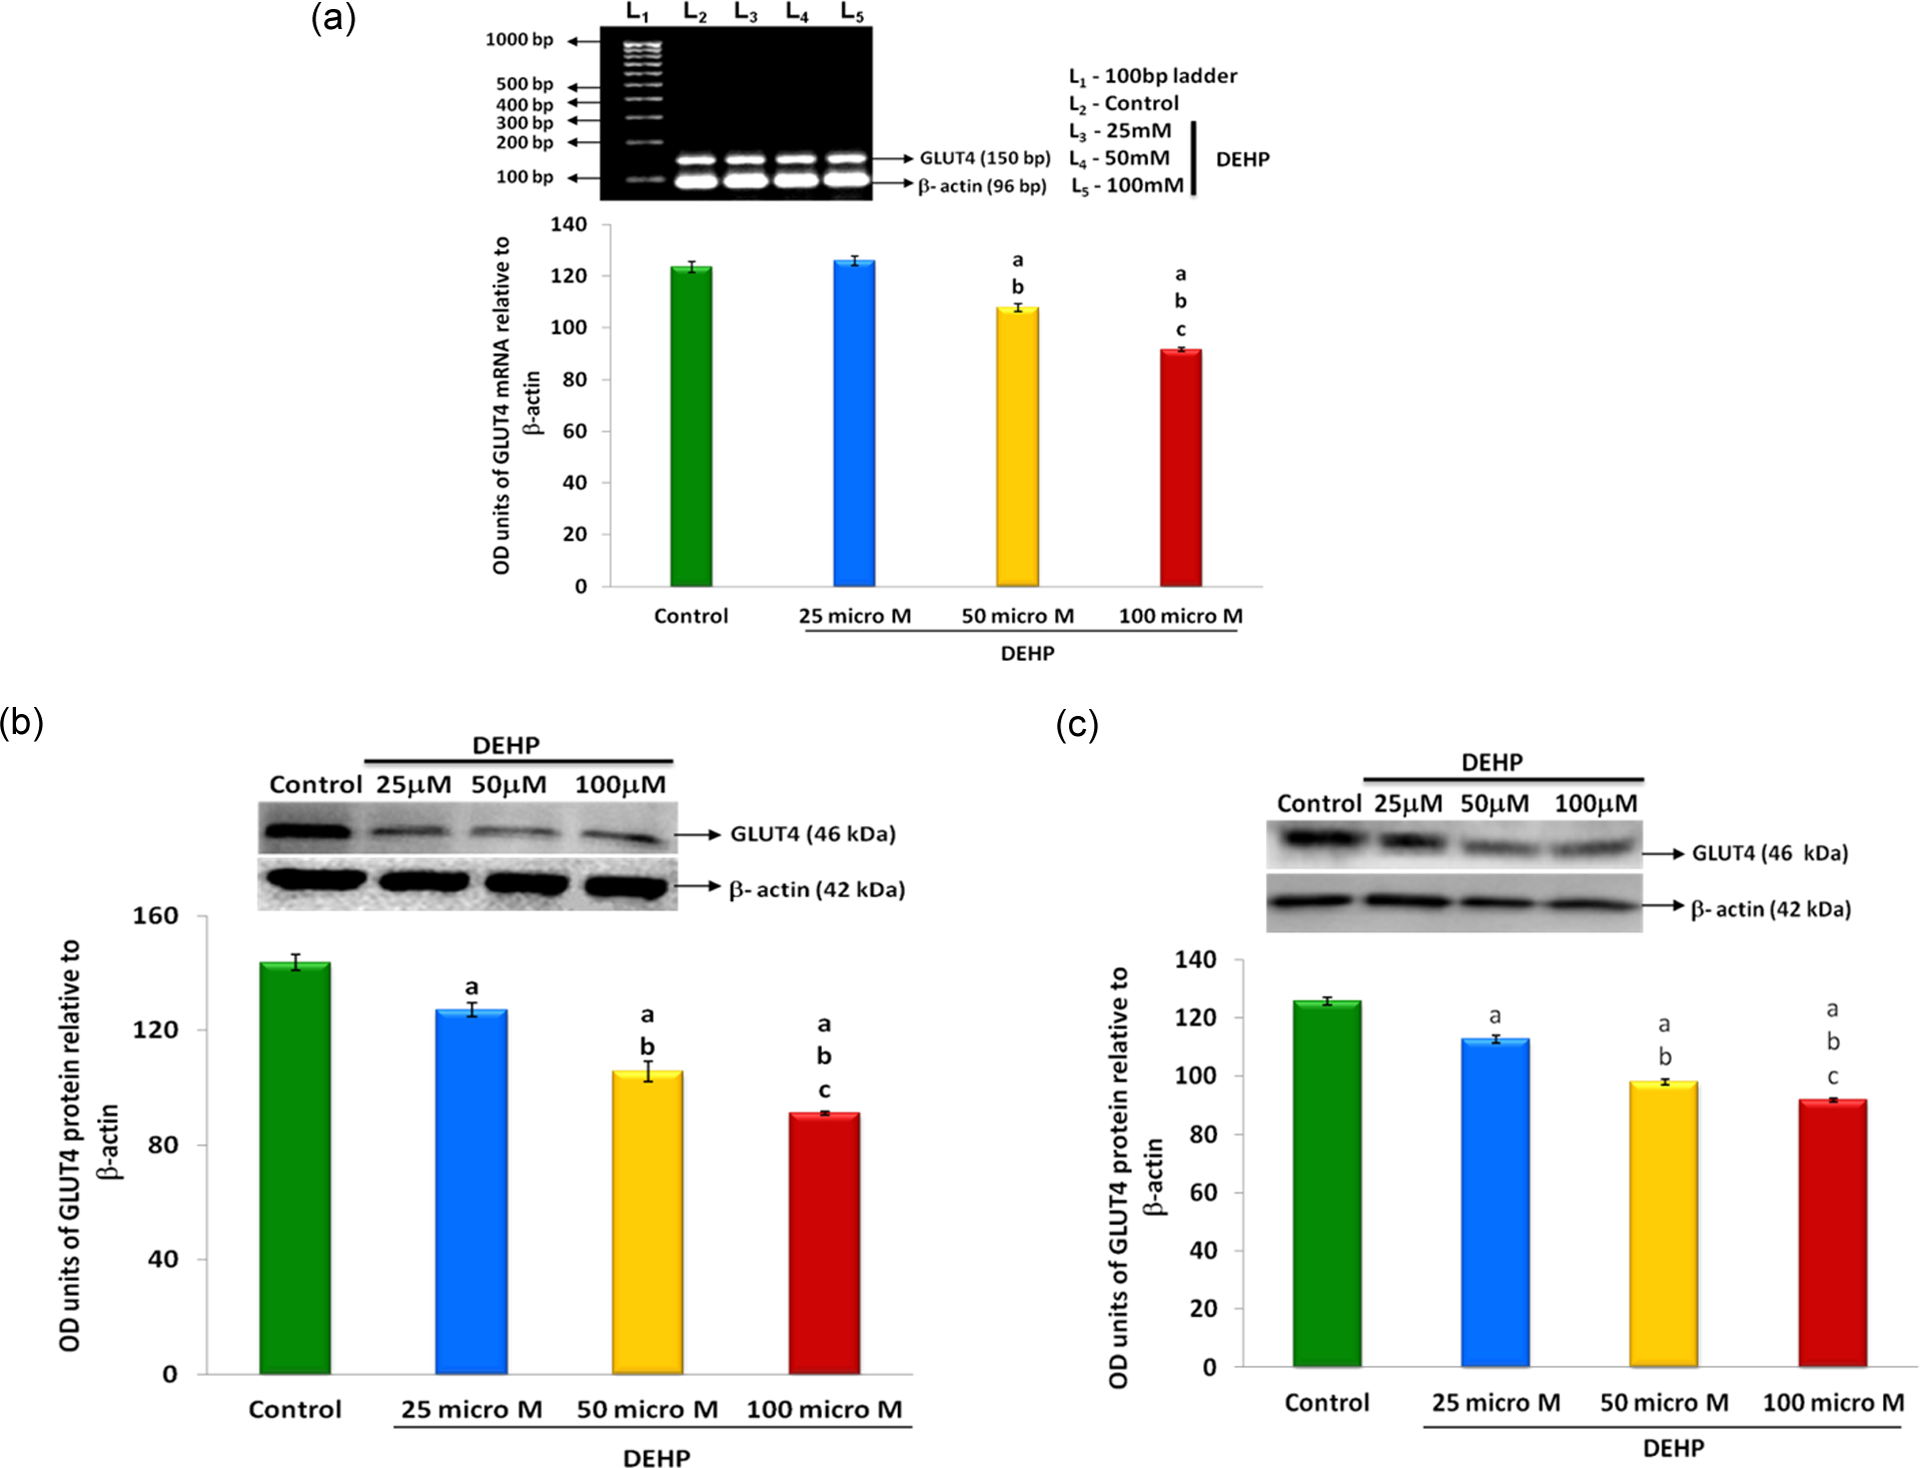
Effects of DEHP on GLUT4 mRNA (a), GLUT4 protein cytosol (b), and GLUT4 protein plasma membrane (c) in L6 myotubes. The mRNA expression was analyzed by isolating total RNA using TRIR and converting into cDNA using RT-PCR, identified on AGE and quantified by densitometric scanning. GLUT4 protein was analyzed using Western blot. Total protein concentration was determined prior to Western blot analysis. Each bar represents the mean ± SEM of three observations. p < 0.05: (a′) compared with control; (b′) compared with 25 μM; and (c′)compared with 50 μM. DEHP: di(2-ethylhexyl)phthalate; TRIR: total RNA isolation reagent; cDNA: complementary DNA; RT-PCR: reverse transcriptase polymerase chain reaction; AGE: agarose gel electrophoresis; GLUT4: glucose transporter 4; SEM: standard error mean.
Glucose uptake, oxidation, glycogen concentration, and GFAT
Figure 8(a) and (b) represent the dose-dependent effect of DEHP on 14C-2-deoxyglucose uptake and 14C-glucose oxidation in L6 myotubes. Also, 25 μM DEHP treatment caused a significant decrease in glucose uptake and oxidation in L6 myotubes, and it was further decreased in 50 and 100 μM DEHP-treated groups. Further, preincubation with 100 nM insulin significantly increased the glucose uptake and oxidation follows the same trend of basal uptake and oxidation.

Effects of DEHP on glucose uptake (a), glucose oxidation (b), glycogen concentration (c), and GFAT (d) in L6 myotubes. Glucose uptake in L6 myotubes was estimated by the 14C-2-deoxy glucose uptake assay. Glucose oxidation was assessed using 14C-glucose. Glycogen was estimated by anthrone reagent method. GFAT activity was assessed by spectrophotometric method. Each bar represents mean ± SEM of three observations. p < 0.05: (a′) compared with control; (b′) compared with 25 μM; and (c′)compared with 50 μM. DEHP: di(2-ethylhexyl)phthalate; GFAT: glutamine fructose-6-phosphate amidotransferase; SEM: standard error mean.
DEHP treatment caused a significant decrease in glycogen level at 25 and 50 μM doses, and it was further diminished at 100 μM dose in L6 myotubes (Figure 8(c)). Figure 8(d) shows the dose-dependent effect of DEHP on cellular GFAT activity in L6 myotubes. Significant dose-dependent increase in GFAT activity was observed.
Discussion
Insulin resistance condition is associated with the development of several syndromes, such as obesity, type 2 diabetes mellitus, and metabolic syndrome. It can be defined as a failure of target tissues to increase whole body glucose disposal in response to insulin. The tissues responsible, especially skeletal muscle and fat, exhibit reduced insulin-stimulated glucose uptake and metabolism. The insulin resistance seen in myotubes/muscle is of particular importance because this is the major site of insulin-stimulated glucose uptake. 35 Although factors linking insulin resistance to these syndromes are not precisely defined yet, evidence suggests that the exposure to certain environmental endocrine disruptors like phthalate and bisphenol-A plays an important role in the development of insulin resistance. 36
The present study was undertaken to examine the effects of DEHP on insulin signaling in L6 myotubes. Initially, we assessed cytotoxic effect of DEHP in cultured L6 myotubes. When the differentiated myotubes were treated with DEHP for 24, 48, and 72 h, induction of cytotoxicity were observed in a concentration-dependent manner. However, DEHP elicited a toxic effect at higher concentration above 200 mM and increased time points such as 48 and 72 h. The half maximal inhibitory concentration values of DEHP for cytotoxicity (measured by MTT and LDH leakage assay) was 200 μM DEHP at 24 h time point in L6 myotubes. So, further experiments were carried out at the doses of 25, 50, and 100 μM DEHP for 24 h period. At this juncture, it is worth to recall the other reports shown that phthalates have the capacity to induce cytotoxity in vitro. 37 –40
Previous evidence suggested that phthalate induces free radical production in vivo by activating NADPH oxidase complex that generates superoxide anion. Superoxide anion is rapidly transformed to H2O2 and then to hydroxyl radical. 41 An increased production of H2O2 would lead to formation of highly ROS. ROS production is shown to totally dependent on DEHP-induced calcium (Ca2+) ion influx, plausibly through the Ca2+-mediated activation of NADPH complex. 42 Similarly, in the present study also there is an increase in the lipid peroxidation, OH*, H2O2, and NO levels in DEHP-treated L6 myotubes suggesting that it may inhibit the cell survival.
Further, intracellular LDH leakage, a well-known indicator of cell membrane integrity and cell viability was increased in the conditioned media in a proportionate manner with DEHP doses. In this context, it has been shown that DEHP induces DNA fragmentation, which is a key feature of apoptosis, a type of programmed cell death. Apoptosis is characterized by the activation of endogenous endonucleases with subsequent cleavage of chromatin DNA into internucleosomal fragments of roughly 180 bp. 43
A major characteristic of type-2 diabetes mellitus (T2DM) is insulin resistance in skeletal muscle. A growing body of evidence indicates that oxidative stress that results from increased production of ROS and/or reactive nitrogen species leads to insulin resistance, tissue damage, and other complications observed in T2DM. 44 –46 The balance between oxidation and antioxidation (redox balance) is critical in maintaining a healthy biological system. 47 In cellular redox state, the double-edged effect does not only concern ROS but also antioxidants. Cells have an elaborate defense system against ROS, consisting of antioxidant enzymes and low-molecular weight substances capable of scavenging many different ROS. 48 In this system, SOD convert superoxide radical (O2•) into H2O2, whereas GPx and catalase convert H2O2 into water. 49 Therefore, two toxic species, O2• and H2O2, are converted into the harmless product water. The removal of H2O2 or other hydroperoxides by GPx requires reduced GSH as cofactor. Antioxidants scavenge ROS before they cause damage to the various biological molecules, or prevent oxidative damage from spreading, for example, by interrupting the radical chain reaction of LPO. In the current investigation, enzymatic and nonenzymatic antioxidants were declined suggesting that this effect of DEHP might be exerted through oxidative stress.
Increased oxidative stress has been suggested to play a role in many pathophysiological conditions. Altered transcriptional regulation of various genes, postulated to be mediated by transcriptional activation factors such as activator protein 1 and nuclear factor-κB, is a well-described cellular reaction to oxidative stress. 50 –52 IR is the master switch of the signaling pathway of insulin and therefore, the effect of DEHP was assessed at the level of IR gene expression and its concentration. DEHP alters the IR mRNA as well as IR protein levels and insulin binding, which may be the result of defective IR gene transcription and translation of mRNA. In this regard, it is worth to recall our previous article which reported that DEHP reduces IRs and glucose oxidation in cultured Chang liver cells. 53 Glucose transport is a rate-limiting step in the metabolism of many cell types and therefore in energy production. 54 This process is mediated by a family of transmembrane glycoproteins differing in their kinetics and tissue distribution. 55 Among the 13 known glucose transporters, GLUT4 is the insulin-sensitive glucose transporter. Its gene expression is regulated in different insulin sensitive cell types by various stimuli. In the current investigation, GLUT4 mRNA level was significantly reduced due to DEHP exposure. It has been reported that peroxisome proliferator-activated receptor-γ(PPARγ) represses transcriptional activity of the GLUT4 promoter via direct and specific binding of the (PPARγ) /retinoid X receptor, heterodimer to a −66/+163 bp of GLUT4-promoter region. 56 DEHP and its metabolites, particularly MEHP induces PPARγ in a time- and dose-dependent manner in HRP 1 trophoblast cells. 57 Probably, the reduction in GLUT4 mRNA may be the result of impaired GLUT4 gene transcriptional activity mediated through enhanced PPARγ due to DEHP exposure. Cytosolic and plasma membrane GLUT4 protein level was significantly decreased in a dose-dependent manner in DEHP-exposed L6 myotubes. The reduced membrane GLUT4 may partly be due to impaired GLUT4 translocation from cytosol to plasma membrane. It was shown that GLUT4 is a membrane-bound protein, which is likely to get affected once the membrane integrity is lost. 58
Additionally, we investigated the functional aspect of GLUT4 such as glucose uptake and oxidation by the L6 myotubes which shows reduced glucose uptake and oxidation even after insulin stimulated condition. In the present study, DEHP reduces the capacity of insulin to elicit an increase in glucose uptake and metabolism in myotubes, which is clearly evident from the decreased membrane-bound GLUT4 reflecting a hallmark of insulin resistance. Glycogen concentration in the myotubes was decreased due to DEHP treatment. In this respect, it is worth to recall the in vivo study that DEHP treatment reduced the hepatic glycogen concentration via enhanced glycogenolysis in male Wistar rats. 59 GFAT is the rate-limiting enzyme of the hexosamine biosynthetic pathway (HBP) pathway that catalyzes the amidation of F-6-P to glucosamine-6-phosphate in the presence of glutamine. 60 Overproduction of superoxide through the mitochondrial electron transport system is considered as a unifying mechanism responsible for aberrations in several biochemical pathways 61 of which the HBP is the key pathway where glucose flux through this pathway is considered as a form of nutrient sensing, and HBP is one of the mechanisms that mediate peripheral insulin resistance. In the current investigation, we found increased GFAT activity which may be attributed to the elevated ROS.
Conclusion
The most striking finding of the present study is that exposure to DEHP disrupts cell viability via oxidative stress and causes a dose-dependent decline in IR, glucose transporter 4, and antioxidant levels, resulting in decreased glucose uptake and oxidation. Taken together, our study supports the hypothesis that certain environmental chemicals such as DEHP can contribute to the development of diabetes/insulin resistance even at relatively low levels.
Footnotes
Conflict of interest
The authors declared no conflicts of interest.
Funding
The author RP was financially supported by a fellowship in the form of Junior Research Fellowship from the Department of Science and Technology, Government of India, New Delhi, India (Award letter no: DST/ INSPIRE Fellowship (119) /2010, dated 6 May 2010)also from the Department of Endocrinology by