
Abstract
Chromium picolinate (CrPic), which is used as a nutritional supplement and to treat type 2 diabetes, has gained much attention because of its cytotoxicity. This study evaluated the effects of CrPic on the viability of the chick embryo fibroblast (CEF) using 3-(4,5-dimethylthiazol-2-yl)-2,5-diphenyltetrazolium bromide assay, morphological detection, and flow cytometry. The results show that lower concentrations of CrPic (8 and 16 μM) did not damage CEF viability (p > 0.05). However, higher CrPic concentrations (400 and 600 μM) indicated a highly significant effect on the production of intracellular reactive oxygen species, alteration of mitochondrial membrane potential, intracellular calcium ion concentration, and the apoptosis rate (p < 0.01), contrary to lower CrPic concentrations (8 and 16 μM) and control group. Moreover, apoptotic morphological changes induced by these processes in CEF were confirmed using Hoechst 33258 staining. Cell death induced by higher concentrations of CrPic was caused by an apoptotic and a necrotic mechanism, whereas the main mechanism of oxidative stress-induced mitochondrial dysfunction was apoptotic death.
Introduction
In vitro studies, the safety of CrPic is not conclusive up to now, some positive and others negative. In mammalian cell culture systems, it is reported that CrPic not only had no genotoxicity, 1 no chromosome aberration or hypoxanthine-guanine phosphoribosyltransferase mutation in Chinese hamster ovary (CHO) cells, 1 no oxidative DNA damage in human lymphocytes, 2 and no reactive oxygen species (ROS) formation in human lung A 549 cells 3 but also exhibited protective antioxidant effects when keratinocytes are exposed to hydrogen peroxide-induced oxidative stress at 120 μM 4 and inhibited lipid peroxidation on piglet hepatocytes at 8 μM. 5 In contrast, DNA fragmentation was found in macrophage, 6 and an increase in DNA damage appeared 2 and ultrastructural damage was created in CHO cells 7 after CrPic treatments. It also found that the CHO cells that were mutagenic, treated by CrPic with concentrations from 0.75 mM to 3.0 mM (in the absence of S9 activation), increased the amount of mutant cells because of a specific gene mutation. 8 Jana et al. found that CrPic was cytotoxic to lymphocytes and induced apoptosis by ROS and mitochondrial events, 9 and the ROS led to loss of mitochondrial membrane potential (MMP) in the apoptotic process. 2
Results from in vivo studies were also contrasting, in animal husbandry, CrPic can increase carcass quality and the leanness of pork 10 as well as enhancing antistress, forage transformation efficiency, 11 and productivity. 12 Although elevations in cellular 8-hydroxy-2′-deoxyguanosine levels were observed due to lipid peroxidation and oxidative DNA damage in Cr-fed animals, supplemental CrPic reported no DNA damage 13 and chromosomal damage. 14 –17
Specific data on the minimum requirements and the maximum tolerance dose on human and animals remain to be published. Thus, determining the safety dosage of the CrPic requires further studies. Investigations on the toxicity test of CrPic in vitro primarily concentrate on humans and mice, so whether damage effects that occur in poultry is not included in relevant reports. 18 The current study focuses on determining whether different concentrations of CrPic treatment can lead to the oxidative damage and the dose–effect relationship of CrPic treatment with cell apoptosis.
Materials and methods
Chemicals
CrPic (CAS no 14639-25-9) was purchased from Aladdin Reagent Database Inc. (Shanghai, China). Neonatal bovine serum (NCF) was purchased from Sijiqing Biological Engineering Material (Hangzhou, China). Penicillin–streptomycin, Dulbecco’s modified Eagle’s medium (DMEM), and trypsin were purchased from Sigma-Aldrich (St Louis, Missouri, USA). Hoechst 33258, ROS assay kit, cell buffer for Western blotting and immunoprecipitation, and annexin V-fluorescein isothiocyanate (FITC) apoptosis detection kit were purchased from Beyotime Institute of Biotechnology (Jiangsu, China).
Isolation and culture of CEF
In the present study, specific pathogen-free chicken embryos approximately 9–11 days old were chosen to culture the chick embryo fibroblast (CEF). 19 The densities of cells were regulated to 5 × 10⁵ mL−1 with the media and then cultured in an incubator (5% carbon dioxide and 37°C). Then, the cells were passaged when the monolayer grew to approximately 85–90%. The cells were cultured with trypsin enzyme digesting technique and passaged. The density of the cells was regulated to 2 × 10⁵ mL−1, 100 µL per well for 96-well plates, and continued to incubate.
CrPic treatment
CrPic was dissolved in DMEM/medium-containing 2% NCF and sterilized by passaging through a 0.2-μm filter. When the cells grew to approximately 85–90% again, the fluid was removed, and another medium treated with different concentrations of CrPic for another 100 μL was used. The final concentrations of CrPic were 8, 16, 160, 400, and 600 μM. All experiments were prepared in triplicate.
Cell survival assessment
Cell viability was assessed using 3-(4,5-dimethylthiazol-2-yl)-2,5-diphenyltetrazolium bromide (MTT) assay. 20 Cells (2 × 10⁵ mL−1) were seeded in 96-well plates, 100 μL per well, and exposed with different CrPic concentrations for 24, 48, and 72 h. The absorbance of formazan, which was produced in the cleavage of MTT by dehydrogenases in living cells at 570 nm, was linearly proportional to the number of the living cells. 21 At the destined time points, 15 µL of MTT solution was added into the 96-well plates and incubated for 4 h (at 37°C). The medium was then removed, and 150 μL dimethyl sulfoxide was added per well to dissolve formazan. 22 The 96-well culture plates were agitated on a shaker for 10 min and then evaluated by microplate reader at 570 nm to obtain the optical density value. Assays were performed in triplicate. The percentage of viable cells was calculated with reference to control.
Cell morphology
Treated cells stained with Hoechst 33258 stain were viewed using a fluorescence microscope. 23 The cells (2 × 10⁵ mL−1) were seeded in six-well plates, incubated with different CrPic concentrations (8, 16, 160, 400, and 600 μM) for 48 h, then the medium was removed, washed twice using phosphate-buffered saline (PBS), and fixed with 4% paraformaldehyde for 15 min lucifugal at room temperature. The cells were washed thrice by PBS, immediately stained with 5 μg mL−1 Hoechst 33258 stain, and incubated for another 15 min lucifugal at room temperature. After washing thrice, the cells were observed under an inverted fluorescence microscope (TE-2000-S, NIKON, Japan) with an excitation wavelength (Ex) of 352 nm.
Flow cytometry with ROS assay
Intracellular ROS was measured using an oxidation-sensitive fluorescent probe called 2′,7′-dichlorfluorescein–diacetate (DCFH-DA). 24 Cells (2 × 10⁵mL−1) were seeded in six-well plates, incubated for 48 h with different CrPic concentrations (8, 16, 160, 400, and 600 μM), tested, and compared with untreated controls. The mean fluorescence intensity was tested using a fluorescence-activated cell sorter (FACS) Calibur flow cytometer (Becton Dickinson, Franklin Lakes, New Jersey, USA) at an Ex of 485 nm and an emission wavelength (Em) of 530 nm.
Flow cytometry with annexin V-FITC/PI staining
Annexin V-FITC/propidium iodide (PI) double staining assay was performed following the manufacturer’s instructions (Ex: 488 nm and Em: 536 nm). Briefly, 2 × 10⁵ mL−1 cells were seeded in six-well plates, and cells were harvested 48 h after different doses of CrPic treatment. The data were analyzed using quadrant statistics. Cells per quadrant were identified as follows: lower left quadrant (Q3), living cells; lower right quadrant (Q4), necrotic cells; upper left quadrant (Q1), early apoptotic cells; and upper right quadrant (Q2), late apoptotic cells.
Measurement of MMP (ΔΨ)
The changes in the MMP were tested using the fluorescent cationic dye rhodamine 123 (Rh123). 25 The cells (2 × 10⁵ mL−1) were seeded in six-well plates and harvested 48 h after different doses of CrPic treatment. The cells treated with Rh123 were collected. 26 The cells were measured immediately by FACS Calibur flow cytometer with the setting fluorescence (Ex: 488 nm and Em: 536 nm).
Measurement of [Ca2+]i
Changes in the intracellular calcium ion ([Ca2+]i) concentration were tested using the fluorescent dye fluo-3/acetoxymethyl-specific binding to Ca2+ion. 27 The cells were treated as mentioned above, collected, and stained following the manufacturer’s instructions. The fluorescence (Ex: 488 nm and Em: 530 nm) of the cells was measured immediately by FACS Calibur flow cytometer.
Statistical analysis
Values are expressed as the mean ± SD of at least three independent experiments. Statistical analysis was conducted by Statistical Package for the Social Sciences 17.0 software (SPSS Inc., Chicago, IL, USA). The value of p ≤ 0.05 was considered statistically significant.
Results
Cell viability
The viability of cells treated with different concentrations of CrPic was monitored by MTT assay. Low CrPic concentrations (8, 16, and 160 μM) apparently did not alter the viability of CEF compared with the control at three periods. CrPic doses of 400 μM (p < 0.05) and 600 μM (p < 0.01) exhibited significant difference from the control. In addition, no significant difference was observed in the cells treated with the same concentrations in different periods.
Assessment of cell morphology
The morphology of CEF as viewed through a fluorescence microscope is illustrated in Figure 1. CEF treated with different CrPic concentrations (8, 16, 160, 400, and 600 μM) for 48 h and stained with Hoechst 33258 stain indicated a variety of morphological features. Apoptosis with chromatin condensation and apoptotic body formation were observed. The nuclei of the control cells, as well as those treated with low CrPic concentrations (8, 16, and 160 μM), were round or oval and stained uniformly. These results suggest no evident abnormal changes in morphology (Figure 1(B) to (D)). However, the chromatin of the nuclei in higher CrPic concentrations (400 and 600 μM) indicated chromatin condensation and even fragmentation, crescentic nuclear, and apoptotic body formation (Figure 1(E) and (F)).
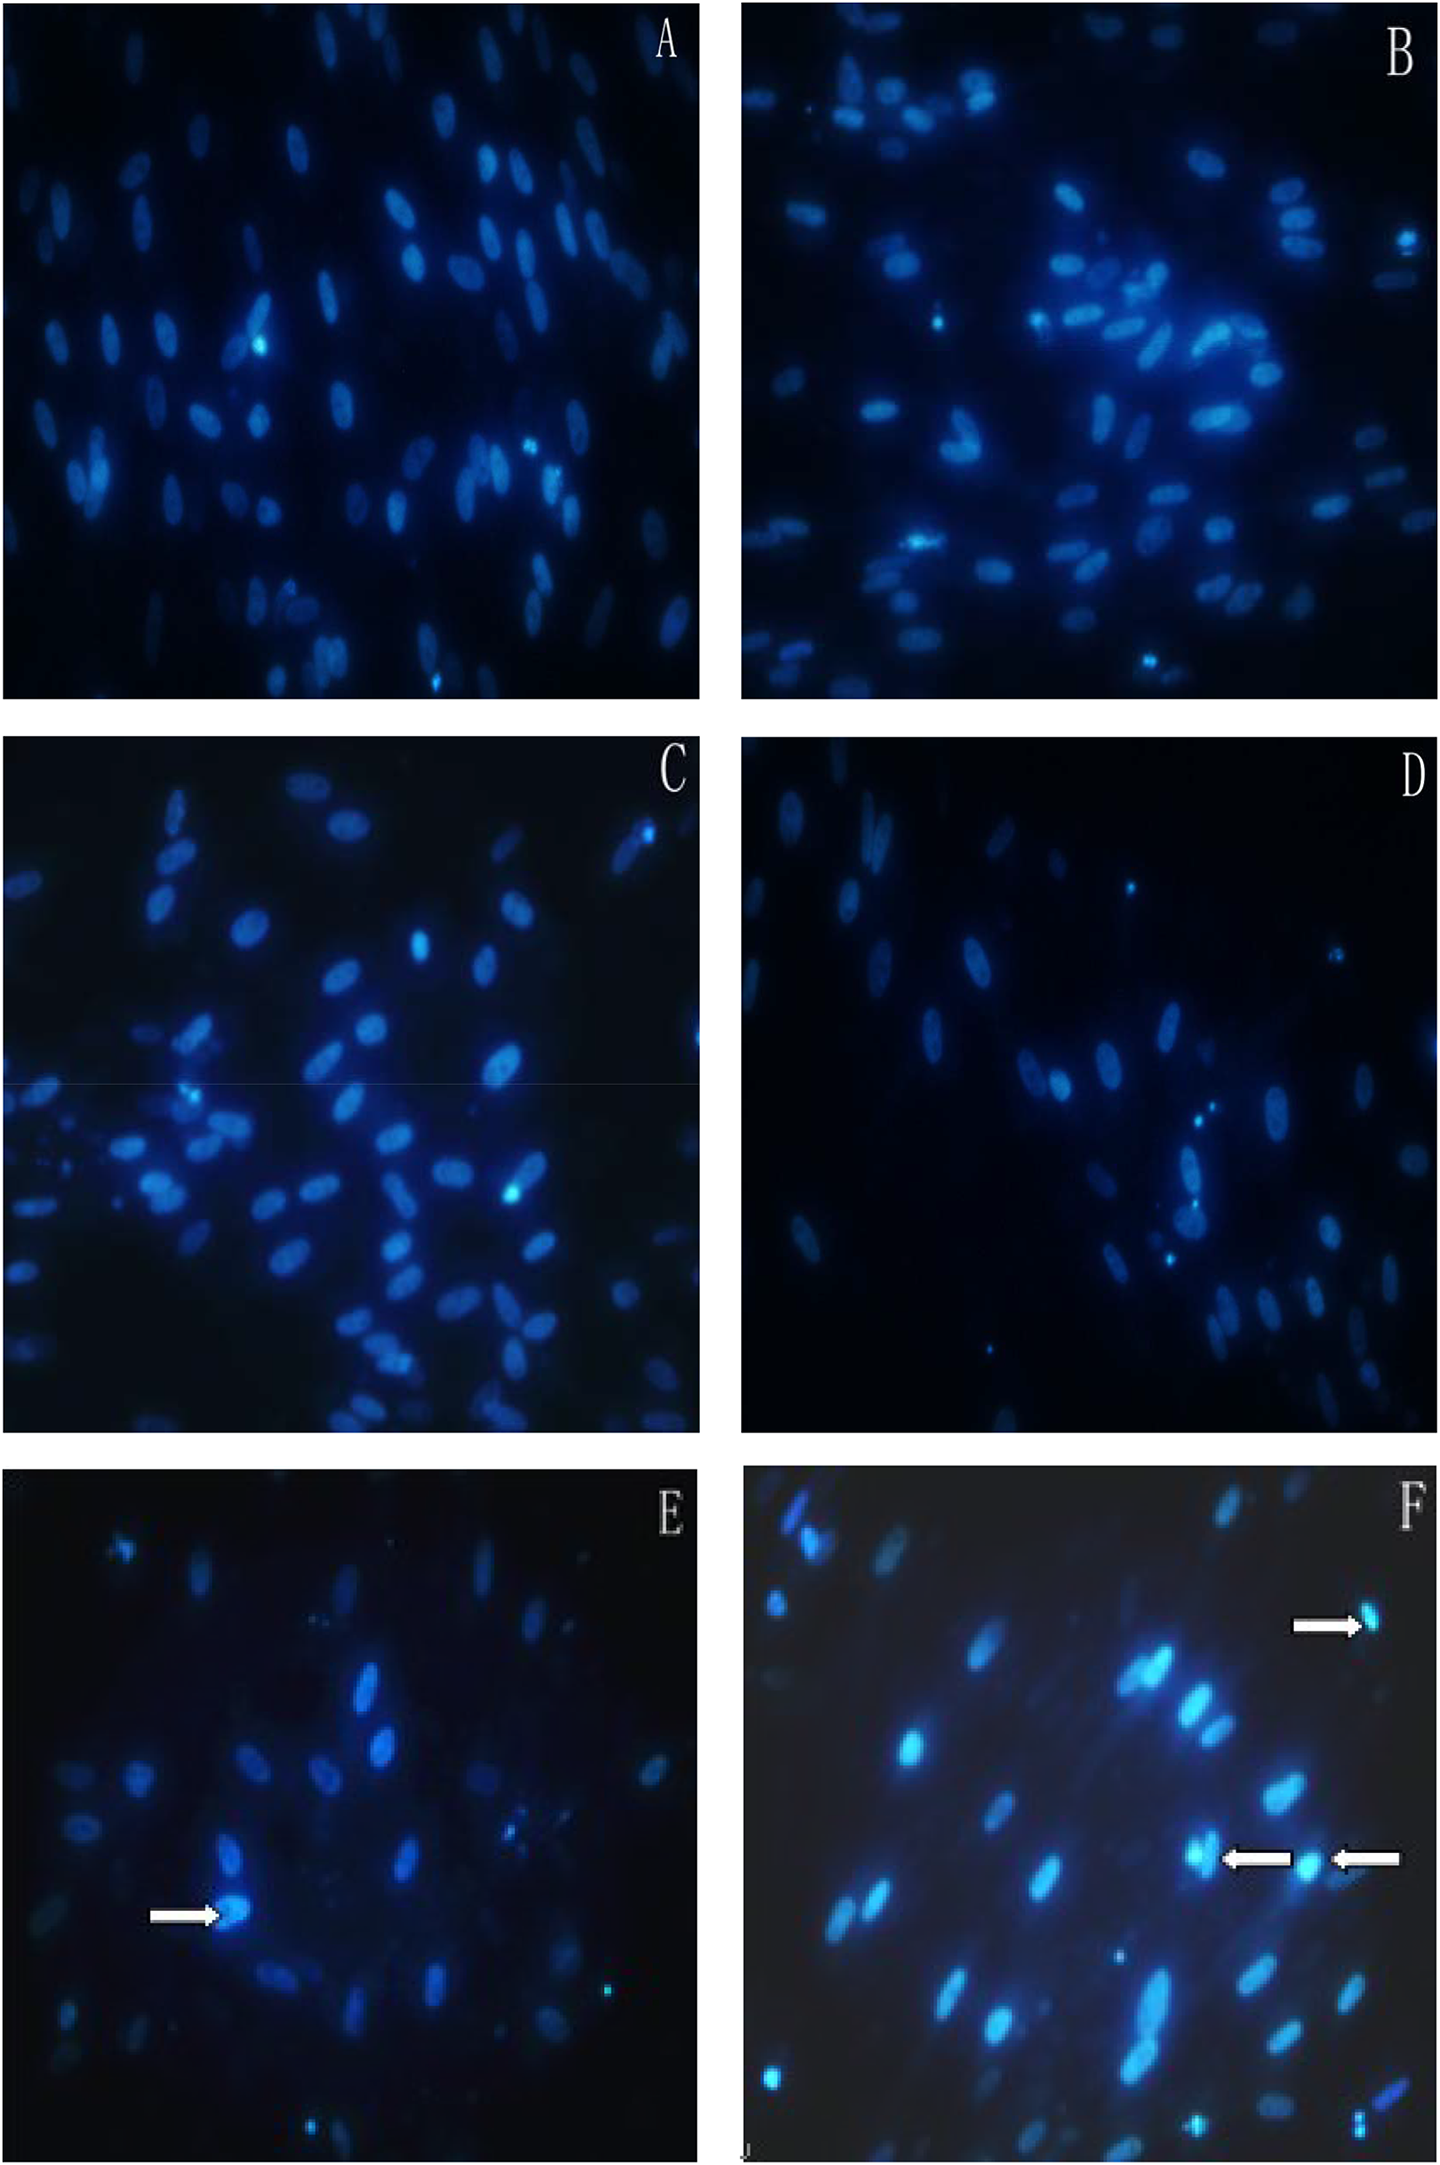
Effects of different concentrations of CrPic on apoptotic morphological changes in CEF by fluorescence microscope. Cells are incubated with CrPic for 48 h, and apoptotic bodies formation are showed with arrows by Hoechst 33258 staining. (A) Control, (B) 8 μM, (C) 16 μM, (D) 160 μM, (E) 400 μM, and (F) 600 μM, original magnification ×200. CrPic: chromium picolinate; CEF: chick embryo fibroblast.
Measurement of intracellular ROS production
ROS produced in CEF treated with different CrPic concentrations was estimated using DCFH-DA examined on FACS Calibur flow cytometer. ROS were observed in cells treated with CrPic concentrations of 8, 16, 160, 400, and 600 μM. CrPic-treated cells were compared with the control cells for 48 h, and the results are shown in Figure 2(a′). Figure 2(b′) demonstrates that the ROS level in the cells was unchanged by incubation with lower CrPic concentrations (8 and 16 μM) for 48 h such that only basal levels obtained from control cells were produced. With increasing concentrations to 160, 400, and 600 μM, the fluorescence increased significantly compared with the control group (402.7567 ± 3.50755, 421.8967 ± 3.97505, 469.1300 ± 2.93297; **p < 0.01).

Effects of different concentrations of CrPic on production of ROS in CEF by flow cytometry FL-1 filter for 48 h. The collected cells were incubated with 100 μM DCFH-DA for 30 min at 37°C, the fluorescence results were expressed as mean fluorescence intensity. Each value represents the mean ± SD, n = 6. (**p < 0.01 versus control). (A) Control, (B) 8 μM, (C) 16 μM, (D) 160 μM, (E) 400 μM, and (F) 600 μM. The part figure (a′) is an oscillogram and (b′) is a bar chart. CrPic: chromium picolinate; CEF: chick embryo fibroblast; ROS: reactive oxygen species; DCFH-DA: 2′,7′-dichlorfluorescein–diacetate.
CrPic-induced alterations in the MMP
The MMP was assessed using Rh123 in cells treated with different CrPic concentrations and compared with the control cells for 48 h (Figure 3(a′)). MMP was reduced with increasing CrPic concentrations. CrPic doses of 8 and 16 μM exhibit no significant difference (p > 0.05) contrary to the other concentrations (**p < 0.01), contrasting with the control (Figure 3(b′)).

Effects of different concentrations of CrPic on production of MMP in CEF by flow cytometry FL-1 filter for 48 h. The collected cells were incubated with Rh123 for 30 min at 37°C, the fluorescence results were expressed as mean fluorescence intensity. Each value represents the mean ± SD, n = 6. (**p < 0.01 versus control). (A) Control, (B) 8 μM, (C) 16 μM, (D) 160 μM, (E) 400 μM, and (F) 600 μM. The part figure (a′) is an oscillogram and (b′) is a bar chart. CrPic: chromium picolinate; CEF: chick embryo fibroblast; Rh123: rhodamine 123; MMP: mitochondrial membrane potential.
[Ca2+]i induced by CrPic
The [Ca2+]i observed in cells treated with CrPic concentrations of 8, 16, 160, 400, and 600 μM were compared with the control cells after 48 h. CrPic concentrations of 8 and 16 μM resulted in a slight change in the total fluorescence produced compared with the control (p > 0.05). However, increasing the CrPic concentrations to 160, 400, and 600 μM, the fluorescence was found to further increase (**p < 0.01; Figure 4).
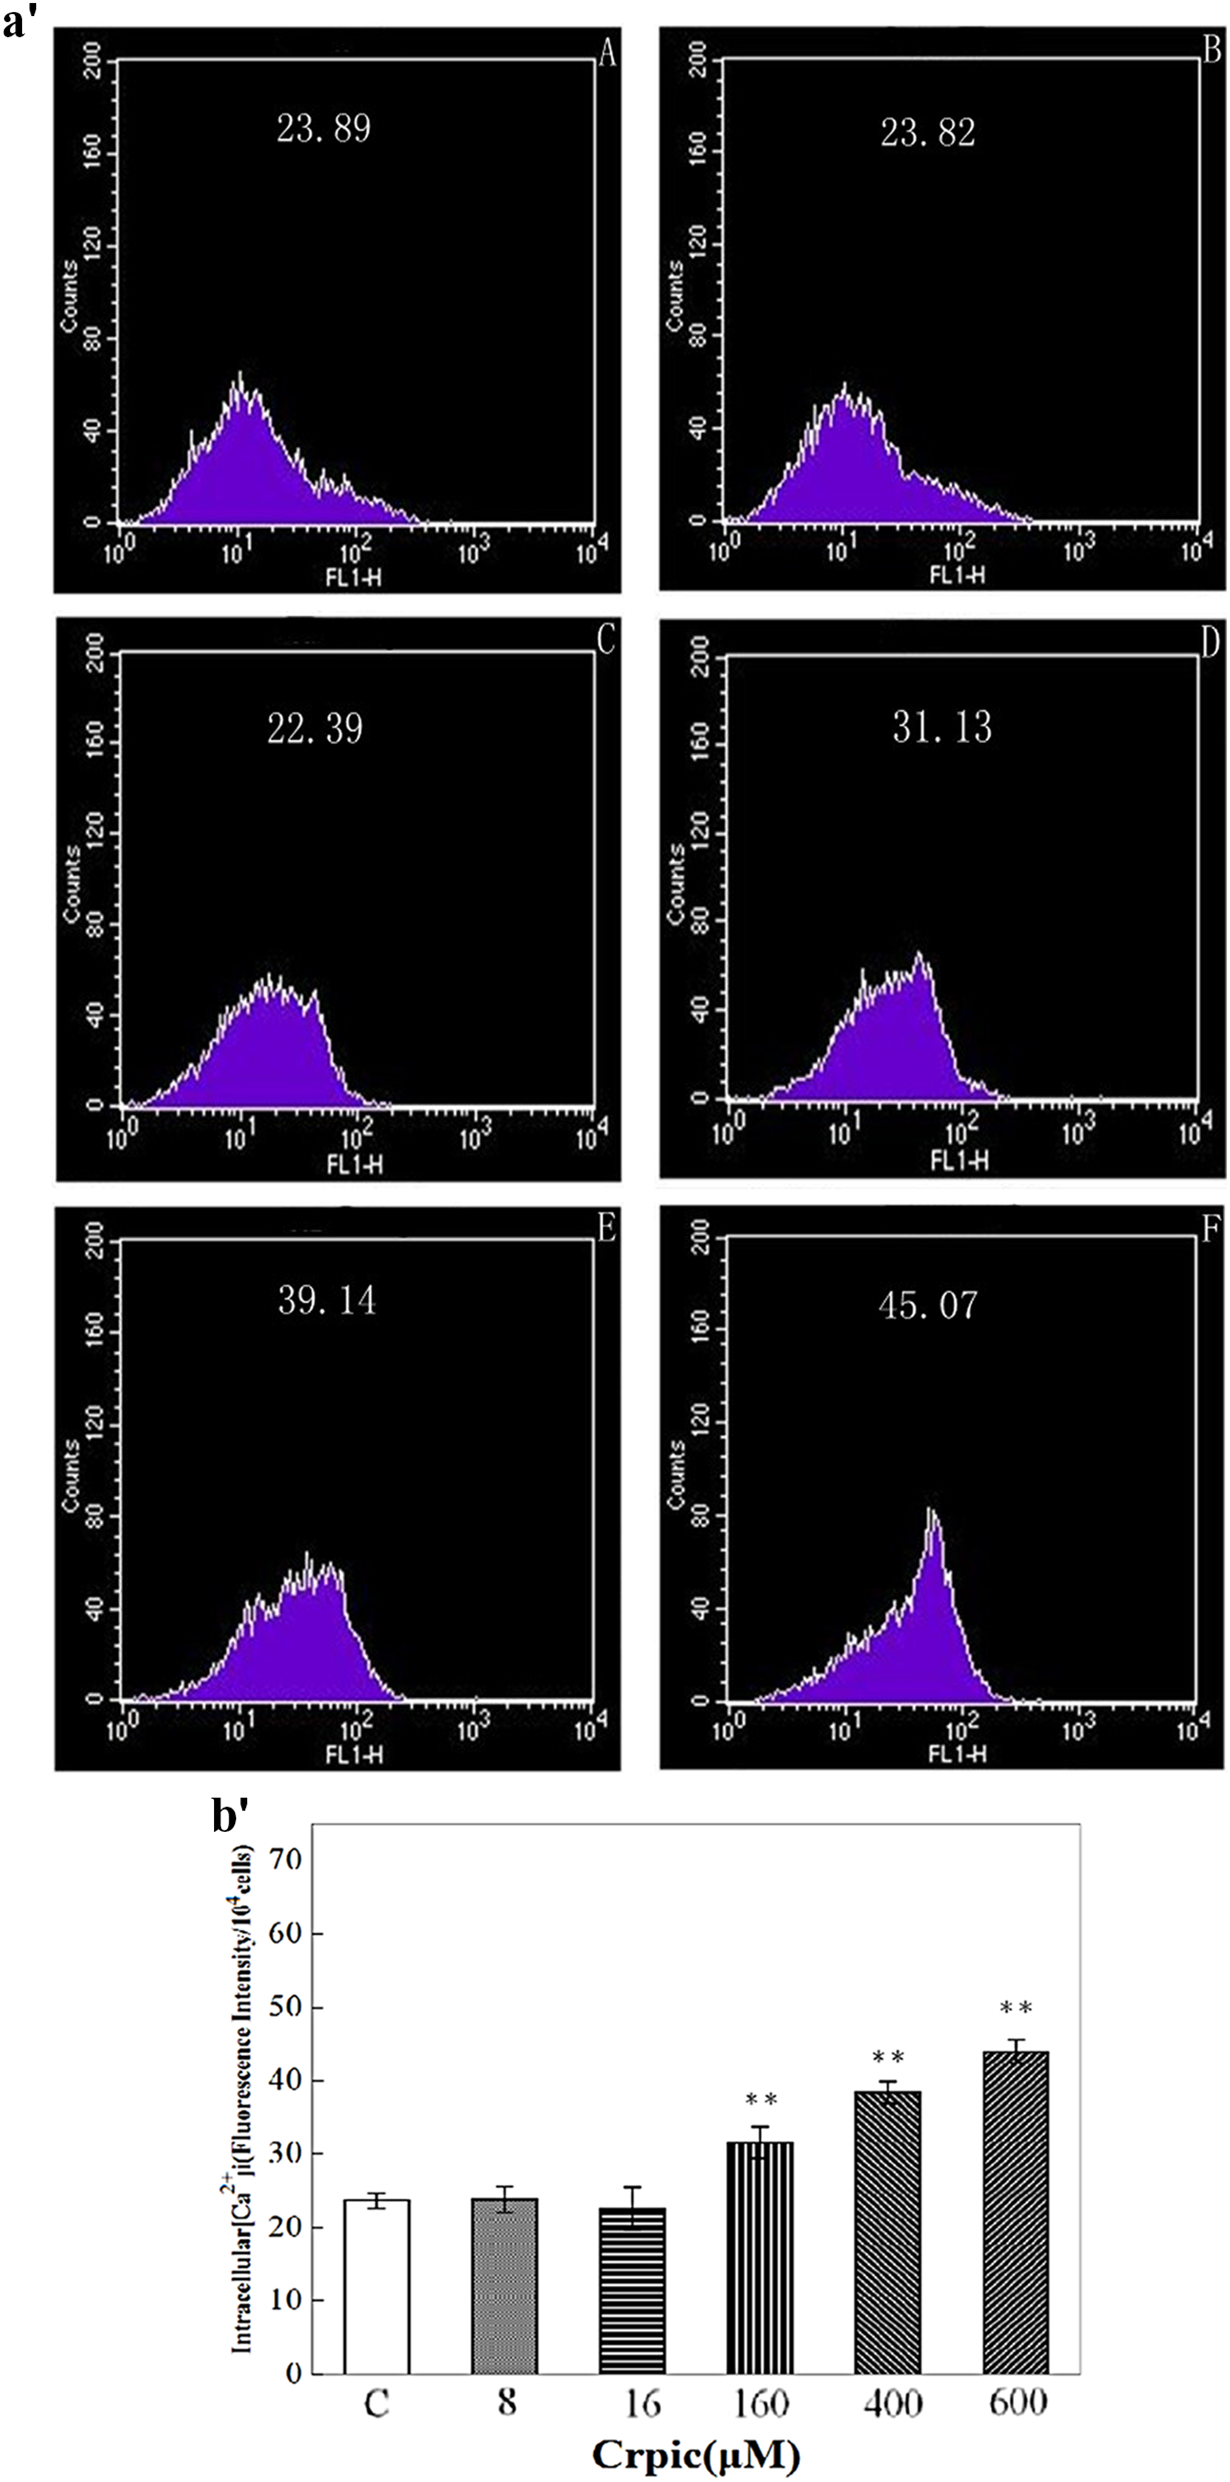
Effects of different concentrations of CrPic on the production of [Ca2+]i in CEF by flow cytometry with FL-1 filter for 48 h. The collected cells were incubated with fluo-3/ acetoxymethyl for 30 min at 37°C, the fluorescence results were expressed as mean fluorescence intensity. Each value represents the mean ± SD, n = 6. (**p < 0.01 versus control). (A) Control, (B) 8 μM, (C) 16 μM, (D) 160 μM, (E) 400 μM, and (F) 600 μM. The part figure (a′) is an oscillogram and (b′) is a bar chart. CrPic: chromium picolinate; CEF: chick embryo fibroblast; [Ca2+]i: intracellular calcium ion concentration.
Effect of CrPic on cytotoxicity to CEF
The early and late apoptotic cells were identified with annexin V-FITC/PI stain using FCM (Figure 5(a′) and (b′)). In the control group, only few cells (12.3%) with apoptotic morphology were observed. After treatment with high CrPic concentrations of 400 and 600 μM for 48 h, the apoptotic cells reached 30.6% and 46.06%, respectively (p < 0.01), in contrast to the 8.6%, 12.1%, and 14.71% apoptotic cells with 8, 16, and 160 μM CrPic concentrations, respectively (p > 0.05).

Effects of different concentrations of CrPic on the percentage of different cells in CEF using flow cytometer for 48 h. Q1 represented early apoptotic cells, Q2 represented late apoptotic cells, Q3 represented living cells, and Q4 represented necrotic cells. Each value represents the mean ± SD, n = 6. (**p < 0.01 versus control). (A) Control, (B) 8 μM, (C) 16 μM, (D) 160 μM, (E) 400 μM, and (F) 600 μM. The part figure (a′) is a two-dimensional scatter diagram and (b′) is a bar chart. CrPic: chromium picolinate; CEF: chick embryo fibroblast; Q1: upper left quadrant; Q2: upper right quadrant; lower right quadrant; Q3: lower left quadrant; Q4: lower right quadrant.
Discussion
In vitro cell culture conditions, the studies about whether the CrPic could lead to oxidative damage or cell apoptosis were different. This study investigated the toxicity test whether CrPic led to damage effects in CEF. The significance of the study is that CrPic induced apoptosis in CEF. In addition, the lowest dose of CrPic in our experiments that was considered to be adequate was set at 8 μM, which is an approximate physiological concentration, 28 at room temperature, CrPic at approximately 600 μM is slightly soluble in neutral aqueous solution, 29 so the highest concentration was 75 times higher.
Morphological and biochemical analyses results show that the supplementary CrPic was cytotoxic to CEF at a concentration of 400 μM and above. The loss of cell viability showed that CrPic exposure induced cellular death in CEF, depending on both the CrPic concentraton and the exposure time (Figure 6). Assessment via Hoechst 33258 staining showed apoptosis demonstrated by the morphological features, which was observed under a fluorescence microscope, with evidence for chromatin condensation and apoptotic body formation. In addition, significant increase of apoptotic cells induced by CrPic played a major role to apoptotic death (Figure 5). This tendency change of the morphological features was consistent with the result assessed by flow cytometric analysis.
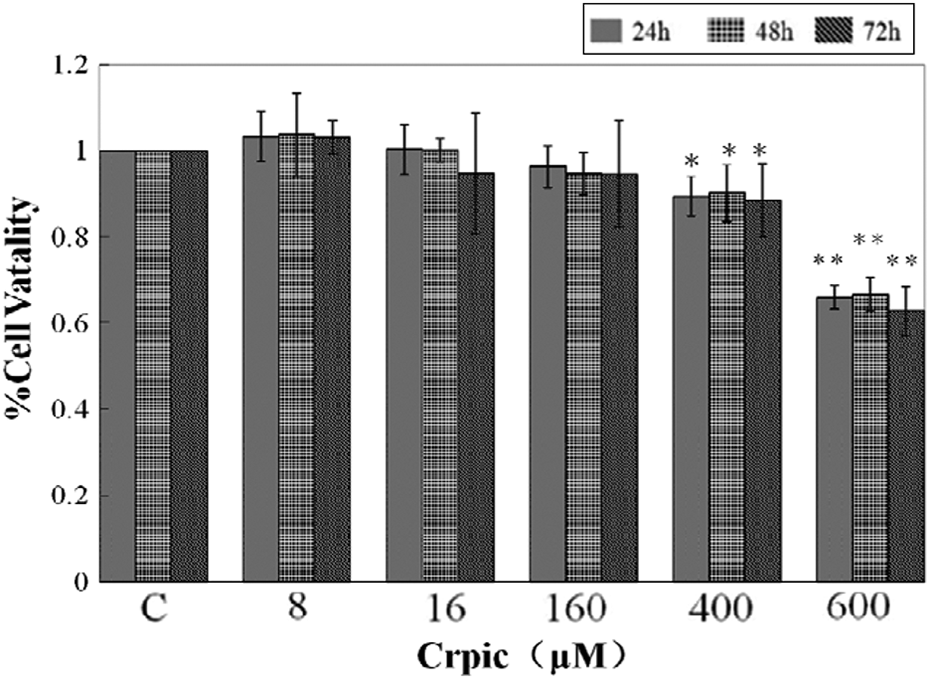
The cytotoxic effect of different concentration of CrPic in CEF after 24, 48, and 72 h exposure. Cytotoxicity was measured using MTT assay. Each value represents the mean ± SD, n = 6. *p < 0.05 versus control; **p < 0.01 versus control. C is control. CrPic: chromium picolinate; CEF: chick embryo fibroblast; MTT: 3-(4,5-dimethylthiazol-2-yl)-2,5-diphenyltetrazolium bromide.
ROS generation was not significantly induced by 400 μM CrPic in primary piglet hepatocytes, 5 This phenomenon may explain that CEF were more susceptible than primary piglet hepatocytes and also prove that not mere cytotoxic effects of high concentration CrPic was responsible. During apoptosis, cell homeostasis became remarkably imbalanced. The intracellular oxidation reduction and imbalance of ion concentration reflect characteristics of cell apoptosis and promote cell apoptosis to a certain extent. 26 ROS can induce a chain reaction of oxidation, 30 break DNA strands, 31 and result in cell death by the activation of caspases. 32 ROS was the inducer of cell death because of the high toxicity, and acted as signaling molecules, that could directly activate apoptosis. 33 Higher CrPic concentrations might affect the oxidative status of CEF compared with the control. These results proved that ROS, as the intermediary factor, is one of the early signaling molecules that might induce CEF apoptosis.
ROS production appears to result in decreased MMP, indicating that mitochondrial damage in the cells activates diverse downstream signaling molecules. 34 The imbalance in protons located on both sides of the mitochondrial inner membrane and another ion from MMP can cause abnormalities in adenosine triphosphate (ATP) combining. The breakdown in MMP leads to a decrease in ATP levels. 35 Insufficiency of ATP to support cells cause apoptosis. 36 As the concentrations of CrPic treatment of CEF increases, MMP shows a downward trend (Figure 3), compared with the control group. CrPic concentrations of 160, 400, and 600 μM show a very significant difference (p < 0.01), indicating that CrPic has a dose–effect relationship with CEF.
Mitochondrial dysfunction can lead to ATP deficiency in cells, which causes inhibition of sodium, potassium, and Ca2+ ions-ATPases. 37 Ca2+ signaling is essential for a variety of functions, such as gene transcription and the regulation of proliferation. 38 The intracellular [Ca2+]i as the signal molecules is closely related to apoptosis” is intact with the context.]. 39 It is an important step of mitochondrial permeability transition in the induction of cellular apoptosis. 40 ROS can induce apoptosis by altering the concentrations of [Ca2+]i existing in the mitochondria. 41 Using flow cytometry technique to observe the imbalance of [Ca2+]i imply that abnormal Ca2+ homeostasis may be another mechanism of the progress of apoptosis in CEF.
Oxidative stress plays a key role in cellular death and triggers apoptosis, which was the chief death mechanism induced by CrPic in CEF. The death mechanism was caused by ROS overproduction, breakdown of MMP, and elevation of [Ca2+]i concentration.
Conclusion
CrPic affected the oxidative status of CEF. Morphological and biochemical analyses showed that higher CrPic concentrations (400 and 600 μM) might induce apoptosis primarily by oxidative damage and mitochondrial dysfunctions after 48 h exposure.
Footnotes
Authors’ Note
The authors YB and XZ contributed equally to this work.
Conflict of interest
The authors declared no conflicts of interest.
Funding
This work was supported by a project of Shandong Province Higher Educational Science and Technology program (No. J10LC06).