
Abstract
Muscle dysfunction in acute organophosphorus (OP) poisoning is a cause of death in human. The present study was conducted to identify the mechanism of action of OP in terms of muscle mitochondrial dysfunction. Electromyography (EMG) was conducted on rats exposed to the acute oral dose of malathion (400 mg/kg) that could inhibit acetylcholinesterase activity up to 70%. The function of mitochondrial respiratory chain and the rate of production of reactive oxygen species (ROS) from intact mitochondria were measured. The bioenergetic pathways were studied by measurement of adenosine triphosphate (ATP), lactate, and glycogen. To identify mitochondrial-dependent apoptotic pathways, the messenger RNA (mRNA) expression of bax and bcl-2, protein expression of caspase-9, mitochondrial cytochrome c release, and DNA damage were measured. The EMG confirmed muscle weakness. The reduction in activity of mitochondrial complexes and muscular glycogen with an elevation of lactate was in association with impairment of cellular respiration. The reduction in mitochondrial proapoptotic stimuli is indicative of autophagic process inducing cytoprotective effects in the early stage of stress. Downregulation of apoptotic signaling may be due to reduction in ATP and ROS, and genotoxic potential of malathion. The maintenance of mitochondrial integrity by means of artificial electron donors and increasing exogenous ATP might prevent toxicity of OPs.
Keywords
Introduction
Malathion is an organophosphorus (OP) insecticide with a wide usage in agriculture and even homes for protection of human from pests. 1 The OPs because of their extensive use in the environment and easy accessibility are the major cause of acute poisonings and deaths and chronic toxicity around the world. 2 –4 The toxic doses of malathion in human poisoning cases were between 350 and 1300 mg/kg. 5 –7 It is well established that OPs inhibit acetylcholinesterase (AChE) at the nerve synapses and neuromuscular junction (NMJ), where degradation of acetylcholine (ACh) into choline and acetic acid is a natural step. Rapid toxicity of OPs is because of their good absorption and high affinity to AChE. 8,9
Stimulation of nicotinic receptors at the NMJ causes involuntary muscle tremors, weakness, and paralysis after poisoning.
3,10,11
The intermediate syndrome (IMS), as the main cause of morbidity and mortality of OPs poisoning, is characterized by muscle weakness few days after acute cholinergic crisis.
12
Although the pathophysiology of the IMS is still unclear, it seems to be in relation to NMJ dysfunction.
13
Cellular events that occur in the early phase of poisoning can initiate a progressive muscle disturbance. The first evidence is the persistent inhibition of AChE, but this is not the only pathological factor of this complication.
14
Muscle weakness is associated with muscle damage that occurs early in the poisoning.
15
This study was carried out to assay intracellular dysfunctions and the mechanisms involved in the induction of IMS. Mitochondrial dysfunction can damage the integrity of skeletal muscles as a tissue with high energy demand. Approximately 90% of cellular adenosine triphosphate (ATP) is produced by mitochondria. The passage of electrons through the mitochondrial respiratory chain enzymes releases energy that is stored in the form of a proton gradient and is used by ATP synthase to produce ATP from adenosine diphosphate (ADP).
16
In this process, electrons liberated from reducing substrates are delivered to oxygen and produce O2
−
Neuromuscular disorders and muscle weakness are generally referred to mitochondrial myopathies. 19,20 Dysfunction in the regulation of glucose and lipid metabolism is involved in the OPs poisoning. 21 These observations led to the hypothesis of our current investigation, which is assessment of mitochondrial impairment in the pathogenesis of OPs poisoning in the skeletal muscles. To test the hypothesis, we measured the activity of the electron transport chain enzymes and the mitochondrial-dependent apoptosis signaling. The bcl-2 as an antiapoptotic protein prevents the initiation steps of apoptosis and other programmed cell deaths. On the other hand, after a death stimulus, the cytosolic bax proteins are translocated to mitochondria and promote the release of cytochrome c. The release of cytochrome c from the mitochondria to the cytosol is pivotal in the activation of caspases and triggering cell death. In the presence of ATP, the cytosolic cytochrome c by interaction with the apoptotic protease-activating factor-1 stimulates the activation of the initiator and executioner caspases. These experimental strategies encouraged us to investigate the cholinergic receptors-independent mechanisms in fatal OPs poisoning. We took advantage of a rat model that closely resembles the clinical conditions of OPs poisoning with physiological systems and responses similar to those of human. 22
Materials and methods
Materials
Pure malathion (technical grade ˜95%) was obtained from Shimi Keshavarz pesticide production Co. (Tehran, Iran). Mitochondria isolation kit was from BioChain Ins. (Newark, New Jersey, USA). The 8-hydroxy-desoxyguanosine (8-OHdG) enzyme-linked immunosorbent assay kit was purchased from Guasabio (Wuhan, China). Real time reverse transcription–polymerase chain reaction (RT-PCR) was from Genet Bio (Nonsan, Korea). Trizol reagent and chemiluminescence western blotting kit were obtained from Roche (GmbH, Mannheim, Germany). The complementary DNA (cDNA) synthesis kit was from Fermentas (Hanover, New Hampshire, USA). Antibodies and cytochrome c protein microplate assay kit were purchased from Abcam (Cambridge, Massachusetts, USA). All other chemicals were of the highest purity available and were obtained from Sigma-Aldrich (St Louis, Missouri, USA).
Methods
Study design and AChE activity assay
A pilot experiment was designed to determine the dose of malathion reducing 70% of red blood cell (RBC) AChE. For this purpose, the doses in the range of 50% to 5% of lethal dose 50% (LD50, 1200 mg/kg) 23 was used as a suspension dissolved in corn oil and administered to rats by gavage. The healthy male Wistar rats with a weight of 250 ± 5 g were obtained from animal house of Faculty of Pharmacy, Tehran University of Medical Sciences (Tehran, Iran) and housed in the cages with the temperature range from 20 to 25°C and fed by commercially available pellet diet. All experiments were performed according to the Animal Welfare Act (Act P.L. 99-198) and the study protocol was approved by the Ethics Committee of Pharmaceutical Sciences Research Center. Six rats in each treated and control groups were used. The treated groups received the doses of 50, 100, 150, 200, 250, 300, 400, 500, and 600 mg/kg of malathion, while the controls received only corn oil. Twenty four hours after treatment, rats were anesthetized by a mixture of ketamine–xylazine (intraperitoneal), and then 1 ml blood was taken by heparinized syringe via cardiac puncture. The blood was immediately centrifuged for 20 min at 5000g and the serum was separated from RBC. The RBCs were washed three times with phosphate-buffered saline (PBS) and then 100 µl of RBCs were added to 6 ml distilled water and used for enzyme analysis. AChE activity in the RBCs was measured according to the method describedpreviously. 24
Tissue sampling and mitochondrial isolation
As mentioned above, the rats were gavaged by a suspension of malathion (400 mg/kg) in corn oil, while the controls received only corn oil. Twenty four hours after administration of malathion, the rats were anesthetized and gastrocsoleus skeletal muscles of the hind legs were separated. For preparation of skeletal muscle mitochondria, 100 mg of fresh muscle tissues were processed according to mitochondria isolation kit protocol. Finally, tissue and mitochondrial samples of six rats each from control and treated groups were stored in −80°C following processing. Real time RT-PCR was performed on three muscle samples. Animals after tissue sampling were euthanized by cervical dislocation.
Neurophysiological investigations
Malathion was given in a single oral dose of 400 mg/kg to treated group, while the controls received only corn oil by gavage. Twenty four hours after exposure, rats were anesthetized by ketamine–xylazine and the right leg was shaved and lightly washed with warm water. The sciatic nerve was exposed to dissecting adductor brevis and magnus. The most proximal part of the sciatic nerve was cleared from adherent connective tissue. The sciatic nerve was exposed between notch and knee. The nerve was bathed in paraffin and maintained at 37°C under radiant heat with a thermometer. Two hook-type stimulating electrodes were placed at the level of the sciatic trunk. The active cathode was placed over the belly of gastrocsoleus muscles at the midline and anode over the tendon of this muscle. Stimulation (0.1 ms duration and 5 V pulse) was delivered at 1 Hz from a constant current stimulator and the evoked potentials were recorded from the gastrocsoleus muscles via two fine needle electrodes and displayed on the Powerlab® system (AD Instruments Pty Ltd, Bella Vista, Australia). Electromyography (EMG) potentials were amplified and filtered between 10 Hz and 10 KHz. Nerve conduction velocity (NCV) was measured as described previously using a procedure in the sciatic conducting system at a temperature controlled circumstance. A hook-type stimulant electrode was placed on the sciatic notch and a second on the tibial branches. Recording electrodes were also inserted in the muscles of the first interosseus muscle of foot, and the EMG potentials were amplified and filtered between 10 Hz and 10 KHz. The NCV was calculated by dividing the distance between two stimulated sites into the latency difference for response from these two sites. 25
Complex I (nicotinamide adenine dinucleotide–ubiquinone oxidoreductase) activity assay
The principle of the complex I activity assay is based on the conversion of nicotinamide adenine dinucleotide (NADH) to NAD+ leading to passage of electrons through complex I and ultimately reduction in ubiquinone. Briefly, the reaction started by the addition of 100–200 μg/ml of total mitochondrial protein to freshly prepared reaction mixture containing potassium phosphate buffer (25 mM; pH = 7.4), 25% bovine serum albumin, magnesium chloride (MgCl2; 5 mM), decylubiquinone (2.8 mM), NADH (5.7 mM), antimycin A (3.7 µM), and potassium cyanide (KCN; 2 µM). The decrease in NADH absorbance at 340 nm as the total of complex I was recorded for 3 min by a spectrophotometer from BioTek® instruments, Inc. (Winooski, Vermont, USA). The rotenone-insensitive activity of NADH-cytochrome b oxidoreductase was determined by measuring a sample with rotenone (0.36 mM) added to the reaction mixture. The enzyme activity was calculated using an extinction coefficient of 6.22 mM−1 cm−1 at 340 nm and was reported in millimoles of NADH per minute per milligram of mitochondrial protein. Finally, the rotenone-insensitive activity was subtracted from total activity to determine the overall net rate. 26,27
Complex II (succinate–ubiquinone oxidoreductase) activity assay
Complex II specific activity was measured following the reduction in 2,6-dichlorophenolindophenol (DCPIP) at 600 nm. The mitochondria (10–50 µg of total mitochondrial protein) were preincubated in potassium phosphate buffer (25 mM; pH 7.2), MgCl2 (5 mM), and succinate (20 mM) at 30°C for 10 min. The baseline rate was recorded for 3 min by addition of antimycin A (2 µg/ml), rotenone (2 µg/ml), KCN (2 mM), and DCPIP (50 µM). The reaction was started with ubiquinone (65 µM) as an electron acceptor, and the enzyme-catalyzed reduction in DCPIP as a chromophore was measured for 3–5 min at 600 nm. 28 The complex II activity was calculated using a DCPIP standard curve and the activity unit was reported as millimoles of DCIP per minute per milligram of mitochondrial protein.
Complex IV (cytochrome c oxidase) activity assay
This was tested according to the previously established spectrophotometric method. 29 Before assay, enough sodium hydrosulfite was added to reduce the cytochrome c. The reaction was started by adding 5–15 µg of mitochondrial protein to a solution containing reduced cytochrome c and lubrol PX (0.45 mM) in potassium phosphate buffer (25 mM), pH = 7.4. The decrease in optical density at 550 nm was measured for 3–6 min. Data were presented as the natural logarithm of the absorbance divided by time and reported as the first-order rate constant (k) per minute per milligram of mitochondrial protein.
Complex V (ATP synthase) activity assay
The ATP synthase activity was measured in the presence of the ATP-regenerating system 30 in Tris-acetate (25 µM; pH = 7.5), potassium acetate (25 µM), sucrose (300 µM), potassium chloride (KCl; 100 mM), MgCl2 (2 µM), ATP (2 µM), pyruvate kinase (3 U/ml), lactate dehydrogenase (LDH; 2.8 U/ml), phosphoenol pyruvate (1 µM), and NADH (0.4 µM). The reaction was started by adding mitochondrial protein (8 mg/ml) and monitored spectrophotometrically at 340 nm for 8 min in the presence and absence of oligomycin (6 µg/ml). Oligomycin was added for the elimination of oligomycin-insensitive enzyme activity, which is localized in membranes of subcellular particles, such as vacuoles, lysosomes, and sarcoplasmic reticulum. The evaluation was carried out using the molar extinction coefficient of of about 6.22 mM−1 cm−1 for NADH and NAD+ at 340 nm. Units were defined as millimoles of NADH oxidized per minute per milligram of mitochondrial protein.
ADP/ATP ratio assay
In order to evaluate the ADP/ATP ratio, 300 mg muscle tissues of each group were sonicated in 500 µl of 6% trichloroacetic acid and then centrifuged at 12,000g for 10 min at 4°C. The supernatant was removed and neutralized with potassium hydroxide (KOH; 4 M). Detection was performed by high-performance liquid chromatography consisted of a 510-pump and solvent delivery system, column (SUPELCOSIL® LC-18-T, Supelco, Inc., Bellefonte, USA) with a guard column, and 486 UV-Visible Detector all from Waters (Milford, Massachusetts, USA). The protocol consisted of isocratic elution with tetrabutylammonium hydrogen sulfate (4 mM) in potassium phosphate buffer (0.1 M; pH 5.5) and methanol (85:15 v/v). The flow rate was 1 ml/min for 20 min at 254 nm. The levels of ATP and ADP were measured after creation of standard curve and then the ratio was calculated. The method was already set up and applied in our laboratory. 31
Glycogen assay in muscle tissue
Glycogen content was determined using the phenol–sulfuric acid modified method presented by Lo et al. 32 Muscle samples (100 mg) were separated from visible connective tissue weighed into polypropylene test tubes. KOH solution (30%; 1 ml) was added to the sample, thoroughly homogenized, and centrifuged. The supernatants were removed and 200 µl of a 5% phenol solution was added to 100 µl of samples and glycogen standards. Concentrated sulfuric acid of 1 ml, while agitating, was added rapidly to each tube. The absorbance was read at 490 nm after 20 min and then glycogen content (parts per million per milligram (ppm/mg) of tissue protein) calculated from glycogen standard curve.
Lactate assay in muscle tissue
To assay the lactate content of muscles, a modified protocol 33 was used. Briefly, with the addition of 0.1 ml of sample (prepared by homogenation of 100 mg muscle sample in 8% perchloric acid and assembling supernatant) in 2.9 ml of reaction mixture containing hydrazine buffer (0.5 M; pH = 9.2), NAD+ (2 mg/ml), and LDH (12.5 U/ml) and mixing the contents thoroughly, the absorbance changes were read at 340 nm in 50 min with 1 min intervals. Lactate concentration (ppm/mg of tissue protein) was calculated using lactate standard curve.
ROS production by intact mitochondria
Measuring the rate of H2O2 emission is a preferred method to measure the production of mitochondrial ROS. For this purpose, an incubation medium containing KCl (125 mM), 4-(2-hydroxyethyl)-1-piperazineethanesulfonic acid (10 mM), potassium phosphate buffer (2 mM; pH = 7.0), MgCl2 (5 mM),
The bax and bcl-2 mRNA expression in muscle tissue
The messenger RNA (mRNA) expression of bax and bcl-2 was carried out using real time RT-PCR. Briefly, total RNA was extracted by mechanical sonication of gastrocsoleus muscle in 1 ml of ice-cold Trizol reagent. Total RNA was solubilized in RNase-free water and was quantified and qualified by measuring the optical density at 260 and 280 nm, respectively. RNA of 2 μg was reverse transcribed using the protocol of cDNA synthesis kit. The primer pairs were designed from sequences published in GenBank. The followings were the sequences of primers that are used: for bax: 5′-CCAAGAAGCTGAGCGAGTGTCTC-3′ and 5′-AGTTGCCATCAGCAAACATGTCA-3′; for bcl-2: 5′-CTGCATCTCATGCCAAGGGG-3′ and 5′-ACCAATAGCACTTCGCGTCC-3′; and for β-actin: 5′-TCCTGTGGCATCCACGAAACT-3′ and 5′-ACTTGCGCTCAGGAGGAGCAA-3′. cDNA of 1 µl was then amplified by real time RT-PCR using forward and reverse primers and real time RT-PCR kit and a thermal cycler from Corbett (Mortlake, Australia). Finally, the expression level for bax and bcl-2 for three samples in each control and treated groups was normalized by subtracting the cycle threshold (CT) of β-actin as a housekeeping gene from the gene of interest to calculate the ΔCT.
Caspase-9 protein expression in muscle tissue
Western blot analysis was used to detect the presence of noncleaved and cleaved forms of caspase-9 protein in the muscle samples of control and treated groups. In brief, total proteins were extracted from 300 mg of frozen muscle tissues using lysis buffer (Tris pH 6.8, dithiothreitol, sodium dodecyl sulfate (SDS) 10%, glycerol, and bromophenol blue) and boiling in 95°C for 10 min. Total extracted proteins were loaded to SDS-polyacrylamide gel electrophoresis with appropriate concentrations of polyacrylamide and then transferred onto nitrocellulose blot using semidry electroblotting. The membranes were incubated overnight with casein 1% and Tween 0.01% blocking solution and then incubated with rabbit anti-caspase-9 antibody or rabbit anti-β-actin antibody for 18 h at 4°C. After washing, the membrane was incubated with 1:2000 diluted peroxidase–conjugated goat anti-rabbit immunoglobulins G at room temperature. The peroxidase activity was detected by a chemiluminescence method using a chemiluminescence western blotting kit and exposure and quantification of proteins were carried out by the fusion system. For each sample, the results were expressed as the ratio of density of cleaved and noncleaved caspase-9 protein band and were normalized to the density of β-actin protein band.
Mitochondrial cytochrome c protein release
Control and treatment muscle samples (100 mg) were processed by the mitochondria isolation kit. The cytosolic and mitochondrial cytochrome c were measured for each sample using the manufacturer’s instruction of the cytochrome c protein microplate assay kit. The optical density was measured at 600 nm and the resulting values were expressed as cytochrome c protein ppm/mg of cytosolic or mitochondrial protein.
Measurement of 8-OHdG in muscle tissue
Muscle samples of 300 mg from control and treated rats were homogenized on PBS, and after the removal of supernatant, the assay was carried out according to the 8-OHdG kit protocol. Finally, data were presented as 8-OHdG ppm/mg of tissue protein.
Statistical analysis
All values are analyzed by StatsDirect version 2.7.9. and expressed as mean ± SEM. Student’s t test was used to assess differences in group means. A p ≤ 0.05 was taken to be statistically significant.
Results
AChE activity
According to the pilot study, malathion (400 mg/kg) inhibited AChE activity up to 70% as illustrated in Figure 1. All other experiments are based on this dose to design an acute exposure model.

Inhibition of AChE 24-h postoral administration of different doses of malathion. AChE: acetylcholinesterase.
EMG and sciatic–tibial NCV analysis
The EMG results showed a significant reduction (p = 0.002) in compound muscle action potential (CMAP) peak-to-peak amplitude and duration of CMAP (p = 0.003) and an elevation in latency in comparison with control group (delay in muscle responses to stimulation; p = 0.009) after 24 h of treatment. No significant difference was found between control and treatment group in NCV after this time (p = 0.127; Table 1).
Statistical comparison of the amplitude and duration of CMAP, latency, and sciatic–tibial NCV of gastrocsoleus muscles in response to single stimulation of sciatic nerve in control and treatment groups.a

CMAP: compound muscle action potential; NCV: nerve conduction velocity.
aValues are mean ± SEM (n = 6).
b p < 0.005.
c p < 0.05.
Interaction of malathion with mitochondria respiratory chain enzymes
The mitochondrial activities of complexes I, II, IV, and V in malathion-treated and control rat muscles, 24 h after poisoning, are shown in Table 2. Malathion caused a significant reduction in the activities of complexes I (p = 0.023), IV (p = 0.004), and V (p = 0.042). The complex II activity did not have a significant change (p = 0.221) in treated animals.
Effect of acute malathion exposure on activity of mitochondrial NADH-ubiquinone oxidoreductase, succinate–ubiquinone oxidoreductase, cytochrome c oxidase, and ATP synthase in the rat gastrocsoleus muscles in control and treatment groups.a

ATP: adenosine triphosphate; NADH: nicotinamide adenine dinucleotide.
aValues are mean ± SEM (n = 6).
b p < 0.05.
c p < 0.005.
ADP/ATP ratio, glycogen content, and lactate concentration
The effects of impaired cellular metabolism and bioenergetic failure in rat muscles on malathion action were assessed by measuring ADP/ATP ratio, glycogen content, and lactate concentration under the treatment conditions described. The ADP/ATP ratio significantly increased (1.55 ± 0.07 vs. 2.4 ± 0.11; p = 0.0032; Figure 2), while the glycogen content of muscle significantly decreased (107.6 ± 1.74 vs. 74.78 ± 2.54; p < 0.001) by malathion (Figure 3). The mean concentration of lactate recorded in the muscle, 24 h after malathion exposure, was significantly higher (1.65 ± 0.1 vs. 3.39 ± 0.2; p < 0.001) than that of control group (Figure 4).

Changes in whole gastrocsoleus muscles ADP/ATP ratio in control and treatment groups. Values are mean ± SEM (n = 6). ATP: adenosine triphosphate; ADP: adenosine diphosphate.
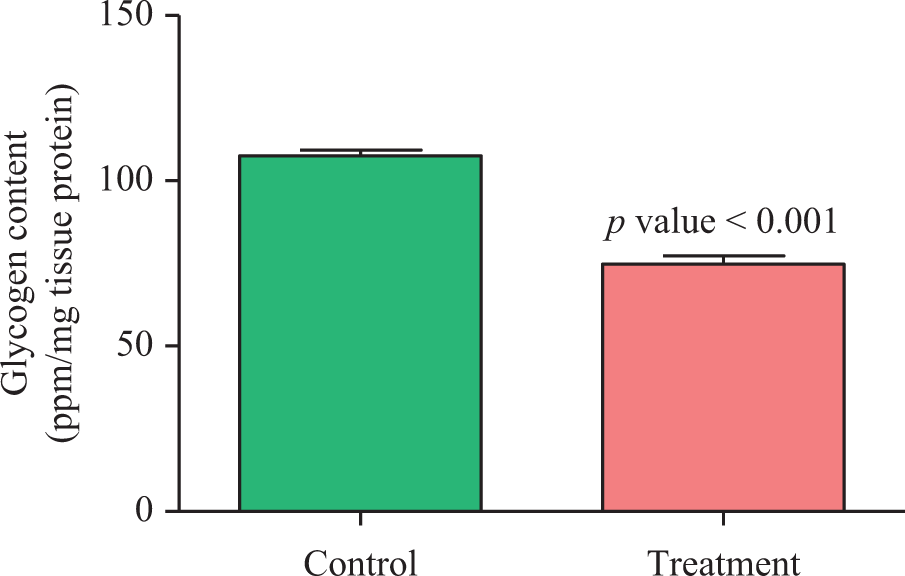
Changes in whole gastrocsoleus muscles glycogen content in control and treatment groups. Values are mean ± SEM (n = 6).
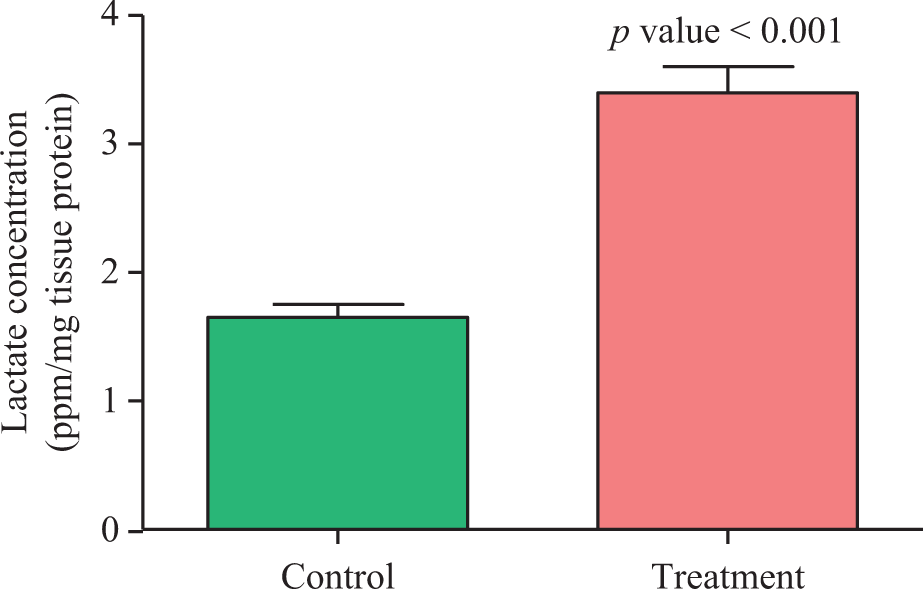
Changes in whole gastrocsoleus muscles lactate concentration in control and treatment groups. Values are mean ± SEM (n = 6).
Production of ROS by intact mitochondria
This experiment was designed to determine whether the malathion exposure is associated with alterations in muscle mitochondrial ROS generation. The rates of H2O2 formation by isolated muscle mitochondria in control and treated groups, 24-hour postexposure, are shown in Figure 5. Apparent reduction in the rate of H2O2 formation by intact mitochondria was observed in the treatment group (33.28 ± 4.14) in comparison with control group (49.95 ± 5.76) with a p value of 0.03.
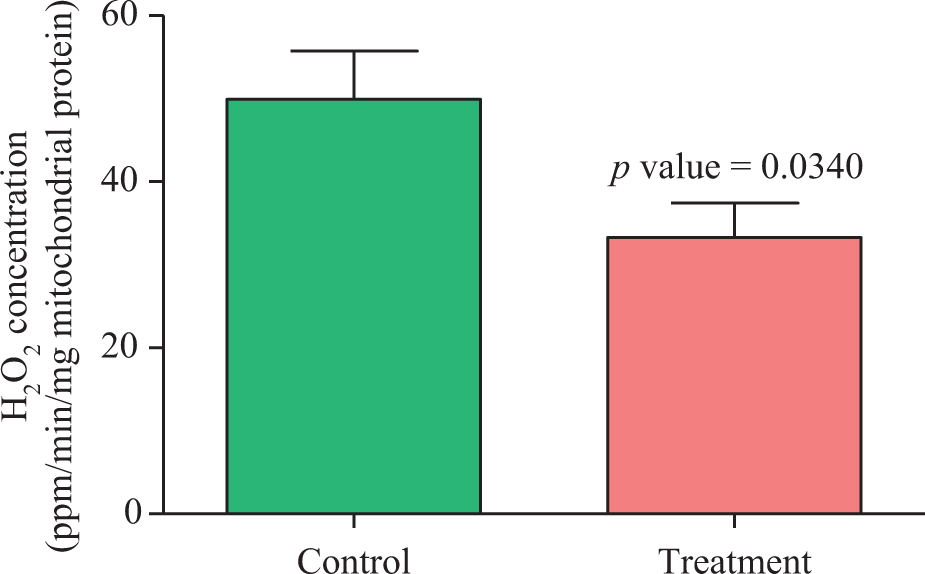
H2O2 production by gastrocsoleus muscles intact mitochondria in control and treatment groups. Values are mean ± SEM (n = 6). H2O2: hydrogen peroxide.
Real time PCR analysis of bax and bcl-2 and western blot detection of caspase-9
The mean 2−▵CT values normalized with β-actin for bax and bcl-2 in control and treatment groups are shown in Table 3. There was a significant (p < 0.001) decrease in bax and bcl-2 mRNA expression in treated group.
Fold difference between mRNA expression of bax and bcl-2 genes and β-actin as a housekeeping gene in gastrocsoleus muscles in control and treatment groups.a
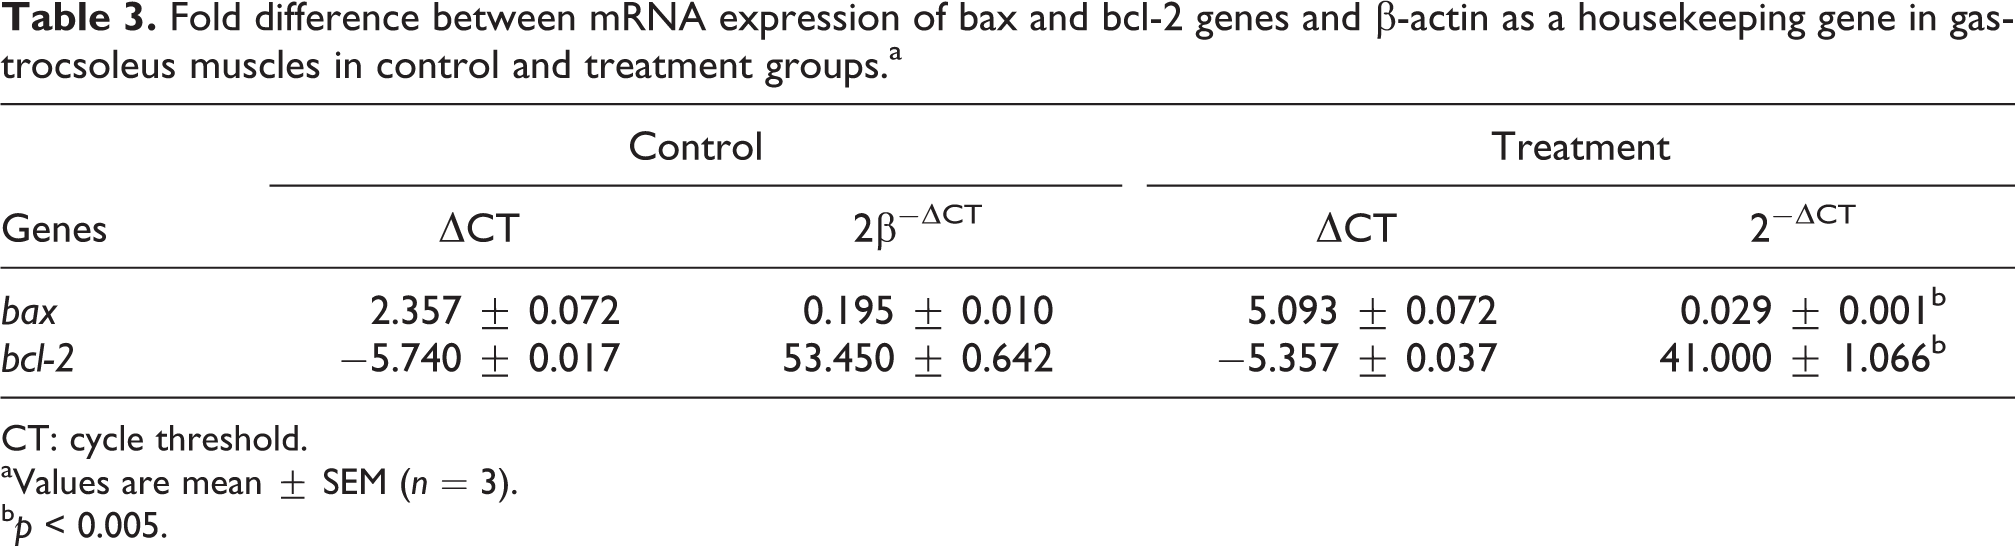
CT: cycle threshold.
aValues are mean ± SEM (n = 3).
b p < 0.005.
In western immunoblotting, bands in the predicted position for noncleaved and cleaved caspase-9 were detected. Data were analyzed by densitometry and normalizing with β-actin protein expression in control and treated groups. Finally, there was no significant change in caspase-9 expression (p = 0.812) and the level of its cleaved form (p = 0.0916; Figure 6) by malathion.

Western blot analysis of gastrocsoleus muscles for control and treatment groups. (a) Visualization of β-actin protein and cleaved and noncleaved forms of caspase-9 protein in muscle tissues by SDS-PAGE analysis. (b) Comparison between noncleaved and cleaved forms of caspase-9 protein in control and treatment groups, after normalization with β-actin protein expression. Values are mean ± SEM (n = 6). SDS-PAGE: sodium dodecyl sulfate–polyacrylamide gel electrophoresis.
Quantitative detection of cytochrome c protein and 8-OHdG
The mitochondrial cytochrome c release was significantly lower (0.28 ± 0.03 vs. 0.14 ± 0.02; p = 0.0172) in the treatment group in comparison with controls. Data were reported as the cytosolic per mitochondrial cytochrome c content in two groups (Figure 7). The average 8-OHdG level showed a significant increase (0.32 ± 0.02 vs. 0.42 ± 0.10; p = 0.012) of approximately 1.3 times in the treatment group in comparison with controls (Figure 8).
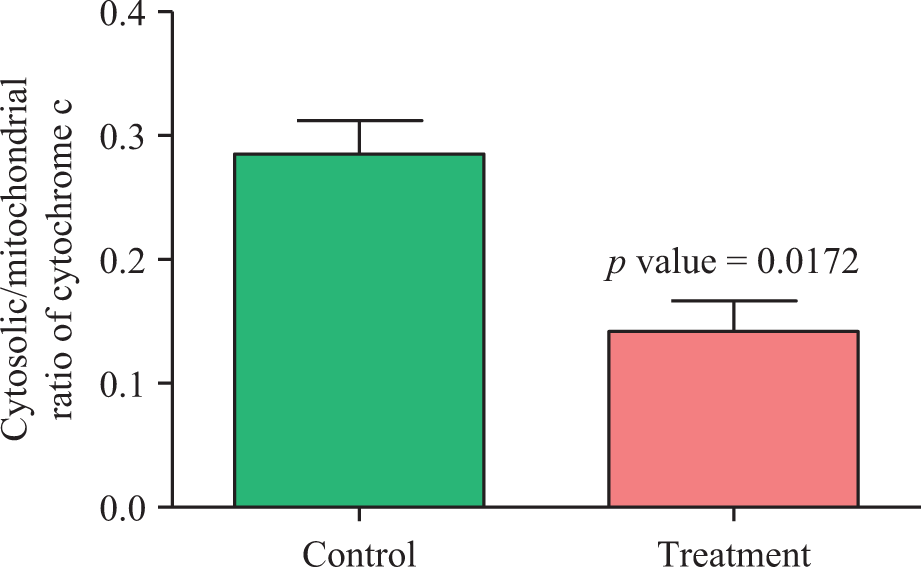
Mitochondrial cytochrome c release was estimated by measuring protein content of cytochrome c in mitochondrial and cytosolic fractions in control and treatment groups. Values are mean ± SEM (n = 6).

Changes in whole gastrocsoleus muscles 8-OHdG level in control and treatment groups. Values are mean ± SEM (n = 6). 8-OHdG: 8-hydroxy-desoxyguanosine.
Discussion
The present study was undertaken to evaluate changes in the mitochondrial functions following acute malathion exposure. At the severe and acute malathion poisoning, the RBC AChE activity is inhibited by 70–80%. 1 To design an acute poisoning, via a pilot experiment, the dose of 400 mg/kg of malathion (approximately one-third of LD50) was determined to inhibit activity of this enzyme to 10–30% of normal. Measurement of the mitochondrial respiratory chain function in response to acute malathion exposure to this dose showed a slight impairment in the function of complexes I, IV, and V with no change in complex II. Since the aerobic metabolism of glucose is coupled to the oxidative phosphorylation by the flavin adenine dinucleotide and complex II through succinate in the citric acid cycle, 35 the first thing that comes to mind is that the pathways linked to NADH, but flavin adenine dinucleotide, are primarily engaged in dysfunction of mitochondrial respiration. These results are consistent with muscle weakness shown in the EMG tests. The decrease in amplitude and duration time of CMAP and the increase in the delay of muscle response to stimulation are supported by previous reports. 36 –39 No change in NCV suggests that the morphological changes such as demyelination of the sciatic nerve have not taken place. The occurrence of changes in EMG parameters without alteration in NCV suggests a kind of induction of the irreversible change in neuromuscular synapse and the anterior horn cells due to vascular insufficiency and muscle ischemia. 36 Transient loss of CMAP amplitude during the first 72 h can be explained by increase in ACh at nerve terminals and cholinergic crisis leading to muscle fatigue 40 –42 and impaired mitochondrial function in skeletal muscle.
In the present study, depletion of the glycogen stores, because of a possible glycogenolysis, promoted the anaerobic glycolysis to cope with impairment of mitochondrial function, especially in the production of ATP. Muscle fasciculation after release of ACh makes an extra energy demand that stimulates glycogenolysis. 43,44 We found that lactate, the end product of glycolysis under hypoxic conditions, was elevated by malathion. This upward trend suggests insufficient oxygen supply for the normal metabolic function that is needed to convert pyruvate to lactate. The ADP–ATP ratio was significantly increased, that is, consistent with previous investigations. 45 –47 Interestingly, such degree of insufficiency in respiratory chain enzyme activity can decrease the intracellular ATP and the integrity of the cell. 48 Another novel finding in the present study is the reduction of ROS by intact mitochondria. Production of ROS in the electron transport chain has a physiological role in creating a proton gradient that is necessary for the production of energy. During stress, attenuation of electron transfer through complex I leads to a reduction in release of ROS from complexes I and II. Production of ROS is highly involved in the mitochondrial swelling and apoptosis by opening the mitochondrial permeability transition pore. 18,49 In a recent review, a number of examples supporting the opinion that mitochondria is not a major source of ROS inside the cell has been numbered. The oxidative phosphorylation accounts for a high amount of the cellular oxygen consumption and only 3% of this can be converted to superoxide. 50 Therefore, alternative sources of ROS should be considered in lipid peroxidation caused by OPs. 51 –57 In the early stage of poisoning, low production of ROS can work as a trigger to autophagic/mitophagic process. The autophagic pathways induce cytoprotection by eliminating potential sources of proapoptotic stimuli and removal of the damaged organelles such as mitochondria and finally keep the cell alive. Sustained production of ROS happening in chronic exposure to OPs causes cell death via autophagic and apoptotic pathways. 18 Insufficient fatty acid and carbohydrate metabolisms cause accumulation of fatty acids in the cytosol and then oxidation of fatty acids in peroxisomes and endothelial reticulum leads to overproduction of ROS. 21,58 Complexes I and II are in association with oxidative stress, while the inactivity of complexes IV and V causes collapse of mitochondrial membrane potential and depletion of ATP. 59,60 Therefore, the reduction in mitochondrial ROS and complexes IV and V can all decrease production of ATP and apoptosis signaling as an energy-dependent process. In agreement with this hypothesis, we found a significant reduction in bcl-2 and bax gene expressions. Reduced expression of bcl-2 can reduce formation of the bcl-2 and Beclin 1 complex (one of the bcl-2 family members), induce autophagy, and prevent apoptosis. 61,62 Other findings confirming this idea are the reduction in bax expression and mitochondrial cytochrome c release with no change in expression of caspase-9 protein. On the other hand, the presence of ACh in different parts of the cell and nonneuronal cells can express noncholinergic effects of AChE. Reduction in AChE activity decreases the activation of caspases, interferes with cytochrome c release, and prevents formation of apoptosome. 8,63 –68 Based on these studies, we can say that OPs through inhibition of AChE enzyme can induce kind of resistance to apoptosis. ACh through activation of survival signaling pathways inhibits proapoptotic protein and activates antiapoptotic pathways. 69 –72 Geyer et al. 73 showed occurrence of antiapoptotic factors in the mouse muscle’s tissue and fiber in response to OPs exposure. Of course, AChE inhibition by elevating the amount of ACh can play a role in maintaining the homeostasis of muscle tissue. For better understanding, all relationships are summarized in Figure 9. The OPs act as an electrophilic site and react with DNA, especially with the nitrogen and oxygen atoms of adenine, guanine, and cytosine bases. 74 Malathion also acts as a genotoxic compound, especially at the highest level of exposure. 75 In this study, we have shown that a significant elevation in the 8-OHdG level occurred due to electrophilic properties of malathion and oxidative damage of DNA. The 8-OHdG is one of the most commonly observed base modifications known to occur. Genotoxicity and DNA damage in farmers occupationally exposed to OPs have been already reported. 76 The nucleotide excision repairing by glycosylase is essential for the elimination of 8-OHdG and deoxyadenosine residue misincorporated. The damage in the promoter region of bax or p53 response elements, which contains a GC rich region (5′-GGGCGT-3′), abolishes its proapoptotic function. 77
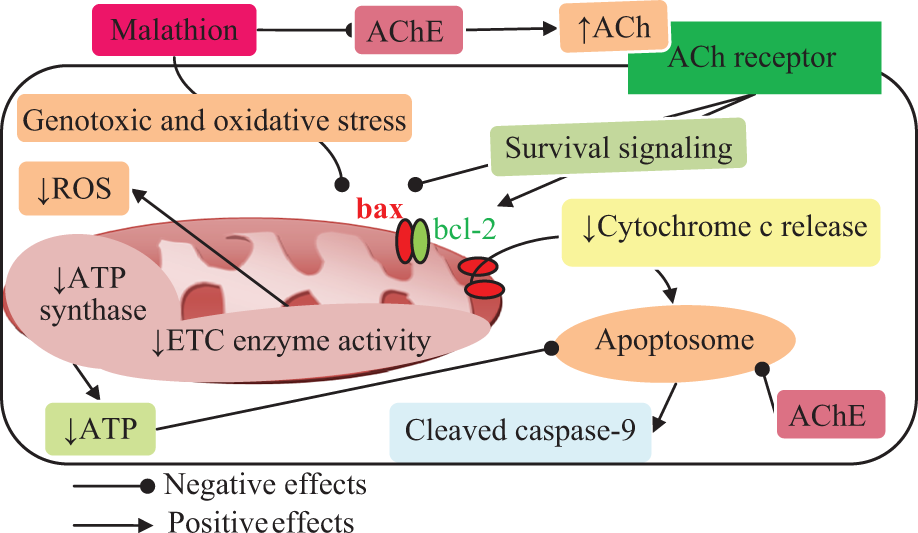
A simplified model outlining potential cellular mechanisms underlying the effects of malathion on mitochondrial function.
To indicate all changes and possible mechanisms collectively, we have drawn an image (Figure 9). We believe that cytotoxic effects of malathion cause mitochondrial dysfunction that is beyond its AChE inhibition properties and is possibly mediated through other pathways. Although, this idea has got some supports in recent years as the link between exposure to OPs and some human diseases has been proposed, 78 –81 current knowledge is not sufficient to confirm the exact involved mechanisms. The maintenance of mitochondrial integrity using artificial donors of electron and increasing levels of ATP inside tissues 82 are possible therapeutic strategies against OPs poisoning that should be further studied.
Footnotes
Authors’ Note
EA and MA equally contributed to this work.
Acknowledgments
The authors wish to thank Maryam Baeeri and Shekoufeh Hasani from Pharmaceutical Sciences Research Center and Sepideh Karroubi and Mahdi Gholami from Faculty of Pharmacy and INSF for their kind assistance.
Funding
This study was partially supported by Tehran University of Medical Sciences.