
Abstract
We have reported previously that phenethyl isothiocyanate (PEITC) induces apoptosis in human osteosarcoma U-2 OS cells. Cytotoxic activity of PEITC towards other cancer cells such as human malignant melanoma and skin cancer cells has not been reported. In this study, the anticancer activity of PEITC towards human malignant melanoma cancer A375.S2 cells was investigated. To determine the mechanisms of PEITC inhibition of cell growth, the following end points were determined in A375.S2 cells: cell morphological changes, cell cycle arrest, DNA damage and fragmentation assays and morphological assessment of nuclear change, reactive oxygen species (ROS) and Ca2+ generations, mitochondrial membrane potential disruption, and nitric oxide and 10-N-nonyl acridine orange productions, expression and activation of caspase-3 and -9, B-cell lymphoma 2 (Bcl-2)-associated X protein (Bax), Bcl-2, poly (adenosine diphosphate-ribose) polymerase, and cytochrome c release, apoptosis-inducing factor and endonuclease G. PEITC induced morphological changes in time- and dose-dependent manner. PEITC induced G2/M phase arrest and induced apoptosis via endoplasmic reticulum stress-mediated mitochondria-dependent pathway. Western blot analysis showed that PEITC promoted Bax expression and inhibited Bcl-2 expression associated with the disintegration of the outer mitochondrial membrane causing cytochrome c release, and activation of caspase-9 and -3 cascade leading to apoptosis. We conclude that PEITC-triggered apoptotic death in A375.S2 cells occurs through ROS-mediated mitochondria-dependent pathways.
Introduction
In Western countries, skin cancer melanoma is becoming more common and resulting in increased mortality. 1 Currently, several different treatments such as surgery, radiation, chemotherapy or a combination of radiotherapy with chemotherapy are used in patients with melanoma or skin cancer but the mortality remains high. 2 Several reports have shown that dietary intake of cruciferous vegetables in humans may decrease the risk of various types of malignancies. 3 Moreover, it is recognized that cruciferous vegetables contain the important component, organic isothiocyanates (ITCs), that may reduce the development of various malignancies. 4
Phenethyl ITC (PEITC; Figure 1), one of the ITC family compounds, has been shown to have cancer chemopreventive activity. 5 Several reports found that PEITC induced apoptosis in human non-small lung cancer A549 cells, 6 BCR-ABL and KBM5-T315I myeloid leukaemia cells, 7 colon cancer cells, 8 breast cancer cells 9 and prostate cancer (PC-3) cells. 10 PEITC was shown to inhibit cytochrome P450 enzymes and to induce phase II detoxification enzymes. 11 Recently, in our laboratory, we reported that PEITC induced apoptosis in human osteogenic sarcoma U-2 OS cells through the production of reactive oxygen species (ROS) and nitric oxide (NO). 12

The chemical structure of phenethyl isothiocyanate.
In male athymic mice carrying subcutaneously implanted PC-3 human prostate tumours, PEITC treatment by oral gavage resulted in the inhibition of tumour growth in vivo. 13 It was reported that PEITC inhibited angiogenesis in an ex vivo model. 14 Recently, it was shown in a transgenic model that dietary PEITC suppressed prostate cancer progression by the induction of autophagic cell death. 15 Furthermore, it was reported that PEITC targeted the Akt/Jun N-terminal kinase/myeloid cell leukemia-1 pathway in transformed and primary human leukaemia cells and inhibited the activity of tumour growth of a U937 xenograft model. 16 Numerous studies demonstrate that PEITC inhibited different types of cancer cell lines in vitro and also in vivo, but there is no report examining PEITC-induced apoptosis in human skin cancer cells. Therefore, in the present study, we investigated PEITC-induced inhibition of the growth of human melanoma A375.S2 cells in vitro. Our results indicate that PEITC inhibited cell growth by inducing apoptosis via ROS production and mitochondria-dependent pathways.
Materials and methods
Chemicals and reagents
PEITC, dimethyl sulphoxide (DMSO), 3-(4,5-dimethylthiazol-2-yl)-2,5-diphenyltetrazolium bromide (MTT), propidium iodide (PI), RNase A and Triton X-100 were purchased from Sigma-Aldrich Corp. (St Louis, Missouri, USA). For Western blotting assays, primary and secondary antibodies were purchased from Santa Cruz Biotechnology, Inc. (Santa Cruz, CA, USA).
Cell culture
The human malignant melanoma cancer cell line (A375.S2) was purchased from the Food Industry Research and Development Institute (Hsinchu, Taiwan). Cells were maintained in minimum essential medium supplemented with 10% fetal bovine serum, 1% antibiotics (100 units/ml penicillin and 100 μg/ml streptomycin) and 2 mM
Determinations of cell morphology and the percentage of viable A375.S2 cells
Approximately 2 × 10⁵ A375.S2 cells/well were plated into 12-well plates for cell adherence with three wells for different time levels. PEITC diluted in DMSO was then individually added to a final concentration of 0, 5, 10, 12.5 and 15 μM, and an equal amount of DMSO was added to the well as the control group. After treatment for 24 or 48 h, cells were examined and photographed under a phase-contrast microscope at 200× magnification to determine the cell morphology. The cells were then harvested for the determination of viability using a flow cytometric method (BD Bioscience, FACSCalibur flow cytometer, Becton-Dickinson, San Jose, CA, USA) as described previously. 17
Determination of cell cycle distribution in A375.S2 cells by flow cytometry
Flow cytometric analysis was used for the analysis of cell cycle distribution and sub-G1 phase as described previously. 18 At a density of 2 × 10⁵, A375.S2 cells/well on 12-well plates were incubated with 0, 5, 10 and 20 μM of PEITC, or only with vehicle (DMSO, 1% in culture media) for 24 and 48 h. After incubation, the cells on each well were trypsinized, washed with phosphate-buffered saline (PBS) and fixed with 70% ethanol overnight at −20°C. Cells were then washed twice with PBS and stained with PI working solution (100 μg/ml RNase A and 40 μg/ml PI and 0.1% Triton X-100) for cellular staining at room temperature for 1 h in darkness. Fractions of the cells in G0/G1, S and G2/M phase and sub-G1 (apoptosis) were analyzed using a FACSCalibur flow cytometer, and the data were analyzed with a ModFit program (BD Bioscience, FACSCalibur, Becton-Dickinson, San Jose, CA, USA) as described previously. 18
Comet assay of PEITC-induced DNA damage in A375.S2 cells
Cells at a density of 2 × 10⁵ cells/well were maintained in 12-well plates and grown for 24 h. The cells were incubated with PEITC at final concentrations of 0, 5, 12.5 and 20 μM, with DMSO (solvent) serving as a control and grown at 37°C in 5% CO2 and 95% air. The cells were then isolated for the examination of DNA damage using the comet assay as described previously. 19
4′,6-Diamidino-2-phenylindole staining of PEITC-induced apoptosis in A375.S2 cells
Cells at a density of 2 × 10⁵ cells/well were plated in 12-well plates and grown for 24 h and then the cells in each well were incubated with 0, 5, 10 and 20 μM of PEITC for 24 and 48 h; DMSO (solvent) was used as the control condition. Cells were grown at 37°C in 5% CO2 and 95% air. The cells were then stained with 4′,6-diamidino-2-phenylindole (DAPI) and photographed under fluorescence microscopy as described elsewhere.
20
In some experiments, cells were pretreated with an ROS scavenger (N-acetyl-
Assessment of apoptosis by flow cytometric assay and DNA gel electrophoresis
Apoptosis was measured with an Annexin V-fluorescein isothiocyanate (FITC)/PI detection kit (BD Pharmingen, San Diego, California, USA) or DNA gel electrophoresis. A375.S2 cells at a density of 2 × 10⁵ cells/well in 12-well plates were treated with 0, 5, 12.5 and 20 μM of PEITC for 24 h after which time they were harvested and analyzed by flow cytometry as described previously. 20 In some experiments, cells from each treatment were harvested for isolation of DNA by a DNA isolation kit (Genemark Technology Co., Ltd, Tainan, Taiwan) and DNA gel electrophoresis was performed as described previously. 21
Determination of ROS, the level of mitochondrial membrane potential (ΔΨ m), intracellular Ca2+ release, NO production and cardiolipin oxidation in A375.S2 cells
Cells (2 × 10⁵ cells/well) were cultured in 12-well plates for 24 h and then were treated with or without 10 μM of PEITC for 0.5, 1, 3, 6, 12, 24 and 48 h, and the changes in ROS, ΔΨ m, Ca2+ and NO were determined as described previously. 12,20,22 The cells from each treatment were individually harvested and washed with PBS twice, resuspended in 500 μl of 2,7-dichlorodihydrofluorescein diacetate (Invitrogen, Carlsbad, CA, USA; 10 μM) for ROS, 3,3′-dihexyloxacarbocyanine iodide (Invitrogen; 100 nmol/l) for ΔΨ m, Fluo-3/AM (2.5 μg/ml) for Ca2+ release, 4-amino-5-methylamino-2′,7′-difluorofluorescein (Invitrogen; 5 μM) for NO and 10-N-nonyl acridine orange (NAO; 500 nM) for cardiolipin oxidation. The cells were then incubated at 37°C for 30 min and were analyzed by flow cytometry as described previously. 12 In some experiments, cells were pretreated with an ROS scavenger (NAC) and then treated with PEITC and ROS levels of a percentage of viable A375.S2 cells were determined. 19
Caspase-3 activity determinations by flow cytometry
Cells (2 × 10⁵ cells/well) were cultured in 12-well plates for 24 h and then treated with 10 μM PEITC for 0, 12, 24, 36 and 48 h. At the end of the incubation, cells were harvested by centrifugation. The cell pellets were treated with 50 μl of 10 μM caspase-3 substrate (PhiPhiLux®-G1D2, OncoImmunin, Inc., Gaithersburg, Maryland, USA). All the samples were then incubated at 37°C for 60 min. Flow cytometry was used to quantify caspase-3 activity. 23
Western blotting analysis for protein levels
The levels of various intracellular proteins associated with apoptosis were examined. Cells (1 × 10⁶ cells/well) were placed on six-well plates for 24 h and then were treated with 12.5 μM of PEITC or DMSO solvent for 0, 12, 24, 36 and 48 h. The cells were harvested and washed twice with cold PBS and then scraped, washed twice and centrifuged at 1000g for 5 min at 4°C. Pellets were resuspended in PRO-PREP™ protein extraction solution (iNtRON Biotechnology, Seongnam, Gyeonggi-Do, Korea) to lyse the cells as described previously 24 and then incubated for 3 h at −20°C. Each lysate was collected by centrifugation at 12,000g for 30 min at 4°C, and the supernatant was stored at −20°C. Total protein samples (20 μg) were loaded on a 12% sodium dodecyl sulfate polyacrylamide gel electrophoresis gel and incubated with specific primary antibodies (Santa Cruz Biotechnology Inc.) followed by secondary antibodies. All the blots from each treatment were detected using an ECL kit (Millipore, Bedford, Massachusetts, USA) and autoradiography using x-ray film according to the manufacturer’s instructions. β-Actin served as a loading control. 23
Immunofluorescence staining and confocal laser scanning microscopy
Cells at a density of 5 × 10⁴ cells/well were plated on four-well chamber slides and then were treated with 10 μM of PEITC for 24 h. The cells were then fixed in 3% formaldehyde in PBS for 15 min followed by permeabilization with 0.1% Triton X-100 in PBS for 1 h with blocking of non-specific binding sites using 2% bovine serum albumin. 12 Primary antibody anti-GADD153 (1:100) was used to stain the fixed cells overnight and then stained with a secondary antibody (FITC-conjugated goat anti-mouse immunoglobulin G at 1:100 dilution; green fluorescence) followed by nuclei counterstaining using PI (red fluorescence). Photomicrographs were obtained using a Leica TCS SP2 (Heidelberg, Germany) confocal spectral microscope. 18
Statistical analysis
All the values from three separate experiments are expressed as mean ± SD. Student’s t test was used to compare the difference between control and concentration treatments in each group. A p < 0.05 was considered statistically significant.
Results
Effects of PEITC on cell morphology and viability of A375.S2 cells
Anti-growth effects of PEITC on A375.S2 cells were determined using flow cytometry and by photography using a phase-contrast microscope. Cells were treated with various concentrations (0, 5, 10, 12.5 and 15 μM) of PEITC or DMSO for 24 and 48 h. The cells were then examined and photographed under a phase-contrast microscope at 200× for cell morphological changes, which can be seen in Figure 2(a), showing that PEITC induced cell morphological changes in a dose-dependent manner. The total cell number from each group was determined by flow cytometry and the results are shown in Figure 2(b), which indicated that PEITC at concentrations of 5–15 μM inhibited cell growth in a concentration- and time-dependent manner (Figure 2(b)) with a half maximal inhibitory concentration of 12.5 μM after the 48 h treatment.

The effects of PEITC on the cell morphological changes and the percentage of viability from human malignant melanoma A375.S2 cells. A375.S2 cells at a density of 2 × 10⁵ cells/well in 12-well plate were treated with 0, 5, 10, 12.5 and 15 μM of PEITC at different time periods and then the cell morphology were examined and photographed by phase-contrast microscope (a). After cells from each treatment were photographed, they were harvested for the determinations of percentage of viable cells (b), as described in Materials and Methods section. Data are presented as mean ± SD in triplicate. A p < 0.05 is significantly different compared with PEITC and DMSO-treated groups. PEITC: phenethyl isothiocyanate; DMSO: dimethyl sulphoxide.
Effects of PEITC on cell cycle distribution of A375.S2 cells
To evaluate the cell cycle distribution of A375.S2 cells with or without PEITC treatment, the DNA content was measured by flow cytometry. As shown in Figure 3(a) to (c), exposure to 5–20 μM PEITC caused an increase in the G2/M phase fraction from 12 to 50%, as compared to control samples for 24 h and these effects were dose- and time-dependent (Figure 3(b) and (c)). These data suggest that the induction of G2/M phase arrest accounts for the inhibitory effects of PEITC on cell growth of A375.S2 cells.

The effects of PEITC on the G2/M phase arrest in A375.S2 cells. Cells at a density of 2 × 10⁵ cells per well were placed in 12-well plates and then were treated with 0, 5, 10 and 20 μM of PEITC for 24 and 48 h. The cells were harvested for evaluating the cell cycle distribution by flow cytometric assay, as described in Materials and Methods section. (a) The representative of profiles of DNA content; (b and c) the percentage of cells in G0/G1, S and G2/M phase in A375.S2 cells. Data revealed a representative experiment in triplicate with similar results. PEITC: phenethyl isothiocyanate.
Effects of PEITC on DNA damage and chromatin condensation in A375.S2 cells
For investigating PEITC-induced DNA damage and chromatin condensation, the A375.S2 cells were treated with various concentrations of PEITC and then the cells were isolated for comet assay and DAPI staining. The results are shown in Figure 4(a) to (d), which indicate that PEITC induced DNA damage as seen by the longer comet tail (Figure 4(a) and (b)) and condensation shown by an increase in fluorescence intensity (Figure 4(c) and (d)). The higher the PEITC concentration, the greater the length of the comet tail (Figure 4(a)) and the lower the number of cells (Figure 4(d)) with high fluorescent intensity. These results indicate that more DNA damage and chromatin condensation occurred in A375.S2 cells and effects were concentration-dependent.

The effects of PEITC on the DNA damage and apoptosis in A375.S2 cells. A375.S2 cells at a density of 2 × 10⁵ cells/well were maintained in 12-well plates and grown for 24 h. The cells were incubated with 0, 5, 10 and 20 μM of PEITC for 24 h and then were isolated for the examination of DNA damage using the comet assay (a and b) or for the examination of apoptosis using DAPI staining (c and d) and photographed under fluorescence microscopy as in Materials and Methods section. PEITC: phenethyl isothiocyanate; DAPI: 4′,6-diamidino-2-phenylindole.
Effects of PEITC on apoptosis and DNA fragmentation in A375.S2 cells
Apoptosis of A375.S2 cells after exposure to 10 μM of PEITC for 0, 6, 12 and 24 h was determined by flow cytometry using Annexin V-FITC/PI (Figure 5(a)). The percentage of Annexin V-FITC binding of A375.S2 cells significantly increased in a time-dependent manner after treatment for 6–24 h (8.1–38.6%, p < 0.01; Figure 5(a)). A lower percentage of untreated A375.S2 (3.49%) cells bound to Annexin V-FITC (Figure 5(a)). The treatment of A375.S2 cells with PEITC induced the formation of a DNA ladder (Figure 5(b)). Apoptosis-related DNA laddering was visible after treatment with 5 or 20 μM of PEITC and the control cells did not display changes (lane 1; Figure 5(b)).

The effects of PEITC on the apoptotic death of A375.S2 cells. Cells at a density of 2 × 10⁵ cells/well were placed in 12-well plates and then were treated with 0, 5, 12.5 and 20 μM of PEITC for examining the apoptosis. The cells were harvested for determining the Annexin V-positive/PI-negative cell (apoptotic cells; a) or were harvested for DNA isolation and then DNA gel electrophoresis was performed (b), as described in Materials and Methods section. The results are shown as a mean ± SD (n = 3); (a) is significantly different (p < 0.05) compared to control. PEITC: phenethyl isothiocyanate; PI: propidium iodide.
Effects of PEITC on ROS production, level of mitochondrial membrane potential (ΔΨ m), intracellular Ca2+ release, NO production and cardiolipin oxidation in A375.S2 cells
Cells were treated with 10 μM of PEITC for various time periods to determine the effects on ROS, Ca2 +, NO and NAO and loss of ΔΨ m. The data are shown in Figure 6(a) to (e). PEITC increased the levels of ROS (Figure 6(a)) and Ca2+ (Figure 6(c)) but decreased the levels of ΔΨ m (Figure 6(b)) and increased the levels of NO (Figure 6(d)) and cardiolipin oxidation (Figure 6(e)) in A375.S2 cells. These effects occurred in a time-dependent manner.

The effects of PEITC on ROS production, the level of mitochondrial membrane potential (ΔΨ m), intracellular Ca2+ release, NO and NAO productions in A375.S2 cells. A375.S2 cells were placed in 12-well plates for 48 h and then were treated with or without 10 μM of PEITC for various time periods. The cells from each treatment were harvested and washed with PBS twice, resuspended in 500 μl of 2,7-dichlorodihydrofluorescein diacetate (10 μM) for ROS (a), 3,3'-dihexyloxacarbocyanine iodide (1 μmol/l) for ΔΨ m (b), Fluo-3/AM (2.5 μg/ml) for Ca2+ release (c), DAF-FM (5 μM) for NO (d) and NAO (e) (500 nM) for NAO. The cells were then incubated at 37°C for 30 min and the caspase-3 substrate solution (PhiPhiLux®-G1D2 for caspase-3; 10 μM) (f) were incubated at 37°C for 60 min before flow cytometric analysis as in Materials and Methods section. Columns, mean (n = 3); bars, SD. p < 0.05 is significantly different compared with control. ROS: reactive oxygen species; NO: nitric oxide; NAO: 10-N-nonyl acridine orange; DAF-FM: 4-amino-5-methylamino-2′,7′-difluorofluorescein; PEITC: phenethyl isothiocyanate.
Effects of PEITC on caspase-3 activity in A375.S2 cells
Cells were treated with 10 μM of PEITC for various time periods and caspase-3 activity was determined. Data in Figure 6(f) indicate that PEITC induced caspase-3 activation in a time-dependent manner suggesting that PEITC-induced apoptosis occurs through activation of caspase-3.
Effects of PEITC on the G2/M arrest and apoptosis-associated proteins in A375.S2 cells
For investigating the molecular mechanisms of PEITC-induced G2/M phase arrest in A375.S2 cells, G2/M phase-modulated relative protein levels were examined. Results indicated that the levels of cyclin-dependent kinase 1 (CDK1), checkpoint kinase 1 (Chk1), Chk 2, Wee1, tumour protein 53 (p53) and CDK 1A (p21) increased but that the levels of cell division cycle 25°C (CDC25C) and cyclin A decreased (Figure 7(a)) in PEITC-treated A375.S2 cells. The levels of p53 and p21 were upregulated, but the levels of CDC25C and cyclin A were downregulated, leading to G2/M phase arrest. Based on these results, we suggest that PEITC-induced G2/M phase arrest in A375.S2 cells is involved through CDC25C/cyclin A/p53/p21 signalling. We further examined the effects of PEITC on apoptosis-associated proteins and those results are shown in Figure 7(b) to (f). PEITC stimulated the levels of B-cell lymphoma 2 (Bcl-2)-associated X protein (Bax; Figure 7(b)), cytochrome c, apoptotic protease activating factor 1(Apaf-1), caspase-9 and -3, apoptosis inducing factor (AIF) and endonuclease G (Endo G; Figure 7(c)) but reduced the levels of Bcl-2 and poly (adenosine diphosphate-ribose) polymerase (PARP). In addition, Figure 7(d) shows that PEITC increased the levels of glucose-regulated protein 78 kDa (GRP78) and DNA damage-inducible gene 153 (GADD153), which are the hallmarks of endoplasmic reticulum (ER) stress. PEITC also promoted the levels of inducible NO synthase (i-NOS), catalase, superoxide dismutase (SOD; zinc (Zn)/copper (Cu)) and SOD (manganese (Mn)), which can be seen in Figure 7(f). In contrast, PEITC decreased the levels of caspase-8, Fas and Fas ligand (Fas L) indicating that PEITC-induced cell death did not occur via a Fas-dependent pathway.

The effects of PEITC on the G2/M arrest and apoptosis-associated proteins in A375.S2 cells. Cells (1 × 10⁶ cells/well) seeded into six-well plates were treated with 10 μM of PEITC for 0, 12, 24, 36 and 48 h and then harvested to perform western blotting to examine the protein levels of CDC25C, CDK1, Chk1, Chk2, cyclin A, Wee1 p53 and p21 (a); Bax, Bcl2 and Bid (b); Apaf-1, caspase-9 and -3, PARP, AIF and Endo G (c); GRP 78 and GADD153 (d); caspase-8, Fas and FasL (e); i-NOS, catalase, SOD (Cu/Zn) and SOD (Mn) as described in Materials and Methods section. PEITC: phenethyl isothiocyanate; CDK1: cyclin-dependent kinase 1; Chk1: checkpoint kinase 1; Chk2: checkpoint kinase 2; CDC25C: cell division cycle 25°C; Bax: B-cell lymphoma 2-associated X protein; Bcl-2: B-cell lymphoma 2; Bid: a pro-apoptotic member of the Bcl-2 family; SOD: superoxide dismutase; i-NOS: inducible nitric oxide synthase; PARP: poly (adenosine diphosphate-ribose) polymerase; Endo G: endonuclease G; AIF: apoptosis inducing factor.
Effects of PEITC on Endo G expression in A375.S2 cells
A375.S2 cells were treated with 10 μM PEITC for 12 h and the levels of Endo G were determined. Data in Figure 8 show that PEITC promoted Endo G levels in A375.S2 cells.

The effects of PEITC on the Endo G expression in A375.S2 cells. A375.S2 cells at a density 5 × 10⁴ cells/well were placed on four-well chamber slides, were treated with 10 μM of PEITC for 24 h and then were fixed. Primary antibody anti-Endo G (1:100) was used to stain the fixed cells overnight and then stained with secondary antibody (FITC-conjugated goat anti-mouse IgG at 1:100 dilution; green fluorescence) followed by nuclei counterstaining which was with PI (red fluorescence). Photomicrographs were obtained using a Leica TCS SP2 confocal spectral microscope as described in Materials and Methods section. PEITC: phenethyl isothiocyanate; PI: propidium iodide; Endo G: endonuclease G; FITC: fluorescein isothiocyanate; IgG: immunoglobulin G.
Effects of PEITC on ROS production, viable cell number and DAPI staining in A375.S2 cells
To investigate whether or not ROS production is involved in PEITC-induced cell death in A375.S2 cells, the cells were pretreated with an ROS scavenger (NAC) and then were treated with PEITC. Results seen in Figure 9(a) to (c) indicate that NAC pretreatment led to an increase in the percentage of viable cells (Figure 9(a)), but decreased chromatin condensation (Figure 9(b)) and ROS levels (Figure 9(c)). Based on these observations, we conclude that PEITC-induced cell death in part involves the production of ROS in A375.S2 cells.
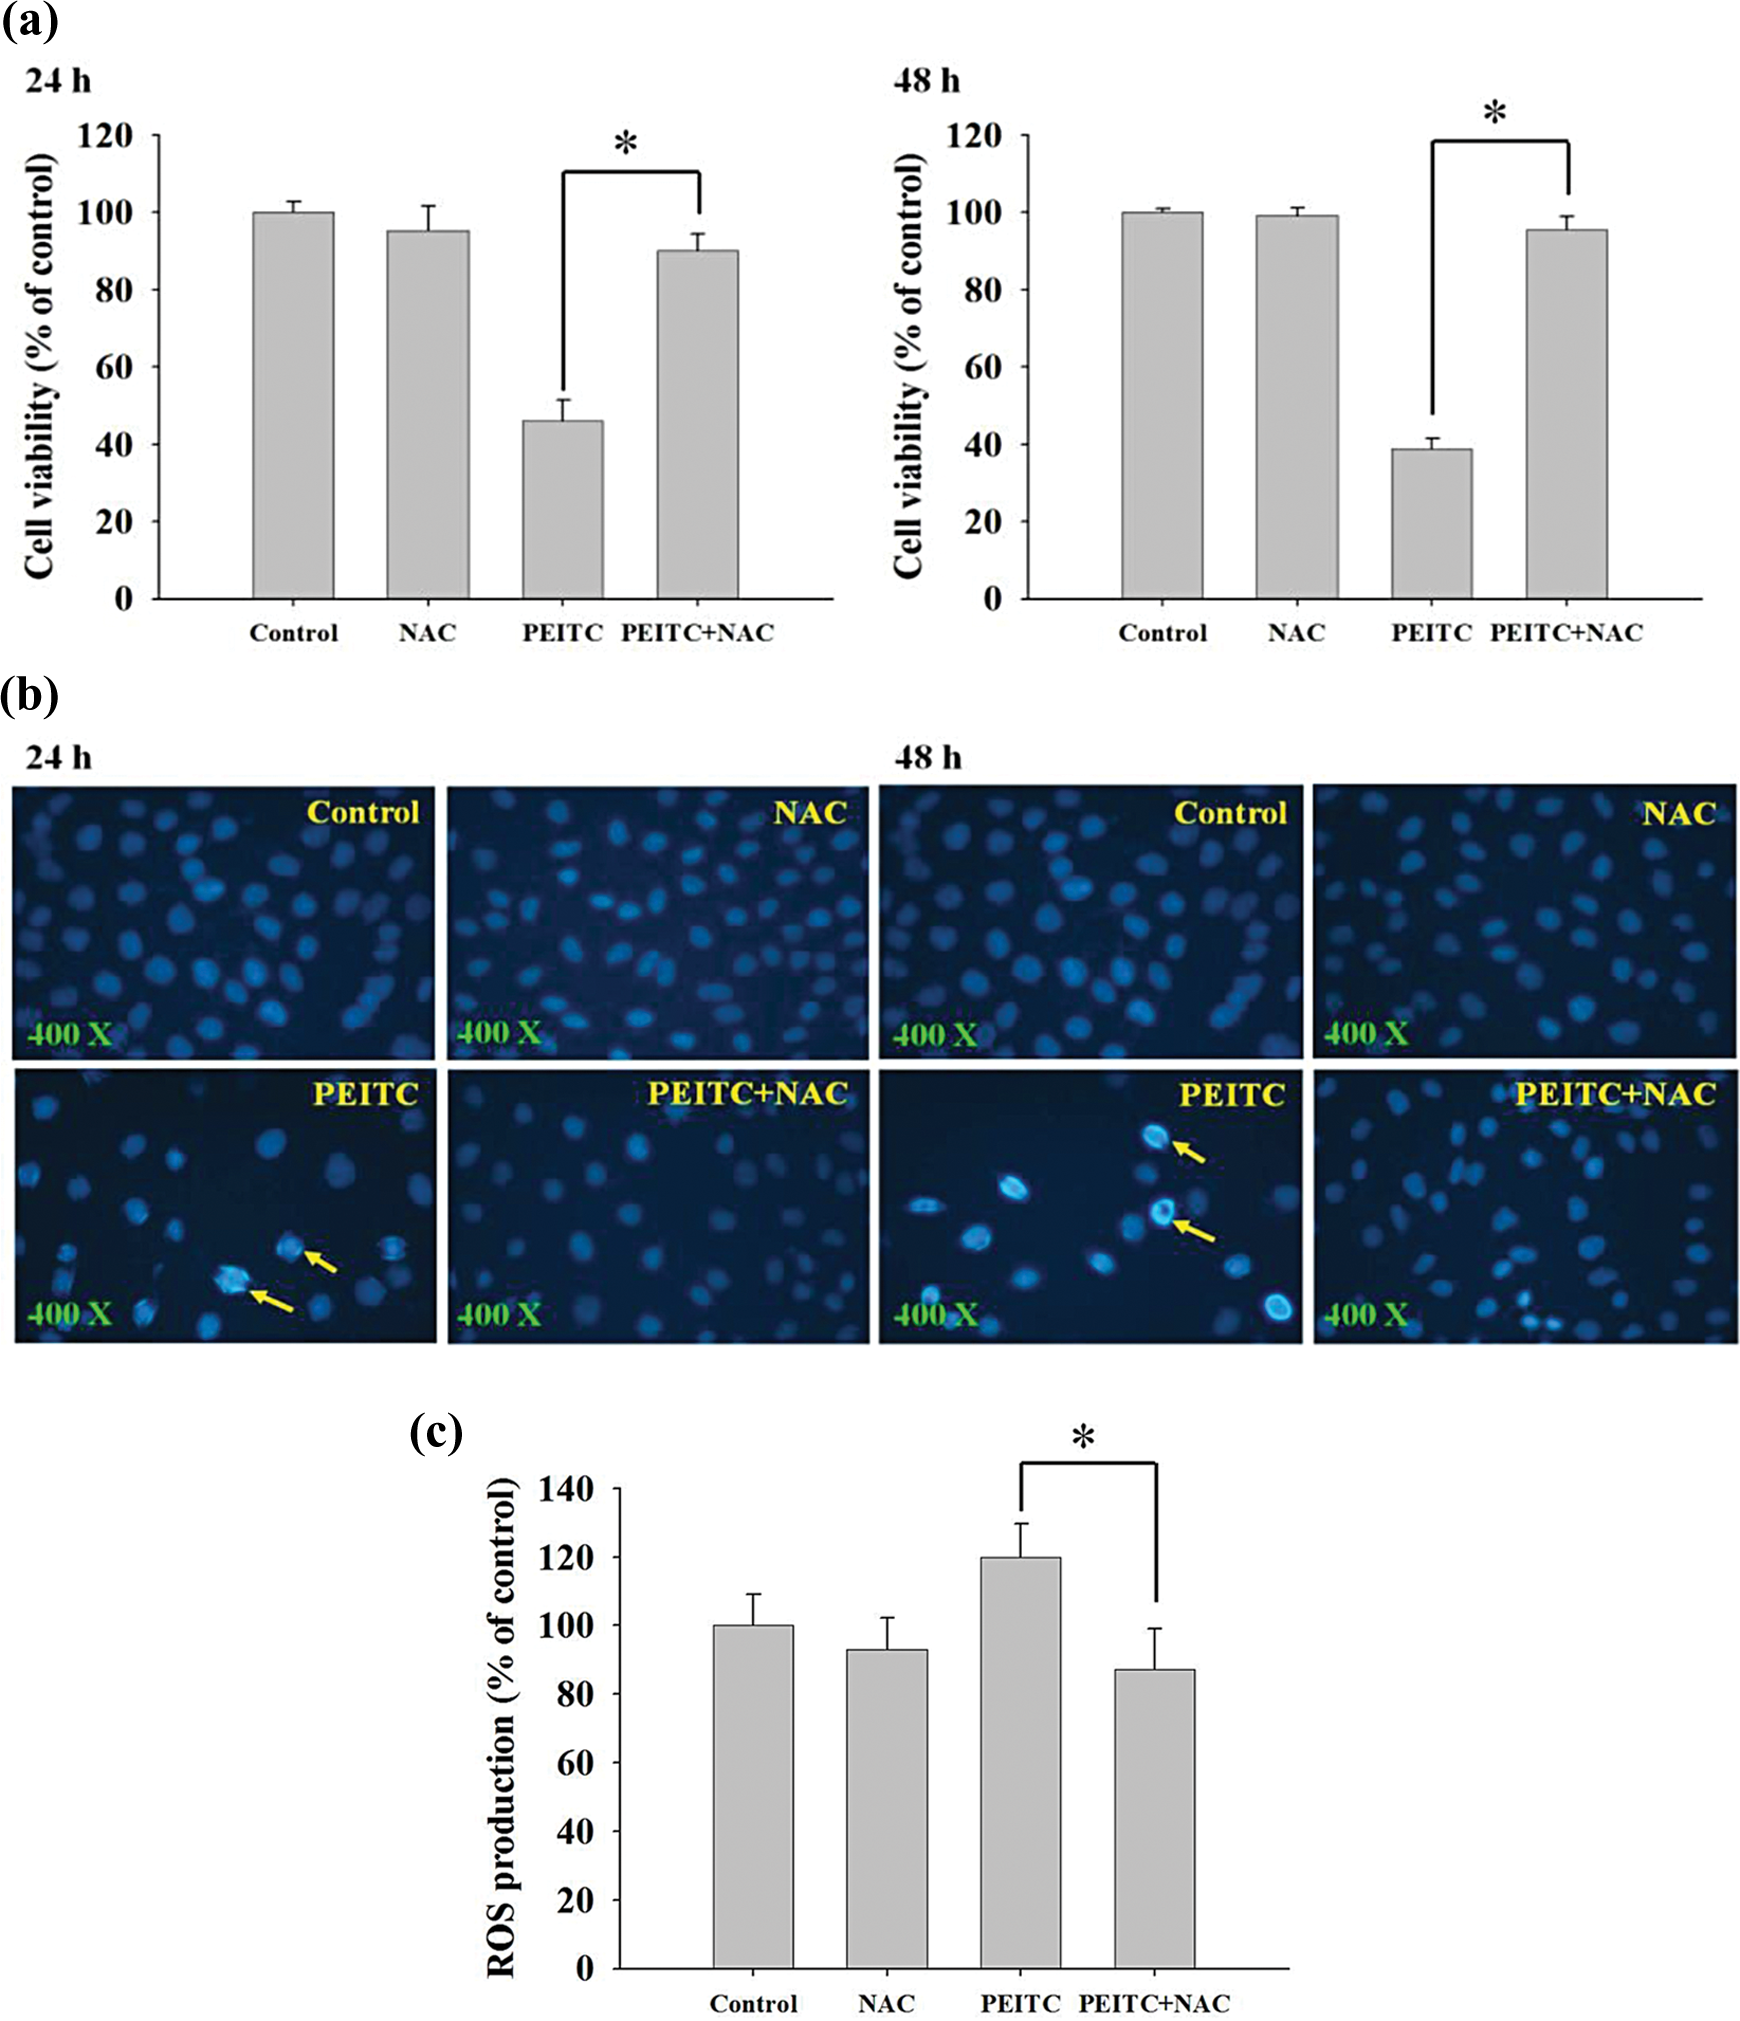
The effects of PEITC on the ROS production, viable cell number and DAPI staining in A375.S2 cells. A375.S2 cells (3 × 10⁵ cells/well) were placed in six-well plates and then were pretreated with ROS scavenger (NAC). The cells were then treated with 10 μM of PEITC for 24 h and were harvested for measuring the percentage of viable cells (a), DAPI staining (b) and the levels of ROS production (c) as described in Materials and Methods section. PEITC: phenethyl isothiocyanate; ROS: reactive oxygen species; DAPI: 4′,6-diamidino-2-phenylindole; NAC: N-acetyl-
Discussion
PEITC induces apoptosis in different human cancer cells. 8,9,12,25 There has not been, however, an information on PEITC-induced apoptosis in human melanoma cells. In the present study, we demonstrate that PEITC was cytotoxic towards human melanoma A375.S2 cells in vitro. It was reported that cell cycle control represents a major regulatory mechanism of cell growth. 26 Thus, if an agent can block the cell cycle, then it would be an effective strategy for the development of novel cancer therapies. 27
In this study, from cell cycle analysis of the PEITC-treated cells, it is inferred that PEITC induced a concentration-dependent G2/M phase cell cycle arrest with an accompanied decrease in G1 and S phase (Figure3 (a) to (c)). This confirmed that PEITC induced DNA fragmentation (Figure 5(b)) that may induce a block at the G2/M boundary. PEITC also decreased the levels of CDC25C and cyclin A (Figure 7(a)). Induction of apoptosis was observed by p53 activation and increased generations of ROS. The cell-cycle arrest and apoptotic death have shown that they are dependent on the activity of p53. 28 –30 Cell cycle arrest may partially contribute to the induction of apoptosis and cytotoxic effects by PEITC in A375.S2 cells.
It is well documented that apoptosis is a highly regulated death process and it plays an important role in anti-carcinogenesis. 31 Our results from DNA gel electrophoresis showed DNA laddering formation (Figure 5(b)) and the appearance of apoptotic bodies obtained from DAPI staining (Figure 4(c)); and flow cytometric analysis utilizing Annexin V-FITC/PI staining showed that PEITC-induced apoptosis in A375.S2 cells. It was reported that apoptosis is an active process in the cells after exposure to apoptosis induction resulting in activation of endonucleases and cleavage of DNA into fragments of 180–200 base pairs. 32
We therefore assessed the changes in the levels of ROS, Ca2+, mitochondrial membrane potential, NO and NAO in A375.S2 cells and we also examined the expression of apoptosis-related proteins. PEITC generated ROS, Ca2+, NO and cardiolipin oxidation in a time-dependent manner in A375.S2 cells but PEITC decreased the levels of ΔΨ m that also were time-dependent. It was reported that increased levels of ROS can cause mitochondrial membrane depolarization; 33 and the mitochondrial membrane depolarization is one of the earliest intracellular events in apoptosis. 34 In addition, ER stress was associated with PEITC treatment in A375.S2 cells and markers of ER stress GRP78 and GADD153 were elevated (Figure 7(d)).
We conclude that ROS generation by PEITC was responsible for the disruption of mitochondrial membrane potential. NAC, an ROS scavenger, inhibited the effects of PEITC (Figure 9(c)) on DNA condensation (Figure 9(b)) and increased the percentage of viable cells (Figure 9(a)). Moreover, PEITC promoted levels of catalase and SOD (Zn/Cu) and SOD (Mn; Figure 7(f)) that could contribute to ROS production. These results suggest that PEITC-induced intracellular ROS production plays an important role in eliciting early signals for triggering apoptosis in A375.S2 cells.
PEITC promoted proapoptotic protein such as Bax and decreased the antiapoptotic protein such as Bcl-2 (Figure 7(b)), which increased the ratio of Bax/Bcl-2 and was associated with a decrease in ΔΨ m (Figure 6(b)). This finding is in agreement with other reports showing that a high Bax/Bcl-2 ratio was associated with cytochrome c release. 35 It was reported that a decreased mitochondrial membrane potential (ΔΨ m) regulated the mitochondrial permeability transition pore opening, 36 which was also associated with cytochrome c release. 37 Cytochrome c release from mitochondria forms an apoptosome together with Apaf-1 and pro-caspase-9, resulting in the activation of caspase-9 inducing the pro-caspase-3 and apoptosis. 38 We found that PEITC promoted the activation of caspase-9 and -3 and decreased levels of PARP (Figure 7(c)). PARP represents an intrinsic substrate for caspase-3, 39 and it is cleaved upon caspase-3 activation, and the cleavage of PARP is an early and critical event required for tumour cells apoptosis. 40
Natural products possess antitumour activity in various human cancer cell lines in vitro and even in xenograft systems of human tumours in vivo. Such agents may be the promising candidates for novel anticancer agents. For instance, genistein has been recognized as having potential in breast cancer chemoprevention 41 and to induce apoptosis through a mitochondria-dependent pathway. 42 Taxol has been used clinically as an anticancer agent 43 and it also induces apoptosis in many different human cancer cell lines. 44 PEITC may be promising in cancer therapy but much more experiments are needed to confirm its utility in vivo.
In conclusion, our results showed that PEITC inhibited the growth of A375.S2 cells in a dose- and time-dependent manner and reduced cell viability via G2/M phase arrest, which was accompanied by apoptotic cell death. PEITC-induced apoptosis by an ER stress and mitochondria-dependent pathway in A375.S2 cells.
Footnotes
Authors’ Note
C-CY and J-GC contributed equally to this work.
Funding
This work was supported by the grants CMU100-S-14 and CMU99-ASIA-23 from China Medical University, Taichung, Taiwan.