
Abstract
Background:
Methanol, acetaldehyde, acetone, and ethanol, which are commonly used as biomarkers of several diseases, in acute intoxications, and forensic settings, can be detected and quantified in biological fluids. Gas chromatography (GC)–mass spectrometry techniques are complex, require highly trained personnel and expensive materials. Gas chromatographic determinations of ethanol, methanol, and acetone have been reported in one study with suboptimal accuracy. Our objective was to improve the assessment of these compounds in human blood using GC with flame ionization detection.
Methods:
An amount of 50 µl of blood was diluted with 300 µl of sterile water, 40 µl of 10% sodium tungstate, and 20 µl of 1% sulphuric acid. After centrifugation, 1 µl of the supernatant was inje-cted into the gas chromatograph. We used a dimethylpolysiloxane capillary column of 30 m × 0.25 mm × 0.25 µm.
Results:
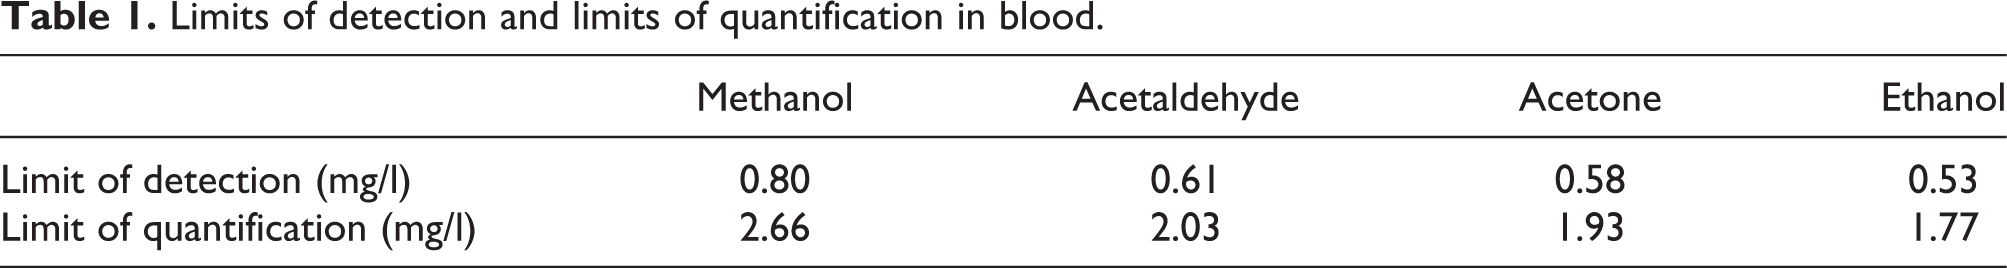
We observed linear correlations from 7.5 to 240 mg/l for methanol, acetaldehyde, and acetone and from 75 to 2400 mg/l for ethanol. Precision at concentrations 15, 60, and 120 mg/l for methanol, acetaldehyde, and acetone and 150, 600, and 1200 mg/ml for ethanol were 0.8–6.9%. Ranges of accuracy were 94.7–98.9% for methanol, 91.2–97.4% for acetaldehyde, 96.1–98.7% for acetone, and 105.5–111.6% for ethanol. Limits of detection were 0.80 mg/l for methanol, 0.61 mg/l for acetaldehyde, 0.58 mg/l for acetone, and 0.53 mg/l for ethanol.
Conclusion:
This method is suitable for routine clinical and forensic practices.
Introduction
Volatile compounds such as methanol, acetaldehyde, acetone, and ethanol are commonly used as biomarkers of several diseases or in acute intoxications. They can be detected and quantified in biological fluids. The quantification of methanol in blood is of critical importance for the diagnosis of criminal or accidental methanol poisoning, which is associated with a high mortality rate despite intensive care therapy. 1,2 Acetaldehyde is a major metabolite of ethanol. Additionally it can be ingested as a contaminant of food and alcoholic drinks. 3 It is a known genotoxic and carcinogenic agent. 4 Acetone is produced endogenously as a physiologic product during the breakdown of fatty acids in the absence of carbohydrates via the production of acetoacetic acid and the release of carbon dioxide. An increase in ketone bodies and high blood acetone concentration can occur during starvation, in diabetic ketoacidosis, or in intoxication with alcohol or salicylates. 5 –7 Blood acetone can also be measured as a biomarker of occupational exposure. 8 Ethanol consumption is under strict regulations in a number of circumstances, including driving and working, and legal blood alcohol concentration limits for driving are well established. Reliable information on blood ethanol is commonly needed in forensic medicine and crime investigation. 9
The analysis of methanol, acetaldehyde, acetone, and ethanol has been reported using gas chromatography–mass spectrometry (GC-MS) techniques. 10 However, GC-MS techniques are more complex than GC-flame ionization detection and require highly trained personnel and expensive materials. Gas chromatographic determinations of ethanol, methanol, and acetone have been reported in one study with suboptimal accuracy and 1-propanol as internal standard. 11 Since 1-propanol can be found in the post-mortem blood sample, alternative internal standards have been recommended. 12 We present an easy and rapid GC method allowing blood methanol, acetaldehyde, acetone, and ethanol determinations in clinical and forensic settings.
Methods
Reagents
All chemicals used were of analytical grade: ethanol (>99.9%, Normapur, VWR, Fontenay-sous-Bois, France, lot 07K210537), methanol (>99.9%, Lichrosolv, Merck, Darmstadt, Germany, lot I563518043), acetaldehyde (>99.5%, Fluka, Saint-Quentin Fallavier, France, lot STBC3551 V), acetone (>99.9%, Normapur, VWR, Fontenay-sous-Bois, France, lot 0603549), and tert-butanol (> 99.5%, Carlo Erba, Val de Reuil, France, lot P0F045080I). Sterile water was obtained from Fresenius Kabi (Versylene, Sèvres, France). Sulphuric acid was obtained from Merck and sodium tungstate was obtained from Riedel-de Haën (Seelze, Germany).
Calibration procedures
Concentrated solutions of 50 g/l methanol, 50 g/l acetaldehyde, 50 g/l acetone, and 500 g/l ethanol were freshly prepared daily by diluting the commercial solutions in sterile water. Daily prepared 2 g/l tert-butanol in sterile water was used as internal standard. Stock calibrators containing 1 g/l methanol, 1 g/l acetaldehyde, 1 g/l acetone, and 10 g/l ethanol were prepared daily in the blood sample, from the concentrated solutions. These procedures resulted in final concentrations of 7.5, 15, 30, 60, 120, and 240 mg/l of acetaldehyde, acetone, and methanol, and of 75, 150, 300, 600, 1200, and 2400 mg/l of ethanol. Sodium tungstate and sulphuric acid were used for the precipitation of blood proteins. 13
An amount of 50 µl from these calibration standards were added to 300 µl of sterile water, 50 µl of internal standard, 40 µl of 10% sodium tungstate, and 20 µl of 1% sulphuric acid. Each tube was vortex-mixed and centrifuged at 15,000g for 5 min at 4°C. A fixed volume of supernatant (1 µl) was injected into the chromatographic system.
Sample preparation
Blood samples of 50 µl were added to 300 µl of sterile water, 50 µl of internal standard, 40 µl of 10% sodium tungstate, and 20 µl of 1% sulphuric acid. They were centrifuged, and 1 µl of the supernatant was injected into the gas chromatograph.
Analytical instrument settings
The method was adapted from Pontes et al. 11 The gas chromatograph used was a Thermo-Finnigan model Focus GC equipped with a flame ionization detector (FID; Thermo Finnigan, Rodano, Italy). The injection port of the chromatograph was installed with a glass liner appropriated for split analysis, to prevent gas chromatographic column contamination with non-volatile material from blood. The analyses were performed under the following chromatographic conditions: column, Uptibond 1 premium, 30 m × 0.25 mm × 0.25 µm (Interchim, Montluçon, France). The temperature of the FID was 220°C, and the injector temperature was 220°C. The oven temperature was programmed to 40°C (for 2 min), followed by an increase of 5°C/min until 200°C. The carrier gas was helium with a flow of 1.2 ml/min. The injection of blood was performed with a 10-µl Hamilton syringe with a removable needle, cleaned under vacuum before and after each injection with deionised water. The volume of injection was 1 µl with a split ratio of 100 and a split flow of 120 ml/min.
Validation experiments and acceptance criteria
Method linearity was determined by evaluating the regression curve. The line of best fit for the relationship between the ratio of peak area and internal standard area and the concentration of analytes in the samples was determined by linear regression performing calibration curves in the considered concentrations ranges (7.5–240 mg/l for acetaldehyde, acetone, and methanol and 75–2400 mg/l for ethanol). The slopes were based on the mean of six curves on six consecutive days.
Intra-day precision was determined by injecting six independent calibrators containing 150, 600, and 1200 mg/l of ethanol and 15, 60, and 120 mg/l of acetaldehyde, acetone, and methanol on the same day. Inter-day precision was evaluated by analysing, for 3 consecutive days, daily prepared calibrators of each concentration considered for intra-day precision.
To determine the sensitivity of the method, the calibrators with the lowest concentrations (7.5 mg/l for methanol, acetaldehyde, and acetone and 75 mg/l for ethanol) were progressively diluted to determine the limit of detection (LOD) and limit of quantitation (LOQ). A signal-to-noise ratio of 3:1 was considered acceptable for estimating the LOD. The concentration that originated the peak with a signal-to-noise ratio of 3:1 was injected five times.
The LOQ was estimated based on a signal-to-noise ratio of 10:1 obtained for calibrating the solutions containing the compounds of interest. The LOQ corresponds to the lowest concentration obtained by successive dilutions of standards that originate a sharp and symmetrical chromatographic peak, required for routine analysis.
Accuracy was assessed as the percentage difference of the mean calculated concentration at each concentration level from the corresponding nominal concentration. We tested three concentration levels and three repetitions per level during the 3 days. 14
Selectivity was assessed by testing chromatographic profiles of blood samples spiked with formaldehyde, ethylene glycol, propylene glycol, and glycerol.
Results
Gas chromatographic separation
Interference products were ruled out by verifying the absence of peaks in the retention times of the study products (Figures 1(a) and (b)). As shown in Figure 1, the retention times for methanol, acetaldehyde, ethanol, and acetone were 2.72, 3.42, 6.50, and 7.93 min, respectively. The internal standard (tert-butanol) retention time was 10.98 min.

Gas chromatograms of methanol, acetaldehyde, ethanol, and acetone. Representative chromatograms obtained from blood sample with internal standard (a) and calibrator solutions prepared in blood with peak identification and retention times of the quantified compounds (b) Methanol, MeOH; acetaldehyde, ACTD.
Method validation
Linearity
Regression analysis of calibration data achieved satisfactory linearity over the considered concentration range. Square correlation coefficients (R 2 ) were always >0.99, indicating a linear relationship from 7.5 to 240 mg/l for methanol, acetaldehyde, and acetone and from 75 to 2400 mg/l for ethanol in blood. The slopes and square correlation coefficients are presented in Figure 2.
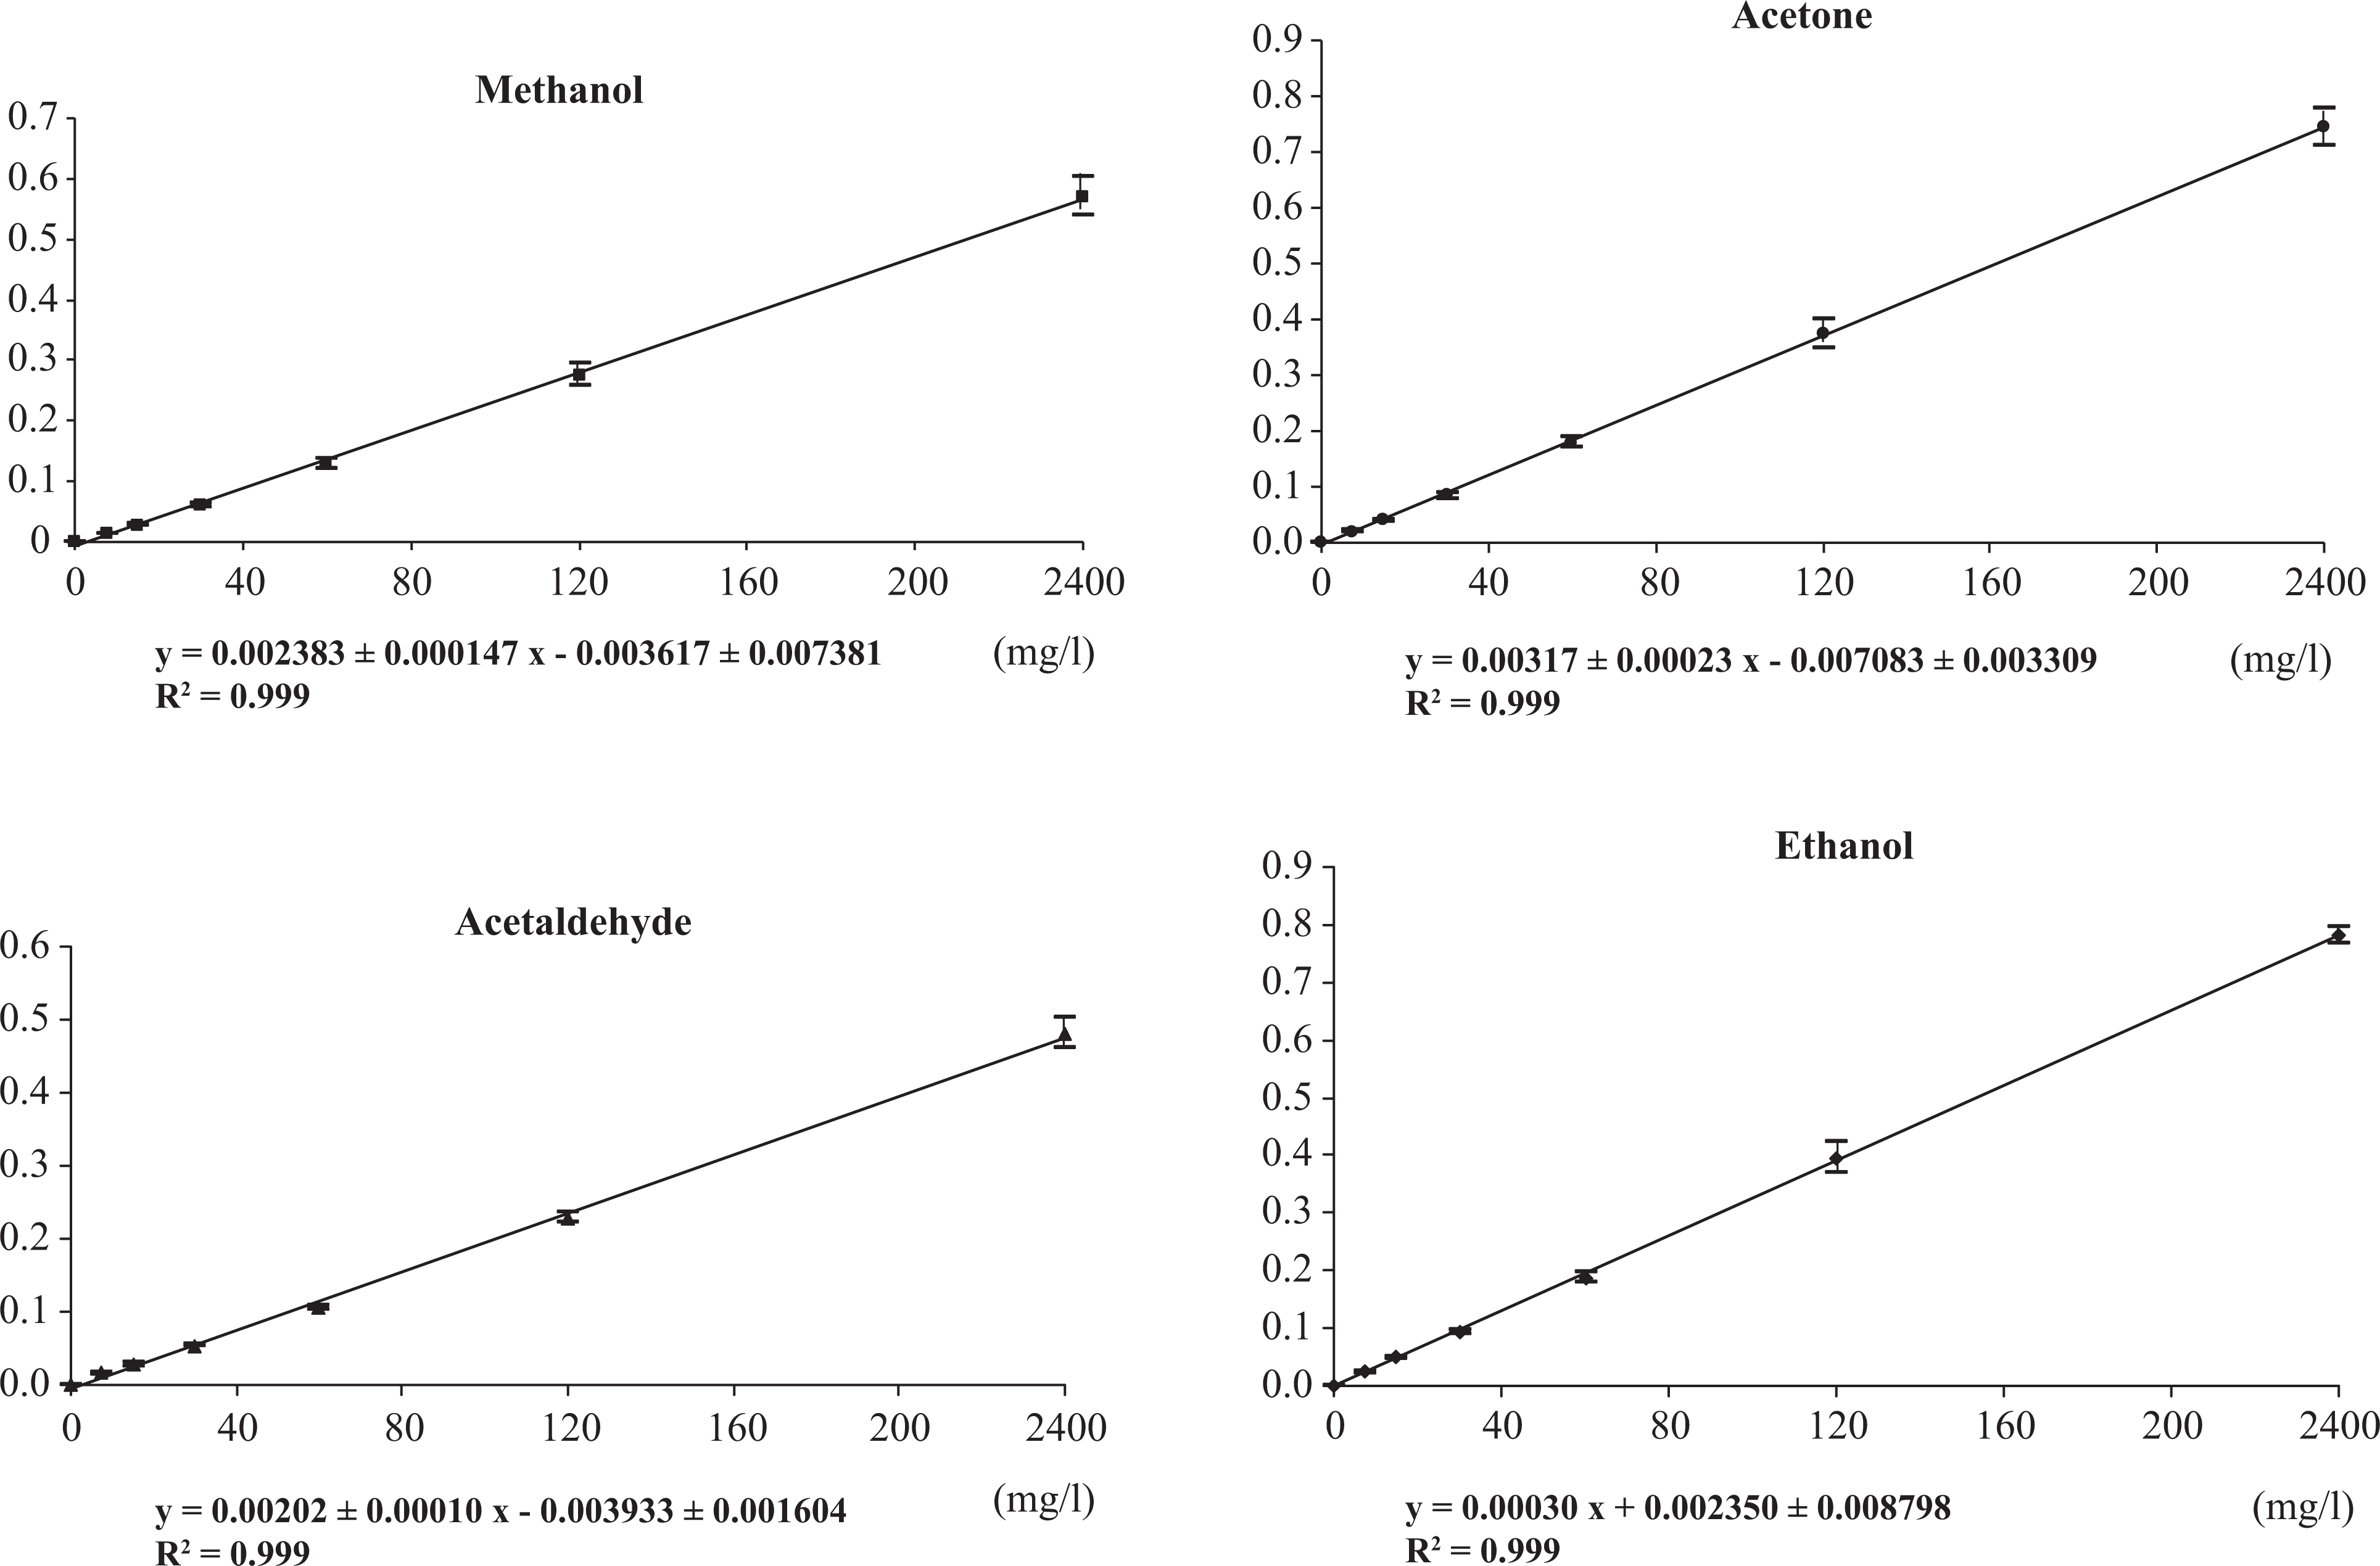
Calibration curves of methanol, acetaldehyde, acetone, and ethanol in blood. Results are presented as mean ± SD of six different injections of each calibrator.
Sensitivity
The LOD and LOQ for each compound are shown in Table 1. Inter-day and intra-day variations in the method for the three concentrations are presented in Table 2. The obtained inter-day and intra-day coefficients of variation were always lower than 10%.
Limits of detection and limits of quantification in blood.
Inter-day and intra-day coefficients of variation and accuracy.a

CV: coefficient of variation; A: accuracy = (mean calculated concentration−nominal concentration) × 100.
aResults represent the mean of experiments which were repeated three times.
Accuracy
Ranges of accuracy evaluated at the three concentrations were 94.7–98.9% for methanol, 91.2–97.4% for acetaldehyde, 96.1–98.7% for acetone, and 105.5–111.6% for ethanol (Table 2).
Selectivity
Chromatographic profiles of blood samples spiked with formaldehyde, ethylene glycol, propylene glycol, and glycerol did not show any interference with methanol, acetaldehyde, acetone, and ethanol.
Time required for analysis
Total time required from blood sample preparation to final determination was 20 min.
Figure 3 shows a representative chromatogram obtained from an autopsy blood sample of a 32-year-old male who died from asphyxia (20 June 2012).

Representative chromatogram obtained from post-mortem blood sample with internal standard (tert-butanol) showing ethanol 0.48 g/l and acetaldehyde 0.01 g/l. Acetaldehyde, ACTD.
Discussion
The method presented allows rapid and sensitive GC-flame ionization detection analysis of blood samples for methanol, acetaldehyde, acetone, and ethanol determination. The coefficients of correlation for all calibration curves, all higher than 0.99, attested for excellent linearity. LODs of all four compounds were suitable for routine analysis. Precision ranged from 0.8 to 6.9%, and the ranges of accuracy were found to be 91.2–111.6%, well within the reference of 80–120% acceptance limits, 15 and smaller than 79.0–118.0% previously reported. 11
Both LODs and LOQs were lower than those previously reported for acetaldehyde, acetone, and ethanol determinations and similar for methanol determinations (LOQs 2.03, 1.93, 1.77, and 2.66 mg/l, versus. 2.8, 2.5, 2.5, and 2.5, respectively 11 ).
As shown in Figure 3, the selected chromatograms presented a good chromatographic resolution and peak separation. Moreover, the separation between the studied compounds and some important volatiles recognized as biomarkers of forensic interest reflects the selectivity of this method and its applicability. The use of tert-butanol as internal standard avoids the possibility of error in the quantification of the compounds tested when putrefactive alcohols, such as n-propanol, are present in blood samples obtained at autopsy. 12
Headspace solid phase microextraction has been used for GC analysis of volatile compounds such as ethanol and methanol. 16 It has an excellent sensitivity, as the LOQs for the four compounds tested are around 0.50 mg/l. 17 However, the high cost of this procedure is recognised as a barrier to its use in routine analysis. 17,18 We estimated the cost of the method presented here as US$3, which is 2–3 times lower than headspace chromatographic analyses.
We conclude that the method presented here is a sensitive, rapid, and reliable procedure to determine volatile compounds in blood samples after ethanol or methanol intoxication, including autopsy cases. This method is easy to perform and does not require specifically trained personnel or expensive apparatus. This makes it suitable for routine clinical toxicology and forensic practice.
Footnotes
Conflict of Interest
The authors declared no conflicts of interest.
Funding
This research received no specific grant from any funding agency in the public, commercial, or not-for-profit sectors.