
Abstract
Celecoxib has been shown to have antitumor effect in previous studies but the mechanisms are unclear. The effect of celecoxib on cytosolic Ca2+ concentrations ([Ca2+]i) and viability in HA59T human hepatoma cells was explored. The Ca2+-sensitive fluorescent dye fura-2 was applied to measure [Ca2+]i. Celecoxib at concentrations of 10–50 μM induced a [Ca2+]i rise in a concentration-dependent manner. The response was reduced by 80% by removing Ca2+. Celecoxib induced Mn2+ influx, leading to quenching of fura-2 fluorescence. Celecoxib-evoked Ca2+ entry was suppressed by nifedipine, econazole, SK&F96365, and protein kinase C modulators. In the absence of extracellular Ca2+, incubation with the endoplasmic reticulum Ca2+ pump inhibitor thapsigargin nearly abolished celecoxib-induced [Ca2+]i rise. Incubation with celecoxib abolished thapsigargin-induced [Ca2+]i rise. Inhibition of phospholipase C with U73122 abolished celecoxib-induced [Ca2+]i rise. At 1–50 μM, celecoxib inhibited cell viability by less than 20%, which was not reversed by chelating cytosolic Ca2+ with 1,2-bis(2-aminophenoxy)ethane-N, N, N′, N′-tetraacetic acid/acetoxy methyl (BAPTA/AM). Celecoxib (10–50 μM) also induced apoptosis. In sum, in HA59T hepatoma cells, celecoxib induced a [Ca2+]i rise by evoking phospholipase C-dependent Ca2+ release from the endoplasmic reticulum and Ca2+ entry via protein kinase C-sensitive store-operated Ca2+ channels. Celecoxib also caused cell death via apoptosis.
Keywords
Introduction
Nonsteroidal anti-inflammatory drugs (NSAIDs) have been used to treat inflammation and pain. 1 The anti-inflammatory effects of NSAIDs are due to their ability to inhibit cyclooxygenase (COX), decreasing production of prostaglandins, which are key mediators of the inflammatory response and pain. COX enzymes metabolize arachidonic acid, forming prostaglandin H2, which is subsequently metabolized by prostaglandin E synthase into prostaglandin E2 (PGE2). There are at least two isoforms of the COX enzyme: constitutively expressed homeostatic COX1 found in most tissues and COX2, which is not expressed in normal healthy tissues and cells but is induced by various mediators, such as cytokines and growth factors. 2 Beneficial effects of NSAIDs are thought to be mediated by COX2 inhibition, whereas unwanted gastrointestinal effects are caused by inhibitory effects on COX1. This led to the development of selective COX2 inhibitors. 3
Celecoxib (Celebrex®; Pfizer Inc.) was the first selective COX2 inhibitor to be used in everyday clinical practice. It is approved for use for musculoskeletal symptoms in osteoarthritis, rheumatoid arthritis, and ankylosing spondylitis as well as in the management of primary dysmenorrhea and acute pain. The advantages for selective COX2 inhibitor use are to have similar efficacy to NSAIDs but with less gastrointestinal side effects. Celecoxib was the first of many selective COX2 inhibitors most of which have now been withdrawn from clinical use (lumiracoxib rofecoxib and valdecoxib) because of concerns of serious side effects. 4
Although celecoxib was developed as a selective COX2 inhibitor, additional pharmacological activities have emerged outside of its analgesic activity. 5 When added to cells in culture at moderate micromolar (μM) concentrations, celecoxib was shown to affect several additional cellular components with roles in cellular proliferation and survival. Other in vitro effect of celecoxib includes inhibition of invasion and metastasis via a COX2-independent mechanism in an in vitro model of Ewing sarcoma 6 and growth of polycystic kidney cyst-lining epithelial cells. 7 In hepatoma cells, Xu et al. 8 show that celecoxib inhibited arachidonic acid metabolic pathway. Lu et al. 9 show that celecoxib enhanced TRAIL-induced apoptosis. Kern et al. 10 show that celecoxib induces apoptosis via death receptors and mitochondria. Cui et al. 11 report the in vitro and in vivo effects and mechanisms of celecoxib-induced growth inhibition.
The aim of this study was to explore the effect of celecoxib on intracellular Ca2+ levels in human hepatoma cells. Liu et al. 12 show that celecoxib inhibits JAK2/STAT3 phosphorylation in human hepatocellular carcinoma cells. Yin et al. 13 show that celecoxib attenuates hepatocellular carcinoma growth and c-Met expression in mice. Cervello et al. 14 suggest that celecoxib has COX2-dependent and COX2-independent mode of action in human hepatoma cells. The effect of celecoxib on Ca2+ signaling in hepatocytes is unclear.
Ca2+ ions play a crucial role in different biological responses. A rise in intracellular free Ca2+ concentrations ([Ca2+]i) can initiate many pathophysiological cellular processes. 15 However, a unregulated [Ca2+]i rise may cause ion flux, dysfunction of proteins, apoptosis, proliferation, and so on. Whether celecoxib could increase [Ca2+]i and evoke death in hepatoma cells is unknown. Fura-2 was used as a fluorescent Ca2+-sensitive dye to measure [Ca2+]i changes in the present study. Celecoxib-induced Ca2+ entry and Ca2+ release were explored. The [Ca2+]i rises were characterized, the concentration–response plots were established, and the pathways underlying celecoxib-evoked Ca2+ entry and Ca2+ release were explored. The effect of celecoxib on cell viability and the role of apoptosis were examined.
Materials and methods
Chemicals
The reagents for cell culture were from Gibco (Gaithersburg, MD, USA). Fura-2/AM and BAPTA/AM were from Molecular Probes (Eugene, OR, USA). Celecoxib and all other reagents were from Sigma-Aldrich (St. Louis, MO, USA) unless otherwise indicated.
Cell culture
HA59T human hepatoma cells obtained from Bioresource Collection and Research Center (Taiwan) were cultured in Dulbecco’s modified Eagle medium supplemented with 10% heat-inactivated fetal bovine serum, 100 U/ml penicillin and 100 μg/ml streptomycin.
Solutions used in [Ca2+]i measurements
Ca2+-containing medium (pH 7.4) had 140 mM NaCl, 5 mM KCl, 1 mM MgCl2, 2 mM CaCl2, 10 mM Hepes, and 5 mM glucose. Ca2+-free medium contained similar chemicals as Ca2+-containing medium except that CaCl2 was replaced with 0.3 mM EGTA and 2 mM MgCl2. Celecoxib was dissolved in dimethyl sulfoxide as a 1 M stock solution. The other chemicals were dissolved in water, ethanol or dimethyl sulfoxide. The concentration of organic solvents in the experimental solutions did not exceed 0.1% and did not affect viability or basal [Ca2+]i.
[Ca2+]i measurements
Confluent cells grown on 6 cm dishes were trypsinized and made into a suspension in culture medium at a density of 106/ml. Cell viability was determined by trypan blue exclusion (adding 0.2% trypan blue to 0.1 ml cell suspension). The viability was greater than 95% after the treatment. Cells were subsequently loaded with 2 μM fura-2/AM for 30 min at 25oC in the same medium. After loading, the cells were washed with Ca2+-containing medium twice and was made into a suspension in Ca2+-containing medium at a density of 107/ml. Fura-2 fluorescence measurements were performed in a water-jacketed cuvette (25oC) with continuous stirring; the cuvette contained 1 ml of medium and 0.5 million cells. Fluorescence was monitored with a Shimadzu RF-5301PC spectrofluorophotometer immediately after 0.1 ml cell suspension was added to 0.9 ml Ca2+-containing or Ca2+-free medium, by recording excitation signals at 340 nm and 380 nm and emission signal at 510 nm at 1-s intervals. During the recording, reagents were added to the cuvette by pausing the recording for 2 s to open and close the cuvette-containing chamber. For calibration of [Ca2+]i, after completion of the experiments, the detergent Triton X-100 (0.1%) and CaCl2 (5 mM) were added to the cuvette to obtain the maximal fura-2 fluorescence. Then the Ca2+ chelator EGTA (10 mM) was added to chelate Ca2+ in the cuvette to obtain the minimal fura-2 fluorescence. Control experiments showed that cells bathed in a cuvette had a viability of 95% after 20 min of fluorescence measurements. [Ca2+]i was calculated as previously described. 16 Mn2+ quenching of fura-2 fluorescence was performed in a Ca2+ medium containing 50 μM MnCl2. MnCl2 was added to cell suspension in the cuvette 30 s before the fluorescence recoding was started. Data were recorded at excitation signal at 360 nm (Ca2+ insensitive) and the emission signal at 510 nm at 1-s intervals as described previously. 17
Cell viability assays
The measurement of cell viability was based on the ability of cells to cleave tetrazolium salts by dehydrogenases. Augmentation in the amount of developed color directly correlated with the number of live cells. Assays were performed according to manufacturer’s instructions specifically designed for this assay (Roche Molecular Biochemical, Indianapolis, IN, USA). Cells were seeded in 96-well plates at a density of 10,000 cells/well in culture medium for 24 h in the presence of celecoxib. The cell viability detecting reagent 4-[3-[4-lodophenyl]-2-4(4-nitrophenyl)-2H-5-tetrazolio-1,3-benzene disulfonate] (WST-1; 10 μl pure solution) was added to samples after celecoxib treatment, and cells were incubated for 30 min in a humidified atmosphere. In experiments using BAPTA/AM to chelate cytosolic Ca2+, cells were treated with 5 μM BAPTA/AM for 1 h prior to incubation with celecoxib. The cells were washed once with Ca2+-containing medium and incubated with/without celecoxib for 24 h. The absorbance of samples (A450) was determined using an enzyme-linked immunosorbent assay (ELISA) reader. Absolute optical density was normalized to the absorbance of unstimulated cells in each plate and expressed as a percentage of the control value.
Alexa ®Flour 488 annexin V/propidium iodide (PI) staining for apoptosis
Annexin V/PI staining assay was employed to further detect cells in early apoptotic and late apoptotic/necrotic stages. Cells were exposed to celecoxib at concentrations of 0, 10 μM, 30 μM, or 50 μM for 24 h. Cells were harvested after incubation and washed in cold phosphate-buffered saline (PBS). Cells were resuspended in 400 μl reaction solution with 10 mM of HEPES, 140 mM of NaC1, 2.5 mM of CaC12 (pH 7.4). Alexa Fluor 488 annexin V/PI staining solution (Probes Invitrogen, Eugene, OR, USA) was added in the dark. After incubation for 15 min, the cells were collected and analyzed in a FACScan flow cytometry analyzer. Excitation wavelength was at 488 nm and the emitted green fluorescence of annexin V (FL1) and red fluorescence of PI (FL2) were collected using 530 nm and 575 nm band-pass filters, respectively. A total of 20,000 cells were analyzed per sample. Light scatter was measured on a linear scale of 1024 channels and fluorescence intensity on a logarithmic scale. The amount of early apoptosis and late apoptosis were determined, respectively, as the percentage of annexin V+/PI− and annexin V+/PI+ cells. Data were later analyzed using the flow cytometry analysis software WinMDI 2.8 (by Joe Trotter, freely distributed software). X and Y coordinates refer to the intensity of fluorescence of annexin and PI, respectively.
Statistics
Data are reported as mean ± SEM of three experiments. Data were analyzed by one- or two-way analysis of variances (ANOVAs) using the Statistical Analysis System (SAS®, SAS Institute Inc., Cary, NC, USA). There are two independent variables in a two-way ANOVA, which are called factors. The idea is that there are two variables, factors, which affect the dependent variable. Each factor will have two or more levels within it, and the degrees of freedom for each factor is one less than the number of levels. Therefore, there are two factors (time and concentration) in two-way ANOVA. Figure 1 had with/without Ca2+ and Figure 6 had with/without BAPTA-AM as second factors. One-way ANOVA was used in other figures. Multiple comparisons between group means were performed by post hoc analysis using the Tukey’s honestly significantly difference (HSD) procedure. A p value less than 0.05 were considered significant.
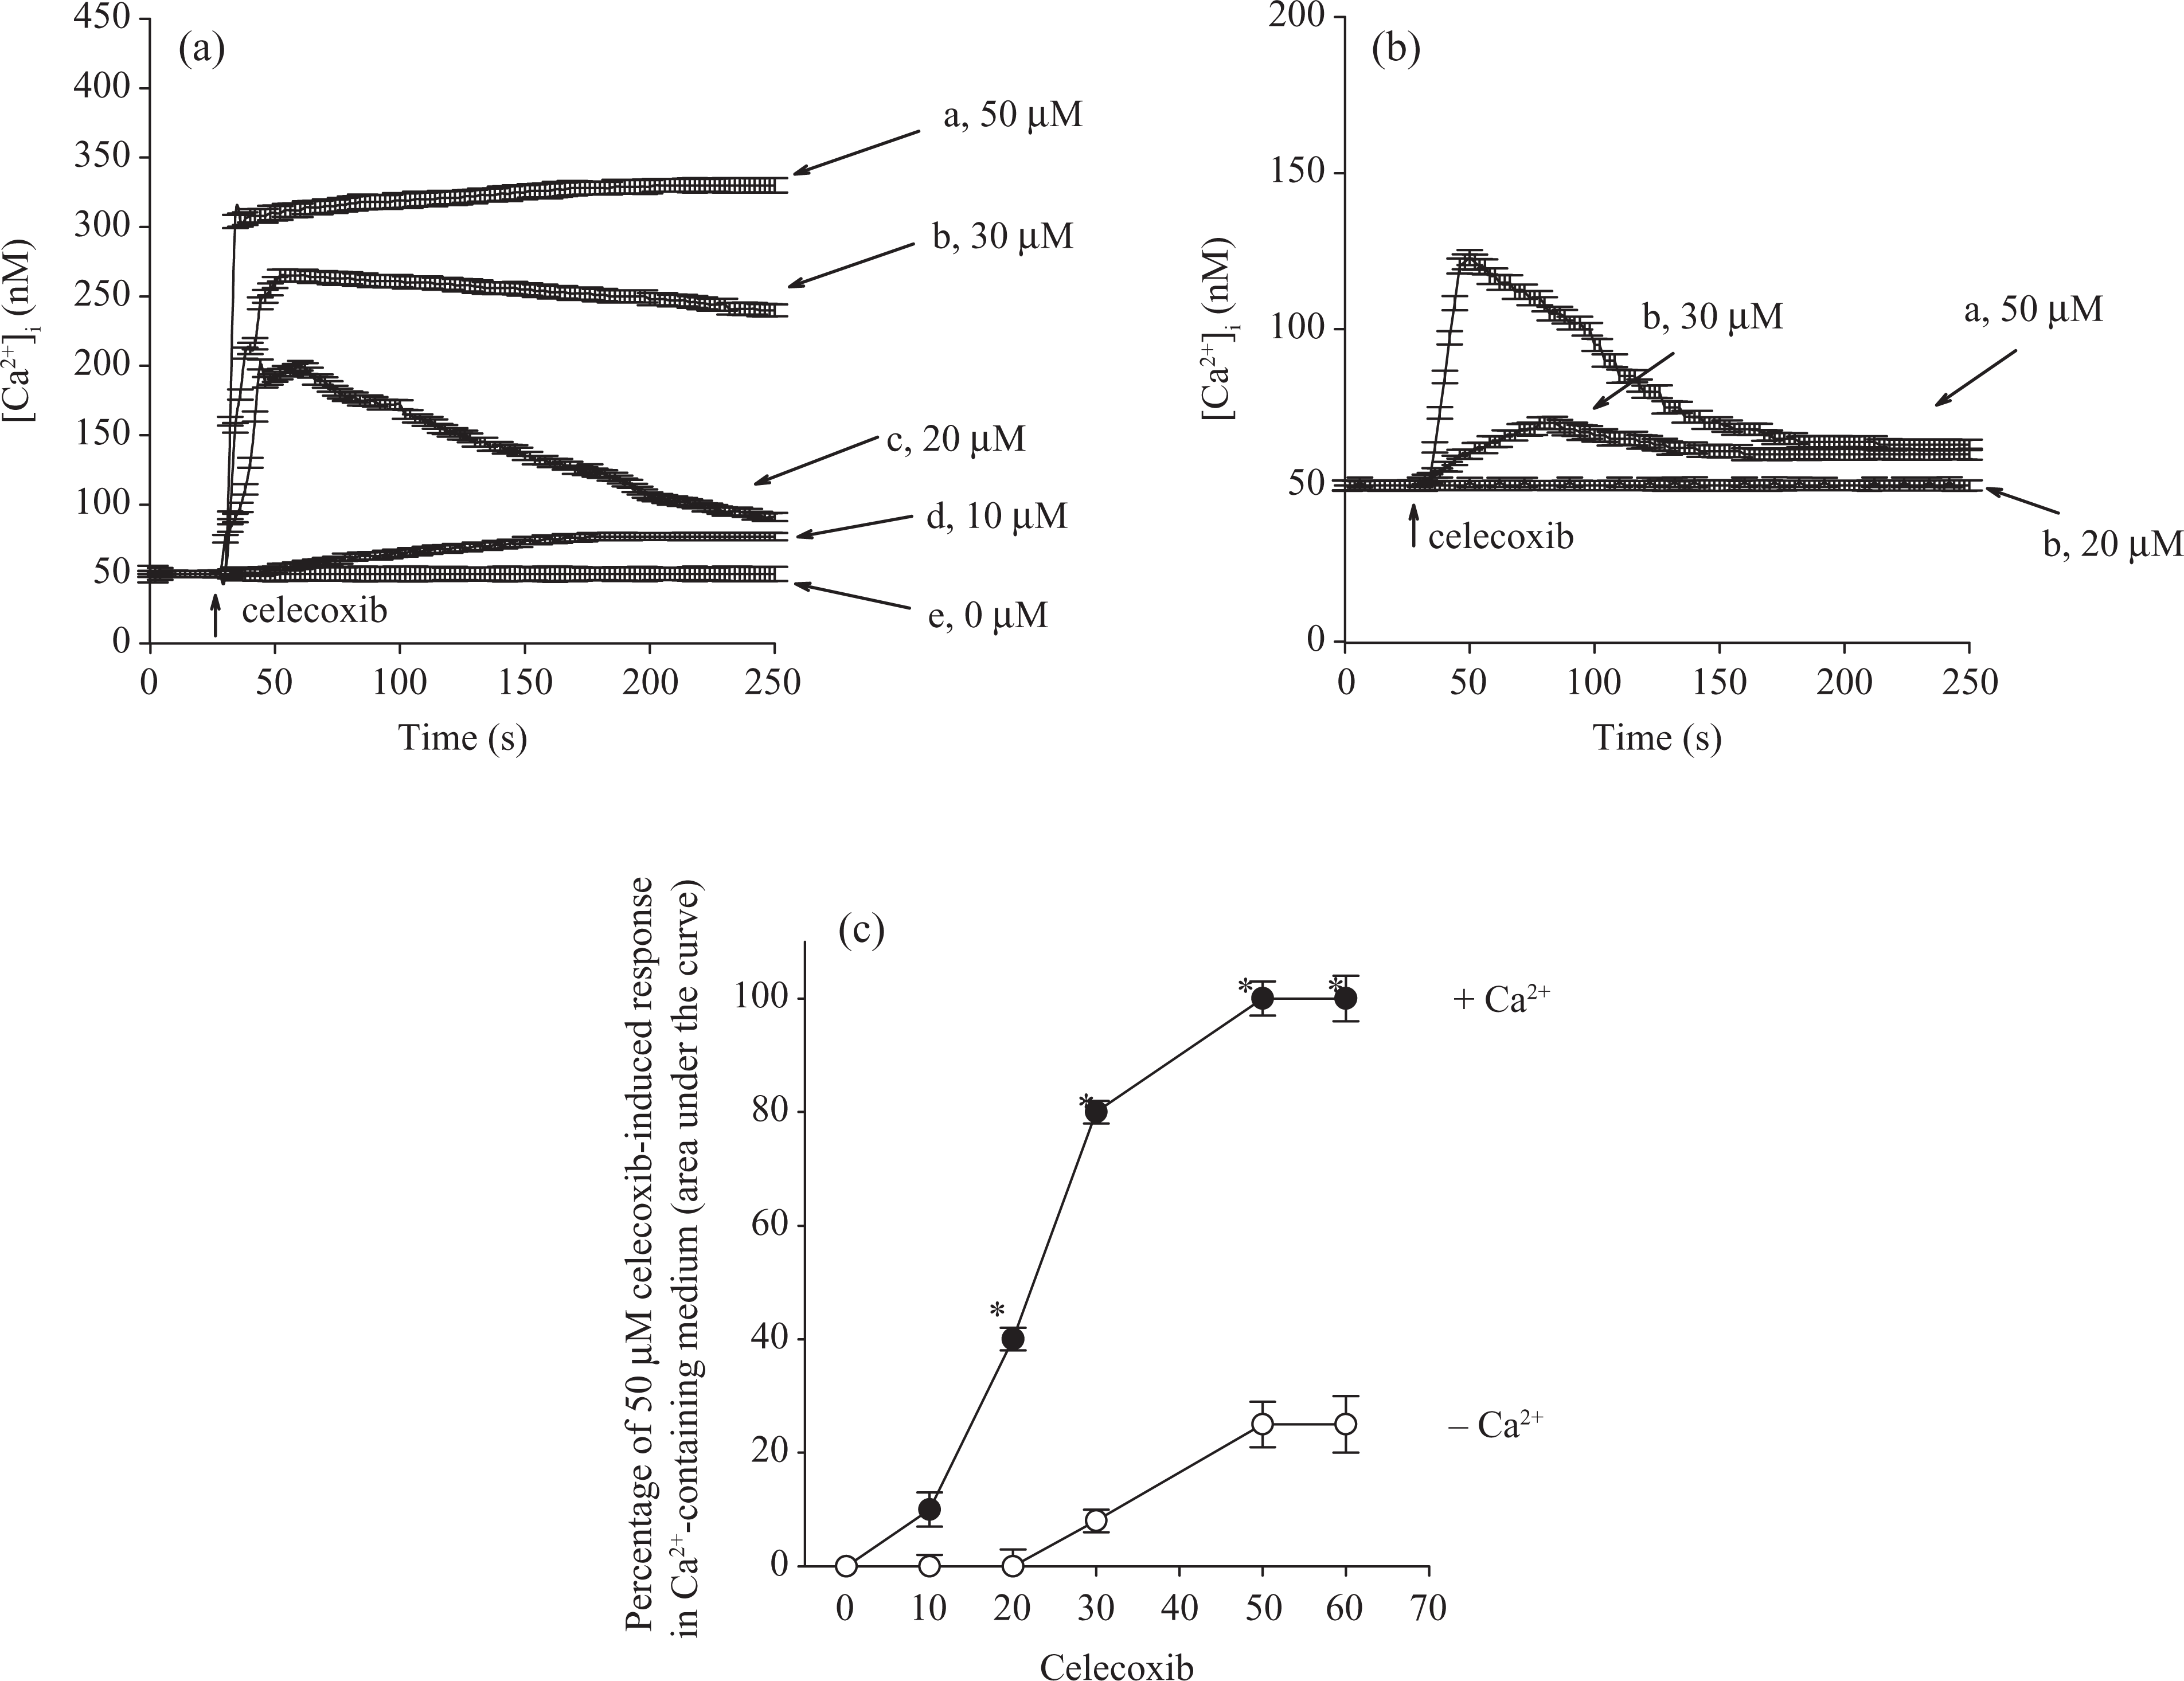
(a) Effect of celecoxib on [Ca2+]i in fura-2-loaded HA59T cells. Celecoxib was added at 25 s. The concentration of celecoxib was indicated. The experiments were performed in Ca2+-containing medium. (b) Effect of celecoxib on [Ca2+]i in the absence of extracellular Ca2+. Celecoxib was added at 25 s in a Ca2+-free medium. (c) Concentration–response plots of celecoxib-induced [Ca2+]i rises in the presence or absence of extracellular Ca2+. Y axis is the percentage of the net (baseline subtracted) area under the curve (25–250 s) of the [Ca2+]i rise induced by 50 μM celecoxib in Ca2+-containing medium. Data are mean
Results
Effect of celecoxib on [Ca2+]i
The effect of celecoxib on basal [Ca2+]i was examined. Figure 1A shows that the basal [Ca2+]i level was 51 ± 2 nM. At concentrations between 10 and 50 μM, celecoxib induced a [Ca2+]i rise in a concentration-dependent manner in Ca2+-containing medium. At a concentration of 50 μM, celecoxib evoked a [Ca2+]i rise that reached a net increase of 250 ± 2 nM (n = 3) followed by a sustained phase. The Ca2+ response saturated at 50 μM celecoxib because at a concentration of 60 μM, celecoxib evoked a similar response as that induced by 50 μM. Figure 1B shows that in the absence of extracellular Ca2+, 50 μM celecoxib induced a [Ca2+]i rise of 75 ± 2 nM; and at a concentration of 30 μM, celecoxib induce a [Ca2+]i rise of 21 ± 2 nM. Figure 1C shows the concentration–response plots of celecoxib-induced responses. The EC50 value was 22 ±+ 2 μM or 35 ± 2 μM in Ca2+-containing medium or Ca2+-free medium, respectively, by fitting to a Hill equation.
Celecoxib-induced Mn2+ influx
Experiments were performed to confirm that celecoxib-evoked [Ca2+]i rise involved Ca2+ influx. Mn2+ enters cells through similar mechanisms as Ca2+ but quenches fura-2 fluorescence at all excitation wavelengths. Therefore, quenching of fura-2 fluorescence excited at the Ca2+-insensitive excitation wavelength of 360 nm by Mn2+ implicates Ca2+ influx. Figure 2 shows that 50 μM celecoxib evoked an instant decrease in the 360 nm excitation signal by 130 ± 2 Au (n = 3). This suggests that Ca2+ influx participates in celecoxib-evoked [Ca2+]i rise.

Effect of celecoxib on Ca2+ influx by measuring Mn2+ quenching of fura-2 fluorescence. Experiments were performed in Ca2+-containing medium. The y axis is fluorescence intensity (in arbitrary units) measured at the Ca2+-insensitive excitation wavelength of 360 nm and the emission wavelength of 510 nm. Trace a: control, without celecoxib. Trace b: Celecoxib (50 μM) was added as indicated. Data are mean
Pathways of celecoxib-induced Ca2+ entry
Experiments were conducted to explore the Ca2+ entry pathway of the celecoxib-induced [Ca2+]i rise. Three Ca2+ entry inhibitors: nifedipine (1 μM), econazole (0.5 μM), and SK&F96365 (5 μM); phorbol 12-myristate 13 acetate (PMA; 1 nM; a protein kinase C activator); and GF109203X (2 μM; a protein kinase C inhibitor) were applied 1 min before celecoxib. These agents all significantly inhibited celecoxib-induced [Ca2+]i rise (Figure 3).

Effect of Ca2+ channel modulators on celecoxib-induced [Ca2+]i rise. In blocker- or modulator-treated groups, the reagent was added 1 min before celecoxib (50 μM). Data are expressed as the percentage of control (1st column) that is the area under the curve (25–200s) of 50 μM celecoxib-induced [Ca2+]i rise in Ca2+-containing medium and are mean ± SEM of three experiments. *P < 0.05 compared to the first column.
Internal stores of celecoxib-induced [Ca2+]i rise
Efforts were made to explore the nature of Ca2+ store involved in celecoxib-induced [Ca2+]i rise. Previous studies have shown that the endoplasmic reticulum is the major Ca2+ store in HA59T cells. Figure 3A shows that in Ca2+-free medium, addition of 50 μM celecoxib induced a [Ca2+]i rise of 70 ± 2 nM. Thapsigargin (TG, 1 μM), 18 an endoplasmic reticulum Ca2+ pump inhibitor, added at 500 s failed to induce a [Ca2+]i rise. Figure 4B shows that TG induced a [Ca2+]i rise of 20 ± 2 nM. Celecoxib added at 500 s induced a small [Ca2+]i rise that was smaller than the celecoxib-induced response in Figure 4A by 80% in the area under the curve (200s interval).
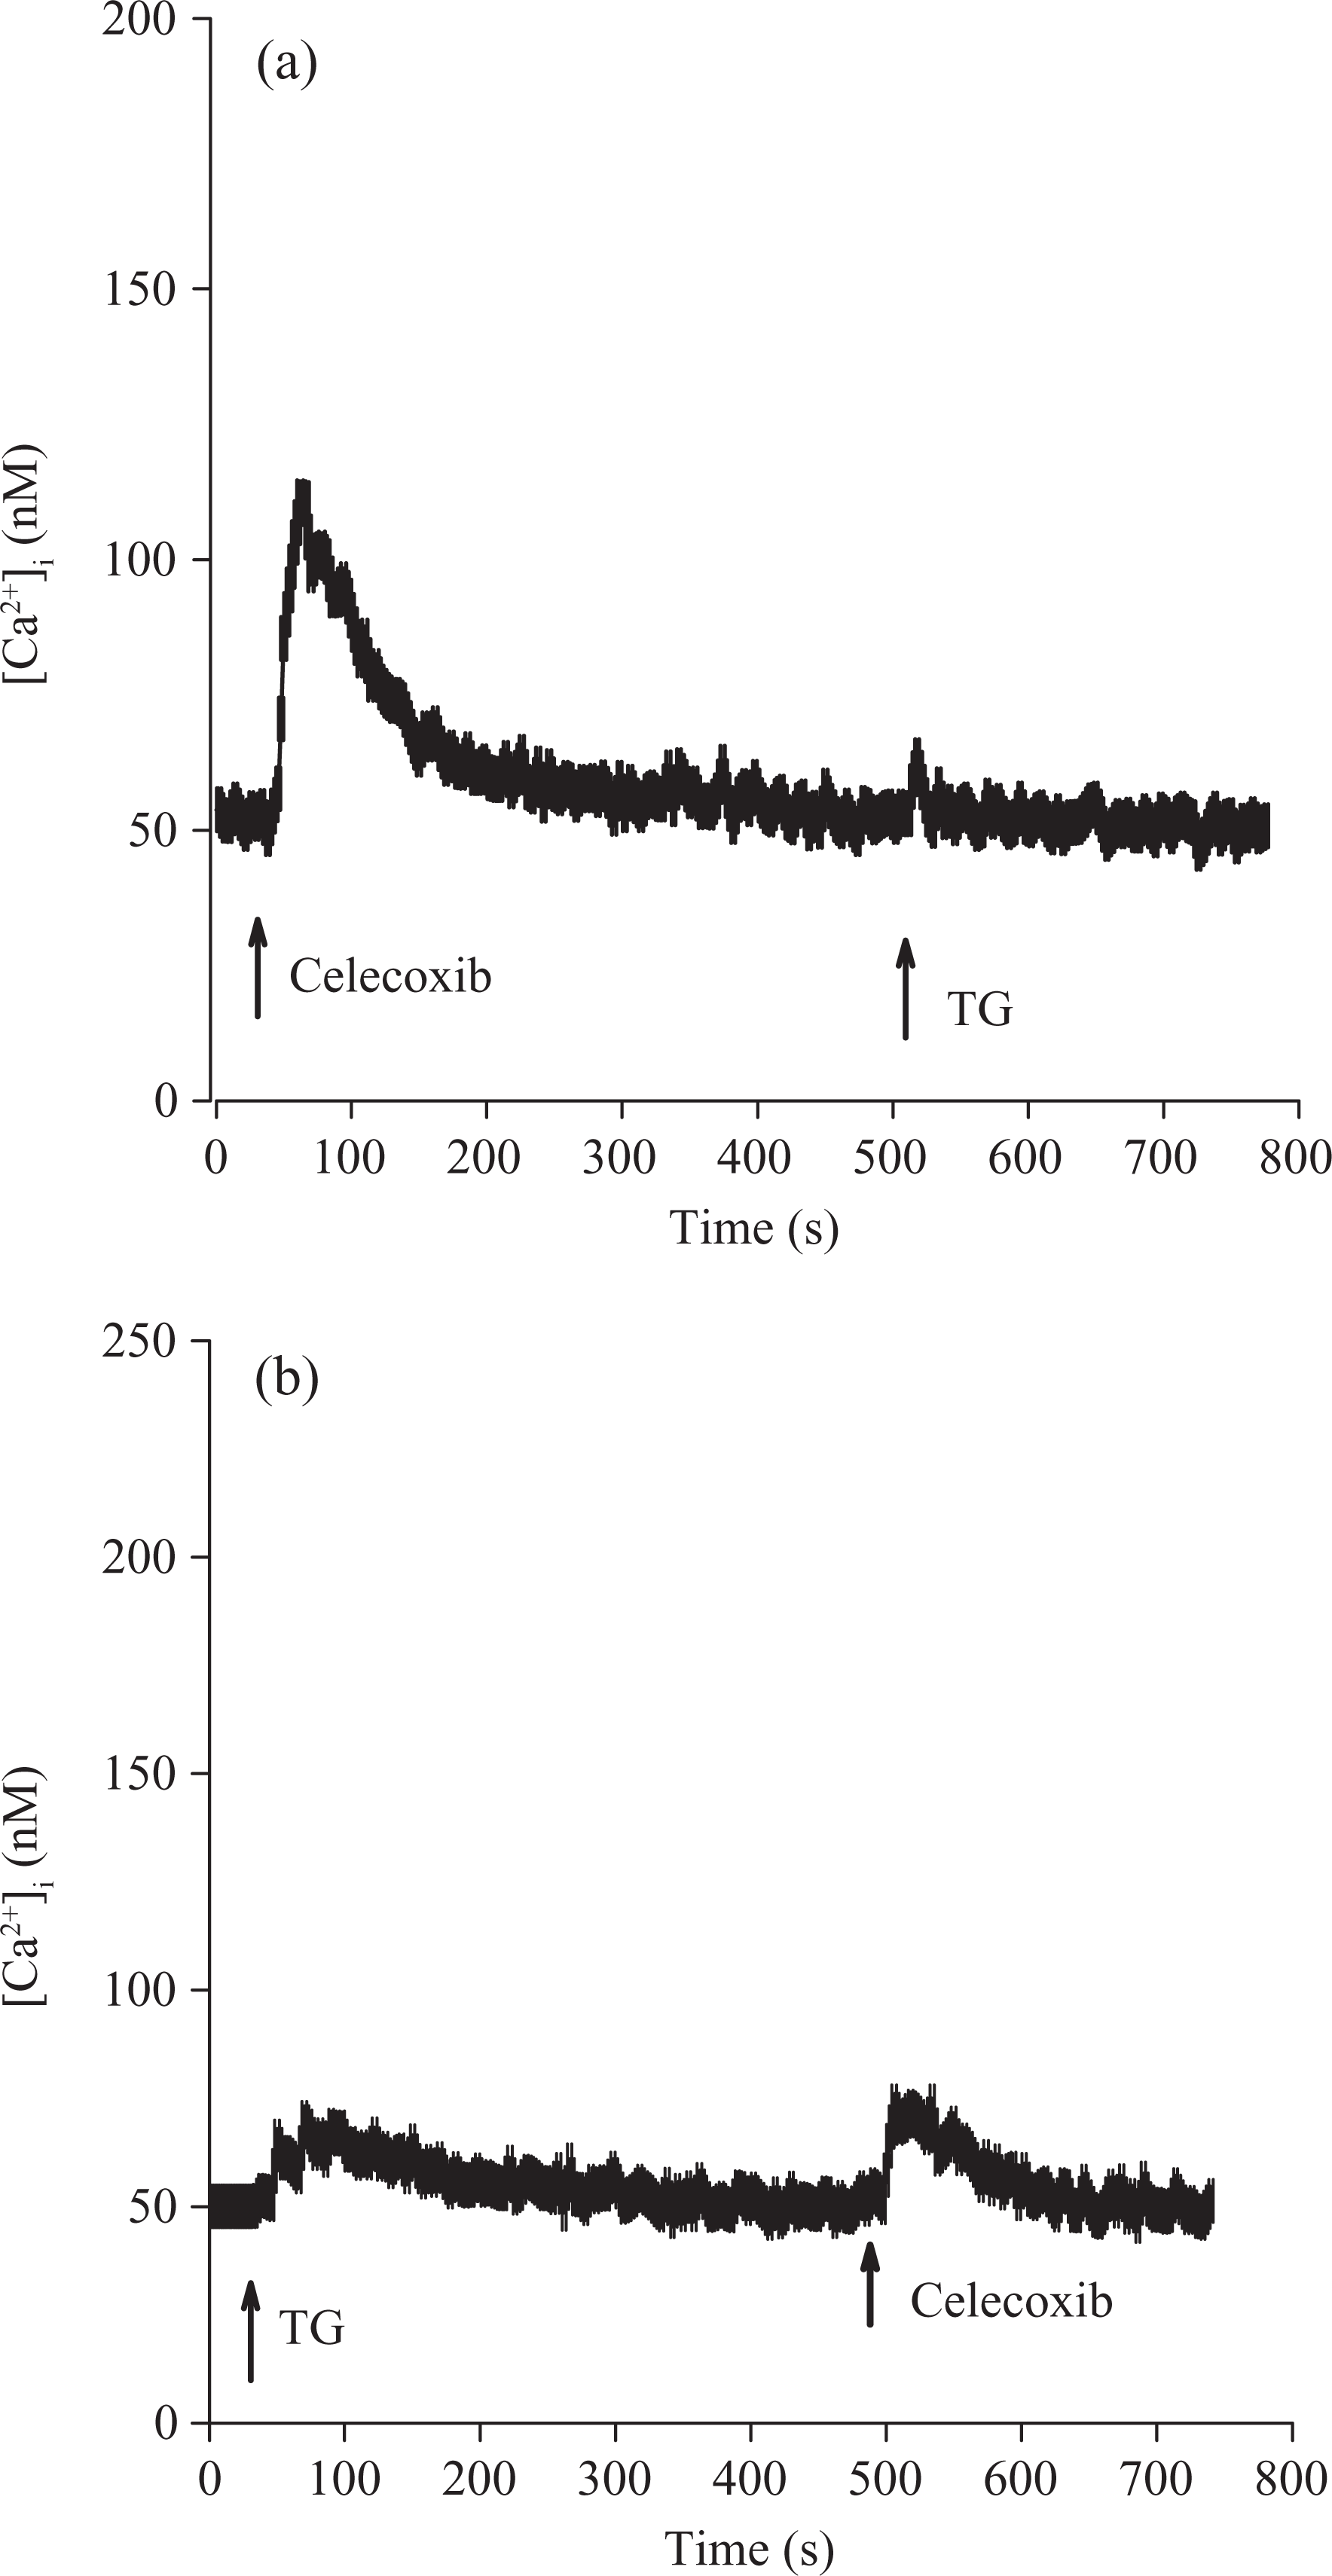
Intracellular Ca2+ stores of celecoxib-induced Ca2+ release. Experiments were performed in Ca2+-free medium. Celecoxib (50 μM) and thapsigargin (1 μM) were added at time points indicated. Data are mean ± SEM of three experiments.
The role of phospholipase C in celecoxib-induced [Ca2+]i rise
Phospholipase C-dependent production of inositol 1,4,5-trisphosphate is a key process for releasing Ca2+ from the endoplasmic reticulum. Because celecoxib released Ca2+ from the endoplasmic reticulum, the role of phospholipase C in this event was examined. U73122, 19 a phospholipase C inhibitor, was used to see whether the activation of this enzyme was required for celecoxib-induced Ca2+ release. Figure 5A shows that bradykinin (1 μM) induced a [Ca2+]i rise of 61+2 nM. Bradykinin is a phospholipase C-dependent agonist of [Ca2+]i rise in most cell types. 15 Figure 5B shows that incubation with 2 μM U73122 did not change basal [Ca2+]i but abolished bradykinin-induced [Ca2+]i rise. This suggests that U73122 effectively suppressed phospholipase C activity. Figure 5B also shows that incubation with 2 μM U73122 did not alter basal [Ca2+]i but abolished celecoxib-induced [Ca2+]i rise. U73343 (2 μM), a U73122 analogue, failed to have an inhibition (not shown).

Effect of U73122 on celecoxib-induced Ca2+ release. Experiments were performed in Ca2+-free medium. (a) Bradykinin (1 μM) was added as indicated. (b) U73122 (2 μM), bradykinin (1 μM), and celecoxib (50 μM) were added as indicated. Data are mean ± SEM of three experiments. *P < 0.05 compared to first bar (control). Control is the area under the curve of 50 μM celecoxib-induced [Ca2+]i rise (25–250 s).
Effect of celecoxib on cell viability
Given that acute incubation with celecoxib induced a substantial and lasting [Ca2+]i rise and that unregulated [Ca2+]i rise often alters cell viability, 15 experiments were performed to examine the effect of celecoxib on cell viability. Cells were treated with 0–50 μM celecoxib for 24 h, and the tetrazolium assay was performed. Data are expressed as percentage of control that is the increase in cell numbers in celecoxib-free groups. Control had 10,987 ± 789 cells/well before experiments, and had 13,985 ± 712 cells/well after incubation for 24 h. In the presence of 1–50 μM celecoxib, cell viability decreased less than 20% (Figure 6).
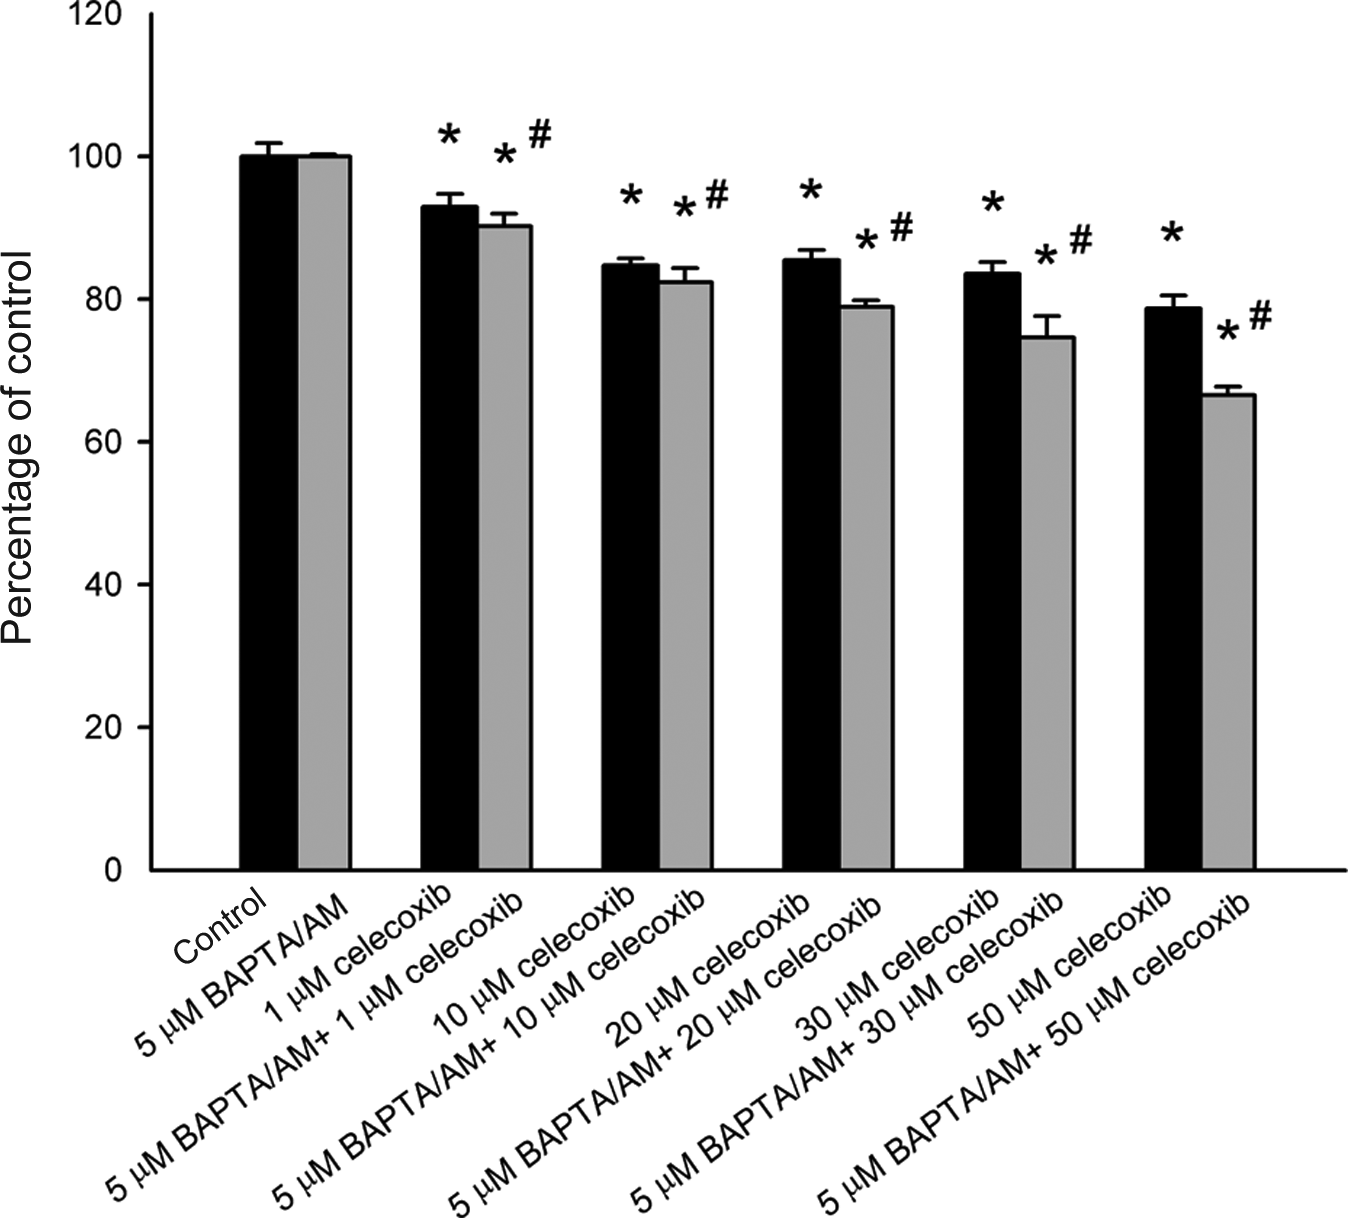
Effect of celecoxib on viability of HA59T cells. Data are mean ± SEM of three experiments. Each treatment had six replicates (wells). *P < 0.05 compared to control. In each group, the Ca2+ chelator 1,2-bis(2-aminophenoxy)ethane-N, N, N′, N′-tetraacetic acid/acetoxy methyl (BAPTA/AM) (5 μM) was added to fura-2-loaded cells followed by treatment with celecoxib in Ca2+-containing medium. Cell viability assay was subsequently performed. #P < 0.05 compared to the pairing group.
Relationship between celecoxib-induced [Ca2+]i rise and cell death
The next issue was whether the celecoxib-induced cell death was caused by a preceding [Ca2+]i rise. The intracellular Ca2+ chelator BAPTA/AM 20 was used to prevent a [Ca2+]i rise during celecoxib treatment. Figure 6 also shows that 5 μM BAPTA/AM loading did not alter the control value of cell viability. Celecoxib (50 μM) did not induce a [Ca2+]i rise in BAPTA/AM-treated cells (not shown). In the presence of 1–50 μM celecoxib, BAPTA/AM loading slightly enhanced celecoxib-induced cell death (n = 3; p < 0.05).
Possible involvement of apoptosis in celecoxib-induced cell death
Annexin V/PI staining was applied to detect apoptotic cells after celecoxib treatment. Figure 7 shows that treatment with 10, 30, and 50 μM celecoxib significantly induced apoptosis.
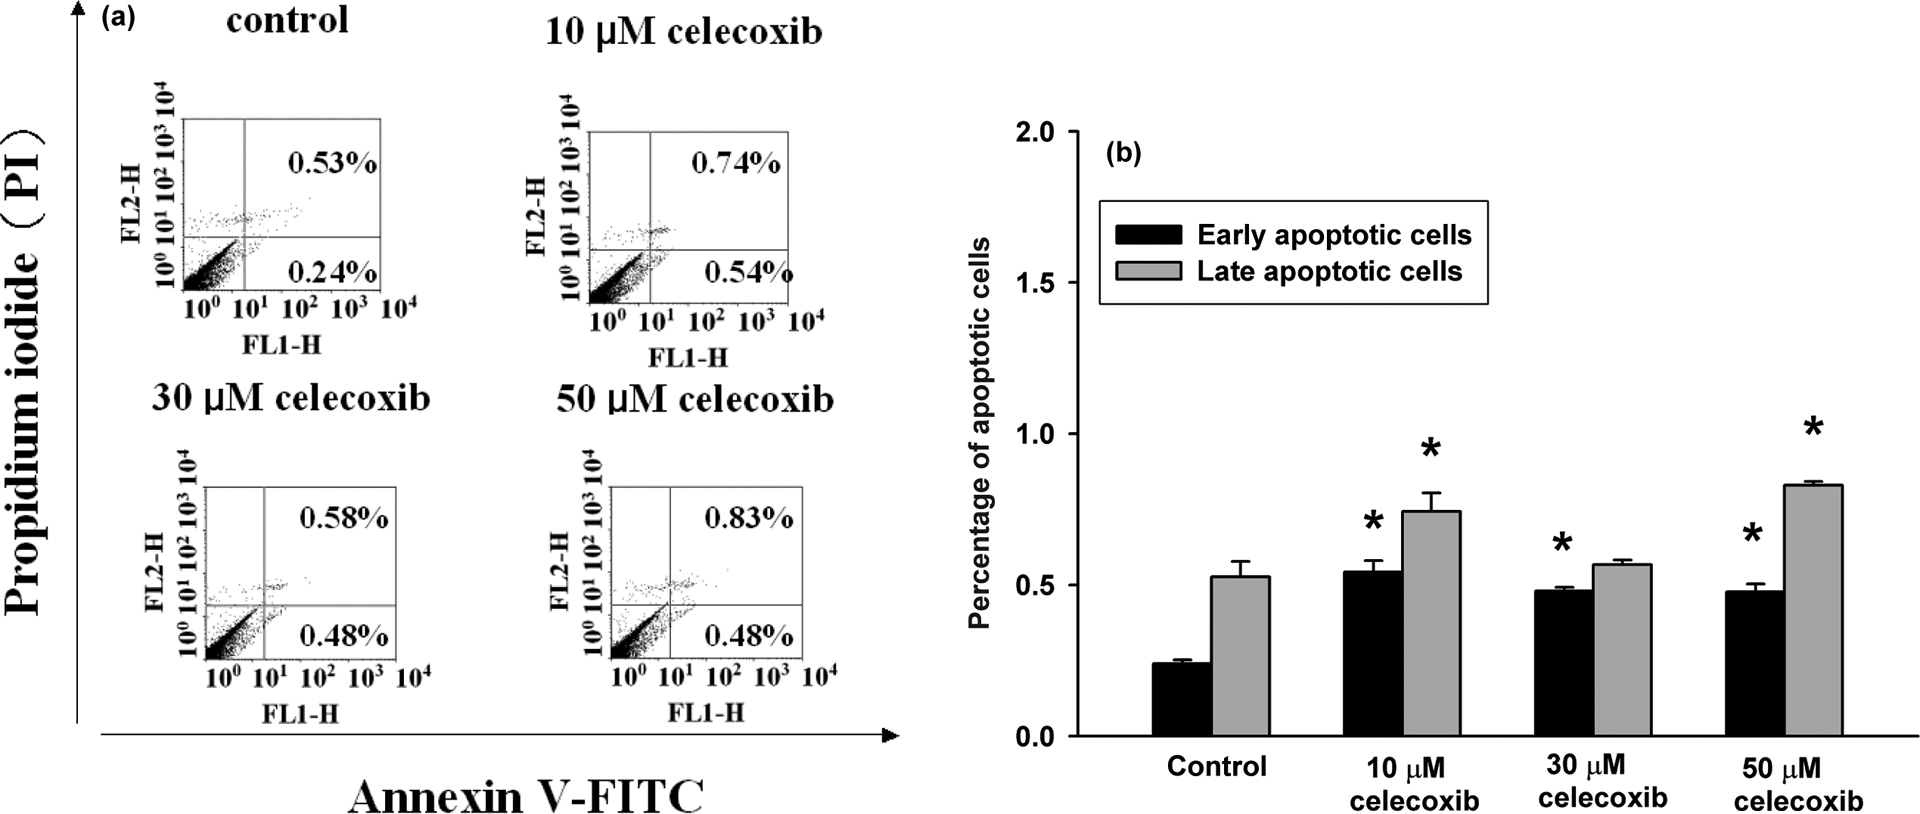
Celecoxib-induced apoptosis/necrosis as measured by annexin V/PI staining. (a) Cells were treated with 0, 10, 30, or 50 μM celecoxib, for 24 h. Cells were then processed for annexin V/PI staining and analyzed by flow cytometry. (b) The percentage of early apoptotic cells and late apoptotic/necrotic cells. *P < 0.05 compared to control.
Discussion
The data show that celecoxib induced a concentration-dependent [Ca2+]i rise in human hepatoma cells. Celecoxib increased [Ca2+]i by depleting intracellular Ca2+ stores and causing Ca2+ entry from extracellular milieu because removing extracellular Ca2+ reduced 80% of celecoxib-induced [Ca2+]i rise. Removal of extracellular Ca2+ reduced the celecoxib-induced [Ca2+]i rise throughout the measurement period, suggesting that Ca2+ entry occurred during the whole stimulation interval (200 s).
The mechanism of celecoxib-induced Ca2+ influx was explored. The results suggest that celecoxib might cause Ca2+ entry via store-operated Ca2+ entry which is induced by depletion of intracellular Ca2+ stores, based on the inhibition of celecoxib-induced [Ca2+]i rise by nifedipine, econazole, and SK&F96365. These three compounds have often been applied as blockers of store-operated Ca2+ entry in different cell types. 21 –24 Because activation of phospholipase C produces IP3 and diacylglycerol, which stimulates protein kinase C, the effect of regulation of protein kinase C activity on celecoxib-induced [Ca2+]i rise was explored. Both activation and inhibition of protein kinase C inhibited celecoxib-induced [Ca2+]i rise. This suggests that normal PKC activity is required for celecoxib-induced [Ca2+]i rise.
Regarding the Ca2+ stores involved in celecoxib-induced Ca2+ release, the TG-sensitive endoplasmic reticulum stores might be the dominant one because TG pretreatment greatly inhibited celecoxib-induced [Ca2+]i rise; and conversely, celecoxib pretreatment abolished TG-induced Ca2+ release. Furthermore, it seems that phospholipase C-dependent pathways played a significant role in celecoxib-induced Ca2+ release, since the response was abolished when phospholipase C activity was inhibited by U73122. Thus, it appears that celecoxib-induced Ca2+ release was caused by a phospholipase C-dependent Ca2+ release from the endoplasmic reticulum.
Because celecoxib induced both [Ca2+]i rises and cell death, it would be interesting to know whether the death occurred in a Ca2+-dependent manner. Our data show that celecoxib-induced cell death was not reversed when cytosolic Ca2+ was chelated by BAPTA/AM. This implies that in this case, celecoxib-induced cell death was not triggered by a [Ca2+]i rise. Emptying of intracellular Ca2+ stores and/or influx of extracellular Ca2+ can modulate cell viability in many cell types. 15 However, Ca2+-independent cell death could be found in some cell types such as thymic lymphoma cells, 25 neutrophils, 26 and so on. Furthermore, celecoxib-induced cell death was found to involve apoptosis based on annexin V/PI staining, which is consistent with previous apoptotic effect of celecoxib observed in other cell types. 9 –11 However, at a concentration of 50 μM, celecoxib only killed less than 20% of hepatoma cells, suggesting that the hepatotoxicity of celecoxib is limited.
A plasma concentration of about 3 μM was achieved when celecoxib (1250 mg/kg) was fed to animals. 27 In children, celecoxib plasma concentrations were determined at intervals over 12 h after a 250-mg dose and again 1 week later after twice-daily dosing (steady state), and peak plasma concentrations of about 3.2 μM were achieved 3 h after drug administration. 28 After oral administration, celecoxib is rapidly absorbed and achieves peak serum concentration in about 3 h. It is extensively metabolized in the liver with very little drug (<3%) being eliminated unchanged. 29 Celecoxib is metabolized primarily through methyl hydroxylation to form hydroxycelecoxib. This reaction is largely catalyzed by CYP2C9. 30 Since celecoxib metabolism is predominantly mediated via CYP2C9, individuals who are poor metabolizers of CYP2C9 substrates have increased exposure to celecoxib (i.e. maximum plasma levels of ∼20–40 μM) compared to those with normal CYP2C9 activity (i.e. maximum plasma levels of ∼2 μM). 31 Because celecoxib is ∼97% protein bound, so the actual free concentration available to cells is far less than the total drug concentration. In our vitro assays, effects in the 10–50 μM range of celecoxib were reported. Even in poor metabolizers of CYP2C9 substrates that have a maximum plasma level of 40 μM, the free form of celecoxib is less that 2 μM. Thus, although the effects of celecoxib are likely not clinically relevant, they point to an unexpected effect on Ca2+ for this drug. Together, the results show that celecoxib induced Ca2+ release from endoplasmic reticulum in a phospholipase C-dependent manner and also caused Ca2+ influx via a protein kinase C-dependent, store-operated Ca2+ entry in HA59T human hepatoma cells. Celecoxib also induced Ca2+-independent apoptosis. A rise in [Ca2+]i can lead to numerous Ca2+-associated cellular responses, thus the effect of celecoxib on Ca2+ movement should be considered in other types of in vitro research in HA59T cells.
Footnotes
Conflict of Interest
The authors declared no conflicts of interest.
Funding
This work was supported by grants from Kaohsiung Veterans General Hospital (VGHKS101-019) to CR Jan and Chang Bing Show Chwan Memorial Hospital (RD10101) to HH Cheng.