
Abstract
We investigated the effect of copper (Cu) overload (20–160 µM/24 h) in two cell lines of human hepatic (HepG2) and pulmonary (A-549) origin by determining lipid and protein damage and the response of the antioxidant defence system. A-549 cells were more sensitive to Cu overload than HepG2 cells. A marked increase was observed in both the cell lines in the nitrate plus nitrite concentration, protein carbonyls and thiobarbituric acid reactive substances (TBARS). The TBARS increase was consistent with an increment in saturated fatty acids at the expense of polyunsaturated acids in a Cu concentration-dependent fashion. Antioxidant enzymes were stimulated by Cu overload. Superoxide dismutase activity increased significantly in both the cell lines, with greater increases in HepG2 than in A-549 cells. A marked increase in ceruloplasmin and metallothionein content in both the cell types was also observed. Dose-dependent decreases in α-tocopherol and ferric reducing ability were observed. Total glutathione content was lower in A-549 cells and higher in HepG2. Calpain and caspase-3 were differentially activated in a dose-dependent manner under copper-induced reactive oxygen species production. We conclude that Cu exposure of human lung- and liver-derived cells should be considered a reliable experimental system for detailed study of mechanism/mechanisms by which Cu overload exerts its deleterious effects.
Introduction
Copper (Cu) is an important oligoelement present in food and water and plays a key role as a catalytic cofactor for many mammalian enzymes. 1 –3 Nevertheless, excess Cu is potentially dangerous to human health because it can participate in the Fenton reaction, producing radical species 4 –6 and also contributes to the establishment of an oxidative stress condition leading to pro-oxidative damage of cellular molecules. 7 –10
Cu-derived minerals are used in the industry for the production of agrochemicals (pesticides, fungicides and dietary supplements for animal growth) 11 –14 in electronics and in Cu-based intrauterine devices (Cu-IUDs) that are widely used throughout the world. 15 –17 It therefore comes as no surprise that the metal can lead to environmental pollution, 13,14 a matter of growing international concern. 14 Populations are involuntarily exposed to Cu overload under subclinical and sub-symptomatological conditions, which are obviously very difficult to detect. 5 Chronic exposure to Cu is the most common problem, although it usually goes unnoticed; acute ingestion is not frequent. 1,12 Fortunately, mammalian cells have a highly effective system for the regulation of Cu homeostasis through a complex mechanism involving different kinds of specialized proteins. 18 –21 However, Cu overload cannot always be neutralized by this system. 5,12,20 It is a known fact that many human pathophysiological conditions are associated with the failure of Cu homeostatic machinery. 5,16
It is well documented that farmers handling agrochemicals and women using Cu-IUDs are chronically exposed to Cu ions. An enhancement of lipid peroxidation, protein oxidation and many other adverse effects in these people have been reported. 17,22 –34 In addition, Cu overload is associated with neurodegenerative disorders in humans. 16,17 Despite the growing concern over Cu overload, experimental studies in humans are difficult to perform. In addition, Cu-induced oxidative stress condition would be associated with decreased cell survival, especially in tissues directly exposed to possible metal overload, such as female reproductive system, liver and/or lungs. 16,17,33,35
Taking into account the above, our aim was to investigate (i) the differential response of the antioxidant defence system to Cu overload in two cell lines of human origin, (ii) the degree of damage caused in cellular lipids and proteins and (iii) the response of the proteins involved in Cu homeostasis, in order to determine the involvement of these damages in two main pathway of programmed cell death. We selected two human lung- and liver-derived cell culture systems (A-549 and HepG2 cells, respectively) as representative tissues that are in contact with air and/or endogenous (systemic) exposure to Cu pollution in living organisms. Hep-G2 cell cultures were previously used as an appropriate experimental approach for testing transition metals in general and for Cu-induced damage in particular; 36 –38 however, the A-549 cells remain still unexplored as a putative experimental system within this area. By contributing to the knowledge on Cu-induced damage in human cells, it is hoped that the findings of the present article will lead to more efficient protection of those people chronically (and involuntarily) exposed to this transition metal. 16,17,23 –32,34 Our results will also be useful in clarifying genetically conditioned Cu overload in humans 39 ,40 and stimulating research into Cu concentrations in food and tap water. 41 –45
Materials and methods
Chemicals
All chemicals used were of analytical grade and obtained from Sigma Chemical Co. (USA and Buenos Aires, Argentina), Merck (Darmstadt, Germany) and Carlo Erba (Milan, Italy).
Cell culture
Human liver (HepG2) and lung (A-549) cell lines were from American Type Culture Collection. Monolayer cultures were grown in Eagle’s minimum essential medium supplemented with 10% fetal calf serum (Natocor, Córdoba, Argentina) inactivated and microbiologically certified for cell culture.
Cell treatment and homogenization
Both HepG2 and A-549 cell lines were seeded and grown to semiconfluency in disposable culture flasks (Falcon, California, USA). Following 48 h of seeding, cultures were treated with fresh medium supplement with ultrafiltered (Millipore 0.22 μm, New York, USA) sterile phosphate-buffered saline (PBS) solutions of CuSO4 (final concentration of 20, 40, 80 and 160 μM). Control cultures, supplemented with an equivalent aliquot of PBS, were run simultaneously with treated cultures. After 24-h treatment, cells were harvested, washed with cold (4°C) sterile PBS (5 mL/three times), centrifuged (10 min at 1500g) and the pellet was manually homogenized on ice with 4 mL of PBS using a stainless-steel hand homogenizer (Khonte, Illinois, USA) to complete lysis (10 strokes, controlled by optical microscopic observation).
Cu measurement
Cu measurements were carried out according to the method of Berkovitch et al. 46 in samples (100 μL) previously mineralized with a mixture of 4 mL of nitric acid (HNO3; concentrated) and 1 mL perchloric acid (HClO4) of maximum purity available. The samples were then heated at 120°C for 60 min in a mineralization block. Digests were cooled, diluted with ultrapure water (18 m Ω cm, Carlo Erba, Milan, Italy) and ultrafiltered using a 0.22-μ Millipore membrane (Milli-Q Purification System, from Millipore, California, USA). Ultrafiltered dissolutions were directly aspirated into the flame of a Perkin-Elmer 1100 B Spectrophotometer equipped with a Perkin-Elmer cathode lamp (Perkin-Elmer Corp., Norwalk, Connecticut, USA) at a spectral width of 1 nm. Calibrations were performed with a standard solution of Cu(NO3)2 in HNO3 0.5 N (Tritrisol from Merck Co., Darmstadt, Germany). All measurements were carried out in peak height mode (324.7 nm line). The intra- ((SD/ξ)·100) and interassay (▵SD/▵ξ)·100) coefficients of variations were 10.5% and 6.0%, respectively.
Biomarkers of damage
Total nitrite plus nitrate ([NOx]) formation as the end metabolic product of nitric oxide (NO) and peroxinitrite (ONOO·−) was measured in cellular homogenates using the method of Griess. Samples were previously deproteinized and reduced with vanadium chlorhydrate. 47 The formation of the chromophore from the diazotization of sulfamide by nitrite at low pH, followed by coupling with the bicyclic amine, was detected at 405 nm after incubating the mixtures at 37°C for 30 min. Quantification was performed after calibration with standard solutions of sodium nitrate from Merck Co. (Darmstadt, Germany). Protein carbonyls (PCs) determination was performed according to the method of Reznick and Packer 48 after precipitation of proteins with trichloroacetic acid (TCA) and extraction of lipids with ethanol/ethyl acetate. 49 Aliquots of delipidated pellets were subjected to the reaction with dinitrophenylhydrazine in HCl 2 N at 37°C in the dark for 30 min. The corresponding hydrazone derivatives were measured at 505 nm. The concentration of PCs was calculated from a calibration curve prepared with a stock solution of sodium pyruvate (Sigma Chemical Co., Buenos Aires, Argentina). The extent of lipid peroxidation in the homogenates was evaluated by analyzing the levels of thiobarbituric acid reactive substances (TBARS). 50 Malondialdehyde (MDA) generated by lipid peroxidation reacted with thiobarbituric acid (TBA) mainly to yield TBA–MDA adducts, which were detected at 532 nm. The concentration of the chromophore was calculated from a calibration curve prepared with tetrametoxipropane from Sigma Chemical Co. (Buenos Aires, Argentina).
Antioxidant enzymes
Catalase activity was determined using the method of Aebi. 51 Kinetic measurements were performed at 220 nm for 2 min in a double-beam spectrophotometer (Cintra-20, Sydney, Australia) against a blank reaction without sample. The K value in the curves was electronically calculated using the following equation: k = (2.30/t) · log (DO f − DO i ). The specific activity of the enzyme was calculated considering the concentration of proteins corresponding to each sample. Superoxide dismutase (SOD) activity was determined using the method of Misra and Fridovich. 52 The optical density (DO) was recorded in a double-beam spectrophotometer (Cintra-20, Sydney, Australia) at a wavelength of 480 nm for 3 min. To calculate the concentration of SOD in the samples, a blank reaction without homogenate was performed in order to obtain the rate of the auto-oxidation of epinephrine (Δ Ref.). An enzymatic unit (units of inhibition of optical density (UID)) was defined as the amount that inhibits 50% auto-oxidation. The specific activity of the enzyme was calculated in terms of UID per minute·milligram of total cellular protein (TCP). Glutathione transferase (GT) activity was determined by the method of Habig et al. 53 The change in DO was recorded in a dual-beam spectrophotometer (Cintra-20, Sydney, Australia) at a wavelength of 340 nm for 3 min. The specific activity of the enzyme was calculated in terms of nanomoles of product per minute·milligram of TCP, with ∊ = 9.6 mM−1 cm−1. Glutathione peroxidase (GPx) activity was determined by the method of Flohé and Günzler 54 at a wavelength of 340 nm for 3 min. To calculate the enzymatic units (in terms of nanomoles of nicotinamide adenine dinucleotide phosphate per minute) an ∊ = 9.6 mM−1 cm−1 was considered. The specific activity was obtained as units of enzyme activity/corresponding value of TCP (milligram per millilitre). Glutathione reductase (GR) activity was determined by the method of Carlberg and Mannervik. 55 The optical density was recorded in a dual-beam spectrophotometer (Cintra-20, Sydney, Australia) against the reactive blank at 340 nm for 3 min. The specific activity of the enzyme was calculated in terms of micromoles of product per minute·milligram protein, with ∊ = 6.22 nM− 1 cm−1.
Antioxidant molecules
Total glutathione (G) content was determined by the glutathione reductase/dithio-nitrobenzoic method, able to measure both reduced glutathione (GSH) and glutathione disulfide(GSSG). 56 The optical density was recorded at 412 nm for 2 min in a two-beam spectrophotometer (Cintra-20, Sydney, Australia). To calculate the ratio, GSH/GSSG samples were reanalyzed after derivatization with divinyl-pyridine (3 mM final concentration). 17 Vitamin E (α-tocopherol) was measured after extraction with the Buttriss and Diplock method 57 using the high-performance liquid chromatography (HPLC) technique of Bagnati et al. 58 The results are expressed in micromoles concentration using pure α-tocopherol (Sigma Chemical Co., Buenos Aires, Argentina) as standard. The total ferric reducing ability (FRAP) assay was performed according to Benzie and Strain 59 in samples previously treated with excess uricase (Sigma Chemical Co., Buenos Aires, Argentina) at pH 3.6 in buffer acetic/acetate 300 mM with ferric-tripyridy-S-triazine (FeIII–TPZ). The complex was reduced to its ferrous (FeII) form, which can be measured by the generation of a chromophore with an intense blue colour detected at 593 nm. FRAP values were obtained by comparing the absorbance change (slope of the initial velocity reaction from 0 to 1 min) in sample mixtures with those containing ferrous ions at known concentrations.
Copper homeostatic proteins
Ceruloplasmin (CRP) was determined as described in detail by Martínez-Subiela et al. 60 Samples were analyzed by the conversion of p-phenylenediamine into a coloured product that was measured at 550 nm at 37°C in buffer glacial acetic/sodium acetate (50 mM, pH 5.5) directly into flat-bottom plates, using a Multi-Detector Microplate Reader SpectraMax M2/m2e model from Molecular Devices Analytical Technologies (Sunnyvale, California, USA). Intra- and interassay coefficients of variation were 8.3% and 4.4%, respectively. CRP concentrations were calculated by comparing with human pure CRP standard (Sigma Chemical Co., Buenos Aires, Argentina). Metallothioneins (MTs) were determined using the method described by Bienengräber et al. 61 using an atomic absorption spectrometer Avanta Ultra Z (GBC Scientific Equipment, Hampshire, Illinois, USA). For calculation, it was assumed that the stoichiometry of Ag+-thionein was 17 g at Ag+ per mole of MTs. 61
Calpains and caspase-3 activities
Milli- and micro-calpain activities were measured by the method of Botha et al. 62 The assay involves the hydrolysis of whole casein molecules by calpains and the subsequent detection of TCA-soluble peptidic fragments at 280nm. Varying the concentration of calcium chloride (CaCl2) in the incubation medium both isoforms can be determined (5 mM for milli- and 500 μM for micro-calpains). Caspase-3 activity was measured by a colorimetric assay kit (Sigma Chemical Co.) based on the hydrolysis of the peptide substrate acetyl-Asp-Glu-Val-Asp p-nitroaniline (Ac-DEVD-pNA) by caspase-3, resulting in the release of the p-nitroaniline (p-NA) moiety. p-NA has a high pick of absorbance at 405 nm.
Estimation of cellular viability
Parallel cultures were analyzed for cellular viability. Medium samples were collected and centrifuged (10 min at 10000g) and then ultrafiltered through Millipore membranes (0.22 μm) in order to completely remove cell debris. Appropriate aliquots were taken in order to determine the lactate dehydrogenase (LDH) activity by a kinetic ultraviolet (UV) method using the commercial kit Optima-LDH-P UV/AA from Wiener Laboratories (Rosario, Argentina). Results were determined in triplicate and expressed as milli-international units (mIU) LDH/millilitre of culture medium for A-549 and HepG2. In another series of culture flasks, attached cells were washed with PBS and treated with 100 μL of 0.1% solution of trypan blue dye (in PBS, pH 7.40). After 1 min incubation at room temperature, they were examined under optical microscopy to determine the percentage of viable cells according to the method described by Jauregui et al. 63 At least four fields of 100 cells per field were counted and the results were expressed as the percentage of viable cells.
Statistical analysis
All values represent the mean of four independent experiments ± SD. Within each experiment, the experimental points were assayed (at least) in triplicate. Data were analyzed by Student’s t test or two-way analysis of variance plus Tukey’s test with the aid of Systat (version 10.0 for Windows) from SPSS Science (Chicago, Illinois, USA). Results were also plotted and analyzed (regression and correlation) using Sigma Scientific Graphing Software (version 9.0) from Sigma Chemical Co. (St. Louis, Missouri, USA) and/or GB-STAT Professional Statistics Program (version 4.0) from Dynamic Microsystems Inc. (Silver Springs, Maryland, USA). Significance of statistical differences is indicated as *p < 0.05 (significant) and **p < 0.01 (very significant).
Results
Figure 1 shows the behaviour of Cu incorporation into the HepG2 and A-549 cell lines after exposure to different extracellular concentrations of Cu. The increase in Cu incorporation differed between the two cell lines at the concentrations of 40–160 µM; in the pulmonary cell line, the increase was almost sigmoidal, tending to reach a plateau after 40–80 µM, with a clear first phase of rapid uptake followed by slower incorporation of the external concentration of 40 µM. HepG2 on the other hand exhibited a hyperbolic-like incorporation that reached significant increases after 80 µM Cu. At 160 µM, the uptake was 172% and 250% higher, respectively, than in the control data for HepG2 and A-549 cells.

Cellular Cu concentration (μgCu/mg of TCP) versus Cu concentration (20–160 µM) in the extracellular medium. Results are expressed as mean ± SD of four independent experiments (each point assayed in triplicate). White circles indicate HepG2 cells and black circles indicate A-549 cells. Significant differences (Student’s t test) over control data are indicated by *p < 0.05 and **p < 0.01. Cu: copper. TCP: total cellular protein.
Figure 2 shows the results for the determination of biomarkers of oxidative stress after exposure of the two cell types to Cu ions. There was a marked increase in [NOx] (panel A), which are end-metabolic products of the metabolism of NO and peroxynitrite anion formed through the inducible NO synthase (iNOS) activation. PCs (markers of oxidative damage to proteins; panel B) and TBARS (biomarkers of lipid peroxidation, panel C) were also significantly higher in both cell lines exposed to increasing concentrations of Cu ions. Although the external Cu concentration of 20 µM was not able to significantly modify the uptake of Cu into A-549 cells (Figure 1), it was sufficient to produce a significant increase in TBARS, PCs and [NOx]. Higher concentrations (40–160 µM) produced further increases (Figure 2).
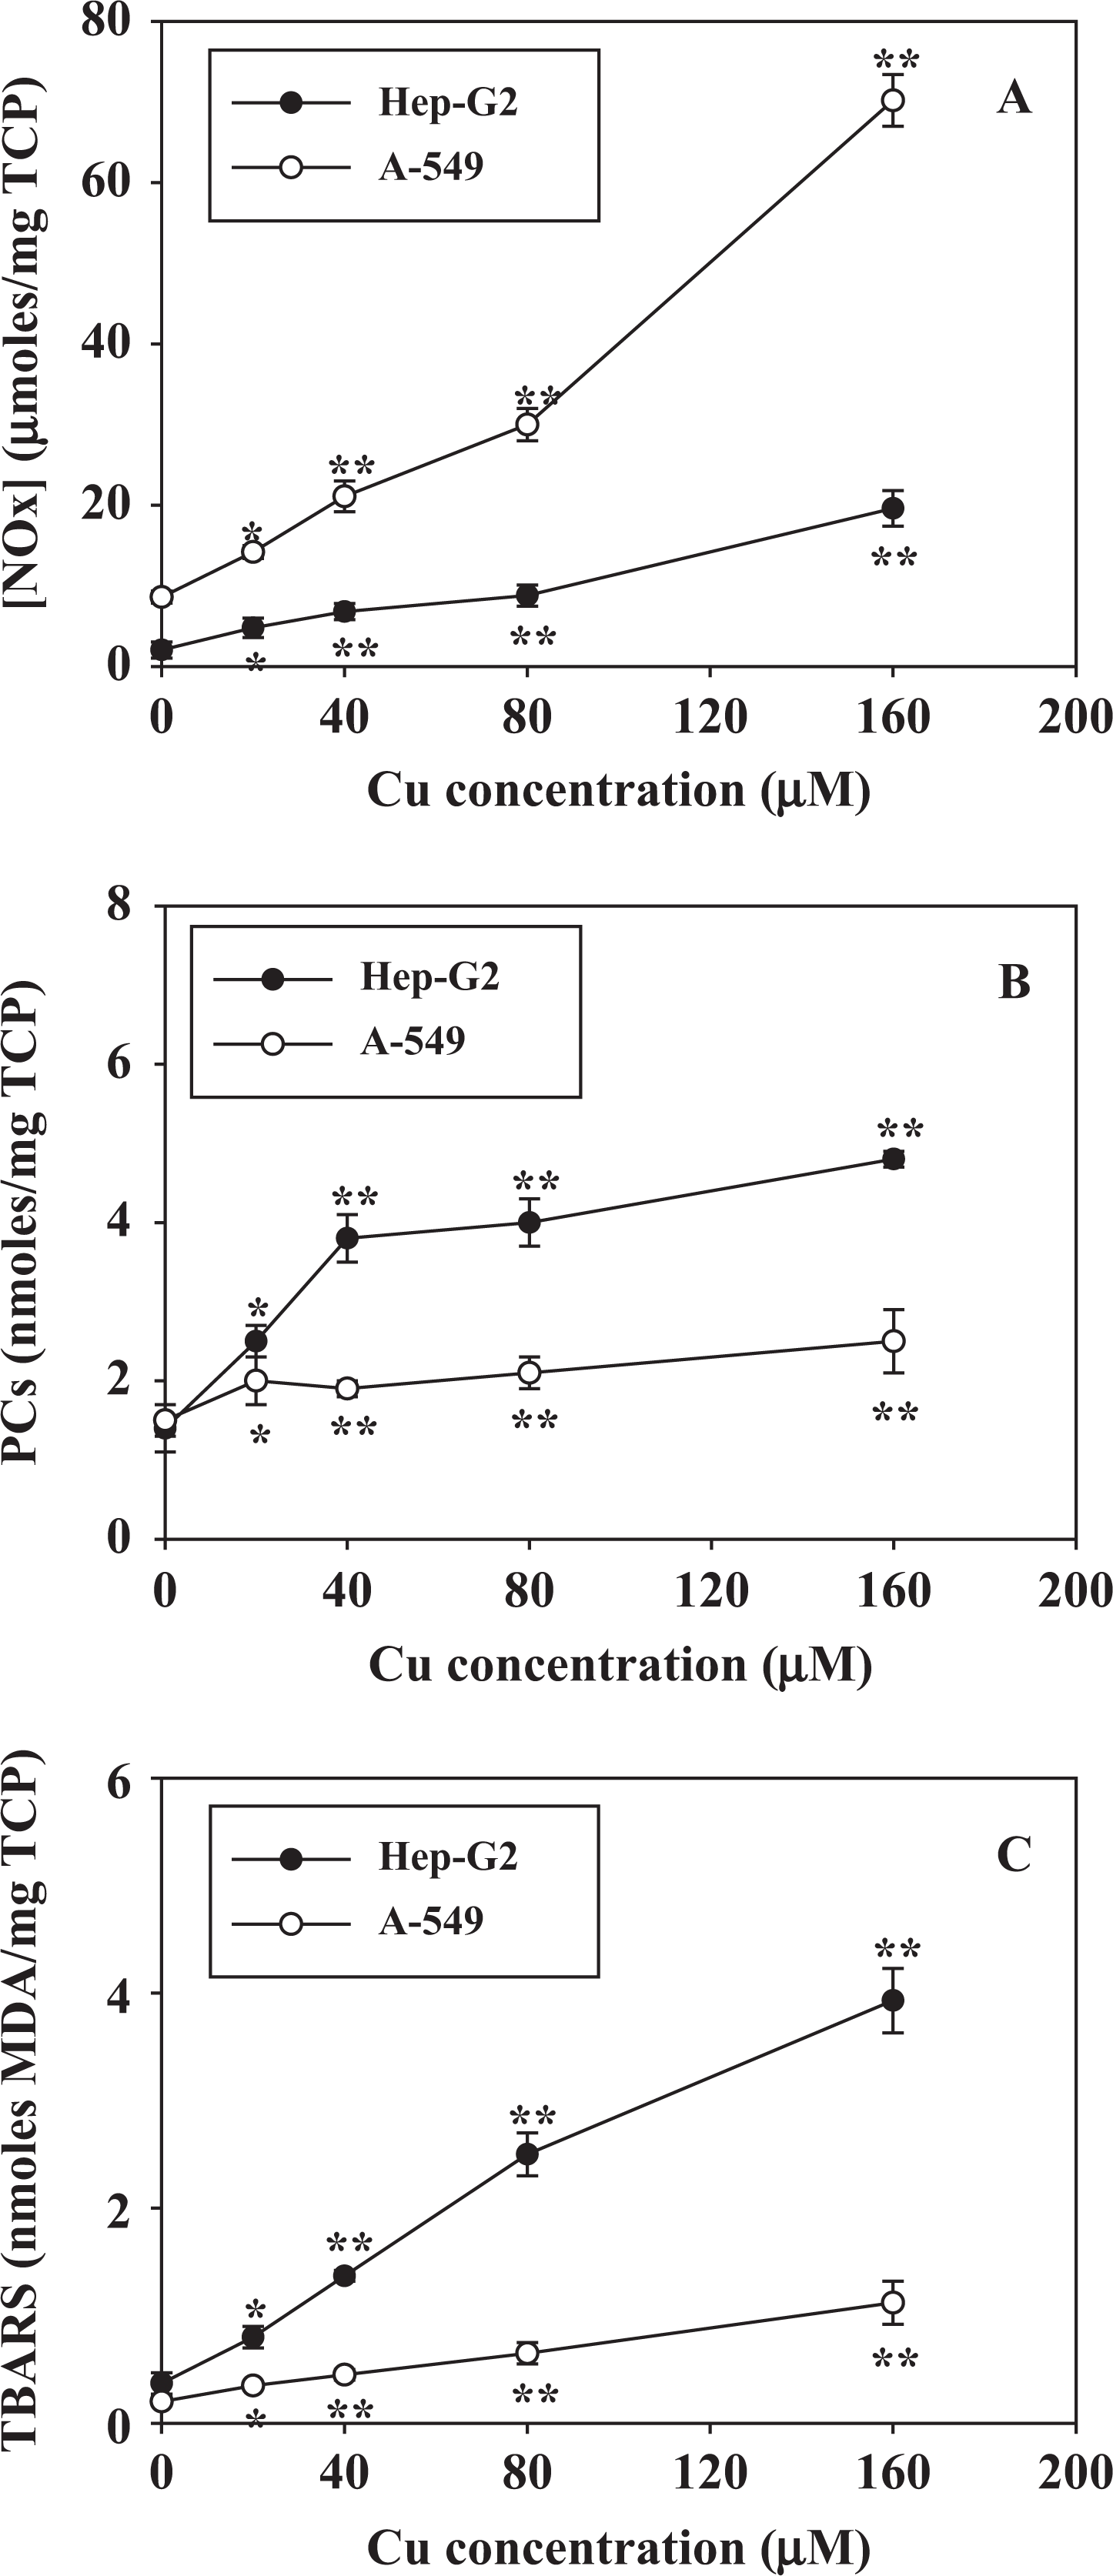
Biomarkers of oxidative damage ([NOx], panel (a); PCs, panel (b); TBARS, panel (c)) in HepG2 (black circles) and A-549 (white circles) cells exposed to increasing concentrations of copper (20–160 µM) in the culture medium. Results are expressed as the mean ± SD of four independent experiments (each point assayed in triplicate). Statistical significance (Student’s t test) is indicated by *p < 0.05 and **p < 0.01. [NOx]: nitrates plus nitrites; PCs: protein carbonyls; TBRAS: thiobarbituric acid-reactive substances.
The increase in TBARS levels observed in HepG2 and A-549 cell lines is consistent with the results obtained by analyzing the composition of fatty acyl methylesters. A relative increase in saturated fatty acids was observed at the expense of polyunsaturated acids (PUFAs) in a Cu concentration–dependent fashion (Figure 3(a) and (b)). The 20:4 content of the PUFA fraction at >20°C was very low in both cells, a finding previously reported in many other culture cell lines. The increase in saturated fatty acids and decrease in PUFAs were proportional to the concentration of Cu in the culture medium for both types of cells (Figure 4). In fact, these changes resulted in a marked decrease in the unsaturation index (UI) from values of 125.9 ± 6.4 and 81.4 ± 3.7 in control HepG2 and A-549, respectively, to 77.6 ± 5 1 and 53.3 ± 2.8 in cells treated with 160 µM Cu ions. The linear decline in the UI (Figure 4(a)) of both cell lines reached a similar magnitude (approximately – 65% change) at 160 µM concentration. A similar Cu-dependent decrease in UI values was observed as a function of the intracellular Cu concentrations expressed as microgram of Cu per milligram TCP. However, in these cases, the behaviour was not linear (Figure 4(b)), especially when taking the whole range of intracellular Cu concentrations into consideration: more detailed analysis shows a two-phase–dependent effect characterized by first and second linear functions with very different slopes (dash lines in Figure 4(b)).

Fatty acyl composition of total lipids from HepG2 (a) and A-549 (b) cells analyzed after treatment with increasing concentrations of Cu (20–160 µM indicated by grayscale bar to black at 160 µM) compared with no Cu addition (white bar). Results are expressed in terms of the mean of mole percentage ± SD of four independent experiments (each point assayed in quadruplicate). Significant difference (two-way ANOVA + Tukey’s test) compared with the control is indicated by *p < 0.05. ANOVA: analysis of variance; Cu: copper.

Regression plots calculated between UI and external Cu concentration (a) or cellular copper content (b) in HepG2 (black circles) or A-549 (white circles) cells. Correlation coefficients in panel (a) are indicated as r2. Slopes for the two parts of the curves in panel (b) are indicated by dashed lines. Values are the mean ± SD of four independent experiments taken from data in Figures 1 and 3. Cu: copper; UI: unsaturation index.
Figures 5 and 6 show the effect of different concentrations of Cu on the activities of the main enzymes involved in the antioxidant defence system in cultured HepG2 and A-549 cells. All enzymes, except catalase in A-549 (Figure 5, upper panel), exhibited significant changes in response to the oxidative insult caused by Cu overload. Changes in SOD activity (Figure 5, lower panel), considered the sentinel enzyme biomarker of oxidative stress conditions, were observed mainly in HepG2 cell homogenates (almost sixfold higher than control values compared with approximately threefold higher for A-549). A dose-dependent modification of enzyme activities was observed, although in some cases, there was an evident saturation effect with an incipient plateau (Figure 6). Changes in antioxidant enzyme activity were concomitant with a response of the Cu-homeostatic system (Figure 7). In fact, there was a marked increase in CRP and MT content in both cell types. HepG2 cells showed higher basal levels of both proteins and also showed a stronger response to Cu overload than A-549 cells. While the concentration of CRP tends either to decline (HepG2) or stabilize (A-549) after 40 µM of external Cu (Figure 7(a)), the level of MTs remains almost a constant within the range of Cu concentrations assayed (Figure 7(b)).
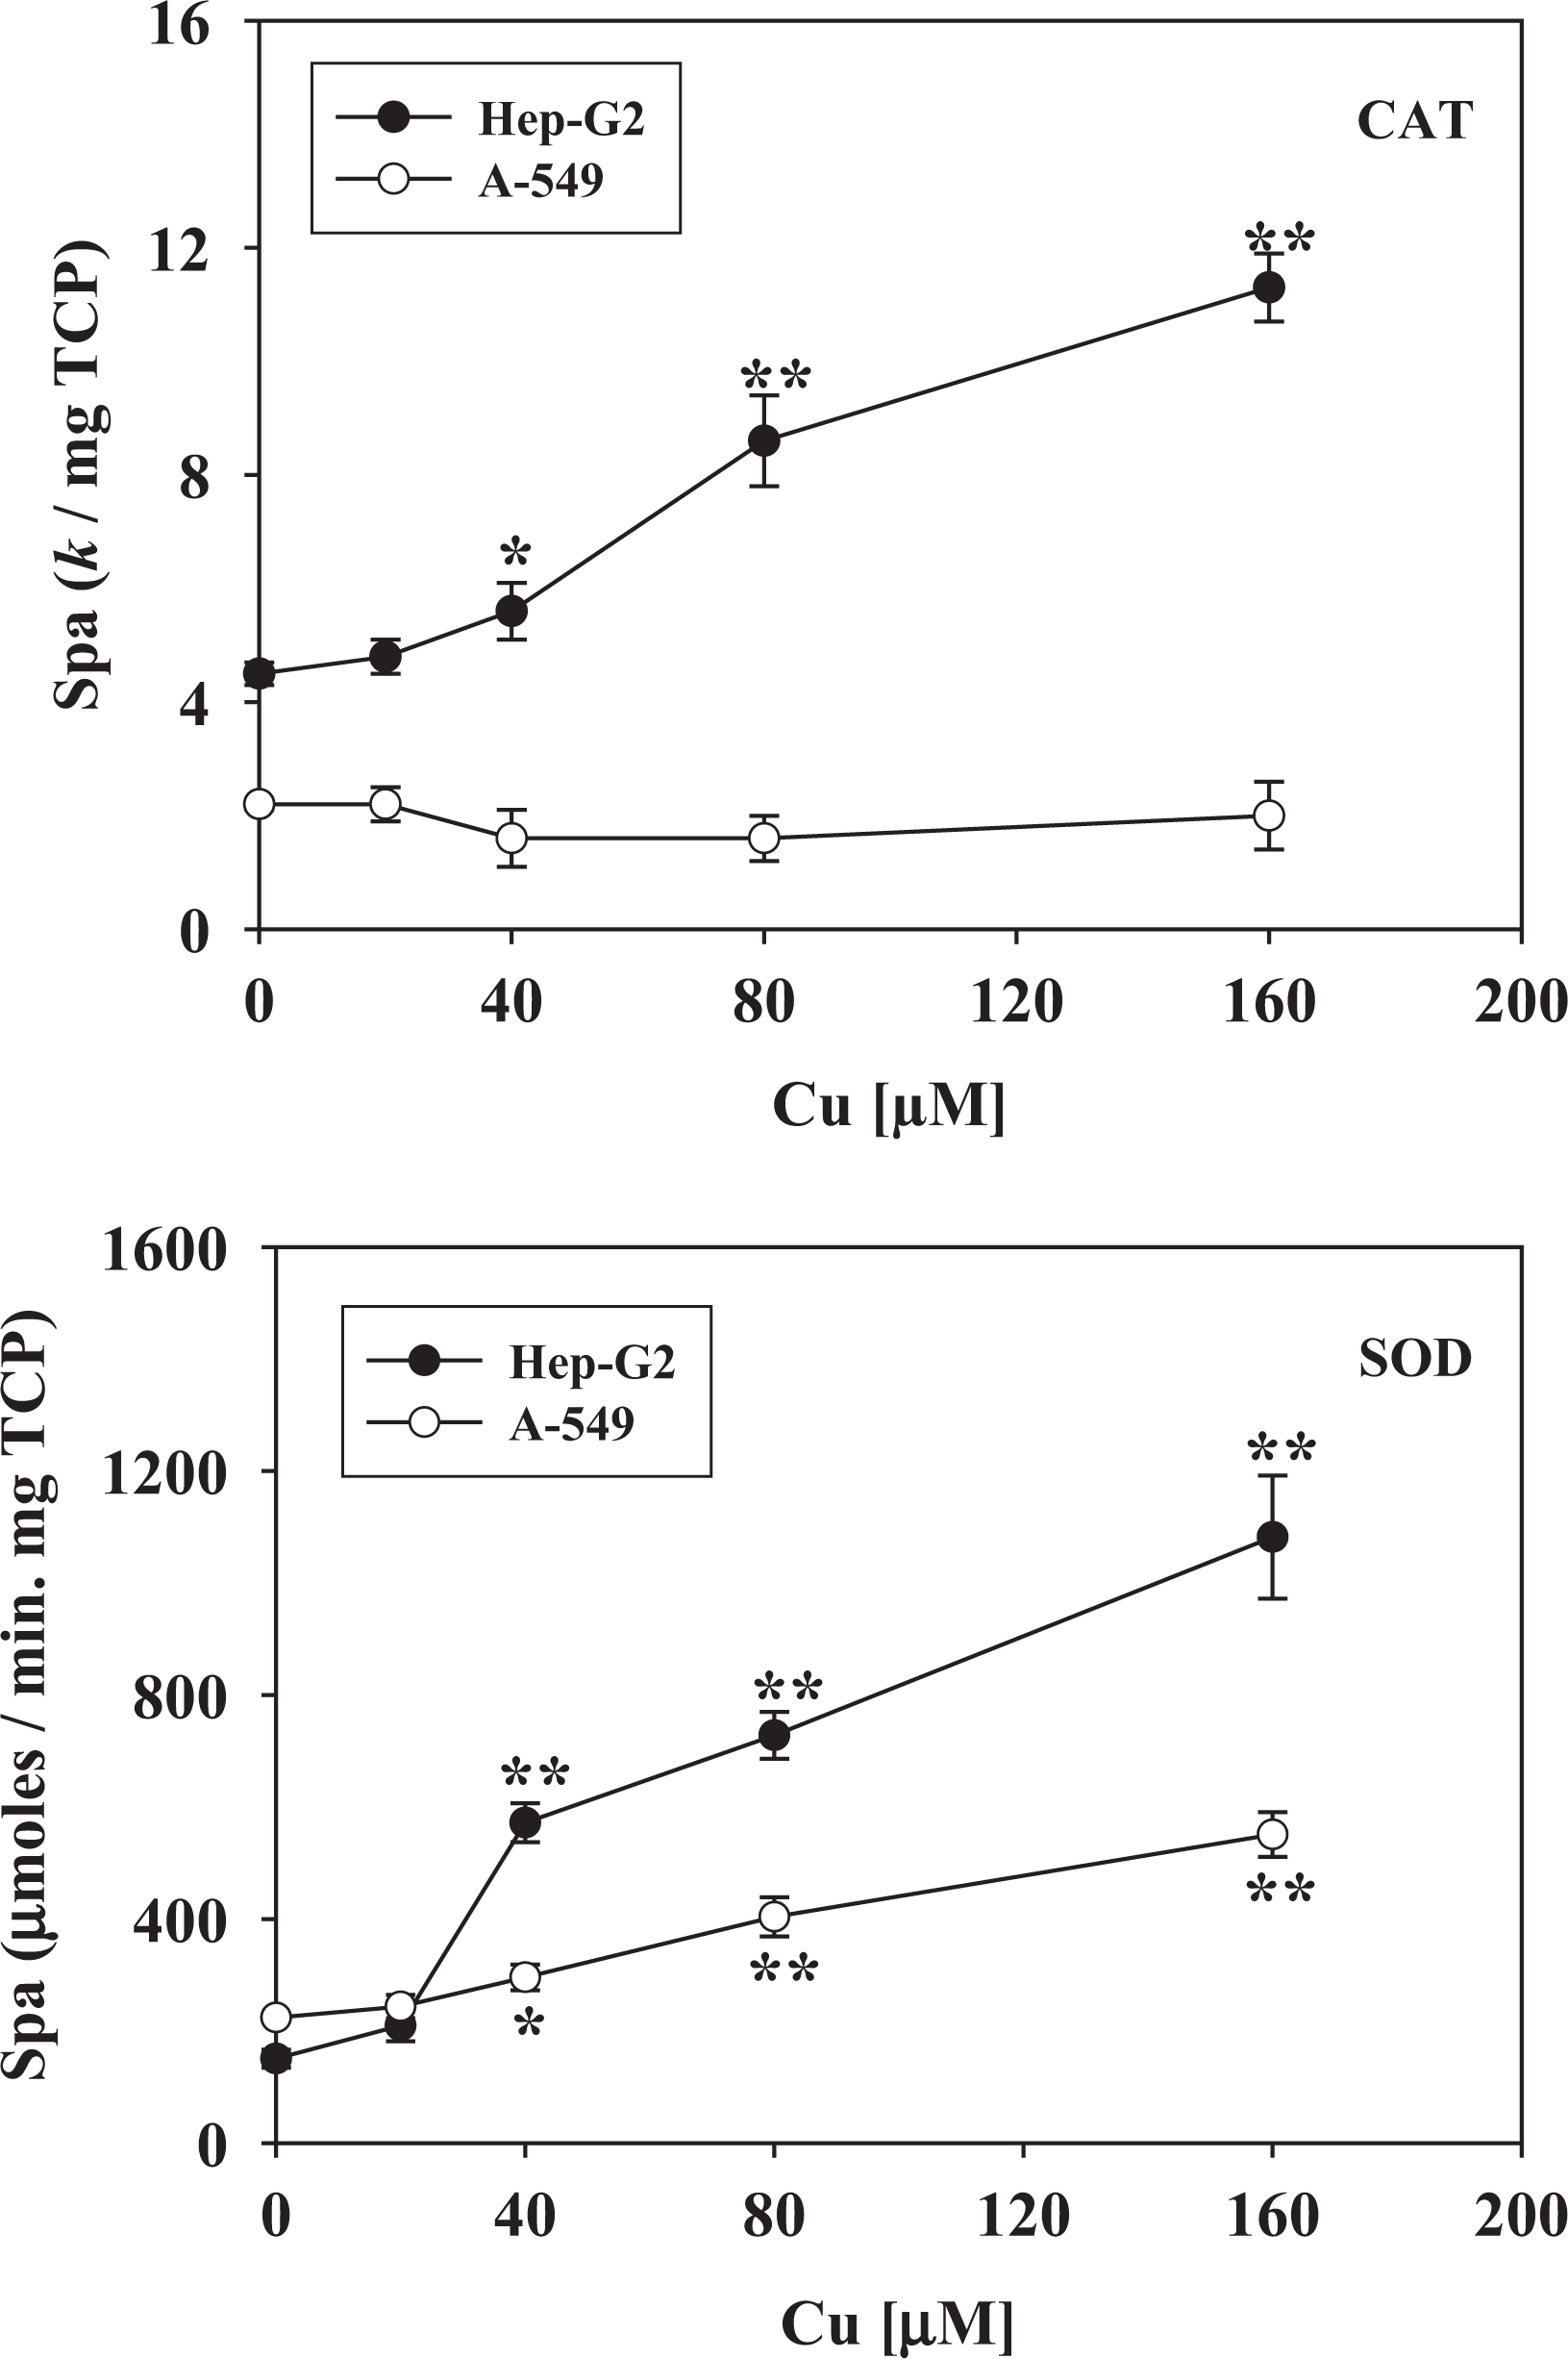
Specific activities of CAT (upper panel) and SOD (lower panel) from HepG2 (black circles) or A-549 (white circles) cellular homogenates of cultures exposed to increasing concentrations (20–160 µM) of Cu. Results are expressed as the mean ± SD of four independent experiments (each point assayed in quadruplicate). Statistical differences (Student’s t test) are indicated by *p < 0.05 and **p < 0.01. CAT: catalase; Cu: copper; SOD: superoxide dismutase.

Specific activities of GR (CAT, upper panel), GT (medium panel) and GPx (lower panel) from HepG2 (black circles) or A-549 (white circles) cellular homogenates of cultures exposed to increasing concentrations (20–160 µM) of Cu. Results are expressed as the mean ± SD of four independent experiments (each point assayed in quadruplicate). Statistical differences (Student’s t test) are indicated by *p < 0.05 and **p < 0.01. CAT: catalase; Cu: copper; GR: glutathione reductase; GT: glutathione transferase; GPx: glutathione peroxidase.
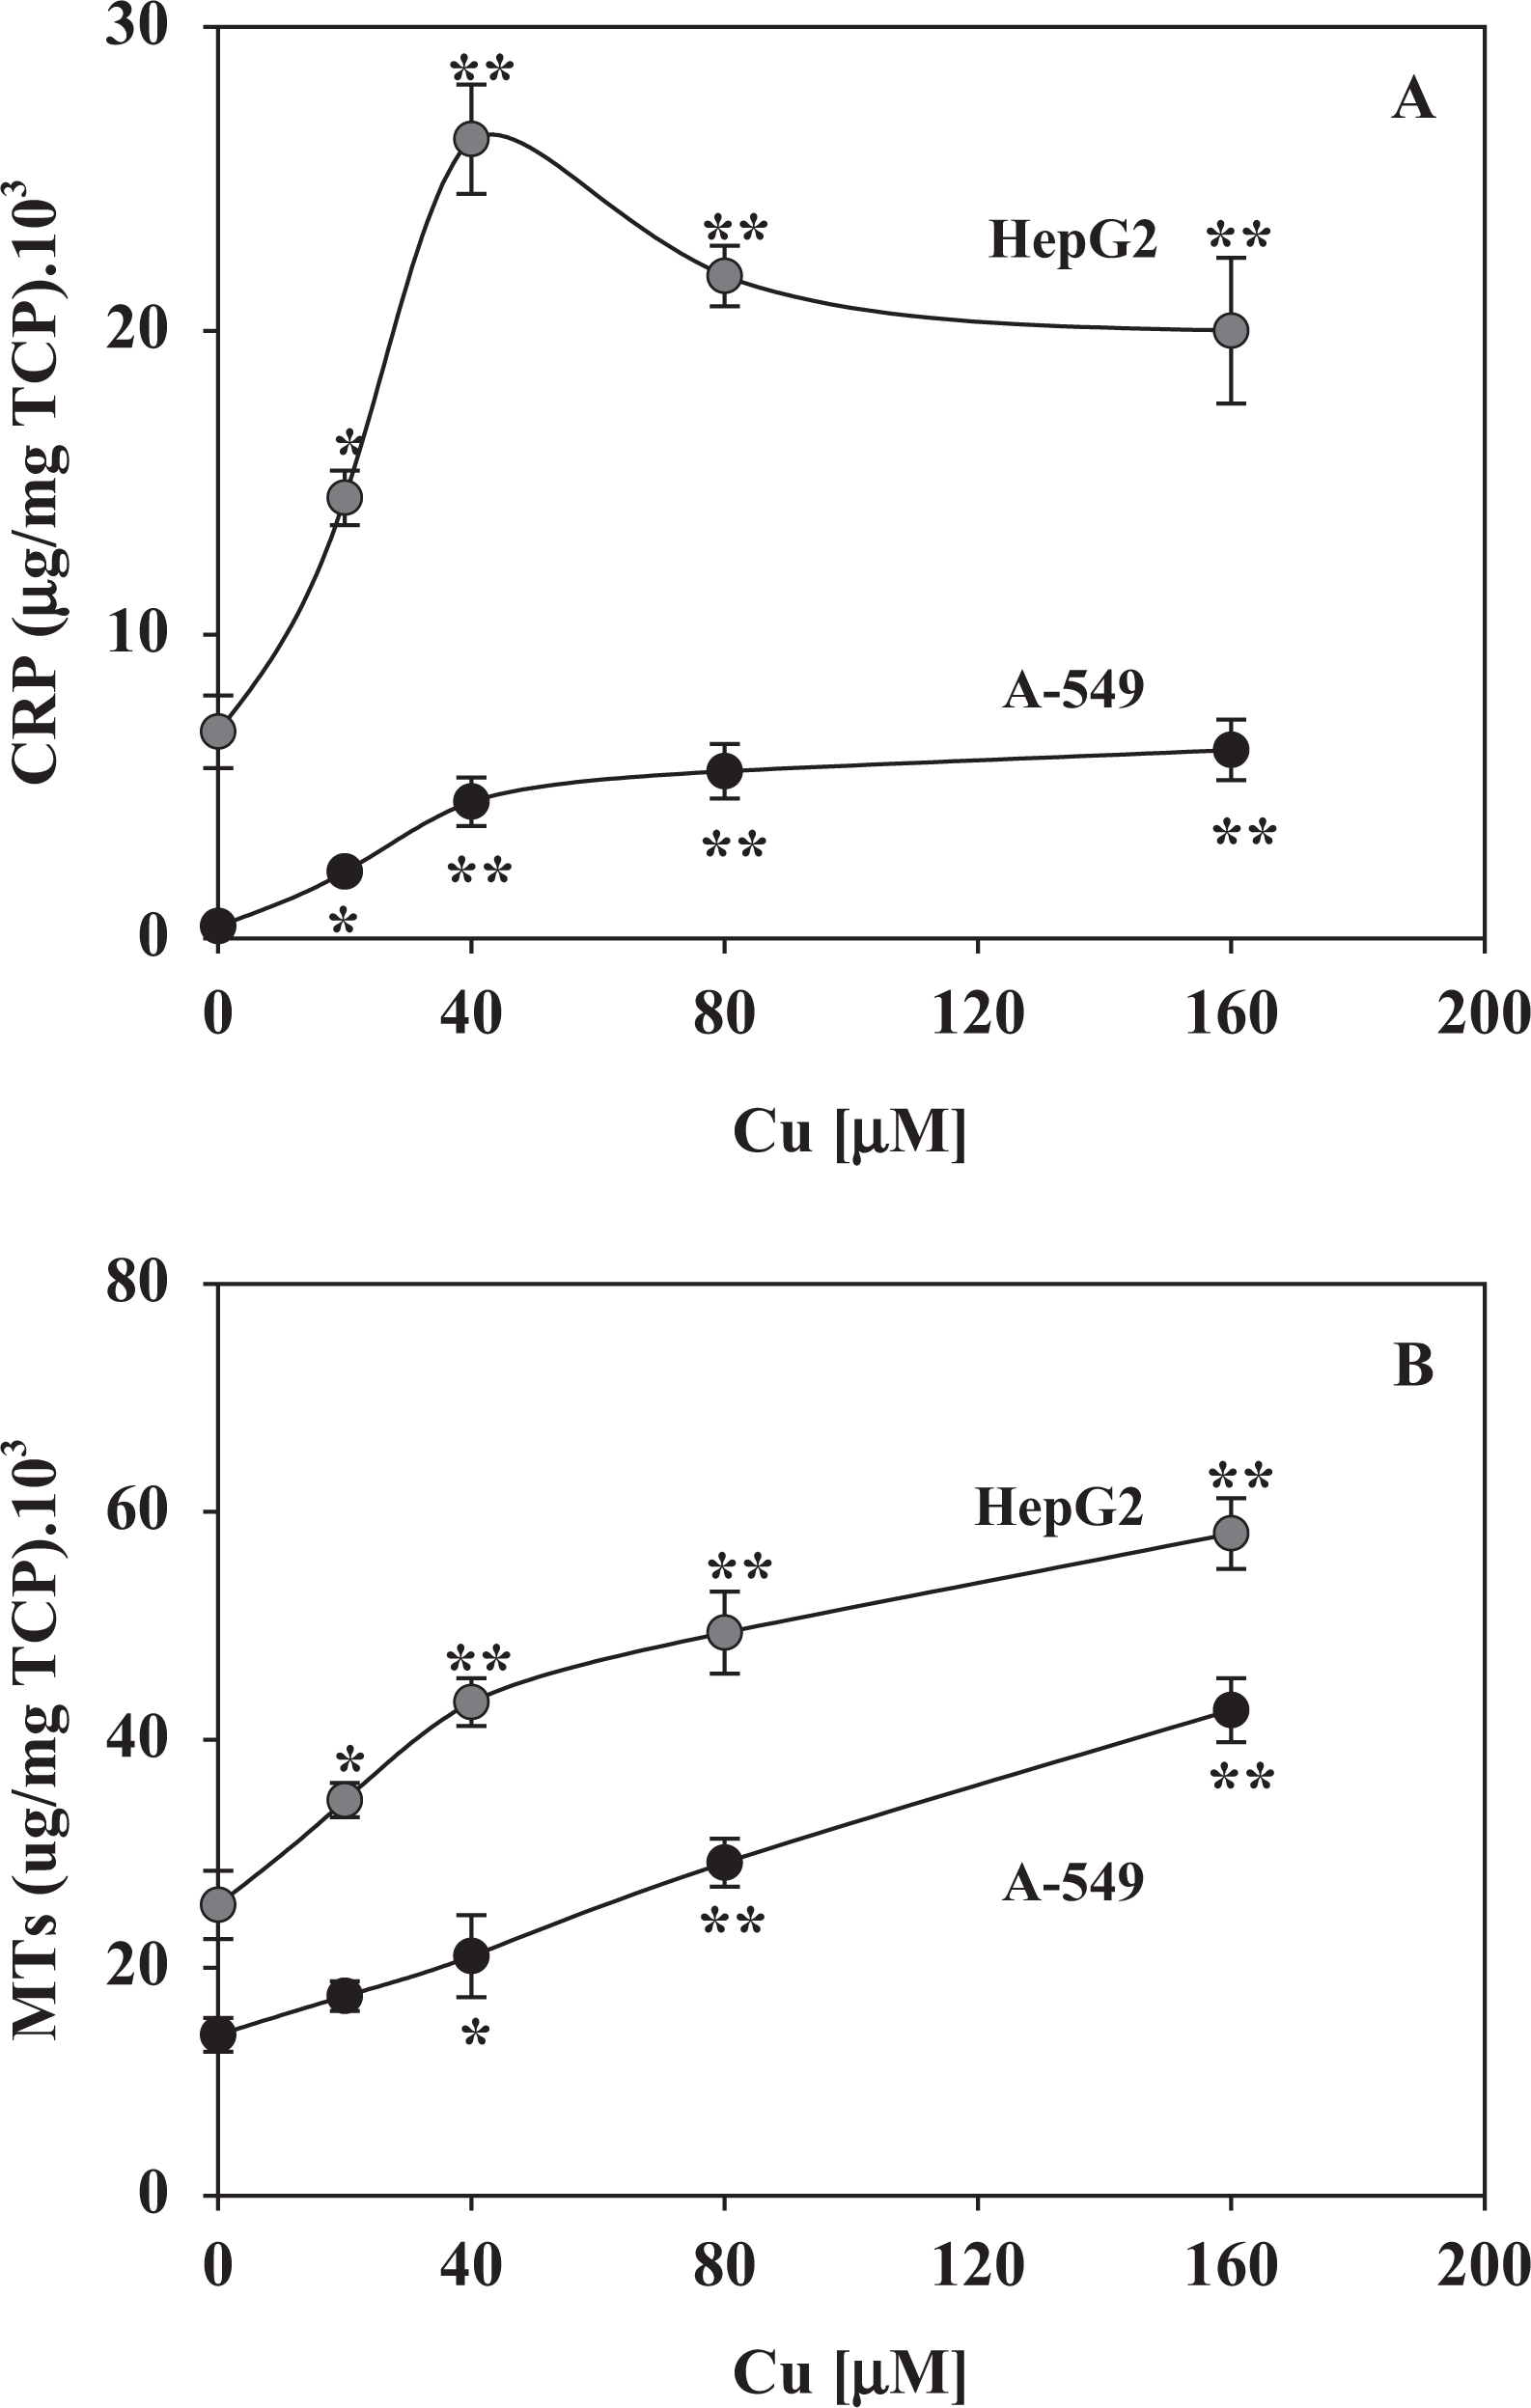
Concentrations of CRP (panel (a)) and MTs (panel (b)) of HepG2 (gray circles) or A-549 (black circles) culture cells exposed to increasing concentrations (20–160 µM) of Cu++. Results are calculated in relation to the TCPs and are expressed as the mean ± SD of four independent experiments (each experimental point assayed in triplicate). Statistical significance (Student’s t test) with respect to control data (no Cu++ addition) is indicated by *p < 0.05 and **p < 0.01. Cu: copper; CRP: ceruloplasmin; MT: metallothioneins; TCPs: total cellular proteins.
Figure 8 shows the concentration of lipo- and water-soluble antioxidants in HepG2 and A-549 homogenates after exposure to increasing Cu concentrations. Glutathione was found to be a key component within the hydrophilic compartment of the cellular redox system (Figure 8(a)), whereas α-tocopherol (Figure 8(b)) was the main fat-soluble antioxidant in mammalian cells. Clearly, a significant dose-dependent decrease was observed in both antioxidants after exposure to Cu concentrations of ≥40 µM. Tocopherol was significantly lower even at 20 µM Cu, depletion being more pronounced for HepG2 cells than for A-549. Glutathione content was significantly lower in A-549 and higher in HepG2 cells (Figure 8(a)).

Concentration of hydro-soluble (total glutathione, GSH + GSSG) and liposoluble (α-tocopherol) antioxidants in HepG2 (black circles) or A-549 (white circles) cellular homogenates after exposure to increasing concentrations of Cu (20–160 µM). Results are expressed as mean ± SD of four independent experiments (each experimental point assayed in triplicate). Values differing significantly (Student’s t test) from control data are indicated by *p < 0.05 and **p < 0.01. Cu: copper; GSH: reduced glutathione; GSSG: glutathione disulfide.
Figure 9 shows a significant dose-dependent decrease in the FRAP for the both cell line homogenates at increasing concentrations of Cu. FRAP values correlated well with the loss of α-tocopherol as one of the largest contributors to the total reducing power of the assay (Figure 10). It should be noted that under our working conditions, uric acid (another important endogenous reducing agent) was broken down by treatment with excess uricase and thus data correlated directly with those antioxidant vitamers present in the samples. It is also important to note that the deleterious effects were higher for HepG2 cells exhibiting an almost linear decrease within the range of external Cu concentrations between 0 and 80 µM.

Total antioxidant capacity of cellular homogenates of HepG2 (black circles) or A-549 (white circles) cells exposed to increasing concentrations of Cu (20–160 µM). Results are expressed as mean ± SD of four independent experiments (each experimental point assayed in quadruplicate) as micromolar equivalents of Trolox® (diacetyl-tocopherol). Statistical significance (two-way ANOVA + Tukey’s test) of data is indicated by *p < 0.05 and **p < 0.01. ANOVA: analysis of variance; Cu: copper.
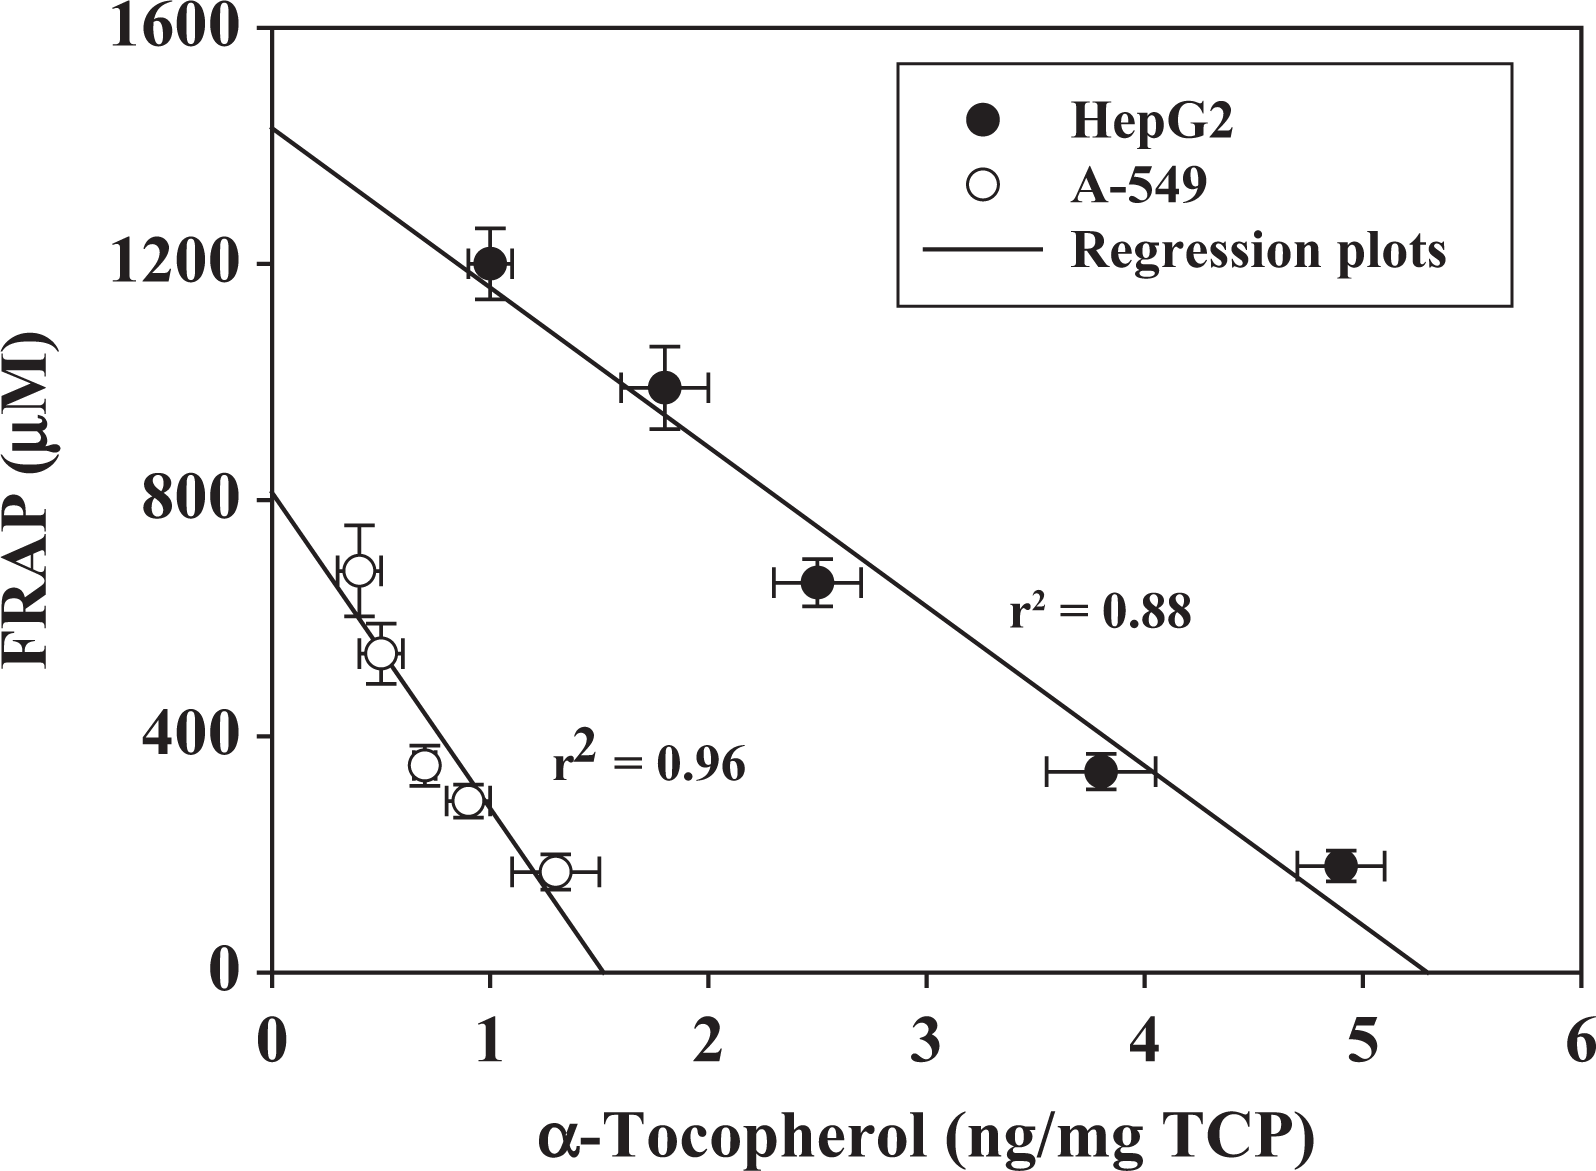
Correlation coefficients (r2) between FRAP values (Figure 8) and α-tocopherol concentrations (Figure 7(b)). Data are mean ± SD of four independent experiments. FRA: ferric reducing ability.
Figure 11 shows the inverse relationship between GSH/GSSG ratio and the internal copper concentration for both the types of cell cultures.

Inverse relationship between the GSH/GSSG ratio and the internal copper concentration in HepG2 (circles, upper panel) and A-549 (squares, bottom panel) cells. Results are expressed as mean ± SD of four independent experiments (each experimental point assayed in triplicate). Statistical significance (two-way ANOVA + Tukey’s test) of data is indicated by *p < 0.05 and **p < 0.01. ANOVA: analysis of variance; ; GSH: reduced glutathione; GSSG: glutathione disulfide.
Parameters associated with cell survival were shown in Table 1. Viable cells estimated by LDH leakage and trypan blue dye exclusion test decreased concomitantly with the increment in Cu concentration. The two-phase behaviour of caspase-3 activity as a function of internal copper concentration is shown in Figure 12. Both calpain activities (micro and milli) progressively increased (almost linearly) as a function of internal Cu overload (Figure 13).

Caspase-3 activities in HepG2 (circles, upper panel) and A-549 (squares, bottom panel) cells as a function of the internal copper concentration. Results are expressed as mean ± SD of four independent experiments (each experimental point assayed in triplicate). Statistical significance of data (two-way ANOVA + Tukey’s test) is indicated by *p < 0.05 and **p < 0.01. ANOVA: analysis of variance.

Milli- (black circles) and micro-calpaine (open circles) activities in HepG2 (upper panel) or A-549 (bottom panel) cells. Results are expressed as mean ± SD of four independent experiments (each experimental point assayed in triplicate). Statistical significance (two-way ANOVA + Tukey’s test) of data is indicated by *p < 0.05 and **p < 0.01. ANOVA: analysis of variance.
LDH activity in media from HepG2 and A-549 cells and PV in cultures expose to different degrees of Cu overload. a
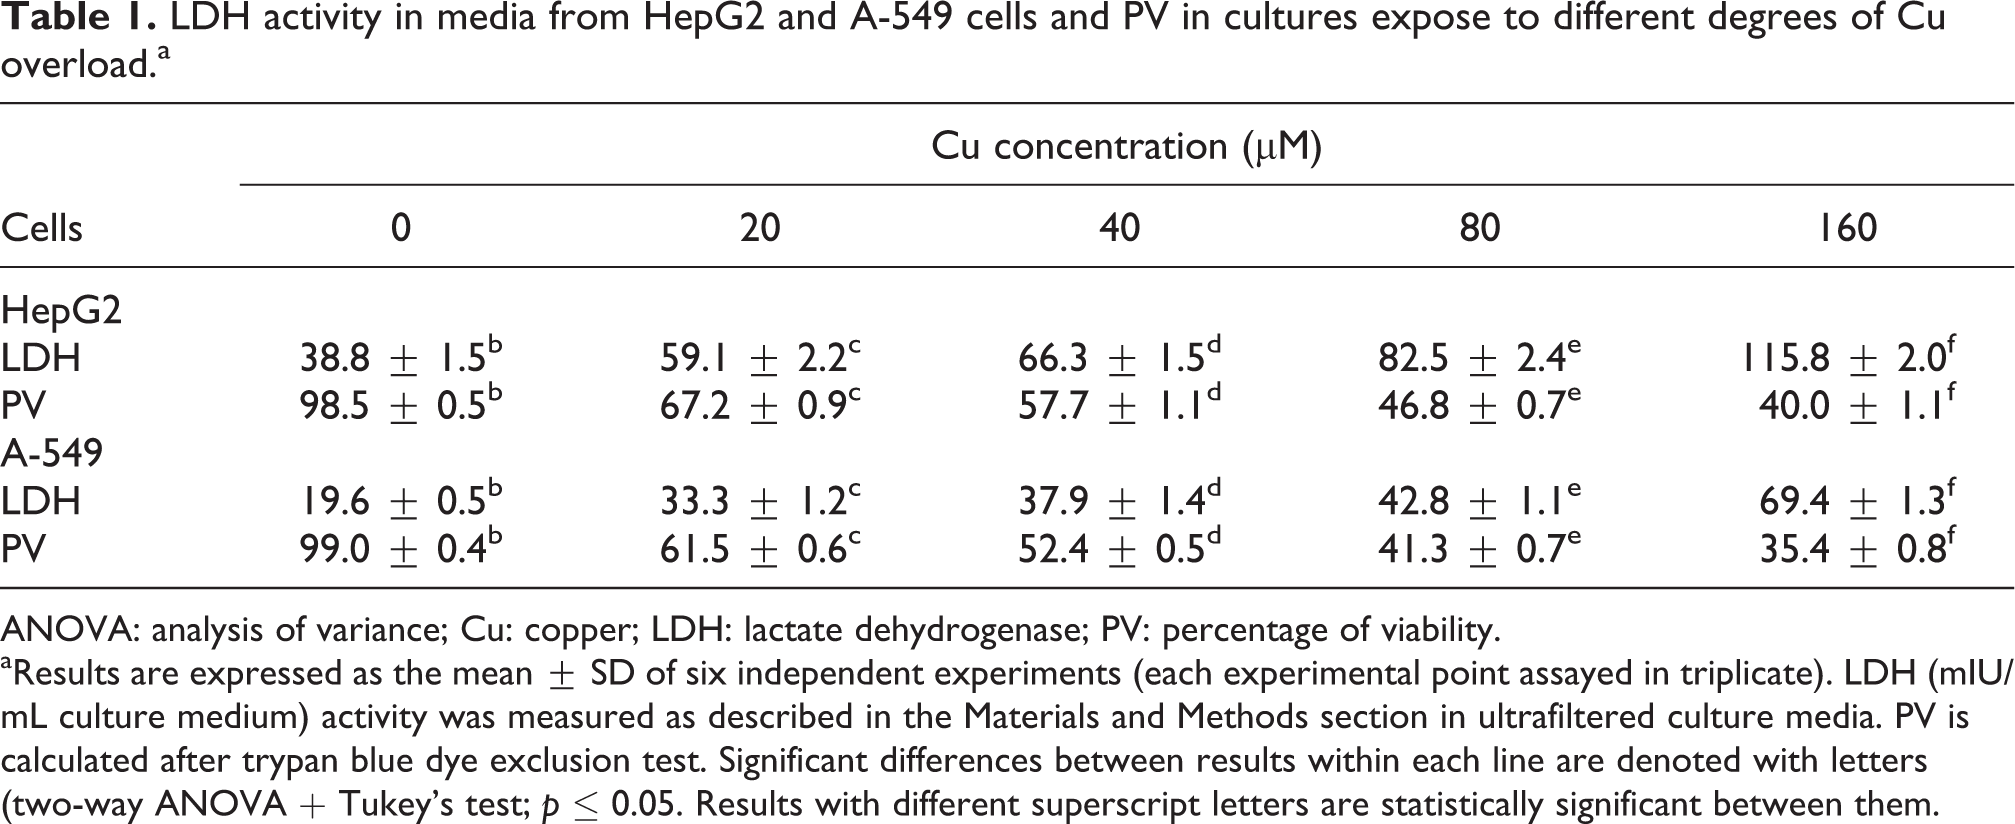
ANOVA: analysis of variance; Cu: copper; LDH: lactate dehydrogenase; PV: percentage of viability.
aResults are expressed as the mean ± SD of six independent experiments (each experimental point assayed in triplicate). LDH (mIU/mL culture medium) activity was measured as described in the Materials and Methods section in ultrafiltered culture media. PV is calculated after trypan blue dye exclusion test. Significant differences between results within each line are denoted with letters (two-way ANOVA + Tukey’s test; p ≤ 0.05. Results with different superscript letters are statistically significant between them.
Discussion
Reactive oxygen species (ROS) overproduction and biomarkers of damage
The findings of the present article demonstrate that exposure of lung- (A-549) and hepatic-derived (HepG2) human cells to Cu overload produces an enhancement of intracellular Cu ions with the establishment of an oxidative stress conditions and subsequent (an differential) activation of proteases involved in programmed cell death.
At low concentrations, the uptake of Cu is partially buffered by the Cu homeostatic protein system. 21,64 However, higher concentrations (40–160 µM) probably exceed the buffer capacity of this system, resulting in a significant increase in Cu in both cell lines. It is known that mammalian cells have a family of proteins called copper transporters (Ctrs) responsible for the incorporation of Cu from the extracellular medium. 65,66 The number (and the biological activities) of Ctrs in the cell surface depends on the Cu concentration in the surrounding environment. At low Cu concentrations, the level of Ctr in the membrane increased and the incorporation of Cu from the external medium actively rose. 20 At high Cu concentrations, however, the transporters were actively internalized in clathrin-coated vesicles, which reduced the incorporation of the metal and confined the excess within this subcellular compartment. 67 Nevertheless, excess Cu can cross the cytoplasmic membrane via other general ion channels 21 and it is probable that the elevated Cu concentration observed in our experiments was mainly the consequence of this second mechanism. Concomitantly with the high internal Cu concentration in HepG2 and A-549, we found elevated levels of Cu homeostatic proteins, CRP and MTs. These two proteins sequestrate free Cu and work in conjunction with other proteins in regulating the delivery of the metal to a variety of cuproenzymes. 18 –21
The damage associated with Cu overload derives from its ability to participate in the Fenton or Häber-Weiss reactions, which actively produce ROS. 4 We demonstrate that the Cu overload induced damage in cellular lipids and proteins in both the types of cell cultures from human origin. These results are in agreement with those of Pourahmad and O’Brien 68 who have reported a rapid enhancement of ROS production after exposure of a hepatic cell line to 50 µM Cu. They also reported increasing TBARS formation as a sign of lipid peroxidation. We observed increased formation of TBARS and significant changes in the fatty acyl profile of both cell types, which is compatible with lipid peroxidation of (preferentially) PUFAs. MDA and 4-hydroxy-nonenal (4-HNE) are routinely used as biomarkers of lipid damage. 69 Letelier et al. 70 have suggested that PUFAs are more vulnerable to ROS attack than other fatty acids (even at very low concentrations of oxygenated radical species) and that TBARS are more sensitive biomarkers of pro-oxidant induced damage than other commonly used markers such as PCs and [NOx]. In agreement with this, our results demonstrate a significantly higher TBARS concentration compared with the other stress biomarkers studied (for both cell lines, even at low Cu concentrations). Letelier et al. 70 have previously reported an almost selective destruction of PUFAs caused by overproduction of ROS, which is in agreement with the clear correlation between PUFA pro-oxidative destruction and the level of TBARS found in our experiments.
In addition, it is well known that the overproduction of TBARS is able to oxidize proteins contributing to the formation of PCs. 69 ,71 Suji and Sivakami 71 demonstrated a positive correlation between MDA concentration and PCs production. These findings suggest that the increased PCs could be the result of ROS attack on proteins, the high concentration of TBARS that further enhances protein carbonylation, or a combination of these two mechanisms. Furthermore, Davydov et al. 69 stated that protein adducts produced by the aldehyde-covalent modification of the proteins are more resistant to intracellular proteolysis due to their inhibitory effect on the proteolytic activity of proteosomes, indicating that PCs are more stable biomarkers of damage than TBARS.
The observed increases in the levels of [NOx] could be the consequence of iNOS activation, the expression of which is known to be regulated by ROS via the c-Jun N-terminal kinase/activator protein-1 (JNK/AP1) and Janus tyrosine kinase 2/interferon regulatory factor 1 (Jak2/IRF1) pathways. 72 We can, therefore, assume that the overproduction of [NOx] is a consequence of Cu-induced ROS accumulation. This phenomenon adds a new dimension to the damage associated with Cu overload, since it indicates the establishment of nitrosative stress derived from the reaction between NO and superoxide, giving rise to the powerful pro-oxidant ONOO·−. 4
All modifications discussed above are in agreement with the reaction of the enzymatic antioxidant defence system. With the exception of GR activity, which was significantly reduced after Cu exposure, all other enzyme activities were higher. The results indicate that HepG2 cells have a stronger response to Cu overload than A-549 cells. These results agree with previous studies by Yang et al. 73 who demonstrated that HepG2 has a different response to cadmium (Cd) exposure than glioma cells (C6) probably due to the higher activities of GPx, GR and other enzymes of the antioxidant defence system. Thus, it would not be prudent to generalize a conclusion concerning this topic since enzyme activity appear to depend on the type of metal to which they are exposed and also on the specific characteristics of the metabolism of the cell line assayed. 73,74 Moreover, Andela et al. 75 demonstrated a rise in CAT and SOD expression in type II alveolar cells (WT cell line) through the activation of the transcription factor-κB (nuclear factor-κB or NF-κB) in response to high ROS concentration. This mechanism appears to be independent of the source of ROS (or the type of ROS generator). Similarly, Tsan et al. 76 demonstrated that GPx activity under hyperoxia conditions is induced through the activation of NF-κB as one of the most powerful response to the pro-oxidative stimulus. Similarly, Shea et al. 77 observed an increase in NF-κB activation after hyperoxia treatment of lung lymphocytes. In spite of that, there is other possible explanation for this finding. Previous evidence reported that the oxidation of protein sulphydryl groups leads to the dissociation of the transcription factor nuclear factor erythroid 2-related factor 2 (Nrf2) from the protein Keap1 (Kelch-like ECH-associated protein1) in the cytoplasm. The protein then translocates to the nucleus and binds to antioxidant response elements (ARE) sequences, increasing the expression of genes involved in phase II detoxification. GT is one of the enzymes directly regulated by this mechanism. 78 Thus, the observed increase in GT under Cu overload could be produced through this regulatory pathway.
We observed that total glutathione diminished in A-549 but increased in HepG2 cells after Cu exposure at concentrations ≥100 µM. It is well known that cells exposed to agents that generate a high consumption of GSH (as Cu ions do) produce increased amounts of GSSG and that the rate of formation usually exceeds the capacity of the enzyme GR to reduce it back to GSH. It was demonstrated that GR was strongly depressed in both cell lines exposed to Cu overload. Thus, a proportion of GSSG could be reduced inside the cells and another part actively transported outside the cells by specific membrane systems. By analyzing the total glutathione concentration, one takes into account the activity of all enzymes involved in their metabolism such as GR, GPx and GT, plus the direct consumption of GSH during the generation of radical species. However, determination of the proportion of GSH/GSSG demonstrated the accumulation of the oxidized forms in the two cell lines although with different profiles of formation (more noticeable in A-549 cells than in HepG2). Thus, the decrease in glutathione in lung cells – although not quantitatively significant – could be of considerable importance from a physiological point of view. Although there are clear differences in glutathione metabolism and availability between the two cell lines, this does not necessarily mean that no consumption of GSH occurs in HepG2. It should be noted that liver HepG2 cells retain full capacity to synthesize this antioxidant, whereas in A-549 this capacity is restricted. Previous findings show that there is active consumption of GSH in liver cells under increased ROS formation from any source. 68 However, while all body cells can synthesize GSH to some extent (with the exception of the neurons that receive them from adjacent glia), only liver cells are able to biosynthesize larger amounts of the peptide since this tissue is the main detoxifying organ of the body and also the main exporter of GSH into the blood. 79 This, plus the reduced GR activity, make it likely that the high levels of total glutathione giving rise to HepG2 are the consequence of an increase in (or induction of) the biosynthesis of GSH owing to the higher expression of the key enzyme of the route, γ-glutamyl-cysteinyl synthetase. This response has been previously reported in other experimental systems under pro-oxidative stress. 80 Also, it was demonstrated that very low concentrations of Cu (0.1–10 µM) would not be able to produce significant changes in the levels of GSH in HepG2 cells 80, a finding that is consistent with our results. Previous experiments with nonhepatic cells exposed to high concentrations of Cu (100–500 µM) provide similar results to those reported here for A-549. 81 The decrease in total glutathione content could thus be a consequence of the higher GSH consumption with no real possibilities for resynthesis or, in the case of culture cells, uptake from the blood stream. 82,83
We also demonstrated that the vitamin E (α-tocopherol) levels were lower in both HepG2 and A-549 cell lines. Reductions in tocopherol content may also be considered an important factor in the conservation of the structure and physiology of biological membranes. Usually sandwiched between lipid bilayers of biomembranes, this vitamer protects membrane structures against attack by ROS/reactive nitrogenated species (RNS). The observed decrease in vitamin E is, therefore, consistent with the high TBARS values obtained in both cell lines after exposure to Cu and with the loss of PUFAs from the fatty acyl chains acylated to complex lipids. In agreement with this, a clear correlation between FRAP, PUFAs and the loss of α-tocopherol was demonstrated. Furthermore, the correlation between the UI and external or cellular (internal) Cu concentration demonstrates that metal overload is undoubtedly involved in the modifications to the PUFA profile. Our results suggest that there may be an initial phase of lesser damage associated with UI loss (probably due to the homeostatic effect of the Cu regulatory proteins and the response of the antioxidant defence system) followed by a phase of more rapidly occurring damage likely established after the capacity of the controlling cellular systems is surpassed. During the phase of higher damage it is possible that the response of CRP and MTs (as copper homeostatic systems) was less effective than that observed at the initial phase of damage. In addition, we observed a lower activation of the antioxidant enzymes together with an exhausted pool of antioxidants, particularly of α-tocopherol as lipid protector. Overall, the consumption of antioxidants was reflected in a significant decrease in the total FRAP. The reduction in FRAP is significant from two points of view (i) it is highly indicative of the loss of ability to protect themselves against pro-oxidative attacks by cells exposed to Cu overload, despite efforts to increase antioxidant enzyme activity, and (ii) it is also an indication (biomarker) of acylated fatty acid-associated damage, which in turn leads to the malfunctioning of cellular structures such as biomembranes, strongly dependent on this factor.
ROS overproduction and programmed cell death
In recent years, it is becoming increasingly clear that multiple mechanisms of cell death – as well as crosstalk between different pathways – contribute to determine cell survival or death by necrosis or apoptosis. ROS generation is strongly linked to cell survival mainly through redox-dependent activation of specific protease systems. The striking similarity between the substrates for caspases and calpains raises the possibility that both the protease families contribute to structural dysregulation and functional loss of cells under oxidative stress conditions. 84 Moreover, caspases have been reported to regulate calpain activities through modification of calpastatin (an endogenous calpain inhibitor) by proteolytic cleavage. 85 On the contrary, several studies suggested that calpains could cleave endogenous caspases as caspase-3, -7, -8 and -9. 86 Although numerous cross-talks exist between caspases and calpains, the exact signalling pathway linking both proteases families (that eventually leads cell to death) still need to be elucidated. 86 –90 In our experimental model, it could be possible that progressive activation of calpains finally avoid caspase activation by cleavage of initiator and/or effector members of this proteolytic family such as caspase-3. This predominant activation of calpain proteases instead of caspases at higher copper concentration agrees with other authors findings in different models of chronic injury. 85,86 Also, results demonstrated the direct dependence of both proteolytic systems on the degree of the metal overload. Oxidative stress-induced damage may contribute to apoptotic machinery in different ways. For example, adenosine triphosphate levels 91 and redox cellular status 92 appear to be factors determining the pathway through which the cells will die. In addition, it was observed that GSSG by itself is sufficient to inhibit pro-caspase-3 processing, suggesting that the formation of active caspase-3 is dependent on the maintenance of a thiol/redox status more reduced. 92 We observed that total glutathione levels are lower in the lung-derived cells treated with Cu than in the HepG2 cells. However, in both cells, the GSH/GSSG ratio decreases in a dose-dependent pattern with the increase in cellular Cu concentration. This fact, and the results of FRAP assay and tocopherol content, suggests that the redox status is strongly altered in both kinds of cells in a dose-dependent fashion. Thus, the present results contribute with additional evidence that both the types of calpains can be activated under oxidative stress condition induced by Cu overload and that they could play a functional role in the apoptotic death as suggested in other experimental systems. 88,93,94 Also, results indicate that the activities of calpain proteases became more important than caspase-3 pathway at higher Cu overloads for the activation of the programmed cell death in both human cell lines.
Conclusion
The present results corroborate previous findings on the Cu-induced damages associated with ROS overproduction. These damages were in vivo observed in pesticide sprayers and IUD users 16,17,34 and thus confirm the reliability of the experimental system as a tool for studying the mechanism/mechanisms by which metal overload exerts its deleterious effects on humans. We demonstrated the differential involvement of calpains and caspase systems that were activated in a dose-dependent manner under Cu-induced ROS production. In order to explore damages associated with genetically conditioned Cu overload in humans 39,40 or involuntary (professional) exposure to the metal, it is necessary to further investigate natural sources of Cu such as food and tap water and conditions of exposure through industrial or agricultural activities. 16,17,34,35,42 –45,95,96 .
Footnotes
Acknowledgements
The authors thank Miss Norma Cristalli, Cristina Pallanza de Stringa and Miss Eva Illara de Bozzolo for their excellent technical assistance.
Declaration of Conflicting Interests
The authors declared no conflict of interest
Funding
This work was supported by the UNLP and Consejo Nacional de Investigaciones Científicas y Técnicas de la Argentina (CONICET) (grant # PIP 0697).