
Abstract
Increased hepatic glucose output is one of the major causes of fasting hyperglycemia in diabetic patients. In this study, we investigated the mechanism of action of coagulanolide on hepatic glucose, regulating enzymes in type 2 diabetic C57BL/KsJ-db/db (db/db) mice. Coagulanolide is an active component of Withania coagulans fruit. Oral administration of coagulanolide for 3 weeks decreases fasting blood glucose and plasma insulin significantly, and it improves glucose tolerance in the db/db mice group. The enzyme activity and protein expression of glucokinase and pyruvate kinase was significantly enhanced in coagulanolide-treated db/db group when compared with untreated one. On the other hand, activities and protein expression of fructose-1,6-bisphosphatase, glucose 6-phosphatase, phosphoenolpyruvate carboxykinase, and glycogen phosphorylase enzymes were significantly lowered in treated group. The treatment with coagulanolide also normalizes the concentrations of plasma cholesterol, triglyceride, free fatty acid, low-density lipoprotein cholesterol, and high-density lipoprotein cholesterol in the db/db mice. These findings suggested that the coagulanolide is useful in the control of fasting hyperglycemia in type 2 diabetes by regulating the production of hepatic glucose.
Introduction
Type 2 diabetes is characterized by an increase in hepatic glucose production and peripheral insulin resistance. Increased gluconeogenesis is the main cause of the elevated hepatic glucose output in type-2 diabetes, contributing 50%–60% of the released glucose in hyperglycemia. 1 The rate of gluconeogenesis is regulated by the activity of the key gluconeogenic enzymes, namely, phosphoenolpyruvate carboxykinase (PEPCK), fructose-1,6-bisphosphatase (FBPase), and glucose-6-phosphatase (G6Pase). The elevated activity of these enzymes results in the synthesis of new glucose molecules from noncarbohydrate sources like lactate, amino acids, and glycerol. Alternatively, decrease in the activity of enzymes of the glycolysis pathway, namely, glucokinase (GK), pyruvate kinase (PK), and phosphofructokinase, leads to insufficient glucose uptake and utilization in the insulin-dependent tissue, thus contributing to hyperglycemia. In addition, increased activity of the key enzyme of glycogenolysis, namely, glycogen phosphorylase (GP), leads to break down of glycogen, thereby releasing more glucose in the circulation.
Withania coagulans Dunal (family: Solanaceae), commonly known as Indian cheese maker, is a rigid, gray, undershrub, commonly found in Northern India, Pakistan, Afghanistan, and Iran. Different parts of this plant have been reported to possess a variety of biological activities. 2 An aqueous extract of fruits of W. coagulans has been shown to exert hepatoprotective 3 and antidiabetic activity. 4 It also showed hypolipidemic activity in Triton-induced hypercholesterolemic rats, 5 and recently, wound healing activity of W. coagulans from its hydroalcoholic fraction was reported in Streptozotocin (STZ)-induced diabetic rats. 6 The natural active principles of W. coagulans contributing to antihyperglycemic and hypolipidemic activities were not determined. It was, therefore, necessary to determine the presence of active antihyperglycemic and antidyslipidemic agents, if any, in the fruits of W. coagulans, particularly in its aqueous decoction, which is commonly used in the traditional system of medicine. In our previous study, we examined the antihyperglycemic activity of five withanolides isolated from the fruits of W. coagulans in normoglycemic as well as in STZ-induced diabetic rats. 7
In the present study, we established the mechanism of action/actions of coagulanolide (Figure 1) isolated from the fruits of W. coagulans, in C57BL/KsJ-db/db (db/db) mice. The db/db mice are known to develop diabetes mellitus, characterized by obesity, sustained hyperglycemia, hyperlipidemia, and hyperinsulinemia, due to a failure to respond to leptin, resulting from a mutation in their receptor gene expressed in the hypothalamus. 8,9 In addition, the db/db mice were evaluated as a good model for diabetic dyslipidemia, because of the high plasma triglyceride (TG) and cholesterol (CHOL) levels. 10

Structure of coagulanolide from Withania coagulans fruits.
Materials and methods
Plant source, collection, and identification
The fruits of W. coagulans were collected locally during May 2008 and identified by MN Srivastava, Division of Botany Central Drug Research Institute. A voucher specimen (No. 7671) is preserved in the herbarium of the institute for future reference.
Extraction of the plant material
The dried fruits of W. coagulans (1 kg) were boiled with distilled water repeatedly (four times). The combined aqueous extract was filtered and concentrated under reduced pressure using rotavapor at 45°C to a brown gum (123.0 g). An aliquot of the extract (100.0 g) was dissolved in minimum water (500 ml) and extracted successively with hexane and ethyl acetate. The ethyl acetate soluble fraction (15.0 g) was subjected to repeated column chromatography over flash silica gel and coagulanolide was obtained from CHCl3:MeOH (19:1) eluate. The extraction and isolation procedures were repeated with the fruits of W. coagulans (5.0 kg) to get enough compounds for activity testing. 7
Animal (db/db mice)
Male db/db mice and db/+ mice were available in the animal facility of the institute. The work with these animals was cleared by institutional ethics committee for animal study and was conducted in accordance with the guidelines of the Committee for the Purpose of Control and Supervision of Experiments on Animals formed by the Government of India in 1964. The db/db mice of 12 weeks old, weighing around 40 ± 10 g with blood glucose level of 370–400 mg/dl were used in the present study. Five or six animals were housed in a polypropylene cage in the animal house with a temperature of 23 ± 2°C, humidity of 50%–60%, and light intensity of 300 Lx at floor level with regular 12-h light and dark cycle. Standard pellets were used as a basal diet during the experimental period and were provided with food and drinking water ad libitum.
Experimental design
Type 2 diabetic db/db mice were given vehicle (1.0% gum acacia) according to their body weight for the initial 8 days of the experiment. Their blood glucose levels and body weights were measured daily. On day 9, the animals were divided into different groups of five animals in each. Group 1 was regarded as the db/db control group and treated with vehicle, whereas the other group was treated with coagulanolide (at 25 and 50 mg/kg) and rosiglitazone (at 50 mg/kg) daily for 3 weeks. The age-matched db/+ mice were used as nondiabetic control, and the blood glucose level of each animal was measured weekly using a glucometer.
Oral glucose tolerance test
An oral glucose tolerance test (OGTT) was performed after 3 weeks following an overnight fasting (16 h). The level of baseline blood glucose was monitored at 0 min, followed by an oral glucose load of 3 g/kg body weight. The blood glucose levels were again checked at 30, 60, 90, and 120 min after the administration of glucose using a glucometer (Accu-Chek; Roche diagnostic, Germany). Food was withheld during the course of experiment, but water was provided in the cages. The area under the curve was calculated, and the percentage difference between the control group and the treated group was compared.
Estimation of plasma insulin and lipids
At the end of the experiment, blood samples of overnight fasted db/db mice of various groups were collected from retro-orbital venous plexus using 5 µl heparinized glass capillary. Plasma was separated from the collected blood and used for the estimation of plasma insulin, free fatty acid (FFA), TG, CHOL, low-density lipoprotein cholesterol (LDL-C), and high-density lipoprotein cholesterol (HDL-C) levels by respective assay kits (Roche, Germany).
Biochemical assays
After the completion of the treatment, animals were killed after an overnight starvation, and their liver were quickly excised for activity determination of key enzymes of carbohydrate metabolism. A 10% homogenate of each was prepared in 150 mM KCl (w/v) using Potter Elvejhem glass homogenizer fitted with Teflon pestle. The homogenates were centrifuged at 1000 r/min for 15 min at 4°C; the supernatant was stored and used as enzyme source. Protein content of the supernatant was determined by the method of Lowry et al. 11
Activity of GK
It was assayed according to the method of Porter and Chassy,
12
which was based on the formation of G6Pase. The 1.0-ml assay mixture contained 4-(2-hydroxyethyl)-1-piperazineethanesulfonic acid (HEPES) of 1 M (pH 7.5), Adenosine-5′-triphosphate (ATP) of 0.1 M (pH 7.0), MgCl2 of 0.1 M, Nicotinamide adenine dinucleotide phosphate (NADP) of 0.01 M (pH 7.0),
Activity of PK
PK was assayed according to the method of Buchner and Pfleiderer. 13 The reaction mixture contained 0.2 mM Tris-HCl (pH 7.4), 0.1 mM KCl, 10 mM MgCl2, 5 mM Adenosine diphosphate (ADP), 5 mM phosphoenolpyruvate (PEP), 4 units LDH, 0.24 Mm NADH2, and enzyme protein. Change in optical density was measured at 340 nm at 30 s intervals for 3 min.
Activity of GP
The activity of GP was measured according to the method of Berthet et al. 14 The 1.0-ml assay mixture contained 0.2 ml mixture A (57 mg of glycogen, 188 mg of glucose-1-phosphate, 42 mg of NaF, and 5′Adenosine monophosphate (AMP) (4 mM) in 10 ml distilled water) and 0.1 ml mixture B, enzyme protein. The tubes were incubated at 37°C for 30 min after which the reaction was terminated by the addition of 0.1 ml of 10% Trichloroacetic acid (TCA) and then 0.4 ml sodium acetate (100 mM) was added to prevent the spontaneous hydrolysis of glucose-1-phosphate present in the reaction mixture. The estimation of inorganic phosphate in the protein-free supernatant was done according to the method of Taussky and Shorr. 15
Activity of G6Pase
The enzyme activity of G6Pase was measured according to the method of Hubscher et al. 16 The 1.0-ml assay system contained 0.3 M of citrate buffer (pH 6.0), 28 mM of ethylenediaminetetraacetic acid (EDTA), 14 mM of NaF, 200 mM of glucose-6-phosphate, and appropriate amount of enzyme protein. The tubes were incubated at 37°C for 30 min after which the reaction was terminated by the addition of 1.0 ml of 10% TCA. Estimation of inorganic phosphate in the protein-free supernatant was done according to the method of Taussky and Shorr. 15
Activity of FBPase
The enzyme activity of FBPase was assayed according to the method of Ulm et al. 17 The 1.0-ml assay mixture contained 20 mM triethanolamine (pH 7.5), 2 mM MgCl2, 40 mM (NH4)2SO4, 0.15 mM fructose-1,6-bisphosphate, 0.5 mM NADP, 0.1 mM EDTA, 1 U/ml of glucose-6-phosphatase dehydrogenase, and 1 U/ml of glucose phosphate isomerase. Change in optical density was measured at 340 nm at 30 s interval for 3 min.
Activity of PEPCK
It was assayed according to the method of Ward et al. 18 The 1.0-ml assay mixture contained Tris-HCl buffer of 200 mM (pH 7.4), MnCl2 of 10 mM, NaHCO3 of 20 mM, Guanidine phosphate (GDP) of 1 mM, 9 units of mallet dehydrogenase, PEP of 5 mM, NADH2 of 0.24 mM, and enzyme protein. Optical density was measured at 340 nm at 30 s interval for 3 min.
Western blot analysis
Liver tissue homogenates in ice-cold mild lysis buffer were centrifuged at 14,000 r/min, 4°C, for 15 min and the supernatants were collected. Protein concentrations in the supernatants were measured using the DC Protein Assay kit (Bio-Rad, Hercules, CA, USA). Then, 50 μg protein samples were separated on 10% resolving Tris-HCl gels. Separated proteins were transferred to polyvinylidene difluoride membranes. The membranes were blocked in 5% Bovine serum albumin (BSA) in 1× Tris-buffered saline, 0.1% Tween-20 for 1 h at room temperature. Blocked membranes were incubated with a rabbit polyclonal anti-G6Pase, PEPCK, GK, PK, FBPase, GP antibody (Santa Cruz, Delaware, CA) overnight at 4°C. The membranes were then washed and probed with a horseradish peroxidase-conjugated secondary antibody for 1 h at room temperature. Proteins were visualized by enhanced chemiluminescence kit (Perkin Elmer Life Sciences, Boston, Massachusetts, USA), according to the manufacturer’s instructions.
Statistical analysis
All data were presented as mean ± SEM. Multiple comparisons among different treatment groups were evaluated by one-way analysis of variance followed by Turkey test as post hoc analysis. Value of p < 0.05 was considered statistically significant.
Results
Effect of coagulanolide on body weight and food intake
The body weights of the coagulanolide (at 50 mg/kg)-treated db/db mice were significantly lower than that of the db/db control group at weeks 2 and 3 of the experimental period (Figure 2). Food intakes did not differ among the groups (data not shown).

Effect of coagulanolide and rosiglitazone treatment (at 25 and 50 mg/kg) on the change in body weight and food intake in C57BL/KsJ-db/db mice. Values are mean ± SEM, n = 5. #p < 0.05 versus db/+ group; *p < 0.05 versus db/db group.
Effect of coagulanolide on blood glucose levels
All the db/db mice were diabetic when the experiment began, their blood glucose levels (>350 mg/dl) were higher than those of nondiabetic (db/+) mice. The blood glucose level of the coagulanolide-treated group was significantly lowered by 34.9% and 54.7% (at weeks 2) and by 43.7% and 60.3%, (at weeks 3) respectively, at 25 and 50 mg/kg dose, whereas the blood glucose level in rosiglitazone (at 50 mg/kg)-treated group was also significantly lowered by 31.3% and 47.2% than that of the control group after 2 and 3 weeks of treatment, respectively. The blood glucose levels of age-matched, nondiabetic (db/+) mice remained constant during the experimental period (Figure 3).

Effect of coagulanolide (at 25 and 50 mg/kg) and rosiglitazone (50 mg/kg) treatment on the change blood glucose level in C57BL/KsJ-db/db mice. Values are mean ± SEM, n = 5. #p < 0.5 versus db/+ group; *p < 0.5, **P<0.01 versus db/db group.
Effect of coagulanolide on OGTT
Results of the glucose tolerance test conducted on diabetic mice fed with coagulanolide (at 25 and 50 mg/kg) are shown in Figure 3. In diabetic control mice, blood glucose reached the highest level at 30 min after oral glucose ingestion, and this hyperglycemia was maintained until 60 min and then began to decrease. Coagulanolide significantly blocked the increase in blood glucose levels after the administration of glucose at 60, 90, and 120 min in comparison with the diabetic control group. However, rosiglitazone (at 50 mg/kg) treatment also significantly prevented the increase in blood glucose levels when compared with the db/db control group, while age-matched, nondiabetic (db/+) mice showed normal glucose tolerance test (Figure 4).

Effect of coagulanolide (at 25 and 50 mg/kg) and rosiglitazone (50 mg/kg) treatment on glucose tolerance test in C57BL/KsJ-db/db mice. Values are mean ± SEM, n = 5. #p < 0.05 versus db/+ group; **p < 0.01 versus db/db group.
Effect of coagulanolide on plasma insulin and lipids
The administration of coagulanolide at a dose of 50 mg/kg for 3 weeks significantly decreases the plasma insulin level by 24.4% compared with db/db control mice (Table 1). However, rosiglitazone at a dose of 50 mg/kg for 3 weeks also significantly reduces plasma insulin level by 21.3% compared with the control db/db mice (Table1).
Effect of coagulanolide and rosiglitazone treatment at a dose of 50 mg/kg for 3 weeks on plasma insulin and lipids in C57BL/KsJ-db/db mice
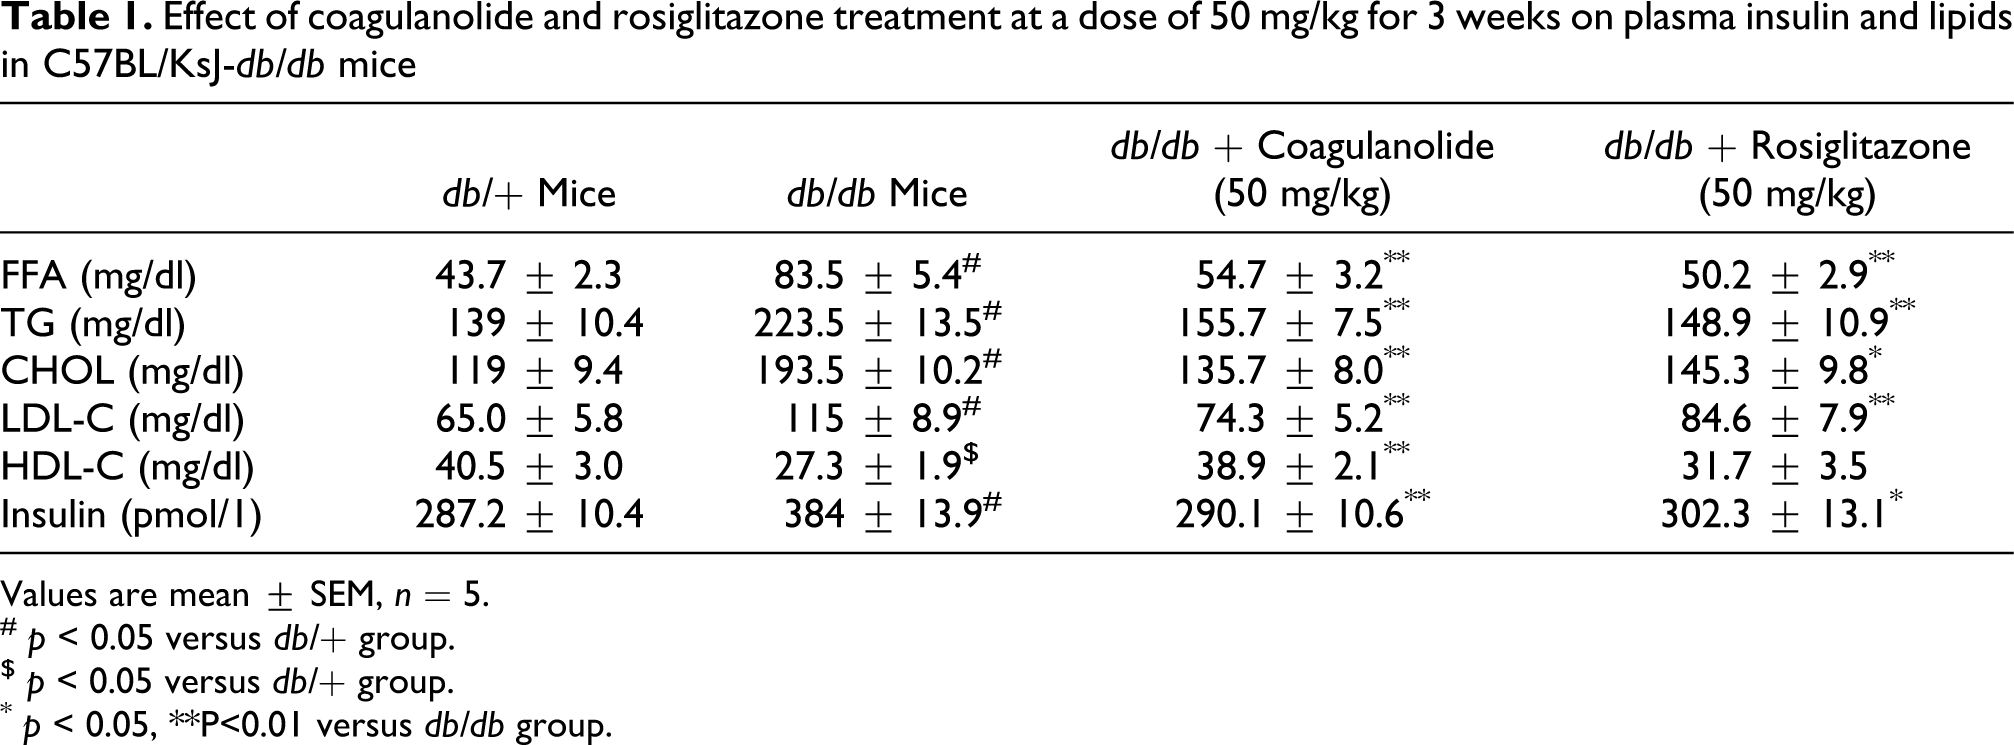
Values are mean ± SEM, n = 5.
# p < 0.05 versus db/+ group.
$ p < 0.05 versus db/+ group.
* p < 0.05, **P<0.01 versus db/db group.
The plasma FFA, TG, CHOL, and LDL-C concentrations were significantly higher by 91.3%, 37.8%, 38.5%, and 43.5%, respectively, in the control db/db mice when compared with nondiabetic db/+ group. The HDL-C was significantly lowered by 48.4% in the control db/db mice group when compared with nondiabetic db/+ mice group (Table1). Although the treatment with coagulanolide (at 50 mg/kg) significantly decreased the level of FFA, TG, CHOL, and LDL-C by 34.5%, 30.3%, 29.8%, and 35.4%, respectively, and significantly increased the level of HDL-C by 42.5% compared with diabetic (db/db) mice control group. In addition, rosiglitazone (at 50 mg/kg) also significantly decreased the level of FFA, TG, CHOL, and LDL-C by 39.8%, 33.3%, 23.1%, and 26.4%, respectively, as well as significantly increased the level of HDL-C by 16.1% when compared with diabetic control db/db mice group (Table 1).
Effect of coagulanolide on the activity of hepatic glucose regulating enzymes
The activity of hepatic GK and PK was significantly lowered by 28.8% and 25.7%, respectively, in the control db/db group, while the activity of FBPase, G6Pase, and PEPCK was significantly higher (249.6%, 160.5%, and 76.0%, respectively) when compared with the nondiabetic db/+ group (Figure 5(a) to (c)). On the other hand, treatment with coagulanolide (at 50 mg/kg) significantly elevated the activity of hepatic GK and PK by 37.7% and 38.5%, respectively, compared with the untreated db/db group, while inhibited the increased activity of hepatic gluconeogenic enzymes (FBPase, G6Pase, and PEPCK, respectively) by 49.6%, 76.9%, and 37.6%, respectively, in treated db/db group. In addition, the activity of hepatic GP was also significantly higher (67.9%) in control db/db mice when compared with the nondiabetic db/+ mice group and treatment with coagulanolide at a dose of 50 mg/kg for 3 weeks significantly reduces the activity of GP by 29.8% when compared with db/db control mice (Figure 5(c)). In addition, rosiglitazone (at 50 mg/kg) significantly increases the enzyme activity of GK and PK by 16.0% and 23.0%, respectively, and decreases the enzyme activity of FBPase, G6Pase, PEPCK, and GP by 37.1%, 27.0%, 24.2%, and 12.5%, respectively, in db/db mice in comparison with untreated db/db control mice (Figure 5(a) to (c)).

(a) Effect of coagulanolide and rosiglitazone treatment at a dose of 50 mg/kg for 3 weeks on the activity of hepatic GK and PK enzymes and the expression of protein in C57BL/KsJ-db/db (db/db) mice. Values are mean ± SEM, n = 5. $p < 0.05 versus db/+ group; *p < 0.05, **P<0.01 versus db/db group. (b) Effect of coagulanolide and rosiglitazone treatment at a dose of 50 mg/kg for 3 weeks on the activity of hepatic G6Pase and PEPCK enzymes and protein expression in db/db mice. Values are mean ± SEM, n = 5. #p < 0.05 versus db/+ group; *p < 0.05, **P<0.01 versus db/db group. (c) Effect of coagulanolide and rosiglitazone treatment at a dose of 50 mg/kg for 3 weeks on the activity of hepatic FBPase and GP enzymes and protein expression in db/db mice. Values are mean ± SEM, n = 5. $p < 0.05 versus db/+ group; *p < 0.05, **P<0.01 versus db/db group. GK: glucokinase; PK: pyruvate kinase; G6Pase: glucose-6-phosphatase; PEPCK: phosphoenolpyruvate carboxykinase; FBPase: fructose-1,6-bisphosphatase; GP: glycogen phosphorylase.
Effect of coagulanolide on protein expression of hepatic glucose regulating enzymes
We further investigated the effect of coagulanolide on the expression of GK and PK at protein levels. β-Actin was used as a loading control. The GK and PK protein levels were significantly decreased in diabetic db/db control mice when compared with the nondiabetic db/+ mice. Coagulanolide at a dose of 50 mg/kg for 3 weeks significantly increased the protein expression of both glycolytic enzymes compared with db/db mice control group (Figure 5(a)). In addition, treatment with rosiglitazone at a dose of 50 mg/kg for 3 weeks significantly increased the protein expression of both the enzymes compared with nontreated db/db mice.
Consequently, we also determined the protein expression of gluconeogenic (G6Pase, PEPCK, and FBPase) and glycogenolytic enzyme (Glycogen Phosphorylase). The G6Pase, PEPCK, FBPase, and GP protein levels were significantly increased in db/db diabetic control mice when compared with nondiabetic db/+ mice control. Coagulanolide at a dose of 50 mg/kg markedly reduced the elevated protein expression of G6Pase, PEPCK, FBPase, and GP when compared with db/db control mice (Figure 5(b) and (c)).
Discussion
Type 2 diabetes is associated with defective regulation of hepatic glucose metabolism, involving elevated glucose production in euglycemic conditions and subnormal clearance of glucose by the liver after a meal because of delayed suppression of hepatic glucose production and impaired conversion of glucose to glycogen. 19,20 The present study demonstrates that the treatment with coagulanolide improves blood glucose concentration by stimulating the activity of GK and PK and suppressing the activity of G6Pase, FBPase, PEPCK, and GP in the liver of diabetic (db/db) mice (Figure 5). Both hepatic GK and PK play a major role in controlling blood glucose homeostasis, which has made it a potential target for the pharmacological treatment of type 2 diabetes in recent years. 21 In addition, an abnormal increase in hepatic glucose production is a major symptom of diabetes, which contributes to fasting hyperglycemia. 22 This might be because of the increased activity of G6Pase, FBPase, PEPCK, and GP as well as decreased activity of GK and PK. Among glucose regulating genes, an enhanced expression of hepatic PEPCK gene has been identified in most forms of diabetes and contributes to an increased hepatic glucose output. 23 In the present study, the coagulanolide-treated db/db mice exhibited a normalized hepatic activity of PEPCK equivalent to the db/+ mice level. Thus, coagulanolide may have the ability to alter the hepatic gluconeogenesis that influences glucose homeostasis.
The db/db mice treated with coagulanolide for 3 weeks showed significant improvements in the symptoms of type 2 diabetes, including decreased body weight as well as lowered blood glucose and plasma insulin level (Table 1). These results further support coagulanolide as an effective hypoglycemic agent. It is important to note that the plasma insulin levels were reduced by treatment with coagulanolide. However, further studies are needed to confirm whether insulin sensitivity has been restored by coagulanolide. For example, the downstream molecules of insulin signaling, such as protein kinase B and insulin receptors, which are characteristic of insulin resistance of type 2 diabetes, should be investigated. 24 Coagulanolide administration significantly decreases plasma TG, CHOL, LDL-C, and FFA level in db/db mice (Table 1). There is growing evidences suggesting that hepatic insulin resistance is associated with an increased production of FFA and TGs. The circulating FFA and TGs that are commonly elevated in obese and diabetic subjects lower the ability of insulin to suppress hepatic glucose production by activating gluconeogenesis and inhibiting glycolysis. 25,26 Therefore, a reduction in the circulating FFA and TGs would be expected to improve hyperglycemia and strengthen insulin response by suppressing glucose production while increasing glucose utilization. 27 The reesterification of FFA in adipocytes is defective in obese and diabetic patients, leading to increased circulating FFA as well as increased supply of FFA to the liver. Thus, lowering the FFA in patients or interfering with the pathway through which FFA cause insulin resistance in these patients may be a new and promising approach for the treatment of type 2 diabetes. 28 Coagulanolide not only lowered the plasma levels of TG, CHOL, LDL-C, and FFA, but it also enhanced the level of cardioprotective HDL-C (Table 1). Several studies showed that an increase in HDL-C is associated with a decrease in coronary risk and most of the drugs that decrease CHOL also decrease HDL-C. It is important to note that in the present study, coagulanolide not only decreased the CHOL but also increased the HDL-C significantly after 3 weeks of treatment, as an additional advantage over the existing drugs. 29 Accordingly, treatment with coagulanolide in the type 2 diabetic mice improved the fatty acid metabolism. In conclusion, present studies showed that antidiabetic effect of coagulanolide is mediated, at least in part, by the activation of glycolytic enzymes (GK and PK) and inhibition of gluconeogenic (G6Pase, FBPase, and PEPCK) and glycogenolytic (GP) enzyme activities in the liver of db/db mice. The possible mechanisms of action for coagulanolide summarized as follows (Figure 6). Since rosiglitazone has adverse side effects, it is not ideal for the treatment of type 2 diabetic patients and better options must be considered. In comparison, coagulanolide might have a potential for future diabetes treatment.

Possible points of action for blood glucose lowering effect of coagulanolide in the metabolic pathways of hepatic glucose and lipid.
Footnotes
Funding
This research received no specific grant from any funding agency in the public, commercial, or not-for-profit sectors.
Acknowledgements
The authors thank Akanksha for chemical evaluation of Withania coagulans. This work was supported by a Grant-in-Aid project of Ministry of Health, Government of India; Council of Scientific and Industrial Research (CSIR) Network Projects NWP0032.
Declaration of Conflict of Interest
The authors declared no conflicts of interest