
Abstract
Benzene (BN) is a prototypical hematotoxicant, genotoxic carcinogen, and ubiquitous environmental pollutant. Although the molecular mechanisms of BN-induced cytotoxicity and genotoxic damage are poorly understood in humans, previous studies suggested that bioactivated BN metabolites are capable of oxidative stress, cell cycle arrest, apoptosis, and DNA damage. The objective of the current study was to investigate the BN-induced cytogenetic changes and underlying mechanisms based on these hypotheses. Peripheral blood lymphocytes (PBLs) might be the targets for BN-induced cytotoxicity and genotoxicity, and therefore DNA damage responses of PBLs after exposure to different concentrations of BN (0.25, 3.5, 50 μmol/L) or BN metabolite, hydroquinone (HQ; 50, 150, 450 μmol/L) were studied in vitro. Microculture tetrazolium assay, flow cytometry, 2′,7′-dichlorodihydrofluorescein-diacetate assay, comet assay, micronuclei assay, and attenuated total reflectance microspectroscope were chosen for this study. Based on the results, we reached the conclusion that different concentrations of BN or HQ significantly inhibited cell growth, induced the arrest of S phase and G2/M phase, and increased late apoptosis in a concentration-dependent manner. Furthermore, evidence was also provided to support the conclusion that BN and HQ induced DNA strand breaks and chromosomal mutations in PBL, which indicated the genotoxicity of BN and HQ. Current evidence has indicated that multiple mechanisms including dysfunction of cell cycle, programmed cell death, oxidative stress, and DNA lesions are likely to contribute to BN-induced cytogenetic changes.
Introduction
Benzene (BN) is an occupational and environmental toxicant used in the manufacture of various products including decoration materials, rubber, lubricants, detergents, and gasoline or exposed through auto exhaust, industrial emissions, and cigarette smoke. Epidemiological studies have shown that exposure to BN results in an increased risk of aplastic anemia, myelodysplastic syndromes, leukemia, and other blood disorders. 1,2 Due to the complexity of BN’s metabolic pathways and the large variety of induced alterations, 3,4 the specific cellular and genetic changes as well as the actual mechanisms involved in BN’s cytotoxicity and genotoxicity remain to be identified. Numerous in vitro and in vivo genotoxicity and mechanistic studies have shown that BN induces oxidative stress, cell cycle alterations, programmed cell death, DNA cleavage, and chromosomal breaks. 5 –7 It has been known that BN has to be metabolized in order to exert its toxicity, and the biotransformation of BN to toxic metabolites, including hydroquinone (HQ) brings about DNA damage which leads to chromosomal aberrations, single- and double-strand breaks (DSBs) and inhibits topoisomerase II. 8 –10 The requirement for metabolic activation and the complexity of BN’s metabolic pathways must be taken into account in in vitro experiments.
HQ was mainly focused on in this article because the formation of this stable BN metabolite was recognized to be an important agent in the mechanism of BN-induced cytotoxicity and genotoxicity. BN can be oxidized by microsomal epoxide hydrolase to form catechol; it can also undergo ring opening to produce trans, trans-muconaldehyde, or spontaneously rearrange to form phenol, which is then hydroxylated in the liver to form HQ. 11 In the recently published manuscripts, studies on formation of chromosomal effects by HQ in peripheral blood lymphocyte (PBL) in vitro showed positive cytogenetic effects including the induction of micronuclei (MNs), 12 sister chromatid exchanges and DNA strand breaks. 13,14 HQ can induce DNA DSBs and other forms of DNA damage which might be the cause for BN-induced hematotoxicity. Additionally, it has been reported that HQ can increase the level of aneusomy of chromosomes 7 and 8 in human CD34-positive blood progenitor cells. 15,16 HQ is a highly reactive metabolite of BN that can cause cellular damage by forming protein and DNA adducts and producing reactive oxygen species (ROS). HQ is known to be mutagenic as well, acting either through a redox cycling mechanism leading to the production of ROS or through direct alkylation of protein and DNA. 17 In light of all these, we examined the cytogenetic effect of HQ on PBL, a likely target cell population for BN-induced DNA lesions.
The widespread exposure to BN from a broad range of occupational and environmental sources and the possibility that low-concentration exposure to BN (≤1 ppm) can still induce hematological disorders, 18 such as acute myeloid leukemia, raise health concerns for workers with much more frequent exposure to BN as well as the general population. Despite intensive studies over the past several decades, the mechanisms of BN-induced cytotoxicity and genotoxicity are still not fully understood, and the mechanism-based measures for the prevention and treatment of BN hematotoxicity are lacking. Thus, the purposes of this study were to clarify bioactivation of BN with an attempt to identify underlying mechanisms of biotransformation leading to PBL cytotoxicity and genotoxicity. Survival rate was investigated using tetrazolium-based colorimetric assay (microculture tetrazolium (MTT) assay) to assess the cytotoxic effects after in vivo exposure to BN or in vitro exposure to HQ. ROS level, apoptosis and cell cycle was measured by flow cytometry, respectively. Infrared (IR) spectra of PBL were examined in spectral regions (900–1900 cm−1) corresponding to proteins, DNA, RNA by attenuated total reflectance (ATR) microspectroscope. Additionally, the DNA damage response was detected by comet assay and MN assay.
Materials and methods
Subjects and cell culture
Blood samples were collected from 10 anonymous healthy male volunteers aged between 20 and 35 years, from the south of PR China. The blood sampling was approved by the School of Public Health, Guangxi Medical University, and the donors had given their informed consent to participation in this study. Blood samples, 2–3 ml of heparinized whole blood diluted with phosphate-buffered saline (PBS) at 1:1, were collected by venipuncture from each subject and then delivered immediately to the laboratory. PBLs were isolated from the blood samples and cultured in RPMI1640 medium supplemented with 10% fetal bovine serum (FBS), 100 units of penicillin, and 100 µg/ml streptomycin. Cells were cultured in a humidified incubator with 5% CO2 for 24 h at 37°C.
Preparation of S-9 mix
S-9 is the supernatant of male Wistar rat liver homogenate, which was centrifuged at 9000xg. The homogenate was prepared from 10 g of liver and 30 ml of 0.15 M KCl. Rats were pretreated with phenobarbital (PB) and 5,6-benzoflavone (BF) following the established schedule and then the liver was removed on the 5th day. PB was intraperitoneally injected to the rats at 30 mg/kg body weight on the first day, 60 mg/kg body weight on the second, third and fourth days, and BF at 80 mg/kg body weight on the third day. The S-9 mix contained 200 μl of 20 mM 4-(2-hydroxyethyl)-1-piperazineethanesulfonic acid (HEPES) buffer solution (pH 7.2), 5 μmol of MgCl2, 33 μmol of KCl, 5 μmol of glucose-6-phosphate, 4 μmol of nicotinamide adenine dinucleotide phosphate (NADP), and 300 μl of the S-9 fraction in a total volume of 1 ml.
BN and HQ exposure
BN solutions were prepared by dissolving BN in ethanol at different concentrations of 0.25, 3.50 and 50 μmol/L, prior to use in complete medium. The reason for the selection of these exposure concentrations was that previous studies conducted in this and other laboratories revealed significant toxic outcomes in various cell types. The half confluent cultures of PBL were exposed to BN stock solutions of different concentrations with the addition of S-9 fraction for 24 h at 37°C in an atmosphere containing 5% CO2. HQ was dissolved into PBS (pH 7.4) immediately prior to treatment. PBLs were treated 2 h after culture initiation at final concentrations of 50, 150 and 450 μmol/L HQ in complete medium. One control group and one solvent control group were set. All treatments were performed in duplicate for each study sample and cultured in 5% CO2 in air at 37°C in a humidified atmosphere. BN and HQ treatments were terminated by rapid aspiration of the medium, followed by thorough washing with 5 ml of ice-cold PBS for 3 times. After incubation, the cell counts of living and dead cells were examined by trypan blue staining and cell viability was calculated.
Cytotoxicity assay
PBLs were seeded in 96-well plates at 1 × 10⁵ cells/well in 200 μl of RPMI1640 medium with 10% FBS. After 24 h of coincubation, different concentrations of BN (0.25, 3.5, and 50 μmol/L) and/or HQ exposed (50, 150, and 450 μmol/L) were added into the medium, respectively, for continuous culture for 24 h and/or 2 h. One control group and one solvent control group were set. MTT (Solarbio) solution was added to the culture medium (final concentration = 500 μg/ml) for 4 h until the end of treatment. The reaction was stopped by the addition of 100 μl of 10% acidified sodium dodecyl sulfate (SDS) to the cell culture. The absorbance value was measured at 570 nm (A 570) using a plate reader (Elx800, Epson LQ-150k, Japan). The percentage of cell viability was calculated according to the following formula: cell survival rate (%) = (A 570 of treated samples/A 570 of untreated samples) × 100%. For each group, six repeated wells were set and each experiment was performed three times.
Cell cycle analysis
PBLs were seeded in 96-well plates at 1 × 10⁶ cells/well in 200 μl of RPMI1640 medium with 10% FBS. After 24 h of coincubation, different concentrations of BN (0.25, 3.5, and 50 μmol/L) and/or HQ exposed (50, 150, and 450 μmol/L) were added into the medium, respectively, for continuous culturing for 24 h and/or 2 h. One control group and one solvent control group were set. After the treatment, cells were collected by centrifugation. The cells were fixed with 70% ethanol and stored at −20°C. On the day of analysis, the cells were washed with PBS and suspended in 250 μl of PBS. One milliliter of binding buffer was added to the cell suspension which was then incubated at room temperature for 5 min to facilitate the extraction of low-molecular-weight DNA. After centrifugation, the cells were resuspended in 500 μl of DNA staining solution (20 μg/ml propidium iodide, 200 μg/ml DNase free RNase, and 0.1% Triton X-100) and incubated in the dark at room temperature for 30 min. The complexes of propidium iodide (PI)–DNA were measured using a FACS Calibur (Becton Dickinson, Mountain View, New Jersey, USA). The rates of G0/G1, S and G2/M phases were analyzed. The above experiments were performed in triplicate. Results were presented as the percentage of cell in a particular phase.
Annexin-V and PI double-staining (apoptosis) assay
To quantify BN- and HQ-induced apoptosis, annexin V/PI staining was performed, and apoptosis was evaluated by flow cytometry. After treatment with BN or HQ, the cells were harvested and rinsed twice with cold PBS, then subjected to annexin V/PI staining using an annexin V-FITC Apoptosis Detection Kit (BioVision, Palo Alto, California), according to the manufacturer’s protocol. The resulting fluorescence was measured by flow cytometry using a FACS flow cytometer (Becton Dickinson). Cells that were annexin V (−) and PI (−) were considered viable cells. Cells that were annexin V (+) and PI (−) were considered early apoptotic cells. Cells that were annexin V (+) and PI (+) were considered late apoptotic cells.
Measurement of ROS
Intracellular oxidative stress was studied using 2′,7′-dichlorodihydrofluorescein-diacetate (DCFH-DA; Molecular Probes; Sigma, USA) and murine microglial cultures seeded (1 × 10⁵/well) in 96-well plates were exposed to BN or HQ. At designated time points, medium was removed and cells were washed with PBS, then suspended in PBS, and incubated with DCFH-DA at a final concentration of 10 μmol/L at 37°C in the dark for an additional 40 min. The ROS in the cells could easily oxidize DCFH, yielding the fluorescent product 2′,7′-dichlorofluorescein (DCF). ROS levels were determined at the excitation wavelength of 488 nm and emission wavelength of 525 nm by flow cytometry (Becton Dickinson) and evaluated as the fluorescence intensity. For each group of cells, the experiment was performed in triplicate.
Single-cell gel electrophoresis (comet assay)
Comet assay was performed under alkaline conditions using an adaptation of the method as described previously. 19 PBLs with or without BZ and HQ treatment were counted (1 × 10⁴ cells/well) and suspended in 0.7% low-melting point agarose (LMPA) in PBS (pH 7.4) at 37°C, and 80 μl of LMPA with 20 μl of cells were pipetted onto a microscope slide precoated with 100 μl of 1% normal melting point agarose. After solidification, the gel was allowed to set on ice for 5 min, and the slide was immersed in lysis solution (2.5 M NaCl, 100 mM disodium salt of ethylenediaminetetraacetic acid (Na2EDTA), 10 mM Tris, NaOH to pH 10.0 ± 0.5, and 1% Triton-X-100) for 1 h at 4°C to remove cellular proteins. Microscopic slides were then randomly placed side by side in the horizontal gel electrophoresis tank, facing the anode. The unit was filled with freshly prepared electrophoretic buffer (300 mM NaOH, 1 mM Na2EDTA, and pH 13.0) and the slides were set in this alkaline buffer for 20 min to allow DNA unwinding and expression of alkali-labile sites. Denaturation and electrophoresis were performed at 4°C under dim light. Electrophoresis was carried out for the next 20 min at 25 V (300 mA). After electrophoresis, the slides were washed gently for 3 times at 5-min intervals with a neutralization buffer (0.4 M Tris-HCl, pH 7.5) to remove excess alkali and detergents. Each slide was stained with 5 μg/ml DAPI and covered with a coverslip. Slides were stored at 4°C in humidified sealed containers until analysis. To prevent additional DNA damage, handling blood samples and all steps included in the preparation of slides for the comet analysis were conducted in yellow light or in the dark. Furthermore, to avoid possible position effects during electrophoresis, six parallel replicate slides per sample were prepared.
A Nikon epifluorescence microscope connected to an image analysis system was used to measure the percentage of DNA in the tail. All slides after being coded were processed and evaluated concurrently. Apoptosis-necrosis PBLs were stained with acridine orange in combination with ethidium bromide. One microliter of the mixture (100 μg/ml of each) was added to 20 μl of suspension cells (1 × 10⁶ cells/ml). Acridine orange is a cell-permeable dye that goes into all cells and intercalates DNAs to appear green. Ethidium bromide enters only nonviable cells that exhibit disrupted membrane integrity, overriding the acridine orange to fluoresce orange. The aim was to make a distinction between morphological features in apoptosis with cell shrinkage, nuclear condensation, and extensive formation of membrane blebs and apoptotic bodies, and in necrosis with cell swelling, nuclear expansion and gross cytolysis. Using these stains, PBLs were seen on bivariate analysis of green versus red fluorescence in the mixture of dyes: normal cells were green, as they have chromatin with an organized structure; apoptotic cells had green/red chromatin that is highly fragmented, and necrotic cells had red/orange chromatin and an intact structure. The number of apoptotic cells and the number of normal and necrotic cells were expressed as a percentage of total cells counted.
Image analysis estimates for each donor (100 cells from each of 10 slides/treatments) were used separately to evaluate DNA damage and repair. The percentage of apoptotic and necrotic cells was calculated from the respective values derived from visual inspection of the three slides. Because departures from normality were observed, one-way analysis of variance (ANOVA) and Q test of multiple comparison were used to evaluate the differences in DNA damage and repair. For all statistical analyses, a level of at least 0.05 was used to determine significance.
MN assay protocols
After the exposure, PBLs were smeared on clean microscope slides and then air-dried and fixed with methanol/acetic acid (3:1 v/v) for 15 min. Next it was stained with Giemsa 10% for 30 min, at 1 × 10³ cells/slide that retained their oblong shape; the nucleus which could be well identified but not fragmented, and surrounded by cytoplasm with a clear boundary, were analyzed under oil immersion at ×1000 magnification. Six slides were examined for each concentration and frequency (permillage) of MNs. Twenty MNs were identified according to the criteria compiled by Mersch et al., and they are spherical cytoplasmic inclusions with a sharp contour; their diameter ranges from one-tenth to one-third of that of the nucleus; they resemble the nucleus in both texture and color; and they have no contact with the nucleus. Any ambiguous MN-like inclusions were not scored as MN. The number of MN per lymphocyte was recorded and the MN frequencies per 1000 binucleated PBL in the test and control groups were compared using the χ 2 test. The statistical significance was considered when p value was less than 0.05.
ATR microspectroscopy
After removal of medium, cell suspensions were immediately fixed with 70% ethanol and stored at 4°C prior to use. Fixed cells were applied to 1 cm × 1 cm low-E reflective glass slides, air-dried, and then placed in a desiccator. For each sample, six parallel replicate reflective glass slides were prepared. Spectra were acquired using a Perkin Elmer Spectrum 100/ FTIR spectrometer with ATR attachment containing a diamond crystal. From each experimental treatment, 10 spectra were acquired. SDS was used to clean the ATR crystal prior to the analysis of the new sample. Each time the crystal was cleaned, new background reading was also taken before recommencing spectral analysis. The baseline correction of spectra was conducted using OPUS software and normalized to the amide I (∼1650 cm−1) absorbance band. A software of spectral manager for window was used for data acquisition and processing. Statistical analysis was conducted according to the mean score of each concentration with SPSS software. Principal component analysis (PCA) was performed on the averaged spectra using the Pirouette software package. The spectrum of each concentration was converted into a single point which was then viewed in 3D plots of the scores of principal components.
Results
Cytotoxicity effects of BN and HQ on PBL
In order to further investigate the growth inhibition of BN and HQ on PBL, cell growth was determined by MTT assay. The rate of cell growth inhibition is shown in Figure 1. The number of viable PBL significantly decreased with the addition of increasing amounts of BN (61.2% decreased at a concentration of 50 μmol/L). Significant reduction in cell viability was also observed during exposure to HQ compared to the blank control group. The cell viability rate decreased from 65% to 30% 2 h after HQ exposure (p < 0.01). Similar results were obtained in all the repeated experiments. The data revealed that both BN and HQ could inhibit the growth and proliferation of PBL within certain range of concentrations.

Cell viability in peripheral blood lymphocyte (PBL) after the incubation with different concentrations of benzene (BN) or hydroquinone (HQ) as assessed by microculture tetrazolium (MTT) assay. Results presented are representative of three independent experiments. Each value represents the mean ± SD. Compared with the solvent or blank control group, indicates significantly reduced as determined by Dunnett's test (▾p < 0.05 and *p < 0.01).
Effect of BN and HQ on the cell cycle of the lymphocytes
To determine whether the decrease in cell viability was associated with cell cycle arrest, cells were fixed and stained with PI, and cell cycle distribution was measured using flow cytometry. The results indicated that both BN and HQ resulted in a significant increase in cells in the S and G2/M phase and induced S phase accumulation (Figure 2; p < 0.05). PBL of the solvent or blank control group indicated that 90% of cells were in G0/G1 stage; approximately 8% of cells were in S phase; and more than 2% of cells were in G2/M phase. The percentage of cells in G0/G1 stage significantly decreased compared with the solvent or blank control group. Cell-cycle phase distribution was especially sensitive to BN, since BN induced the highest ratio of S phase arrest, in a concentration-dependent manner (22.61 ± 3.72%, 39.75 ± 6.73%, and 51.24 ± 10.18% vs. solvent control cells). More importantly, when the cells were treated with metabolite HQ, the percentage of cells in S phase significantly increased compared with the control group, but the difference was not significant among HQ groups. Cells in G2/M phase markedly increased, especially the HQ treatment at 450 μmol/L. These findings indicated that, at least in vitro, BN and HQ blocked the cell cycle, especially the transition from S to G2 phase.
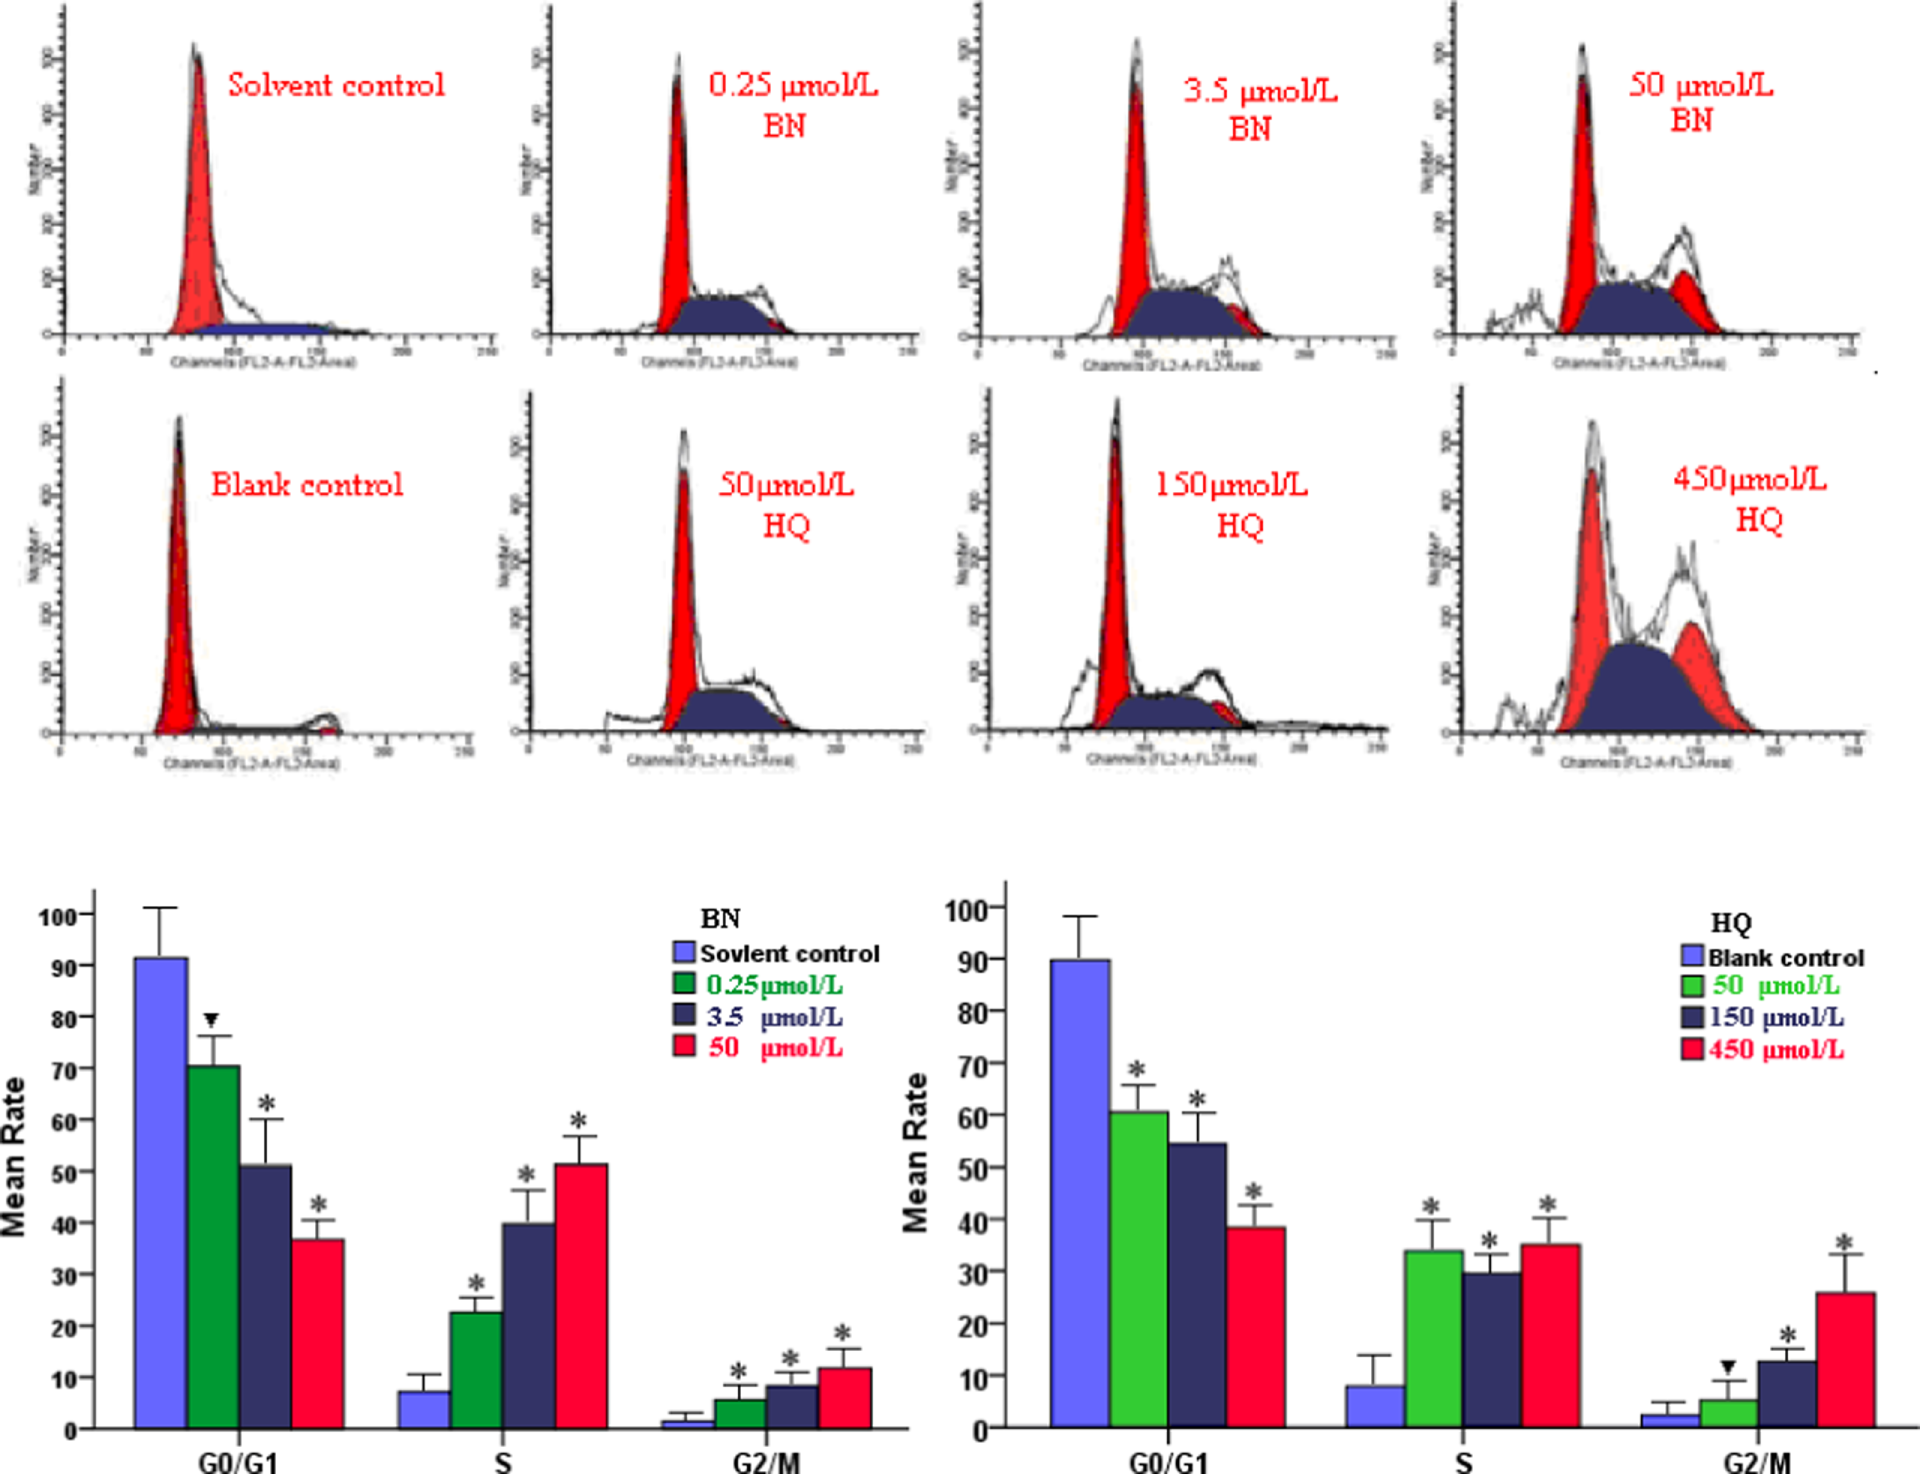
The treatment of peripheral blood lymphocyte (PBL) with different concentrations of benzene (BN) or hydroquinone (HQ) induces S and G2/M cell cycle arrest, the cells were collected sequentially and stained with propidium iodide (PI) and analyzed by flow cytometry (FCM). Data are represented as mean ± SD (n = 3, ▾p < 0.05 and *p < 0.01 versus solvent or blank control group; one-way analysis of variance (ANOVA), Bonferronic multiple comparison test).
Effect of BN and HQ on the apoptosis rate of PBL
Treatment with increasing concentrations of BN and HQ resulted in significant concentration-dependent increases in the levels of late apoptosis in both cell lines and a significantly higher percentage of late apoptosis in all treated PBL cultures compared with the control cells (p < 0.05). A number of apoptotic cells were detected to be concentration dependent and the total apoptosis rate of BN exposure groups was higher at each concentration compared with the solvent control (Figure 3; p < 0.05). Compared with blank control groups (Figure 4), the maximum levels of total apoptotic cells were detected at 450 μmol/L of HQ, which represented a 7.5-fold increase. The number of the late apoptotic cells significantly increased, with significant differences among different groups (p < 0.05), which indicated apoptotic cell death. These results demonstrated that BN and HQ could produce high levels of apoptosis in PBL.
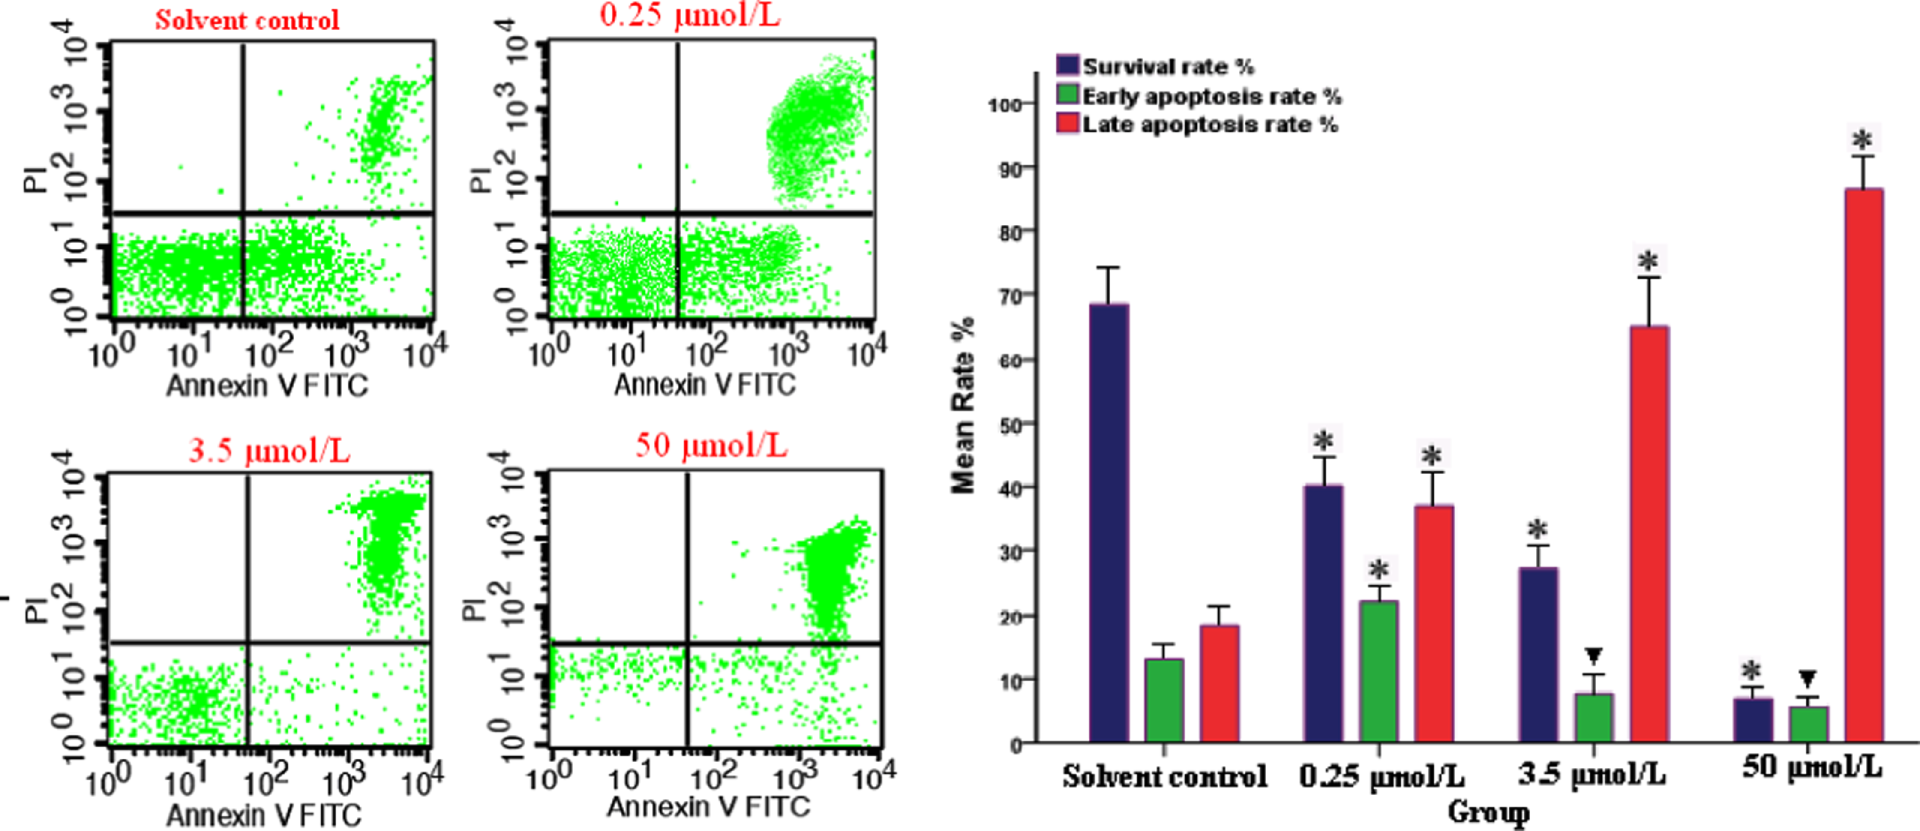
Flow cytometric analysis of peripheral blood lymphocyte (PBL) treated with different concentrations of benzene (BN; 0.25, 3.5, 50 μmol/L) for 24 h. Apoptotic cells were detected by staining cells with propidium iodide and anti-annexin V antibody conjugated with fluorescein isothiocyanate (FITC) followed by flow cytometry. The percentage of the number of cells for each quadrant is presented as mean ± SD (n = 3). ▾p < 0.05 and *p < 0.01 versus solvent control group.
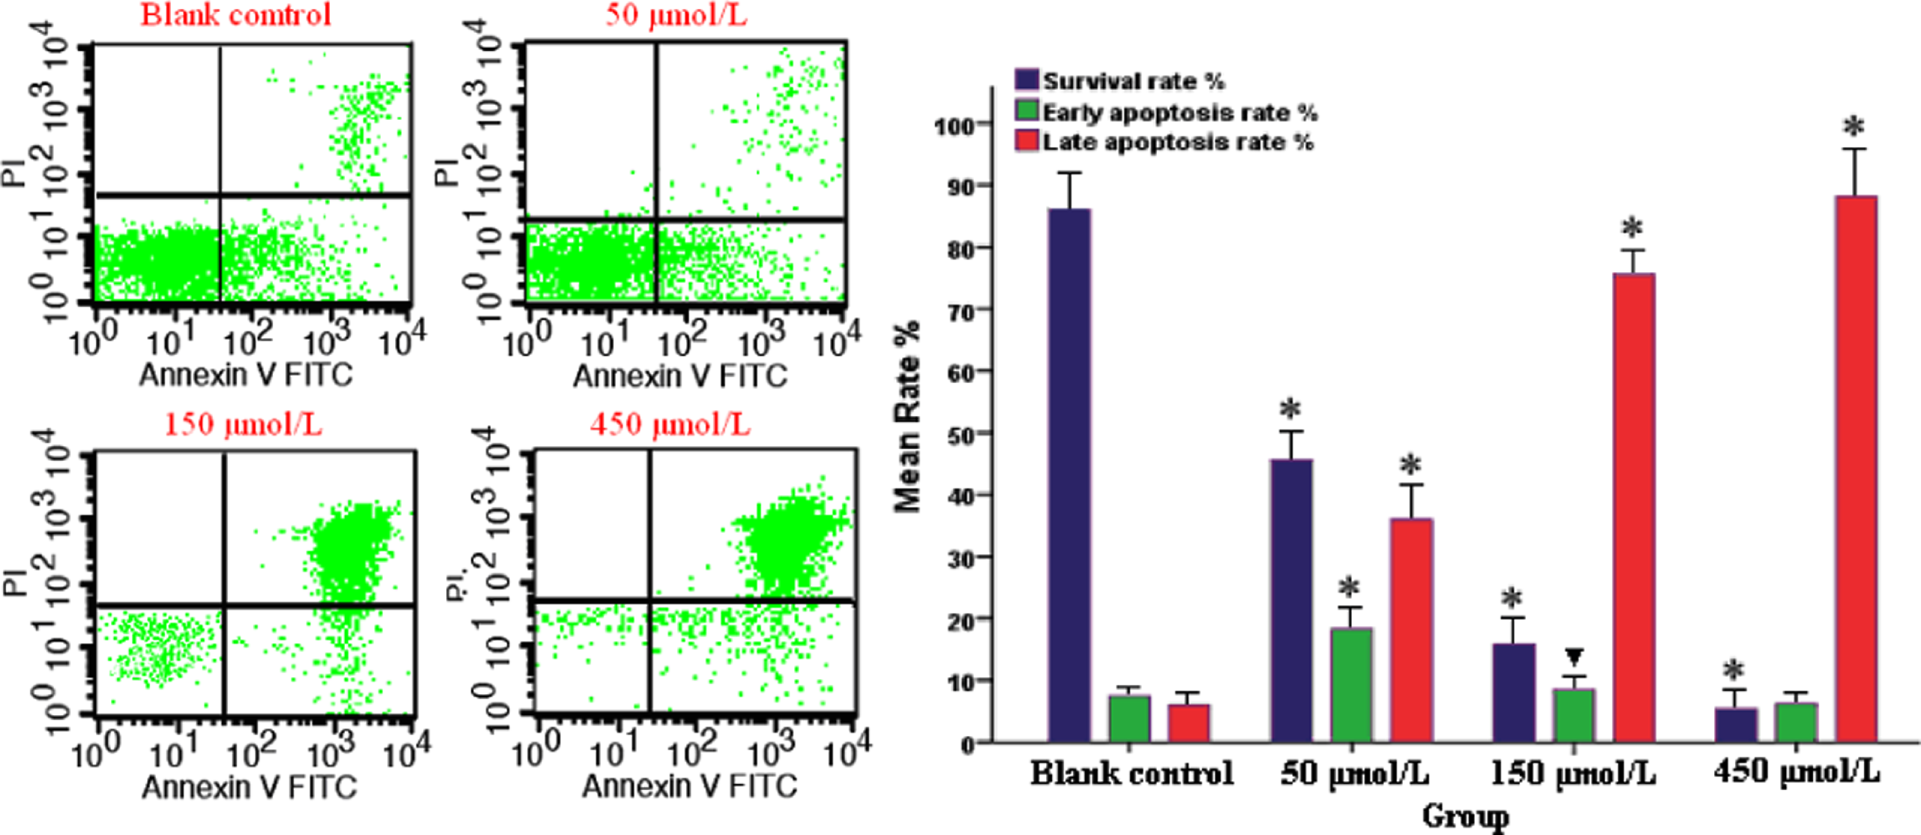
Effect of hydroquinone (HQ) on the induction of peripheral blood lymphocyte (PBL) apoptosis. The apoptosis of PBL induced by HQ were determined by flow cytometry at 2 h. Results presented are representative of three independent experiments (mean ± SD). ▾p < 0.05 and *p < 0.01 versus blank control group.
BN and HQ induced ROS accumulation
To determine whether BN and HQ treatments were associated with intracellular ROS production in PBL, the intracellular ROS level was evaluated by the conversion of DCFH-DA into DCF, which occurred during the incubation with BN and HQ exposure. As illustrated in Figure 5, the amount of ROS production showed a significant increase which varied with different concentrations of BN and HQ (p < 0.01). BN (50 μmol/L)-induced fluorescence intensity was potentiated up to 18-fold compared with solvent control group. These results suggested that both BN and HQ induced accumulation of intracellular ROS within a certain range of concentrations and ROS production might have significant effect on the process of cell cycle arrest and programmed cell death.
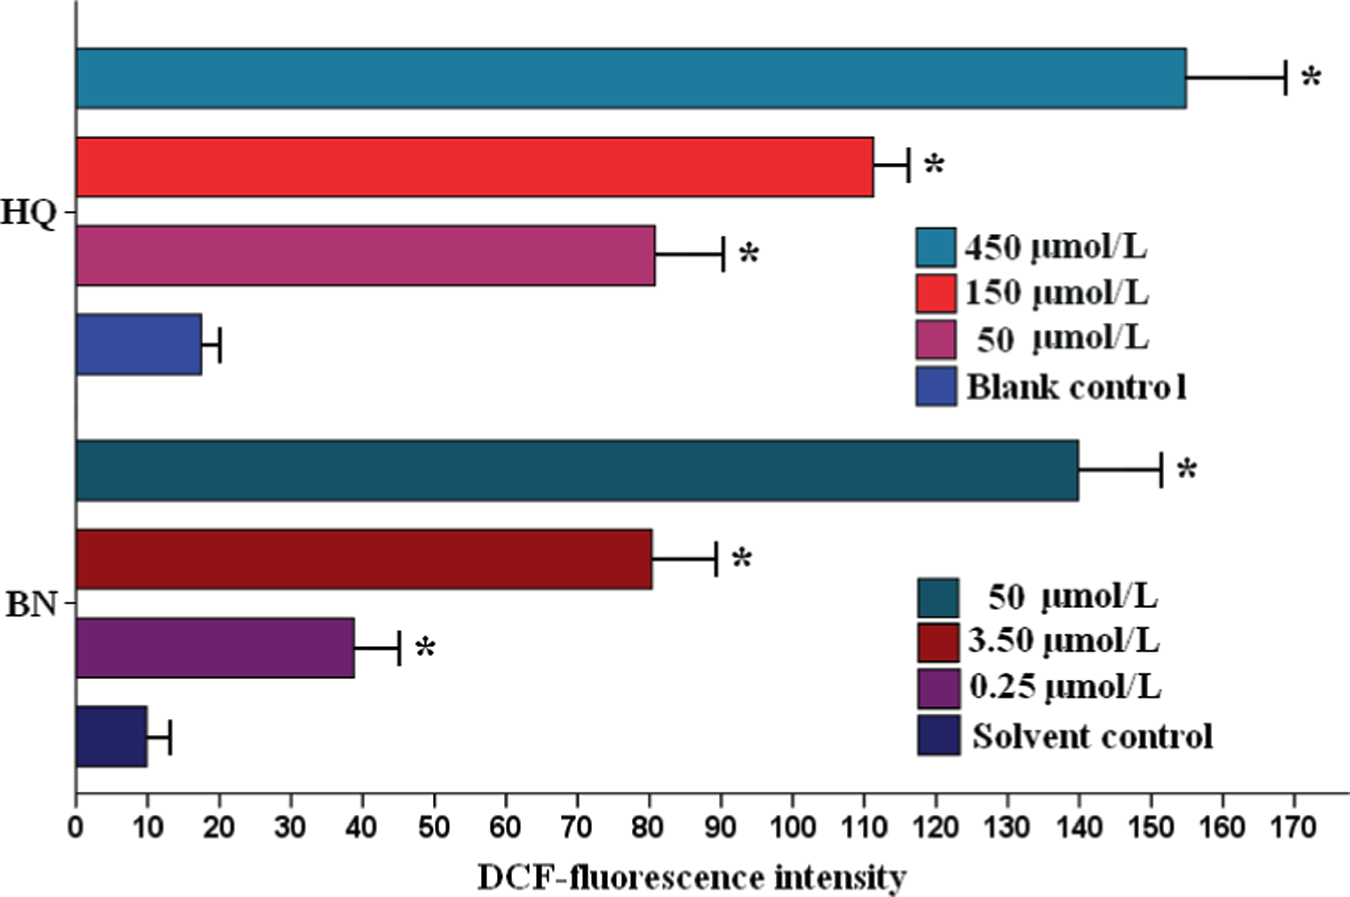
The formation of reactive oxygen species (ROS) was assayed by measuring the fluorescence of dichlorofluorescein. Each value represents the mean ± SD (n = 3). *p < 0.01 versus solvent or blank control group.
Genotoxic effects of BN and HQ
MN test and comet assay were applied to PBL in order to evaluate the genotoxic risk associated with BN and HQ exposure. Immediately after treatment, DNA damage (mainly DNA breaks) was detected by comet assay. DNA fragments and relaxed loops resulting from strand breaks migrated toward the anode during the electrophoresis, providing comet-like images (Figure 6). As shown in Table 1, the mean values of tail lengths were computed to be 12.12 ± 7.7, 21.61 ± 10.5, 22.87 ± 8.96, and 26.45 ± 7.9 μm in 0, 0.25, 3.5, and 50 μmol/L, respectively, indicating that BN was a potent inducer of DNA damage. Compared with the solvent control group, the comet tail length in the groups exposed to 0.25, 3.5, and 50 μmol/L of BN increased by 78.3%, 88.7%, and 118.2% and comet rate by 11.7%, 14.2%, and 31.5%, respectively. Besides, MN increased by 1.9-, 6.6-, and 26.3-fold. These results showed that a significantly higher level of DNA damage occurred at all concentrations of BN compared to solvent control (p < 0.05 or p < 0.01) with a concentration–effect relationship.
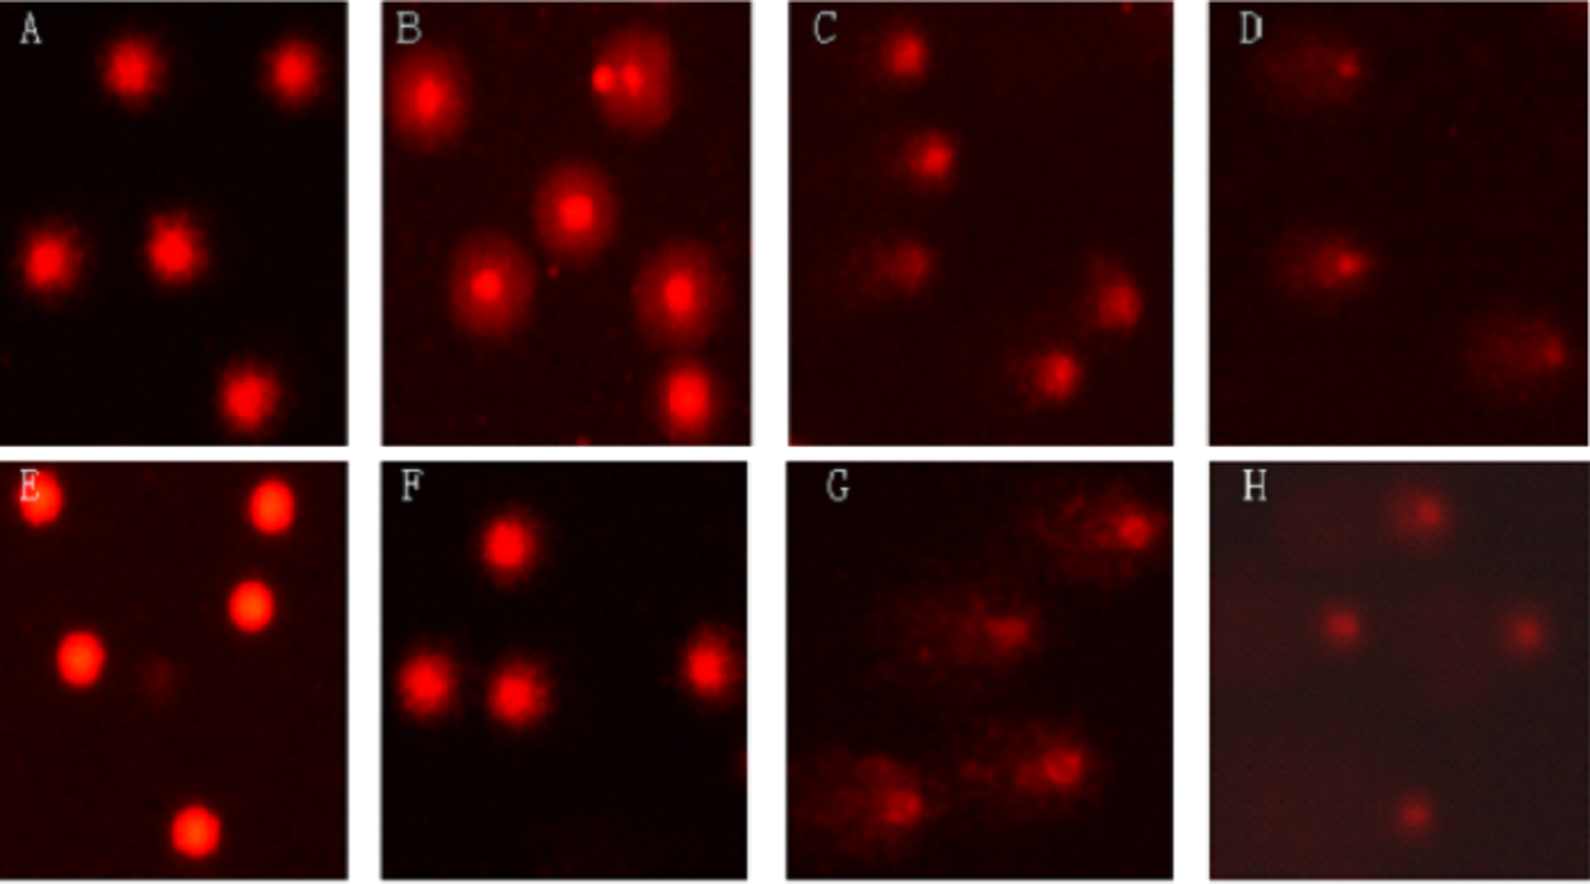
Effect of benzene and hydroquinone on DNA damage in peripheral blood lymphocyte (PBL) which was analyzed by comet assay. (a) Solvent control group—comet cell with short tail (tail length less than the head diameter); (b) benzene (BN) exposure at 0.25 μmol/L induced comet cell with tail length longer than the head diameter and with low DNA damage; (c) BN exposure at 3.5 μmol/L induced comet cell with tail length longer than the head diameter and with high DNA damage; (d) BN exposure at 50 μmol/L induced comet cell with tail length longer than the head diameter and with high DNA damage and insignificant head; (e) blank control group—comet cell with no DNA damage and no tail (intact nuclei); (f) hydroquinone (HQ) exposure at 50 μmol/L induced comet cell with tail length longer and with higher DNA damage than the group exposed to 0.25 μmol/L of BN; (g) HQ exposure at 150 μmol/L induced comet cell with tail length longer and with much higher DNA damage than BN-exposed group with 3.5 μmol/L; (h) HQ exposure at 450 μmol/L induced comet cell with tail length longer than the head diameter and with high DNA damage and insignificant head.
Effect of benzene on DNA damage in PBL in vitro experiment a

MN: micronucleus; PBL: peripheral blood lymphocyte.
a All data are shown as average median values (n = 10) ±SD.
b Significantly increased (p < 0.05; χ2 test) compared to the control.
c Significantly increased (p < 0.01; χ2 test) compared to the control.
The results indicating the genotoxicity of HQ to PBL are presented in Table 2. Data obtained from this assay indicated a strong concentration–response relationship with respect to the genotoxic property of HQ. As shown in this table, the comet rate of HQ treatment at 150 and 450 μmol/L increased by 13.0% and 58.95%, respectively; comet tail length increased by 213.5% and 215.1%, respectively, compared with the HQ-exposed groups with 50 μmol/L. Compared with blank control group, MN increased by 5-, 11- and 31.8-fold, respectively. PBL exposed to HQ showed significant mortalities (p < 0.01) compared to blank control cells. Studies on DNA strand breaks and MN induction in PBL indicated the genotoxicity of both BN and HQ.
Effect of hydroquinone on DNA damage in PBL in vitro experiment a
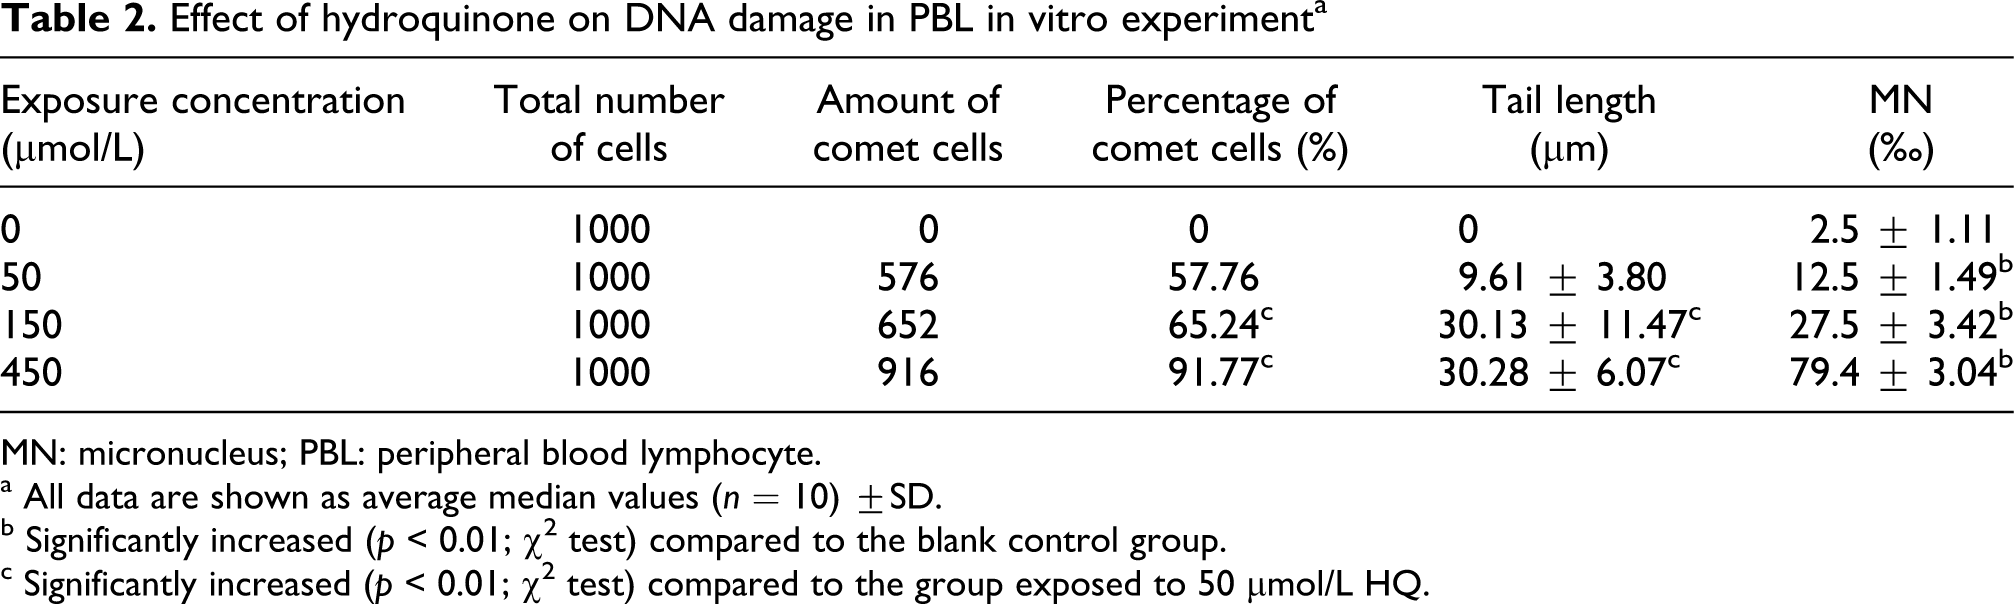
MN: micronucleus; PBL: peripheral blood lymphocyte.
a All data are shown as average median values (n = 10) ±SD.
b Significantly increased (p < 0.01; χ2 test) compared to the blank control group.
c Significantly increased (p < 0.01; χ2 test) compared to the group exposed to 50 μmol/L HQ.
Effect of BN and HQ on DNA damage in lymphatic cells evaluated by ATR microspectroscope
Upon graphical examination of all the IR spectral data, discernible spectral characteristics associated with 1900–900 cm−1 mid-IR absorbance bands were noted. Vibrational bands, associated with spectral regions, where significant differences in interests occurred, included glycoproteins and acyl chain of lipids (δs CH3, ≈1380 cm−1), amide III (≈1260 cm−1), glycogen (νs C–O, ≈1030 cm−1), and the peak at 970 cm−1 which might be indicative of the level of intracellular protein phosphorylation. 20,21 As illustrated in Figure 7, marked variations in the DNA/RNA spectral region (≈1490–1000 cm−1) were apparent, the spectral difference revealed that these spectra mainly differed in the intensity of the asymmetrical and symmetrical stretching bands, which might be the result of longer-term BN- or HQ-induced cytotoxic effects. 20 In particular, we found that 450 μmol/L HQ generated the most significant differences in different spectral regions observed. After cluster analysis, the average spectrum was derived for each group. The score plots of BN and HQ lines were derived from PCA on 3D rotation figure (Figure 8). The results of the PCA indicated that BN was the first principal component and HQ was the second.

Average infrared (IR) spectra (n = 6 from each individual donor) of peripheral blood lymphocytes (PBLs) which have been exposed to benzene (BN) and hydroquinone (HQ) at different concentrations. Blank control group—control, solvent control group—ethanol, BN-exposed group with 0.25 μmol/L—BL, BN-exposed group with 3.5 μmol/L—benzen high concentration (BH), HQ-exposed group with 50 μmol/L—hydroquinone low concentration (HL), HQ-exposed group with 450 μmol/L—hydroquinone high concentration (HH). Note: BH,HL and HH denote benzen high concentration, hydroquinone low concentration, and hydroquinone high concentration respectively.

Each spectrum became a single point in three-dimensional space and the data were analyzed for clustering. Blank control group—control, solvent control group—ethanol, benzene (BN)-exposed group with 0.25 μmol/L—BL, BN-exposed group with 3.5 μmol/L—benzen high concentration (BH), hydroquinone (HQ)-exposed group with 50 μmol/L—hydroquinone low concentration (HL), HQ-exposed group with 450 μmol/L—hydroquinone high concentration (HH).
Discussion
Since BN is a relatively common environmental and occupational contaminant, its cytotoxic and genotoxic effect on human health is still a matter of interest. S-9 mix, which contained cytochrome P450 2E1 enzyme (CYP 2E1), a key enzyme involved in the initial steps of bioactivation of cytotoxic and genotoxic metabolites, was added during the short-term treatment to investigate the effects of metabolites. In this research, we developed and characterized an in vitro model system in which PBL’s exposure to BN and HQ metabolites induced cytotoxicity and genotoxicity. Growth inhibitory activities of BN have been demonstrated by Snyder and also confirmed in this study. 22 BN and HQ inhibited the cell proliferation of PBL and were highly cytotoxic to PBL. Such growth inhibition of cells could induce cell death via reproductive necrosis or programmed apoptosis. Possible explanations for cell viability reduction might be associated with a multitude of molecular and biological effects, ranging from chromatin plasticity, protein–DNA interaction to cellular differentiation, cell cycle arrest and apoptosis.
To explore the possible mechanism for the cytogenetic effects of BN on PBL, the cell cycle analysis of PBL under exposure to BN and HQ was conducted in this article. DNA cycle analysis revealed that inhibition of cell viability was caused by significant cell cycle arrest at the G2/M phase, accompanied by an increase in sub-G1 fraction, which indicated apoptotic cell death. Meanwhile, accumulation of cells in S phase was activated by BN and HQ and therefore there was a significant decrease in G0/G1 phase. However, the percentage of cells in S phase has no significant difference among HQ groups. One possible explanation for this phenomenon might be that the low concentration of HQ had greater toxicity than BN. S phase is the period for DNA synthesis in the process of cell division and the content of DNA doubles in this period. Hence the S-phase cell rate indicates the activity of proliferating cells. It could be possible that the accumulation in S-phase cells and the attempt to repair the DNA damage caused by BN and HQ might be detrimental to cell survival.
As a mechanism of cell death, apoptosis plays a crucial role in maintaining genomic integrity by selectively removing the most heavily damaged cells from the population. 23 To test whether the decrease in cell viability observed after treatment with BN and HQ was due to apoptosis induction, apoptosis cell number at the early and late phase was estimated. The results indicated that the treatment with BN and HQ of increasing concentrations resulted in significant concentration-dependent increases in the levels of late apoptosis in PBL. If the amount of cell damage was severe, apoptotic pathways were then activated, resulting in the promotion of apoptotic cell death. The data supported our hypothesis that decrease in cell proliferation was due to BN-induced apoptosis. Metabolic susceptibility factors associated with cytokines, adhesion molecules, and multiple gene pathways associated with cell cycle and apoptosis have been characterized. In particular, oxidative stress and the intensity of protein and DNA damage is responsible for cell cycle arrest and apoptosis induced by BN metabolites. 24,25
Given that oxidative stress can alter the activity and fate of cell-signaling pathways, we hypothesized that bioactivation of BN can lead to increased formation of ROS. Previous in vitro studies demonstrated that peroxidatic metabolism of HQ to its semiquinone radicals could reduce dioxygen to superoxide anion radicals and therefore subsequent redox reactions had the potential to produce large amounts of ROS. 26 The data presented here indicated that BN significantly enhanced the production of ROS in a concentration-dependent manner compared to solvent control groups, and HQ groups were of similar effects. In biological systems, BN is converted into BN oxide, which is ultimately metabolized to phenol, catechol, HQ, and semiquinone, 27,28 and it is in this bioactivation process that substantive ROS, such as superoxide radical anion, hydroperoxyl radical, and H2O2, are formed. 29,30 ROS can irreversibly damage essential macromolecular targets such as DNA, protein, and lipids, moreover, the resulting semiquinones can bind to DNA and protein producing DNA and protein adducts. 17 These comprehensive effects therefore cause genotoxicity as a result of oxidative damage to DNA. 29,31 The damage to DNA can lead to DSBs, chromosomal abnormalities in DNA–protein cross-links, and carcinogenesis if not properly repaired. Our novel finding is that oxidative stress provides a possible mechanism for the triggering of BN-induced hematotoxicity in humans.
Furthermore, we also supposed that BN and its metabolites could induce significant DNA damage, another well-known signal for activation of the mitochondrial pathway and a response to oxidative stress. The common use of the MN test and comet assay was proved to be a practical test strategy for the investigation of genotoxicological potency of BN and HQ. The data of MN test indicated that BN and HQ significantly increased the chromosomal aberration rate in a concentration-dependent manner in vitro, further highlighting the potential mutagenicity. The results of the study were in line with the research by Pandey 32 and Piesova. 33 Inhibition of enzymes involved in DNA replication and maintenance such as topoisomerases by BN metabolites represents a potential mechanism by which BN may induce its chromosome-altering effects. 34 Formation of MN represents a serious genotoxic event that cannot be repaired. Moreover, according to the results of comet assays as biomarkers of effects, BN and HQ induced DNA strand breaks in human cell culture systems in a direct concentration-to-effect manner. Several reactive metabolites were identified in recent reports, 3,25,27 including BN oxide, phenol, hydrochinone, catechol, and benzoquinones (BQs), generating different types of DNA lesions.
ATR microspectroscopy is an established analytical method for the identification and characterization of molecular and chemical species. This allows the detection and measurement of cellular biomarkers such as DNA, RNA, lipids, phosphate, and carbohydrates. 21,35 In vibrational spectra, different ratios or conformations of biomolecules give rise to subtle changes in these peaks (i.e. shape, shift, or intensity) and indicate intracellular alterations. 35 Previous studies showed that environmental chemical exposures result in structurally diverse forms of DNA and protein which were verified using ATR microspectroscopy. 36,37 In the present study, based on the chemical analysis data, significant differences in exposures to different concentrations were observed, especially the highlighting apparent variances in the DNA/RNA spectral region (≈1490–1000 cm−1) and protein. 20 On the basis of related analysis of comet assay and MN test, which could be comprehensively analyzed, these results seemed to suggest that BN and HQ could cause the changes in the conformation and function of intracellular proteins.
BN-induced hematotoxicity and hematopoietic malignancies are thought to occur through cell transformation and gene mutation. Oxidation of BN in the liver by CYP2E1 to BN oxide and other reactive intermediates is an initial step in the bioactivation of BN and is a prerequisite for cellular toxicity. 27,38 BN oxide can be hydrolyzed by microsomal epoxide hydrolase to BN dihydrodiol which is then converted into a catechol or undergoes ring opening to produce trans, trans-muconaldehyde, or can spontaneously rearrange to form phenol, which is then hydroxylated to form HQ. It is believed that HQ and catechol are converted by myeloperoxidase into 1,4-BQ and 1,2-BQ, respectively. 27 The capacity of these reactive quinones interacting synergistically to bind to macromolecules further exacerbated BN toxicity, including DNA fragmentation, DNA and protein adducts, generating free radicals and ROS. Some researches reported that BN metabolites bind covalently to macromolecules, such as proteins and DNA in the cell, causing genotoxicity as a result of oxidative damage to DNA or DNA DSBs by ROS. 31,39 The resulting DNA oxidative damage can lead to chromosomal aberrations, apoptosis, cell cycle arrest, and programmed cell death.
Additionally, direct or indirect DNA damage induced by BN and its metabolites, stimulated DNA damage response in both S and G2/M phases, which is an important mechanism of its genotoxicity that leads to chronic BN poisoning. Cell cycle control proteins may play a central role in mediating cellular responses to DNA damage by acting as a transcription factor for genes involved in cell cycle control. Enhanced susceptibility of PBL to apoptosis could be proposed to act as a defense against malignancy by eliminating cells to prevent proliferation of mutated cells that have acquired even DNA damage. 27,40 These results further demonstrated that BN-induced DNA damage should be helpful in elucidating the mechanism of BN-induced carcinogenesis. Taken together, mechanisms underlying BN-induced cytotoxicity and genotoxicity could be summarized as follows: (a) cellular damage due to BN metabolites and oxidative stress which stimulated intracellular ROS overproduction, directly resulting in oxidative DNA damage, cycle arrest, and apoptotic cell death. (b) Excessive damage of DNA-related proteins directly or indirectly activated by BN and its metabolites, reactive quinones, and misrepair of DNA lesions which gave rise to hematotoxicity and mutagenicity. It should be noted that oxidative damage and DNA lesions caused by synergistical interaction among BN metabolites could lead to cytogenetic toxicity and are closely interconnected with leukemia and probably other lymphohematopoietic cancers in BN-exposed population.
The adverse effects of BN and its metabolites are widespread and consequently a wide variety of cellular systems are affected. BN, evaluated in the present study, was strongly cytotoxic to PBL, involving growth inhibitory, cell-cycle perturbation, and apoptosis overproduction. Previous reports as well as data presented here suggest that high concentrations of BN and HQ can introduce DNA and protein damage. Moreover, the newly emerging ATR microspectroscope technique introduced in this study can be used to detect cellular protein damage. We found that dysfunction of cell cycle, programmed cell death, ROS overproduction, and protein and DNA lesions will be the mechanisms underlying the myeloid toxicity and genotoxicity of BN. Our data will provide valuable targets for the future investigation of the mechanisms of BN-induced cytogenetic toxicity.
Footnotes
Acknowledgements
The authors are grateful to Xiaomin Wei for assistance and guidance during this study.
This research was supported by Scientific Research and Technology Development Project of Guangxi Government, PR China (grant number 0472002-12).
The authors declared no conflicts of interest.