
Abstract
Benzene is an important industrial chemical. It is also an environmental pollutant recognized as a human carcinogen. Both prenatal and adult exposures to benzene are associated with the development of leukemia. To understand the mechanism of benzene-induced epigenetic variations, we investigated the expression and methylation patterns of CpG (phosphodiester bond between cytosine and guanine) islands in p15 and p16 promoter regions in 1,4-benzoquinone (1,4-BQ)-treated primary cultivated C57BL/6J mouse bone marrow cells in vitro. The cell toxicity of 1,4-BQ was evaluated by cell viability test, real-time PCR was used to measure the mRNA expression levels, and bisulfite sequencing PCR (BSP) was used to look into the methylation patterns. The cell viability test indicates that 1,4-BQ exhibited a dose-dependent toxicity to mouse bone marrow cells. After a 24-h exposure to 1,4-BQ at final concentrations of 0, 0.1, 1, and 10 μmol/L, the mRNA expression of p15 and p16 decreased with the increase in 1,4-BQ concentration. The BSP results gathered from the exposure and the control groups were the same. In summary, despite the observation that short-term exposure to 1,4-BQ primary cultivated mouse bone marrow cells decreased the p15 and p16 transcripts, with no influence by their gene promoter methylation.
Introduction
Benzene is a ubiquitous toxicant, which can be used as industrial solvents, diluents, substrate for the synthesis of various chemicals, 1,2 found in cigarette smoke, gasoline vapors, and automobile emissions. 3,4 Therefore, the hazard from exposure to benzene is a major public health concern. 5 Benzene is metabolized primarily to reactive metabolites such as catechol and hydroquinone in the liver, then undergo subsequent metabolism in the bone marrow by myeloperoxidases and produce a series of metabolites. 6 Benzoquinione is one of the major active metabolites of benzene’s hematotoxicity and genotoxicity. 7 Benzene has been classified as a human carcinogen by the International Agency for Research on Cancer. 8,9 A number of experimental and epidemiological evidence indicate that chronic occupational exposure to benzene is associated with aplastic anemia and acute myelogenous leukemia. 10,11 Benzene can induce oxidative and DNA damage, such as chromosome aberration and sister chromosome exchange in peripheral blood and bone marrow cells, 12 and induce the mutation of several tumor-associated genes and micronuclei. 13 In recent years, some meaningful studies have been found on benzene-induced epigenetic modification effects. 14,15 However, the exact mechanisms of benzene-induced epigenetic modification remain unknown.
The p15 and p16 genes are both located in chromosome 4 and belong to the INK4 kinase family. They are cyclic-dependent kinase inhibitors which negatively regulate the cell cycle, especially the G1 to S phase transition in cell control. 16,17 Both are hypermethylated in murine myeloid leukemia. 18 The p15 gene can function in extracellular growth inhibitory signals, 19 whereas p16 can act as an effector in the intracellular growth pathway and inhibit the activity of cyclin D-CDK4/6 complex. 20
Bollati et al. 21 reported that dysregulation and hypermethylation in p15 and genome-wide hypomethylation were associated with very low benzene exposures (∼22 ppm) in healthy subjects. Xing et al. 22 found that decrease of p15 and p16 genes expression were accompanied by alterations in DNA methylation in patients with benzene poising. The influence of other air pollutants, however, cannot be neglected, since study groups are exposed to mixed air pollutants in these studies.
In order to well understand the benzene-induced epigenetic modification effects, in the present study we used analytically pure 1,4-benzoquinone (1,4-BQ), which can remove the effects of other pollutants, treat primary-cultivated C57BL/6J mouse bone marrow cells, and investigate the mRNA expression levels and the CpG (phosphodiester bond between cytosine and guanine) islands methylation status in p15 and p16 promoter regions.
Materials and methods
Chemicals and reagents
Sigma (Germany) was the source of 1,4-BQ (≥99% pure). Dulbecco Modified Eagle Medium (DMEM) was obtained from Solarbio Science and Technology Company (China), Hot-start Taq polymerase, Universal methylation mouse DNA standard and control primers, and EZ DNA Methylation-Gold Kit™ were purchased from Zymo Research Corporation (USA). The other chemicals were commercially available products, unless otherwise specified.
Animals
Upon approval of the study plan by The Institutional Animal Care and Use Committee of Wenzhou Medical College, a total of 20 C57Bl/6J mice, equal numbers of males and females, 6–8 weeks old, were provided by the Experimental Animal Center of Wenzhou Medical College (China). Animals were acclimated to the environment for 3 days prior to use.
Separation and culture of mouse bone marrow cell
After killing the mice the femur and the tibia were subsequently separated and disinfected with 75% alcohol. The cartilage was cutoff under bacteria-free condition, exposing the marrow cavity. The bone marrow cells were dashed out using a germ-free injector with DMEM. The cells were then routinely cultured in DMEM with 10% heat-inactivated fetal bovine serum and incubated at 37°C under 5% CO2 in a humidified atmosphere.
Cell viability test
The density of the bone marrow cells increased to 80–90% in the logarithmic phase. The cells were inoculated in 96-well plates, with 5000 cells per well, and were cultured for 48 h in a CO2 incubator. The cells were treated with 1,4-BQ in terminal concentrations of 0, 0.1, 1, 5, 10, 20, and 40 μmol/L for 24 h. Treatment with each concentration was repeated three times. Subsequently, 10 μl of Cell Counting Kit-8 (CCK-8) solution was added to every well. The cells continued to be cultured for 48 h in the CO2 incubator, optical density (OD) value was measured at 450 nm. All assays were performed in triplicates and the survival rate of cells was calculated using the following formula:
Cell treatment
The density of the bone marrow cells increased to 80–90% after being cultured for 2 weeks. According to the results of the cell viability test, the cells were only treated with 1,4-BQ in final concentrations of 0, 0.1, 1, and 10 μmol/L for 24 h. The cells were harvested for the expression level and methylation pattern studies of p15 and p16.
RNA isolation and real-time PCR
The total RNA was prepared from cultured cells using the RNA prep pure Cell kit (TIANGEN, China), according to the manufacturer’s instructions. cDNA synthesis was performed in a 20 μl reaction system of reverse transcription which includes 300 ng RNA (TaKaRa, Japan). Glyceraldehyde-3-phosphate dehydrogenase (GAPDH) was used as an endogenous control to normalize the expression levels. The primer sequences of p15, p16, and GAPDH are shown in Table 1. cDNA, 60 ng, was used for real-time PCR in a volume of 20 μl. Every concentration was run three times. The program was as follows: predenaturing at 98°C for 30 sec, 40 cycles of denaturation at 95°C for 5 sec, and annealing at 60°C for 30 sec. The analyses were conducted using three independent experiments.
Primers sets used for real-time PCR analysis

GAPDH: glyceraldehyde-3-phosphate dehydrogenase.
Prediction of CpG islands and design of methylation-specific primers for p15 and p16
The original sequence of p15 (gene ID: 12579) and p16 (gene ID: 12578) were researched in GenBank, using Promoter 2.0 Prediction Server (http://www.cbs.dtu.dk/services/Promoter) to predict the promoter regions of p15 and p16. ‘MethPrimer’ (http://www.urogene.org/methprimer/index1.html), an online program for designing primers for methylation-specific PCR (MSP) and bisulfite sequencing PCR (BSP), was applied to predict the CpG islands and design methylation-specific primers for p15 and p16. 23,24 Using the ‘MethPrimer’ default algorithm, the CpG islands were identified as >200 bp regions with G and C contents >50% and observed/expected CpG rates of >0.6. The primers were synthesized by Shenggong Biotechnologies Company (China).
DNA isolation and bisulfite modification
Genomic DNA was extracted in accordance with the instructions of the DNA isolation kit (TIANGE, China). Digestion of 500 ng purified gene DNA was performed by SmaI in 30°C water bath for 5 h. Subsequently, 400 ng of the digested DNA was bisulfite modificated using the EZ DNA Methylation-Gold Kit™ (Zymo Research, USA). According to the manufacturer’s instructions, the major processes were performed as follows: denaturation of 400 ng digested DNA at 98°C for 10 min and sulfidation at 64°C for 2.5 h with a CT conversion reagent; sample was centrifuged and washed, then incubated with 200 μl M-desulfonation buffer at room temperature for 20 min. The buffer was washed away and 15 μl M-elution buffer was used for the eluted bisulfite modification DNA. Two hundred and fifty nanograms, of universal methylation mouse DNA standard (Zymo Research, USA) was used as the control for the treatment effect of the same bisulfite modification.
Bisulfite sequencing PCR
The sequence of the methylation-specific primers for p15 and p16 are shown in Table 2. Bisulfite-modified DNA (170 ng), 1 μl of individual methylation-specific primers (10 nM), 5 μl of 2× PCR buffer, and 5 μl of deoxyribonucleotide (dNTPs; 1.25 mM) were added with double-distilled water to fill a volume of 50 μl. Utilizing the hot-start PCR with touch-down RCR, the PCR reaction was performed under the following conditions: 97°C initial denaturation for 7 min, addition of 0.5 U of hot-start Taq polymerase (Zymo Research, USA); 97°C for 7 min; subsequently 10 cycles of 95°C for 1 min, 55°C, for 1 min, and 72°C for 1 min; 55°C was used instead of 53, 50, and 48°C, respectively, every 10 cycles, and finally 10 min at 72°C, for a total of 40 cycles. The BSP products were loaded to 2% agarose gels, stained with ethidium bromide and visualized under ultraviolet (UV) illumination. BSP products were extracted from agarose gel, purified, and sequenced (Shenggong Biotechnologies Company).
Sequence of methylation-specific primers for p15 and p16

a The first part of p15 including the first CpG island and the first half of the second CpG island of p15.
b The second part of p15 including the latter half of the second CpG island and the third CpG island of p15.
Statistical analysis
All statistical analyses were performed with SPSS16.0 for Windows (Chicago, IL, USA). Data were presented as means and standard deviations. One-way analysis of variance (ANOVA) was utilized to test the differences in means of cell survival rate and the mRNA expression level of genes (p < 0.05), respectively. Turkey test was performed when ANOVA test indicated statistical significance.
Results
Cell viability test
In order to determine the acute toxic effect of 1,4-BQ on mouse bone marrow cells and provide a reference for choosing the exposure concentration of 1,4-BQ for subsequent studies on the expression level and methylation status, we observed the survival rate of cells exposed to 0, 0.1, 1, 5, 10, 20, 40 μmol/L of 1,4-BQ. 1,4-BQ exhibited a dose-dependent toxicity to mouse bone marrow cells (Figure 1). The cell survival rate decreased with increasing 1,4-BQ concentration. The median lethal concentration (LC50) was 8.3 μmol/L (95% confidence interval [CI]: 4.6–10.6 μmol/L).
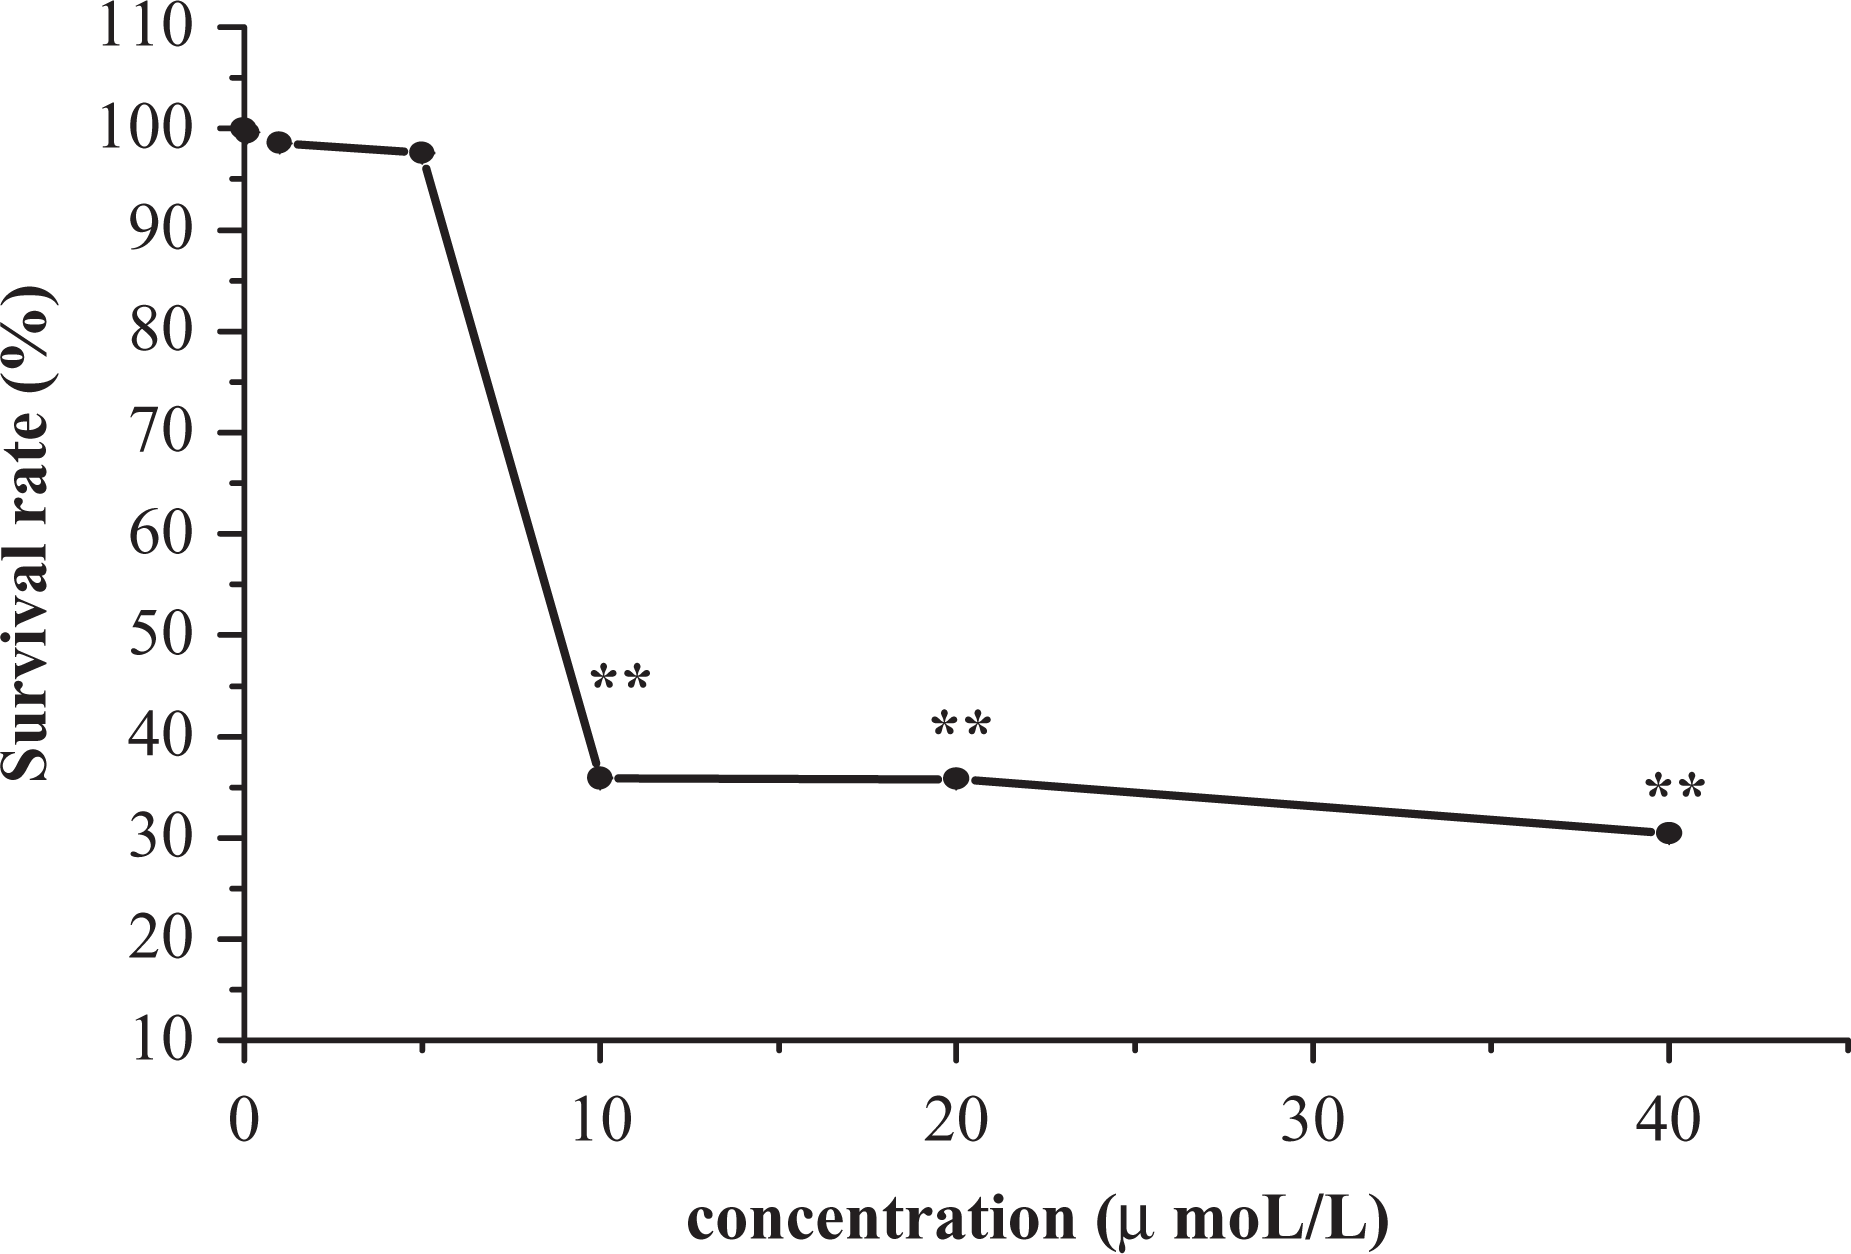
The effect of vigor on mouse marrow cells expo-sed to 1,4-benzoquinone (1,4-BQ). One-way analysis of variance (ANOVA) was used to analyze the difference in the five groups. Compared with normal cells, 10, 20, and 40 μmol/L were considered statistically significant. **p < 0.01.
Expression level
Using real-time PCR, we observed that both p15 and p16 mRNA expression levels were downregulated by increasing the exposure concentration of 1,4-BQ. The decline in p15 and p16 was 57% (p < 0.01) and 66% (p < 0.01) in the highest concentration group, respectively. Compared with the control group, 1 μmol/L (p < 0.05) and 10 μmol/L (p < 0.01) treated groups were considered statistically significant in p15 (Figure 2A), and 10 μmol/L (p < 0.01) treated groups were statistically significant in p16 (Figure 2B).

The mRNA expression level of p15 and p16 in 1,4-benzoquinone (1,4-BQ)-treated mouse marrow bone cells by real-time PCR. (A) The mRNA expression level of p15. (B) The mRNA expression level of p16. The cells were treated with 0, 0.1, 1, and 10 μmol/L of 1,4-BQ for 24 h. Glyceraldehyde-3-phosphate dehydrogenase (GAPDH) was used as an internal control to normalize the expression levels. The data were typical example of three independent experiments; the data were analyzed with ΔΔCT method. The expression of p15 was 43% in 10 μmol/L of 1,4-BQ. Compared with the control group, the largest expression of p16 decline (10 μmol/L) was 66%. Statistically significant comparison with the control, *p < 0.05, **p < 0.01.
The prediction of CpG islands, amplification, and sequencing
Results of the prediction of the CpG islands of p15 and p16 show three CpG islands from −1786 to 300 (2087 bp) including a total of 56 CpG sites in the p15 promoter regions (Figure 3A). One CpG island was predicted in p16 from −1221 to –906 (2127 bp), including 21 CpG sites (Figure 3B). The p15 was amplified by performing the PCR twice, with a product size of 375 and 331 bp, including all three CpG islands. One island of p16 was amplified by performing the PCR once.

The CpG islands in p15 and P16 promote region. CpG islands of p15 and p16 were predicted by ‘MethPrimer,’ an online program to design primers for methylation-specific PCR (MSP) and bisulfite sequencing PCR. (A) Predicted CpG islands of p15, three CpG islands can be observed in p15 promoter regions from −1786 to –300 (2087 bp). CpG island 1: 111 bp (−399 to −289 bp): CpG island 2: 221 bp (−277 to –57 bp); CpG island 3: 269 bp(−48 to 221 bp). (B) Predicted CpG island of p16, one CpG island can be observed in p16 promoter regions from −324 to −99. The product size was 285 bp.
BSP products, 5 μl, were loaded to 2% agarose gels, with a product size similar to that of the target products. All electrophoretic bands were specific and clear. The BSP products were purified and sequenced. The results of sequencing showed that all 56 CpG sites in the p15 promoter region for both the exposure groups and the control groups were unmethylated (Figure 4A). The same results were obtained for the 21 CpG sites in the p16 promoter region (Figure 4B). These results suggest that the methylation patterns of p15 and p16 were not influenced by the 1,4-BQ treatment. The sequencing results of the methylation mouse DNA standard sequence showed that the bisulfite modification results are reliable.

Primary and bisulfate-treated CpG islands sequ-ences of the p15 and p16 promoter in mouse marrow bone cells. CpG dinucleotides are numbered and marked in yellow. Primer sequences are underlined. Upper strands are the primary nucleotide sequences and lower strands are bisulfate-treated nucleotide sequences of p15 and p16. (A) Nucleotide sequence of p15 CpG islands (from −399 to 221), where 56 CpG sites were unmethlylated. (B) Nucleotide sequences of p16 CpG island (from −324 to −99), where 21 CpG sites were unmethylated.
Discussion
The bone marrow is the target organ of benzene toxicity, 1,4-BQ is an active metabolite of benzene. 25 Benzene exposure can induce leukopenia, myelodysplastic syndromes, and aplastic anemia. 26 The inactivation of tumor suppressor genes is a critical event in the development of all common forms of human cancer. 27 This inactivation is often associated with DNA methylation. 28,29 DNA methylation, one of the most important epigenetic events, is a biological process where CH3 is added to the 5 positions of the cytosine pyrimidine ring under the function of DNA methyltransferases (DNMTs), 30 which mostly occurs at the CpG islands in promoter regions. A decreased expression level of several tumor suppressor genes has been reported to be associated with the DNA methylation of their promoter regions, 31,32 such as the DNA hypermethylation of p15 and p16 genes in leukemia. 33
In the current study, although the cells were treated with 0, 0.1, 1, and 10 μmol/L for 24 h and did not appear to influence the methylation status, we observed that the statistically significant mRNA expression decreases in p15 and p16. This implied that potential carcinogenic risk may also exist, despite the short-time exposure to 1,4-BQ. In 2007, Bollati et al. 21 discovered that hypermethylation in p15 was associated with very low benzene exposures (∼22 ppb), in healthy subjects including gas station attendants and traffic police officers, although the corresponding effects on methylation were very low. In 2010, Xing et al. 22 observed that the mRNA expression levels of p15 and p16 in workers with benzene poisoning were lower than those of healthy workers in the same factory (control groups), and that the average methylation level of p16 is higher in the benzene-poisoning group compared with the controls. These studies provided that benzene could negatively affect the mRNA expression of p15 and p16 through DNA methylation. Analyzing the differences among the three research. Studies by Bollati et al. and Xing et al. belong to the epidemiology research, benzene exposure was mixed with air pollutants exposure in both the studies. Thus, their results may have not excluded the influence of other air pollutants, such as CO, SO2, polycyclic aromatic hydrocarbons, and so on. In our study, we used analytically pure 1,4-BQ, which can remove the effects of other pollutants, and proved that benzene could induce the decrease in p15 and p16 mRNA expressions. With regard to the difference between the methylation status of these two genes, the subjects of the studies on the gas station attendants, traffic police officers, and benzene poisoning were all chronically exposed to benzene, whereas the 1,4-BQ exposed cells for 24 h was a short-time treatment. There are studies that consider DNA methylation to be closely related to gene expression silence. DNA methylation is the result of gene silence but does not cause gene silence. 34 For instance, the genes of a retrovirus were closed after being infected for 2 days, whereas the corresponding promoter was in the state of methylation until 15 days later. This shows that gene silence generally occurs before DNA methylation. 35,36 In our study, acute exposure to 1,4-BQ was done over a short period of time, 24 h may not be enough for the p15 and p16 to proceed to the methylation status.
This article analyzed the mRNA expression levels of p15 and p16 and the methylation status in 1,4-BQ-treated primary cultivated mouse bone marrow cells in vitro. We found that 1,4-BQ induced the decreased expression of p15 and p16 despite the short-time exposure process. However, the promoter methylation status of the two genes did not change. The results suggest that the p15 and p16 expression changes observed were not caused by methylation changes. Nevertheless, the concrete mechanism of 1,4-BQ responsible for the decreased expression of p15 and p16 remains still unknown. Further investigations are required to define the underlying mechanisms better.
Footnotes
This research was supported by the National Natural Science Foundation of China (No. 30972510) and the Scientific and Technological Project of Wenzhou (No. Y20090104).