
Abstract
Salivary lipids are important for the maintenance of oral cavity health. Elevated salivary lipid levels are associated with an increase of caries incidence, plaque development, calculus formation and periodontal disease. However, the regulation of lipid salivary levels is scarcely known. Cigarette smoke is considered a risk factor for oral cavity diseases. We study how cigarette smoke may affect the secretion of salivary lipids. To this purpose, we determine the salivary levels of cholesterol and of glycerolipids in saliva sampled from smokers and non-smokers at various times of day. We observe an increase of glycerophospholipid and a decrease of cholesterol levels in the smokers’ saliva collected at 10 p.m. On the other hand, unsaturated fatty acids in chief phospholipids of saliva are lower in smokers at 7 a.m. Therefore, for the first time, we demonstrate that cigarette smoke induces variations of saliva lipid pattern in young people even moderately smoking.
Introduction
Salivary glands, either major or minor, pour their secretions into the mouth, so forming the saliva that is a major defense factor for oral mucosa, soft gingival tissues and teeth against chemical, mechanical and microbiological insults. 1 Saliva is formed by many chemical components (among which lipid) that may interact with each other to form a “dynamic continuum” responsible for the chemical, physical and biological properties of the saliva. 2–4 Salivary lipids may bind non-covalently to mucin so contributing to the visco-elastic properties of mucus. 5,6
Salivary glands synthesize lipids actively, 7 but the factors regulating the lipid levels in saliva are still poorly known, although it has been discovered that the secretion of phospholipids is influenced both quantitatively and qualitatively by either cholinergic or β-adrenergic mediators 4,8,9 and that the acinar cells of salivary glands possess receptors responding to either sympathetic or parasympathetic systems. 10 Moreover, cells from sublingual glands in culture release phospholipids upon isoproterenol stimulation. 4,5,11
Cigarette smoke contains about 4000 chemicals, 400 of which are carcinogens. It also contains oxidants, such as oxygen radicals 12 and volatile aldehydes, 13 held responsible for damaging many biomolecules. 14 Therefore, cigarette smoke is a risk factor for periodontal diseases, 15 leukoplakia 16 and oral candidiasis. 17
Lipids are important for the establishment and the maintenance of salivary functions 1,18 ; moreover, they facilitate the penetration of potentially toxic, lipophylic substances (present in cigarette smoke) into the oral mucosa. 2,19 It has been reported that elevated salivary lipids associate with an increase of caries incidence, plaque development, calculus formation and periodontal diseases. 19 The control of lipid salivary levels is therefore a chief factor for the maintenance of oral cavity health.
Saliva is the first biological fluid that comes into contact with cigarette smoke; however, the effects of cigarette smoke on either the gaseous phase or the particulate components of saliva have not been studied adequately. 20,21 The lipid pattern of the smokers’ saliva is unknown, although they are deemed important for oral health.
Therefore, we test the hypothesis that cigarette smoke may alter the lipid composition of the saliva.
Materials and methods
Saliva collection
Saliva was collected from 14 male volunteers (20-25 years old) chosen from students frequenting the department; 7 were non-smokers and 7 habitually smoked 10 cigarettes per day. Clinical inspection did not reveal the presence of active oral or systemic pathologies; during the experimental period, volunteers did not use any drugs. Saliva (5 mL) was collected 4 times a day (7 and 11 a.m. and 4 and 10 p.m., about 5 min after the last cigarette) for 5 consecutive days with a plastic, sterile Pasteur pipette placed under the tongue. To reduce to a minimum the effects of drinking, tooth brushing and of other behaviors, subjects were instructed accordingly. The collection was made before breakfast and at least 2 hours after meals. After centrifugation at 5,000 × g × 10 min, the supernatants were collected and used to determine lipids, as described below.
Lipid extraction
Lipids were extracted following published procedures. 22 Briefly, 750 µL of saliva (+ 3 mL of 0.9% NaCl) were mixed with 15 mL of chloroform: methanol (2:1, v/v). The choloroformic phase was collected and washed 2 times with 3 mL of methanol: water (1:1 by vol) each time. The organic phase was reduced in volume under a gentle N2 flux and the extracts were dissolved in 150 µL of chloroform and used for further analyses.
Lipid separation
Lipids (triacylglycerols, phospholipids and cholesterol) were separated by TLC (TLC aluminum sheets, silica Gel 60, 20x20 cm, Merck, Darmstadt, Germany). Reference standards (Supelco-Sigma-Aldrich, Milan, Italy) were placed in separate lanes. The plates were then developed with n-hexane: ethyl ether: formic acid (40:10:1, by vol). After drying under a gentle N2 flux, the lanes containing reference standards were colored with 2,7-dichlorofluoroscein (0.2% in ethanol) and observed under ultraviolet light. The corresponding silica stratum of (non-colored) samples was scraped off from the plate and used for further analyses.
Triacylglycerol determination
Triacylglycerol was determined as reported 23 ; briefly, the silica containing triacylglycerol, was eluted with n-hexane. Eluted material was chromatographed on TLC plates (TLC aluminum sheets, silica Gel 60, 20 × 20 cm, Merck, Darmstadt, Germany) developed in n-hexane: ethyl ether: 99% acetic acid (80:20:1, v/v/v). The plates were left at room temperature until dry and then dipped into 3% copper acetate (w/v):8% phosphoric acid (v/v), (1:1, v/v), for 10 min. Plates were then heated at 120°C for 20 min and the intensity of the spots measured with a scanner system. Triacylglycerol was determined by comparison with triolein reference standards.
Separation and analysis of phospholipid classes
Aliquots of the lipid extracts were chromatographed on TLC plates (TLC aluminum sheets, silica Gel 60, 20 × 20 cm, Merck, Darmstadt, Germany) as described. 24 The bidimensional chromatography was first developed with chloroform: methanol: 1.6 mol/L ammonia (35:15:2.5, by vol) and then with chloroform: methanol: acetone: acetic acid: water (35:10:15:7.5:3.75, by vol).
Dried plates were colored with I2 vapors (this step was omitted if fatty acids were to be analyzed; see below). Lipid classes were identified with pure reference standards: phosphatidylcholine, phosphatidylethanolamine, phosphatidylserine, phosphatidylinositol, sfingomyelin, cardiolipin and phosphatidic acid. Spots were visualized by spraying with 2,7-dichlorofluoroscein.
The silica corresponding to phospholipid classes was scraped off from the plate and lipid determined as inorganic phosphate after digestion with perchloric acid as above described.
Fatty acid methylation
The silica corresponding to phospholipid classes (see above) was mixed with 2 mL of 3% H2SO4 (w/v) in methanol and kept 1 hour at 80°C. Few mg of BHT (2,6-D-tert-butyl-4-methylphenol) were added to prevent oxidation. The reaction was stopped by placing the samples in a melting ice bath and by adding 100 µL of water to each sample. The methylated fatty acids formed in the reaction were extracted with 5 mL of n-hexane and samples were then centrifuged at 1,000 × g × 10 min, dried under N2 flux, dissolved in 30 µL of n-hexane and used for gas-chromatographic analysis.
Gas-chromatographic analysis
Samples (1 µL) were analyzed with a Carlo Erba (Milan, Italy) gas-chromatograph (HRG 5300 Mega Series) equipped with a 30 m long (0.53 mm internal diameter) capillary column (Supelco-Sigma-Aldrich, Milan, Italy). The stationary phase was poly-alkylene glycol (PAG) and the carrier gas was He (1 mL/min). Injector and detector temperatures were 230°C and 250°C, respectively. A linear oven temperature gradient was started at 150°C to reach 190°C in 40 min.
Eluted fatty acids were identified with pure reference standards and results were expressed as the percentage of each fatty acid/total fatty acid.
Cholesterol determination
Folch’s lipid extracts were dried under a gentle N2 flux and suspended in 2 mL of phtalaldehyde in acetic acid (50 mg phtalaldehyde/100 mL acetic acid). Concentrated sulfuric acid (1 mL) was then added and samples left for 10 min at room temperature. Absorbance was determined with a spectrophotometer (Cary 50, Varian) at a wavelength of 550 nm. 25 Cholesterol concentration was determined using pure reference standards.
Determination of lipid phosphorus
Lipid phosphorus was assessed as described by Bartlett: 26 dried lipid extracts were digested for 1 hr with 0.7 mL of 70% (w/v) perchloric acid at 180°C and mixed with Fiske-Subbarow solution 27 and 2 mL of 0.5% ammonium molybdate. Color was developed by heating at 100°C for 10 min and absorbance was measured at a wavelength of 830 nm. The concentration of phosphate was determined by comparison with pure reference standards.
Statistical procedures
Data were usually studied by ANOVA (monovariate) followed by a post-hoc Scheffé test at p = 0.05 to identify subsets. In some cases, Student’s t test was used. Statistics is reported in figure and table legends.
Results
In this work, we examined the lipid content of the saliva of smoking and non-smoking young people at various times during the day.
We first determined the amount of triacylglycerol, which was 37-39 µg/mL of saliva, irrespective of smoking habits and the time of day.
Figure 1 shows the total lipid phosphorus. Our data may suggest that total lipid phosphorus amounts follow a circadian rhythm in saliva, different between smokers and non-smokers. Differences were absent in the morning and increased in the afternoon to reach a peak at 10 p.m. (p < 0.001).

Total lipid phosphorus in the saliva of smokers (circles; seven individuals) and of non-smokers (squares; seven individuals) at various times during the day. Statistics: univariate ANOVA: p = 0.001 both for day time and smoke. Post-hoc: homogenous subsets (Scheffé, p = 0.05) for non-smokers: 7 a.m., 11 a.m. and 4 p.m., 10 p.m. Homogenous subsets (Scheffé, p = 0.05) for smokers: 7 a.m., 11 a.m. and 4 p.m., 10 p.m. Student’s t test between non-smokers and smokers. At 7 a.m., 11 a.m., and 16 p.m.: NS, at 10 p.m.: p < 0.001.
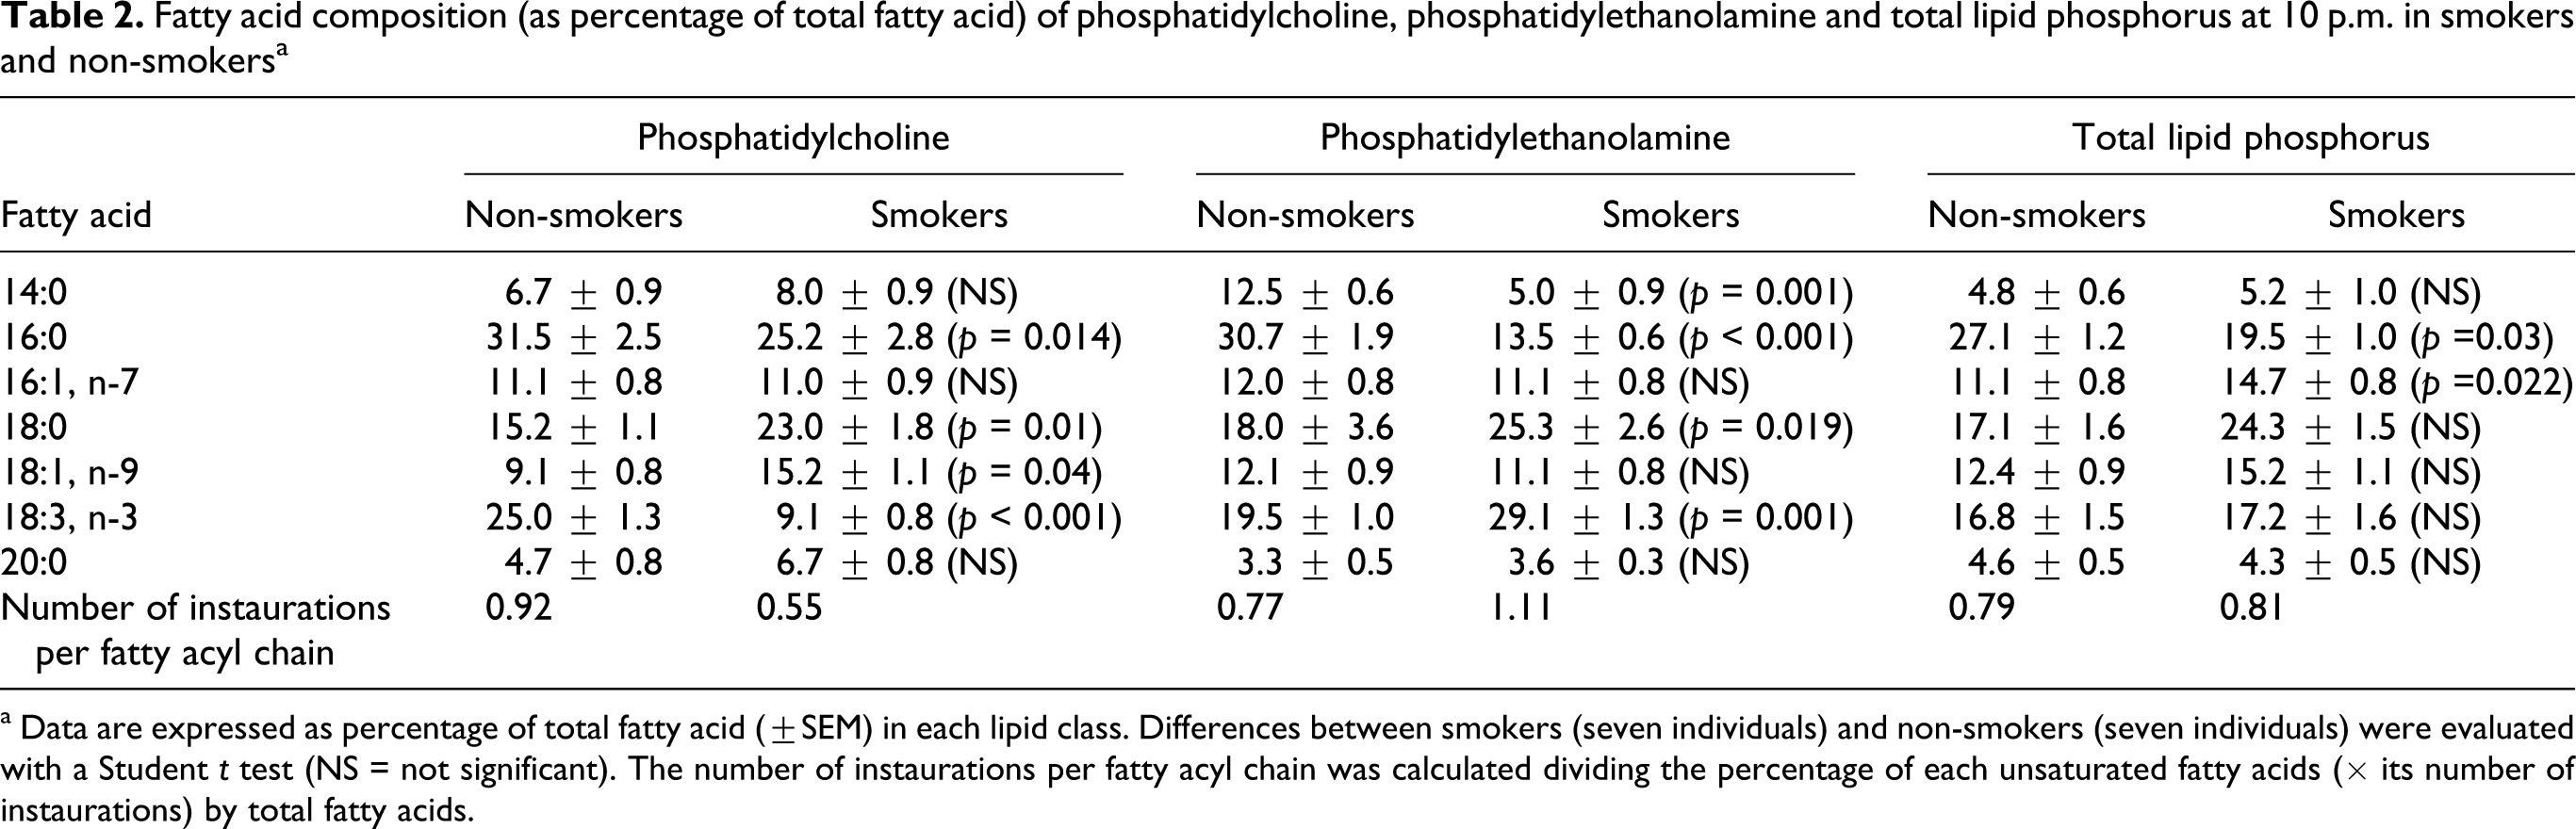
Main phospholipid classes (phosphatidylcholine and phosphatidylethanolamine, 25% and 22% of total lipid phosphorus respectively) did not show statistically significant variations in our protocol. Therefore, the increase of total lipid phosphorus in smokers’ saliva at 10 pm was due to phospholipids other than phosphatidylethanolamine or phosphatidylcholine.
Fatty acids were examined in the chief phospholipid classes (phosphatidylcholine and phosphatidylethanolamine) and in total phospholipids. Differences between smokers and non-smokers were found only in the morning (7 a.m.) and in the evening samples (10 p.m.; Tables 1 and 2) but could not be noticed during the day (data not shown). The number of double bonds per fatty acid, as a rule, was lower in smokers, an exception being the finding for phosphatidylethanolamine at 10 p.m.
Fatty acid composition (as percentage of total fatty acid) of phosphatidylcholine, phosphatidylethanolamine and total lipid phosphorus at 7 a.m. in smokers and non-smokers a

a Data are expressed as percentage of total fatty acid (±SEM) in each lipid class. Differences between smokers (seven individuals) and non-smokers (seven individuals) were evaluated with a Student t-test (NS = not significant). The number of instaurations per fatty acyl chain was calculated by dividing the percentage of each unsaturated fatty acids (× its number of instaurations) by total fatty acids.
Fatty acid composition (as percentage of total fatty acid) of phosphatidylcholine, phosphatidylethanolamine and total lipid phosphorus at 10 p.m. in smokers and non-smokers a
a Data are expressed as percentage of total fatty acid (±SEM) in each lipid class. Differences between smokers (seven individuals) and non-smokers (seven individuals) were evaluated with a Student t test (NS = not significant). The number of instaurations per fatty acyl chain was calculated dividing the percentage of each unsaturated fatty acids (× its number of instaurations) by total fatty acids.
The most evident differences between smokers and non-smokers were found at 7 a.m. In some instances, the number of instaurations per fatty acid chain halved in smokers.
Cholesterol concentrations did not vary during the day in smokers (Figure 2). However, in control subjects (non-smokers) the salivary amounts of this lipid appeared to follow a circadian rhythm with the lowest values in the morning and the highest in the evening.
Discussion
The homeostatic mechanisms of many salivary components are scarcely known. In particular, this is true for lipids, although some work has been done on lipid synthesis. 2,11 On the other hand, the amount and the composition of saliva are important for the health of the oral cavity. 18,19 Smoking is associated to periodontal diseases 28,29 and, therefore, it would be interesting to ascertain whether cigarette smoke may alter salivary lipid secretions. Yet, as far as we know, a relationship between smoking and lipid concentrations in saliva has never been described in the literature.
In this paper, we report some difference of saliva composition between smokers and non-smokers. The absolute value of salivary lipid may be affected by a number of factors, such as previous drink intake, intense physical activity (that was avoided in our subjects), tooth brushing and the use of mouth washing preparations. For these reasons, all subjects were instructed to behave in a similar manner. We report here, for the first time, the possibility of circadian variations of salivary lipids in smoking and non-smoking young adults. Although we cannot demonstrate any effects on triacylglycerol secretion, we notice an increase of salivary total lipid phosphorus in smokers in the evening (10 p.m.), the contrary being true for cholesterol. This may be important because saliva properties (visco-elastic and hydrophobic) may change upon lipid variations. 4 Therefore, the stimulation of oral cavity tissues by smoke during the day would deregulate salivary lipid secretions, which predisposes to oral diseases. 16,17 However, the amount of total lipid phosphorus in saliva is not influenced by smoking in the samples collected at 7 a.m., indicating that some toxic effects of cigarette smoke are removed during the nocturnal pause.
The fatty acid composition of total saliva glycerophospholipids and of the chief phospholipid classes (phosphatidylcholine and phosphatidylethanolamine) is affected by smoking. The general rule is a substantial decrease of unsaturated fatty acid in smokers’ phospholipids (Tables 1 and 2). This finding seems in agreement with the data of Lee, 30 who reported that the radicals contained in cigarette smoke decrease cell membrane polyunsaturated fatty acids and could be relevant for the physicochemical properties of the saliva.
Salivary cholesterol (+cholesterol esters) levels appear to follow a circadian rhythm in human saliva (highest levels in the afternoon and the evenings); however, this rhythm is lost in smokers.
The voluntary subjects examined in this work were young adults (20-25 years old) and therefore the antioxidant capacity of saliva was not decreased by ageing 31 ; in addition, they were moderate smokers (about 10 cigarettes/day). Therefore, it may be hypothesized that the effects of cigarette smoke would be larger in heavier smokers and/or in older subjects.
We conclude that the habit of cigarette smoking produces variations in salivary lipid levels that, in their turn, might affect the health of oral cavity.
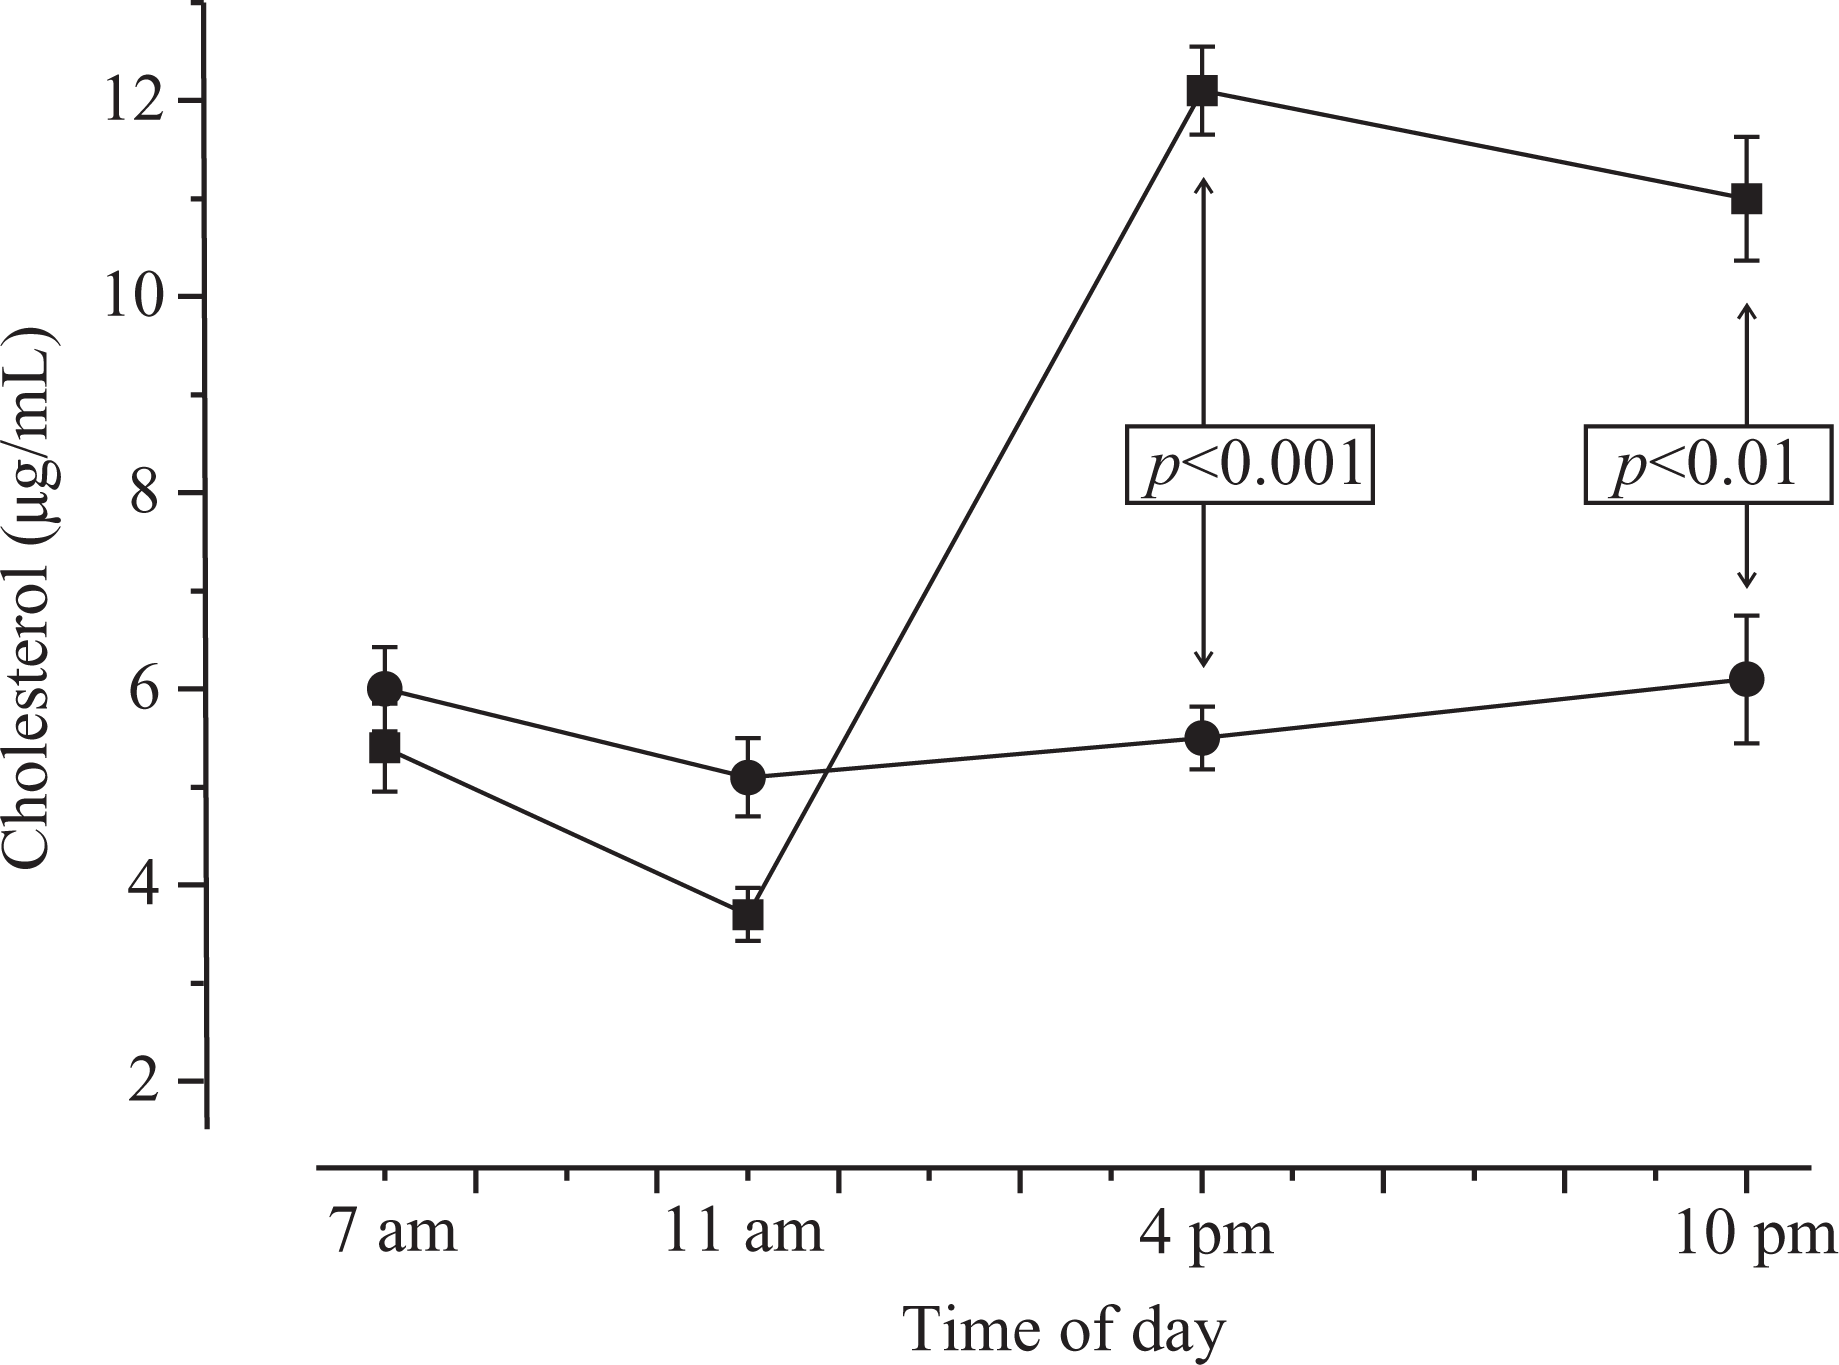
Salivary cholesterol variations in smokers (circles; seven individuals) and non-smokers (squares; seven individuals) at various times during the day. Statistics: univariate ANOVA: p < 0.0001 for both smoke and day time. Post-hoc: all time points in non-smokers belonged to different subsets (Scheffé, p = 0.05). No different subsets were found in smokers at any time.
Footnotes
This study was funded by the Italian Ministry for University Education (MIUR, PRIN 2006).