
Abstract
Carbon tetrachloride (CCl4) is a common hepatotoxin used in experimental models to elicit liver injury. To identify the proteins involved in CCl4-induced hepatotoxicity, two-dimensional gel electrophoresis was employed followed by mass spectrometry - mass spectrometry (MS/MS) to study the differentially expressed proteins during CCl4 exposure in the Fischer 344 rat liver proteome for 5 weeks. Ten spots with notable changes between the Control and CCl4 groups were successfully identified. Among them, four proteins with significant up-regulation, namely calcium-binding protein 1, protein disulfide isomerase, mitochondrial aldehyde dehydrogenase precursor, and, glutathione-S-transferase mu1 and six proteins with significant down-regulation, namely catechol-O-methyltransferase, hemoglobin-alpha-2-chain, hemopexin precursor, methionine sulfoxide reductase A, catalase and carbonic anhydrase 3, were identified. The data indicates that CCl4 causes hepatotoxicity by depleting oxygen radical scavengers in the hepatocytes. In this rat model, we profiled hepatic proteome alterations in response to CCl4 intoxication. The findings should facilitate understanding of the mechanism of CCl4-induced liver injury.
Introduction
Carbon tetrachloride (CCl4)-induced hepatotoxicity is the standard use of CCl4 as a liver toxin to induce liver injury. It is a well-investigated experimental model used to study the principles of hepatotoxic-induced lipid peroxidation. 1 CCl4 is a commercial solvent used in machine cleaning and as a household agent for the removal of stain in the past and was found to cause intoxification. 2 The hepatotoxicity was found to be the result of inflammation initiated by oxidative stress, free radicals and lipid peroxidation. 3 CCl4-induced hepatotoxicity mediates oxidative stress by cytochrome P450 isoenzymes, resulting in trichloroperoyl free radical metabolites formation from a chain of events involving plasma membrane in lipid peroxidation. 3 The free radical metabolites form from the polyunsaturated fatty acids of the cell membranes will adversely affect the structural component of the membrane, resulting in alterations in fluidity or permeability of membranes, cell energy processes destruction and protein synthesis. 4-7 Such mechanisms are believed to be the cause of liver injury by CCl4.
Proteomics has gained increasing popularity in the investigation of quantitative change in protein expression in biological systems. 8,9 Such techniques provide bioinformatics for obtaining a better understanding of the disease pathogenesis. Differences in protein expression have been recorded in liver cancer with the use of proteomic analysis. 10 In the current study, a two-dimensional gel-based proteomic approach was adopted to examine the liver proteome changes in response to chronic treatment with CCl4.
Materials and methods
Animals
Adult male Fischer 344 rats (initial body weights = 250−280 g; n = 5 for each group; total n = 10) from our own breeding colony were used. The animals were kept in a separate animal room, on a 12-h light-dark cycle, at a room temperature 22°C and constant humidity with access to standard laboratory chow and water ad libitum. Animal care and treatment were conducted and approved according to the guidelines of the Committee on the Use of Live Animals in Teaching and Research, The University of Hong Kong, 11 and Department of Health, the Government of Hong Kong, HKSAR.
Generation of liver injury model
All rats were allowed to acclimatize for a week before the experiment. The rats were randomly assigned into Control and CCl4 groups. The Control group received subcutaneous injection with pure olive oil twice a week for 5 weeks. The CCl4 group received subcutaneous injection with CCl4 (Merck KGaA, Darmstadt, Germany) diluted 1:1 (v/v) in pure olive oil at a dose of 0.2 mL/100 g of body weight twice a week for 5 weeks. This hepatotoxicity animal model was described previously, with modification. 12
Tissue collection
At the end of experiment, animals were anesthetized with ether and sacrificed. Blood samples were taken by cardiac puncture and the collected serum was used for biochemical analysis. The liver tissue specimens were removed immediately and approximately 1 cm sections of the right lobe were harvested, snap-frozen in liquid nitrogen and stored at –80°C for liver enzyme assays and proteomic analysis.
Biochemical assays
Alanine aminotransferase
Sample preparation for proteomic analysis
Protein extraction method has been described previously. 8 The liver tissue samples were disrupted with a tissue teaser (Biospec Products, Oklahoma, USA) in a cocktail buffer (1 % Triton X-100, 25 mmol/L HEPES, 150 mmol/L NaCl, 1 mmol/L EDTA disodium salt, 1 mmol/L dithiothreitol [DTT]) with added Protease Inhibitor Cocktail Set III (Bio-Rad, California, USA). The superfluous salt in the supernatant was removed by incubating with trichloroacetic acid (TCA)-acetone solution (20 % TCA, 20 mmol/L DTT in acetone) for 4 h at –40°C. The protein pellet was obtained by centrifugation at 15,800 x g for 30 minutes at 4°C. Excess TCA was removed by multiple washing with acetone containing 20 mmol/L DTT. The air-dried protein pellet was resuspended in buffer (7 mol/L urea, 2 mol/L thiourea, 4% 3-[(3-cholamidopropyl) dimethylamonio]-1-propanesulfonate, 100 mmol/L DTT, 5% glycerol). The final protein solution was stored at –80°C until further 2-DE analysis. Protein concentration of each sample was measured by spectrophotometer using Bio-Rad protein microassay based on the method of Bradford.
Two-dimensional gel electrophoresis and MS/MS analysis
The two-dimensional gel electrophoresis (2-DE) procedures used here have been previously described by us with modifications. 9 A total of 10 gels (5 for Control and 5 for CCl4) were conducted, with one gel per animal from each of the time points. For the first dimensional electrophoresis of proteins, a fixed amount of 125 µg protein samples were loaded onto an 18 cm ReadyStrip immobilized pH gradient (IPG) Strips (pI 3-10 NL, Bio-Rad, California, USA). The strips were rehydrated with 350 µL rehydration buffer (9.5 mol/L urea, 2 % 3-[(3-cholamidopropyl) dimethylamonio]-1-propanesulfonate, 0.28 % DTT, 0.5% IPG buffer, pH 3–10, 0.002% bromophenol blue) before being applied onto the Ettan IPGphor III isoelectric focusing (IEF) electrophoresis system (GE Healthcare). The samples were rehydrated for 7 h before isoelectric focusing via the following programs: (1) linear increase up to 500 V in 1 h; (2) held at 500 V for 3 h; (3) linear increase up to 10,000 V in 3 h; (4) linear increase up to 10,000 V in 3 h and (5) finally held at 10,000 V to reach a total of 90,000 Vhs. Focused IPG gel strips were equilibrated for 15 minutes in a solution (50 mmol/L Tris-HCl, pH 8.8, 6 mol/L urea, 30 % glycerol, 2 % SDS, containing 20 mmol/L DTT) followed by incubation with the same buffer containing 20 mmol/L iodoacetamide for another 15 minutes. Equilibrated gel strips were then placed onto a 1.0-mm-thick 12.5 % polyacrylamide gels and SDS-PAGE was carried out at a constant current of 30 mA for 30 minutes followed by a 60-mA current for the rest of the analysis in a PROTEAN xi II cell (Bio-Rad,). After electrophoresis, gels were fixed in fixation solution (10% ethanol, 7% acetic acid in water) for 2 h before staining with SYPRO Ruby Protein stain (Bio-Rad), according to the manufacturer’s guideline.
Image acquisition and analysis
Image analysis and protein identification
The Molecular Imager PharosFX Plus System (Bio-Rad) was used to scan stained 2-DE gels. PDQuest 8.0 for Windows (Bio-Rad) software was used for matching and analyzing protein spots on the 2-DE gels, with the function on background subtraction, spots detection and volume normalization. Detected spots was normalized and assigned with a number referenced by a ‘virtual gel’ or a reference gel (the best gel of the 10 gels) automatically. Any under-detected spots were manually assigned with the number according to the reference gel by the researcher. The expression level, expressed as percentage volume (% vol), was exported for statistical analysis. Protein spots with differential expression between Control group and CCl4 group (p < 0.05) were selected for protein identification.
Protein identification by MS/MS
Spots with differential expression (p < 0.05) between the Control and CCl4 groups were sent to the Genome Research Centre (The University of Hong Kong, Hong Kong) for protein identification. The proteins were digested with trypsin and applied to matrix-assisted laser desorption ionization-time of flight/time of flight (MALDI-TOF/TOF MS) analysis on 4800 MALDI TOF/TOF Analyzer (Applied Biosystems, CA, USA) for analysis. The match between the experimental data and mass values calculated from a candidate protein was carried out by Mascot peptide mass fingerprinting, a powerful search engine that uses MS data to identify proteins from www.matrixscience.com against the NCBI database with taxonomy limited to Rattus norvegicus (Rats). Mascot reported the molecular weight search (MOWSE) score, which is calculated by –10 × Log10 (p), where p is the probability that the observed match is a random event. p is limited by the size of the sequence database being searched (limited by taxonomy), the conditions and the settings of trypsin digestion. Each calculated value that falls within a given mass tolerance of an experimental value counts as a match. The accepted threshold shows an event is significant if it would be expected to occur at random with a frequency of <5%. In this study, a protein match with a score >64 was regarded as significant. 17 The Mascot also generated values of sequence coverage, which is the percentage of trypsin-derived peptides accounting for the whole sequence of the target protein. The apparent isoelectric point and relative molecular mass of proteins are calculated according to their position on the gels and confirmed with the searched data.
Western blotting analysis
Liver protein extract was mixed with sample buffer (62.5 mmol/L Tris, pH 6.8, 25% glycerol, 2% SDS, 350 mmol/L DTT, 0.01% bromophenol blue). Thirty µg protein of each sample was applied for electrophoresis on 12.5% SDS-PAGE gels with constant voltage (125 V) and transferred to polyvinylidene diflouride membrane. The membranes were incubated with primary antibodies and subsequently with secondary antibodies as listed below: rabbit polyclonal against Catalase (CAT) or protein disulphide isomerase (PDI; secondary antibody: goat anti-rabbit conjugated with horseradish peroxidase); goat polyclonal against catechol-O-methyltransferase (COMT) or glutathione-S-transferase mu (GSTM1; secondary antibody: rabbit anti-goat conjugated with horseradish peroxidase); chicken polyclonal against calcium binding protein 1 (CABP1; secondary antibody: goat anti-chicken conjugated with horseradish peroxidase); mouse monoclonal against mitochondrial aldehyde dehydrogenase 2 (ALDH2) or β-actin (secondary antibody: goat anti-mouse conjugated with horseradish peroxidase). All primary antibodies were purchased from Abcam, Cambridge, UK, except ALDH2, which was purchased from Santa Cruz Biotechnology, USA. All secondary antibodies were purchased from Bio-Rad. The intensity change of protein bands was accessed using Quantity One software (Bio-Rad). The relative molecular weight of each protein band was estimated with molecular markers (Precision Plus Protein Standards Dual Color, Bio-Rad) and was detected using ECL Western blotting detection kit (Amersham, Arlington Heights, Illinois, USA).
Statistical analysis
All data were analyzed by SPSS 11.5 software and reported as means ± SEM using one-way ANOVA. Student’s t-test was used for between-groups comparison. p Values of 0.05 or less are considered statistically significant.
Results
Body weight and liver weight
At the end of experiment, the mean body weight of the rats in the CCl4 group was 287.4 ± 19.96 g and in the Control group was 312.4 ± 9.6 g, with no significant difference (Figure 1A). In contrast, the mean liver weight in the CCl4 group (22.9 ± 0.72 g) was significantly heavier than those in the Control group (16.55 ± 0.32 g; p < 0.001; Figure 1B).
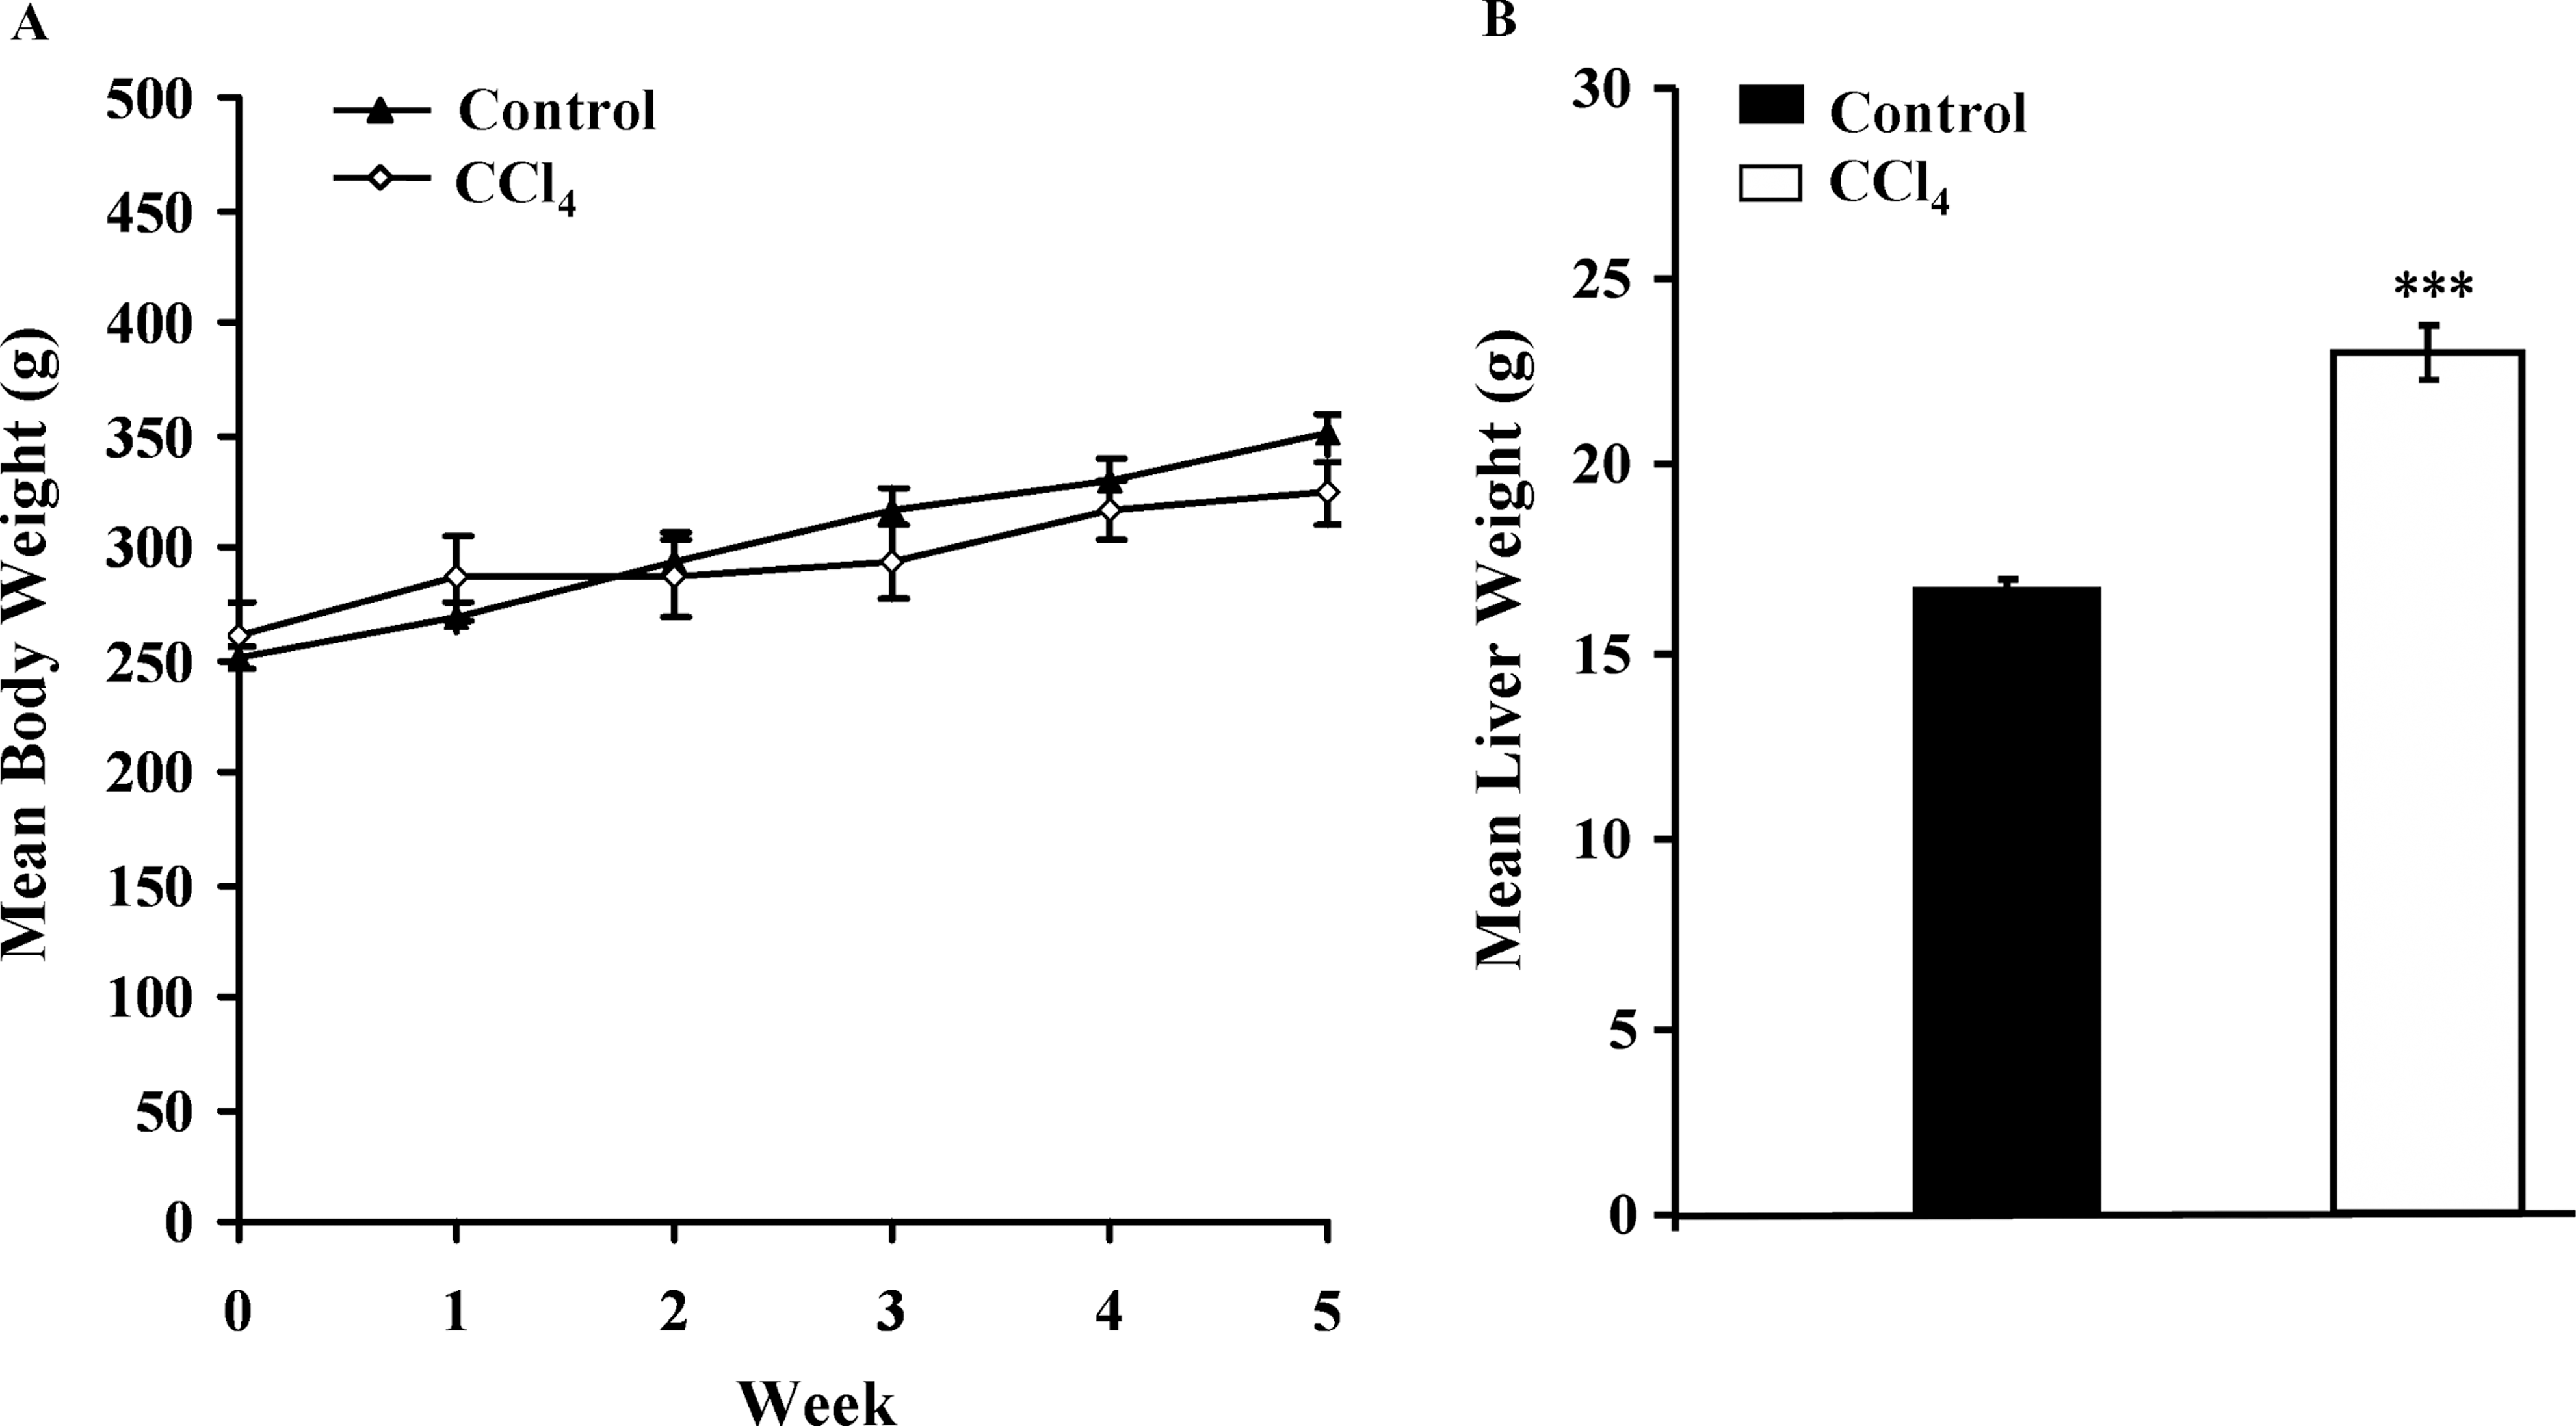
Effects of carbon tetrachloride (CCl4) on mean body weight (g) (A) and mean liver weight (g) (B). Male F344 rats were subcutaneously injected with or without CCl4 (0.2 mL/100g/twice a week) for 5 weeks. Values are mean ± SEM for five rats per group. ***p < 0.001 compared with the control group.
Biochemical assay of liver function CCl4-induced hepatotoxicity
The data revealed that the administration of CCl4 compared to Control significantly increased the serum activity of ALT by 40-fold (2798.2 ± 193.9 U/L in CCl4 group and 65.02 ± 3.2 U/L in Control group; p < 0.001; Figure 2A) and γ-GT by 20-fold (6.62 ± 0.67 U/L in CCl4 group and 0.29 ± 0.08 U/L in Control group; p < 0.001; Figure 2B).
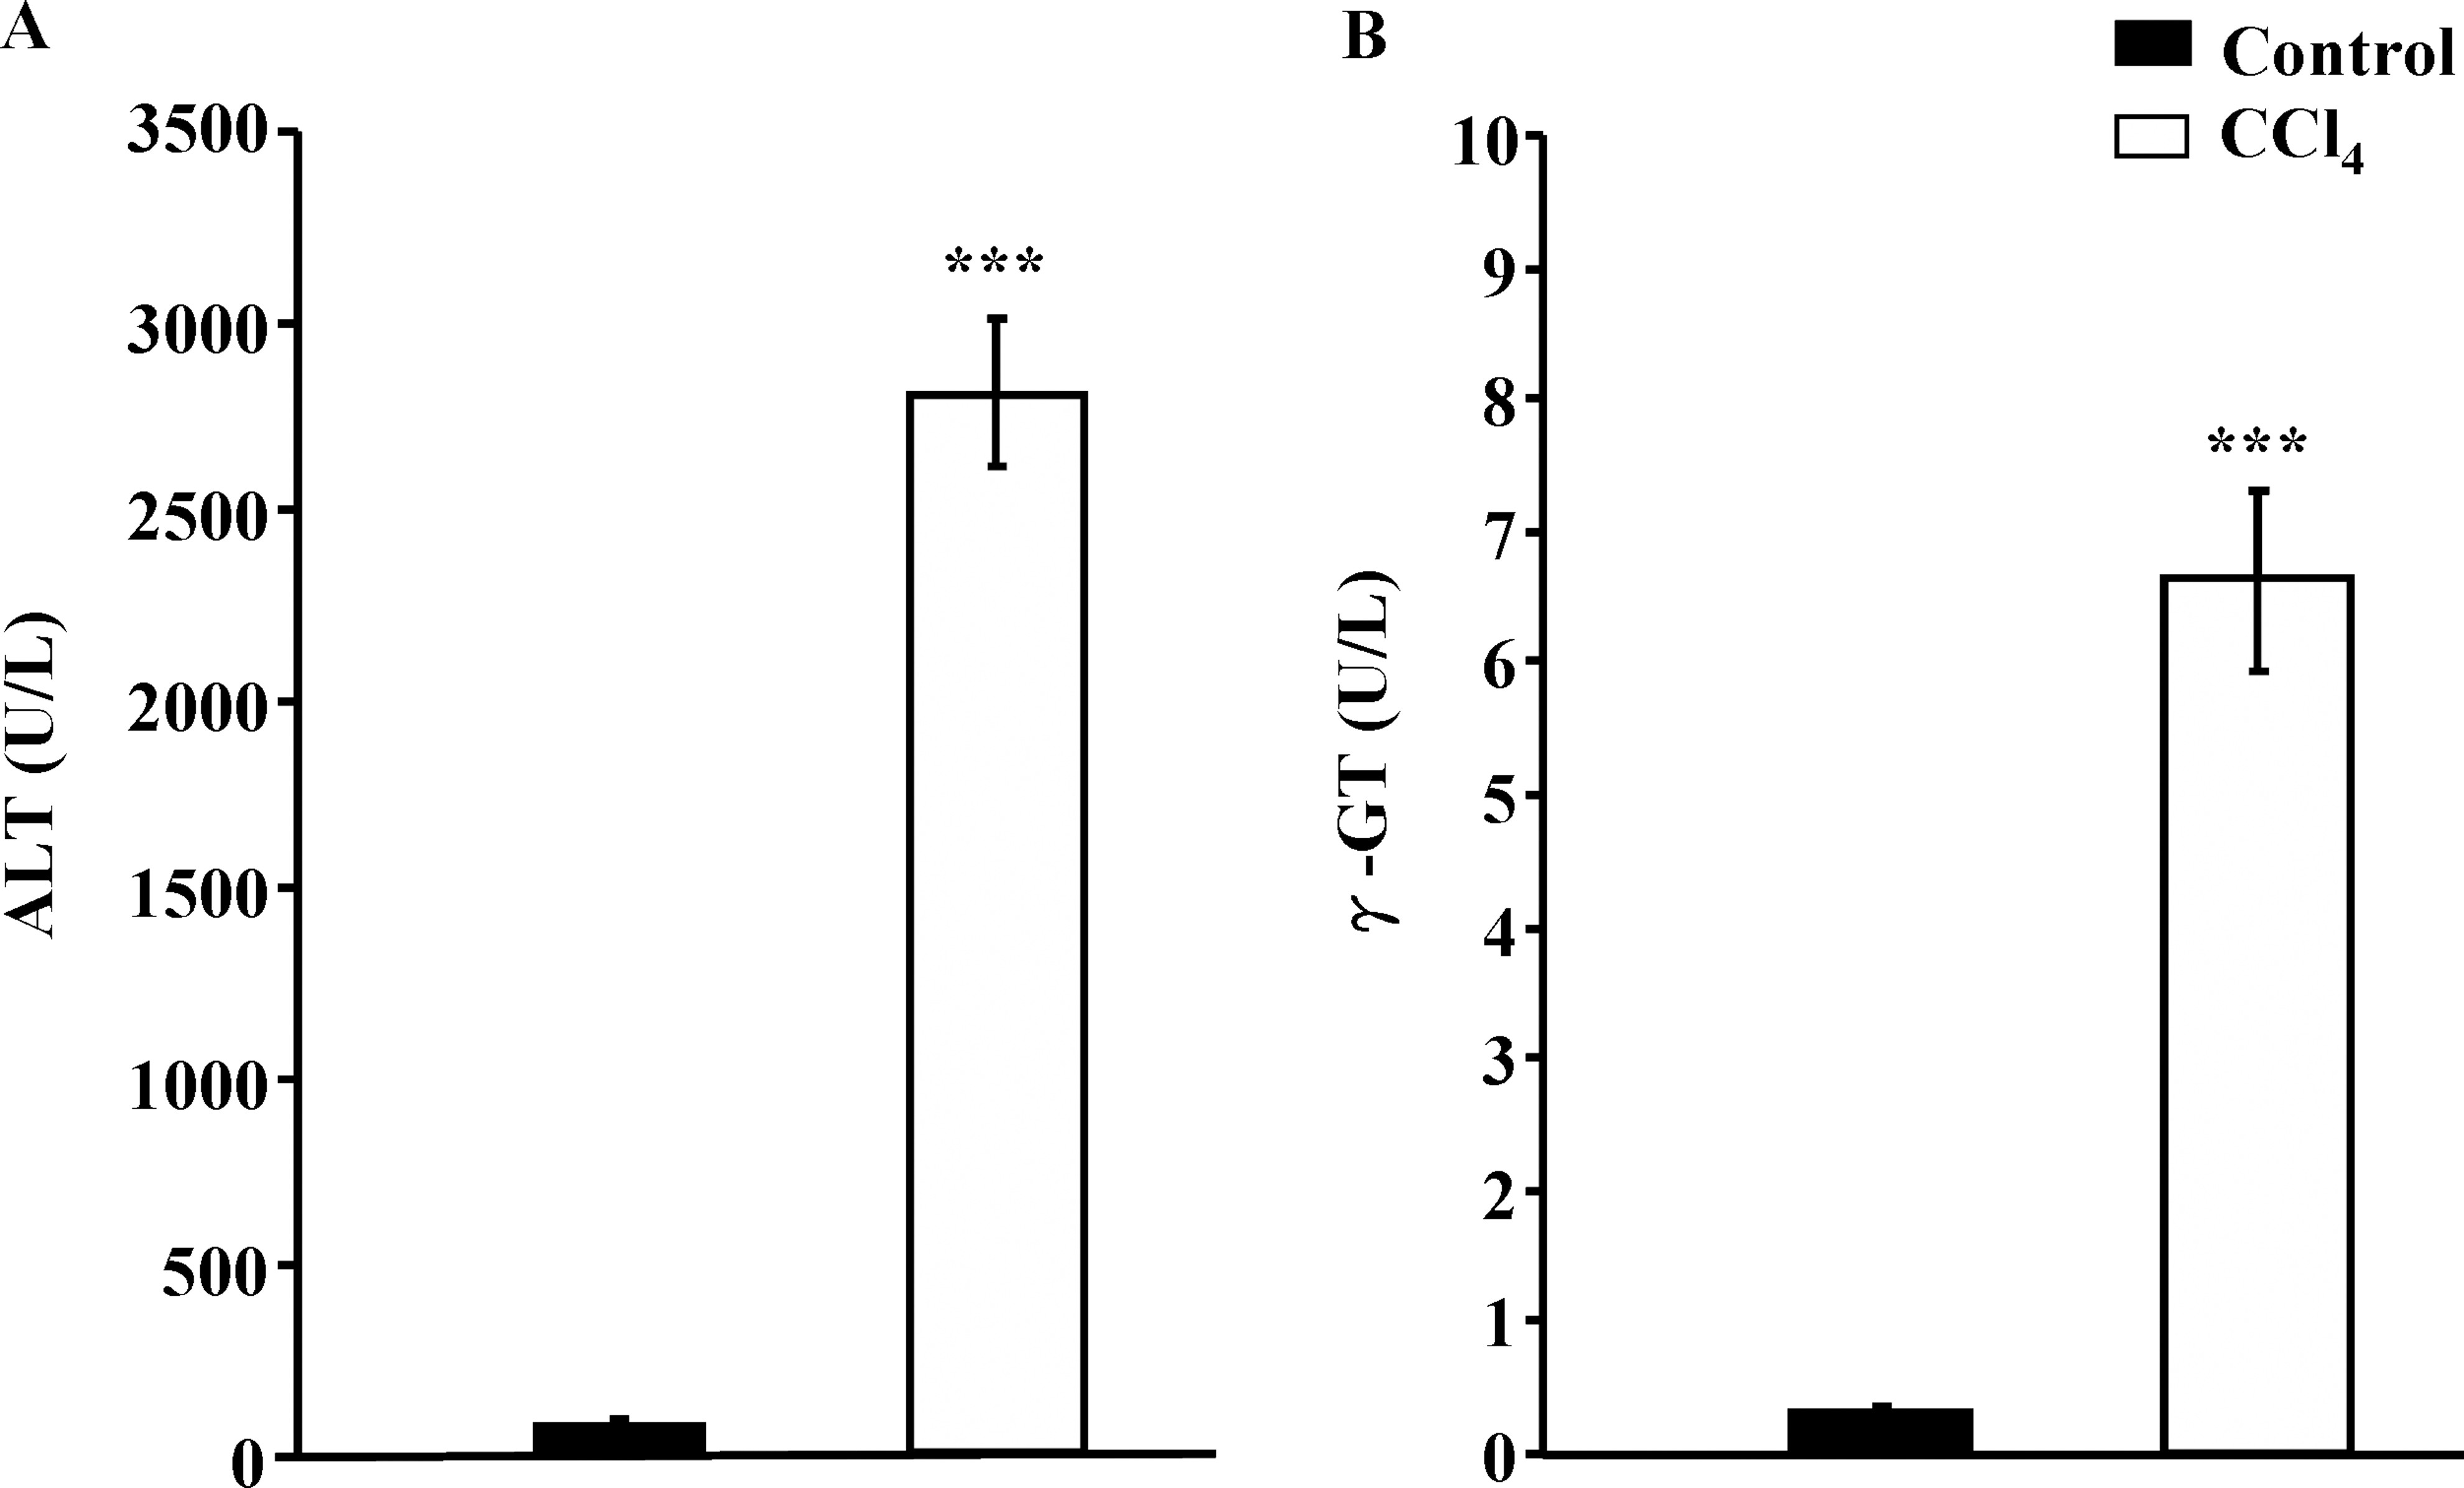
Serum biochemical assays of alanine aminotransferase (ALT) (A) and γ-glutamyl transferase (γ-GT) (B) liver function in response to carbon tetrachloride (CCl4)-induced hepatotoxicity. Rats were treated with or without CCl4 for 5 weeks. Serum samples were assayed for the activities of ALT and γ-GT. Values are mean ± SEM for five rats per group. ***p < 0.001 compared with the control group.
GSH and GST assays on glutathione metabolism in CCl4-induced hepatotoxicity
Subcutaneous administration of CCl4 significantly depleted hepatic GSH concentration by 74% from normal rats 6.68 ± 0.05 µmol/g to 1.75 ± 0.33 µmol/g (p < 0.001; Figure 3A) and significantly elevated hepatic GST activity by 62% from normal rats of 0.336 ± 0.064 µmole CDNB/min/mg to 0.895 ± 0.124 µmole CDNB/min/mg (p < 0.01; Figure 3B) when CCl4 was administered.

Liver enzyme assays of reduced glutathione (GSH) (A), glutathione-S-transferase (GST) (B), catalase (CAT) (C) and glutathione peroxidase (GPx) (D) in response to carbon tetrachloride (CCl4)-induced hepatotoxicity. Rats were treated with or without CCl4 for 5 weeks. Liver homogenate samples were assayed for the activities of GSH, GST, CAT and Gpx. Values are mean ± SEM for five rats per group. **, *** p < 0.01, 0.001 as compared with the Control group, respectively.
CAT and Gpx activities in CCl4-induced hepatotoxicity
CCl4 significantly reduced hepatic CAT activity by 74% from normal rats of 5.14 ± 0.21 mmole H2O2/min/mg to 1.34 ± 0.18 mmole H2O2/min/mg (p < 0.001; Figure 3C) and the level of hepatic Gpx was significantly reduced by 31% from normal rats of 0.136 ± 0.008 µmole NADPH/min/mg to 0.094 ± 0.008 µmole NADPH/min/mg (p < 0.001; Figure 3D) when CCl4 was administered.
Liver proteome profile and protein identification
There were approximately 500 well-resolved protein spots detected on each 2-DE gels. Ten spots with notable changes between the Control and CCl4 groups were successfully identified (Figure 4). The subcellular locations were examined and the basic information on the identified proteins with a lower or higher expression level (p < 0.05) in the CCl4 group was compared with Control (Table 1). The proteins with increased expression were calcium binding protein 1 (CABP1; spot 407), protein disulfide isomerase (PDI; spot 502), mitochondrial aldehyde dehydrogenase precursor (ALDH2; spot 2118), and glutathione-S-transferase mu 1 (GSTM1; spot 8129). The proteins with decreased expression were catechol-O-methyltransferase (COMT; spot 17), hemoglobin alpha 2 chain (HBα2; spot 36), hemopexin precursor (HPX; spot 2611), methionine sulfoxide reductase A (MSRA; spot 5113), catalase (CAT; spot 6504) and carbonic anhydrase 3 (CAR3; spot 7111).

Representative 2-DE gels of a rat liver proteome map, with or without the administration of carbon tetrachloride (CCl4) for 5 weeks (n = 5 for each groups). Immobilized pH gradient (IPG) strips (18 cm pH 3−10) were used for isoelectric focusing (IEF), followed by SDS-PAGE (12.5% polyacrylamide). The gels were visualized using SYPRO Ruby protein staining and the differentially expressed proteins were numbered.
Rat liver proteins exhibiting differential expression with or without the administration of carbon tetrachloride (CCl4)
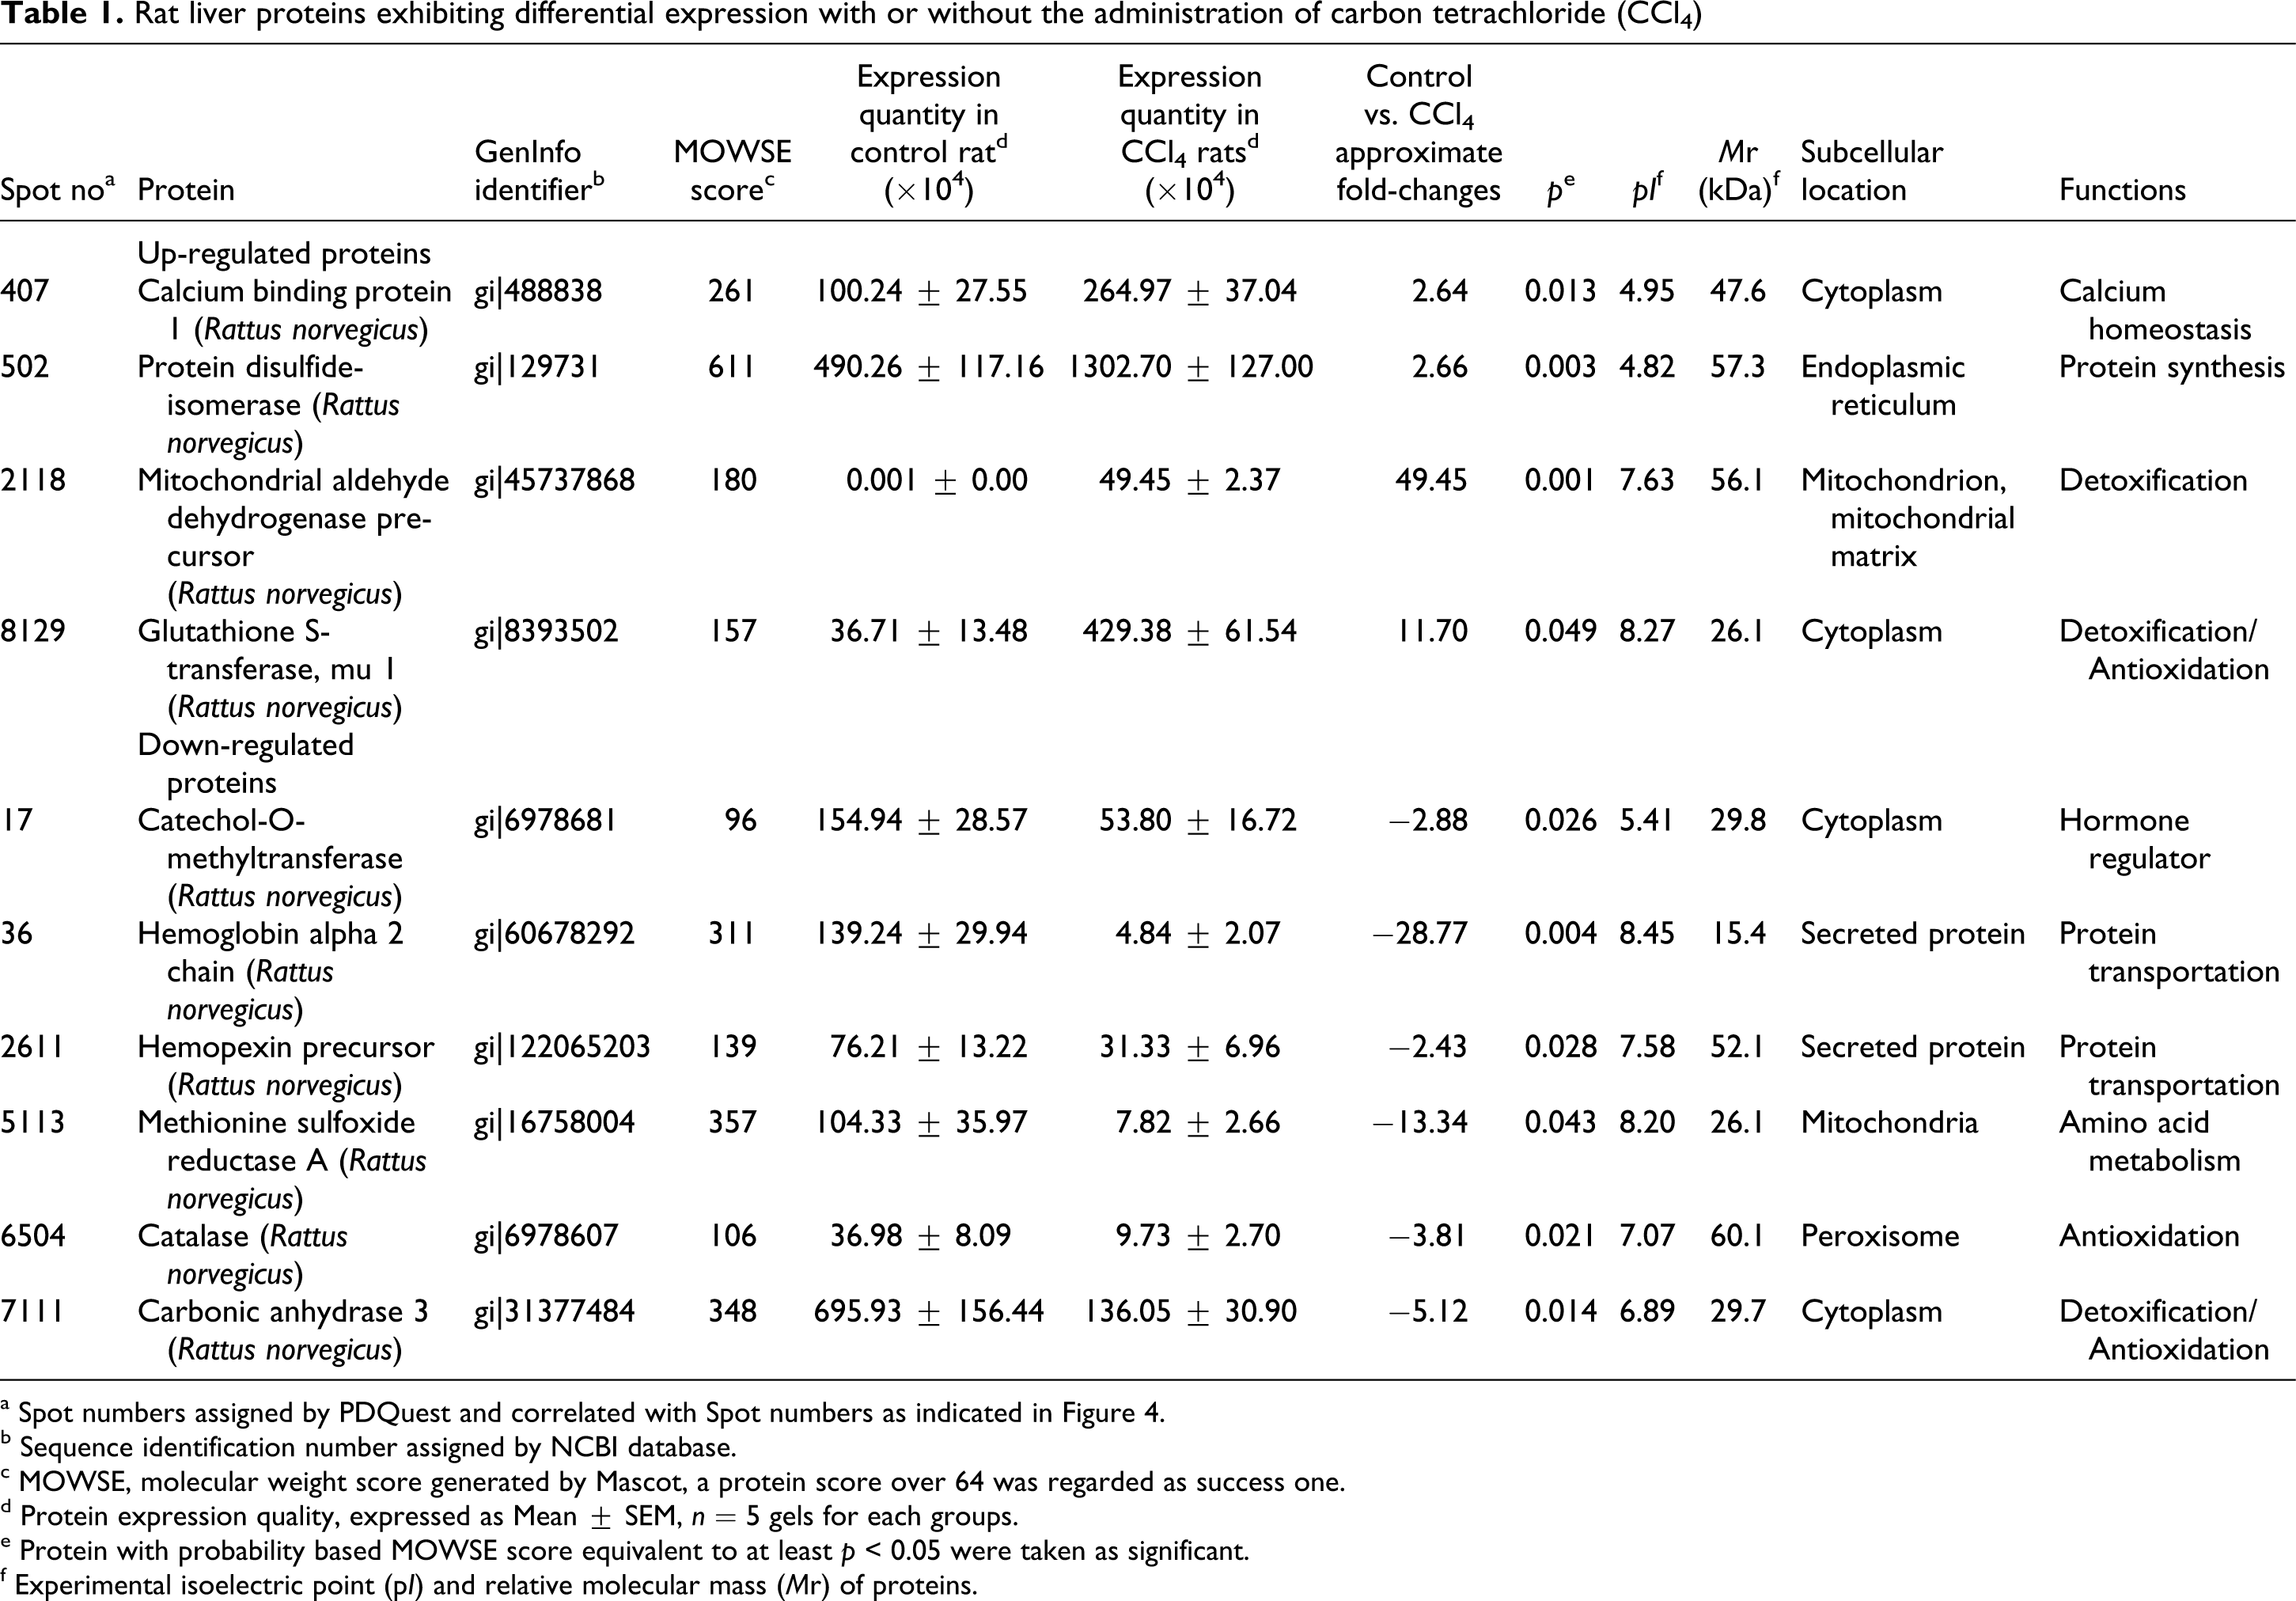
a Spot numbers assigned by PDQuest and correlated with Spot numbers as indicated in Figure 4.
b Sequence identification number assigned by NCBI database.
c MOWSE, molecular weight score generated by Mascot, a protein score over 64 was regarded as success one.
d Protein expression quality, expressed as Mean ± SEM, n = 5 gels for each groups.
e Protein with probability based MOWSE score equivalent to at least p < 0.05 were taken as significant.
f Experimental isoelectric point (pI) and relative molecular mass (Mr) of proteins.
Western blotting confirmation
The results are similar to those of the 2-DE proteomic analysis (Table 1), showing both COMT and CAT were reduced (p < 0.05), whereas GSTM1, CABP1, PDI and ALDH2 were increased (p < 0.05) in the CCl4 group compared with the Control group (Figure 5).

Western blot analysis of liver proteins, catechol-O-methyltransferase (COMT) (A), catalase (CAT) (B), glutathione-S-transferase mu (GSTM1) (C), protein disulphide isomerase (PDI) (D), calcium binding protein 1 (CABP1) (E) and mitochondrial aldehyde dehydrogenase 2 (ALDH2) (F). Values are mean ± SEM; n = 5 in each groups. *, *** p < 0.05, 0.001 as compared with the Control group, respectively.
Discussion
In this study, we demonstrated that the injection of CCl4 for 5 weeks in rats led to a marked elevation in the levels of serum ALT and γ-GT. Both the cytoplasmic ALT and γ-GT released into the circulation after cellular damage have been considered as hepatic damage biomarkers in the diagnosis of liver injury. 18
Our data (Figure 3) indicates the presence of a suppression of the antioxidant system in the liver of rats treated with CCl4 since GSH is an antioxidant that helps protect cells from reactive oxygen species (ROS), such as free radicals and peroxides. In the liver, CCl4 is metabolized by cytochrome P450 in the endoplasmic reticulum to produce the highly reactive trichloromethyl radical, which is further converted to the peroxytrichloromethyl radical. This free radical can extract hydrogen from different molecules, thus initiating the oxidation of lipids, proteins and DNA in liver injuries. 19
In order to construct a database to improve our understanding of hepatotoxicity and of potential diagnostic or therapeutic protein target discovery, we applied a comprehensive analysis of proteins associated with the hepatotoxicity induced by chronic exposure of rats to CCl4 by using a combination of two-dimensional electrophoresis (2-DE) and mass spectrometry. The 2-DE proteomic technique is useful for systematic analyses of global protein abundance profiles of normal and diseased tissues, often providing novel insights into the pathogenic mechanisms of human disease as well as disease-associated targets. In the present study, we have successfully identified 10 proteins from the NCBI database, and their importance in the pathophysiology of CCl4-induced hepatotoxicity is discussed below under the following clusters: detoxification and antioxidation, hormone regulation, amino acid metabolism, protein transportation and protein synthesis and calcium homeostasis (Table 1).
Detoxification and antioxidation
Carbonic anhydrase 3 (CAR3) is a member of the carbonic anhydrase family of zinc metalloenzymes. Apart from aiding the transport of carbon dioxide out of tissues, it may also serve as an oxygen radical scavenger to protect hepatocytes from oxidation damage. The enzyme contains two reactive sulfhydryl groups (Cys 181 and Cys 186) that readily form disulfide linkages with GSH, a process termed S-glutathiolation, under conditions of oxidative stress. 20 Thus, depletion of CAR3 could provoke the oxidative process from decreasing the production of disulfide linkages formed induced by CCl4. Furthermore, CAR3 has been shown to protect hepatocytes from hydrogen peroxide-induced apoptosis. 21-27 The reduced abundance of this protein in the present study (fivefold decrease) may have allowed the production of free radicals in the hepatocytes. This may be a mechanism by which the rat hepatocytes were damaged by CCl4 (Figure 6).

Proposed inter-relationships of the differentially expressed liver proteins in carbon tetrachloride (CCl4)-induced hepatotoxicity
Glutathione-S-transferase mu1 (GSTM1) is an antioxidant enzyme that has a protective effect against oxidative stress 28 and a capacity to detoxify endogenous compounds, such as peroxidised lipids, by converting GSH to GSH-free radical conjugate. 29-32 It has been proposed that human subjects lacking GSTM1 would be more susceptible to the genotoxic effects of carcinogenic epoxides. 33 In this study, the hepatic GST activity was significantly increased by 62% (Figure 3B) and the result of proteomics in GSTM1 was significantly up-regulated (12-fold increase) when treated with CCl4. These results indicated that the decrease in GSH was related to an increase in the overall production of GST, which subsequently catalyzes formation of GSH-free radical conjugate (Figure 6).
Mitochondrial ALDH2 was significantly increased in CCl4-treated rats. This protein is responsible for eliminating xenobiotic aldehydes and toxic biogenic agents 34-36 and also has a major role in acetaldehyde detoxification. 37 It is believed that it may play a protective role in the mechanism by which hepatocytes combat sudden increases in aldehyde products. The 49-fold increase of ALDH2 is a strong indication of the presence of increased lipid peroxides in the CCl4-treated liver. In this pathway, the intermediate structures can be toxic and health problems may arise when those intermediates cannot be cleared 38 (Figure 6).
Catalase (CAT) is a ROS scavenger responsible for the breakdown of H2O2. The reduced expression of catalase and glutathione peroxidase (GPx) in hepatocytes is generally correlated to the decrease in the GSH/GSSG ratio and increase in lipid peroxidation. 39 In the present study, the hepatic CAT activities was significantly decreased by 74% (Figure 3C) and there was a reduced expression of hepatic GPx activity by 31% when CCl4 was administered (Figure 3D). We conclude that the fourfold decrease in CAT in liver proteome could lead to an increase in hepatocyte lipid peroxidation in the animals (Figure 6).
Amino acid metabolism
The present study shows that CCl4 damage to the rat liver led to a decrease in the abundance of methionine sulfoxide reductase A (MSRA), which is responsible for catalyzing the thioredoxin-dependent reduction of free and protein-bound methionine sulfoxide [Met(O)] residues to methionine. According to previous studies, it was indicated that mouse lacking the MSRA gene exhibited enhanced sensitivity to oxidative stress when compared with the wild type. It is believed that MSRA may possibly play an important role as an antioxidant in mammals. 40 The 13-fold depletion of MSRA found in this study may have resulted in a decrease in the reduction of Met(O) residues to methionine, a ROS scavenger, which could increase the susceptibility of the rat liver to oxidative stress imposed by ROS (Figure 6).
Hormone regulator
A threefold depletion of catechol-O-methyl transferase (COMT) was found in this study. COMT is responsible for converting catechol to guaninol and has been found to serve as a mechanism of preserving S-adenosylmethionine (SAM) in hepatocytes. 21,41 Moreover, COMT inhibitor application for the treatment of Parkinson’s disease has been shown to cause potential hepatotoxicity. 42 It is speculated that decreased availability of methionine would lead to the shortage of SAM, a substrate of COMT, causing reduced level of S-adenosylhomocysteine (SAH). As a result, the reduced level of SAH could cause lowered biosynthesis of cysteine and hence decrease of GSH production (Figure 6).
Protein transportation and protein synthesis
We observed that CCl4 treatment caused twofold decrease in Hemopexin precursor (HPX) and 29-fold decrease in Hemoglobin alpha 2 chain (HBα2). Since both of them are transporters of heme to liver parenchymal cells and active in heme scavenging, 43 the reduction of HPX and HBα2 could result increased level of free heme, which is highly toxic as it promotes the generation of ROS and thus promoting oxidative damage. 44,45 Moreover, heme is a positive regulator of cytochrome P450 gene transcription. 46 It is believed that free radicals (CCl3 - and CCl3OO-) generated by the cytochrome P450-dependent detoxification step could induce liver injury by lipid peroxidation (Figure 6). The increase in cytochrome P450, however, cannot be shown by proteomic analysis in the present study, due to the fact that cytochrome P450 proteins are endoplasmic reticulum membrane proteins with a very high isoelectric point (pI), which makes 2-DE analysis difficult. 34,47,48
The PDI, which exhibited a threefold increase in the present study, is a multifunctional protein. PDI plays important roles in corrective protein folding and as a cellular chaperone. 49 It is also involved in the maturation of collagen helix, which is a landmark of liver fibrosis which is increased in liver injury. The intrinsic function of this protein, however, is believed to be the rearrangement of disulfide bridges and the catalysis of oxidation, reduction and corrective disulfide isomerization so as to prevent unnecessary aggregation. 49 Under the oxidative stress induced by CCl4 consumption, proteins are highly susceptible to cysteine oxidation and the incorrect formation of disulfide bridges, leading to detrimental change in the 3-dimensional structure of the protein and aggregation. 49 Moreover, it is hypothesized that under significant oxidative stress in the injured hepatocytes, the increased abundance of PDI production is to compensate for the demand of corrective disulfide isomerization, which is needed to stabilize the proteins susceptible to aggregation (Figure 6).
Calcium homeostasis
CABP1 is a high-affinity calcium-binding glycoprotein of the rat liver endoplasmic reticulum. 50 Studies have indicated the cytosolic calcium level is elevated after exposure to hepatotoxins such as CCl4. This elevated cytosolic Ca2+ is believed to be the result of an activation of calcium-releasing channels. 51-53 The threefold increase in CABP1 found in the present study supports the fact that CCl4 metabolism may play a role in the activation of calcium release into the cytosol (Figure 6). The high levels of calcium in the cytosol activate calcium-dependant proteases that exacerbate membrane damage. The increase in intracellular calcium can activate endonucleases that inflict chromosomal damage that in turn contributes to cell death and cancer. 54
In summary, CCl4 is a hepatotoxicant that generates ROS and initiates lipid peroxidation and induces significant liver injury in the rats. We propose that the hepatotoxicity mechanism by which CCl4 induced liver injury in the rats is mostly due to the suppression of the antioxidant and detoxification system. Also, in this study, we showed that proteomic technology can serve as a powerful tool for the rapid identification and confirmation of proteins with significant roles in the pathogenesis of liver injury during toxic chemical exposure. The liver proteomic analysis approach hastened the discovery of significant proteins that are involved in the pathogenesis of the liver injury induced by the hepatotoxicant. MS/MS-based sequencing of peptides derived from these differentially expressed proteins has helped identify both protein markers that had previously been cited as possible indicators as well as potentially novel associations with hepatic effects for proteins already established by other investigations. The present data facilitate not only the molecular mechanistic investigation of CCl4-induced liver injury but also provide new direction in the study of disease pathogenesis.
Footnotes
This work was supported by the grants of the Liver Strategic Research Grant by The University of Hong Kong.