
Abstract
The Divergence Problem (DP) – classically defined as a breakdown in the relationship between tree growth and temperature in recent decades – poses a major challenge to developing robust tree-ring based climate reconstructions. This is particularly relevant in northwestern North America (NWNA), a climatically sensitive yet underrepresented region in dendroclimatological networks. To address this gap and the implications of the DP, we developed a network of 34 white spruce sites across southern and central Yukon, using latewood Blue Intensity (LWBI) as a high-resolution proxy for maximum summer temperatures. Sites span a broad elevational range, allowing assessment of how proximity to local treeline influences climate sensitivity. LWBI chronologies from sites within 100 m of upper treeline exhibit the strongest (r2 = 0.46) and most temporally stable relationship with June-August (JJA) temperatures. In contrast, lower elevation chronologies display weaker coherence and declining sensitivity in the recent period that is consistent with the DP. Ring width chronologies express poor correlations and temporal stability and are not recommended for temperature reconstructions in this region. Despite near-treeline LWBI sites presenting the best option for optimising reconstructions, there is slight evidence of a non-linear relationship between LWBI and JJA temperatures, leading to the underrepresentation of extreme warm summer temperatures. The results herein offer a strategy for minimising the DP and enhancing the reliability of temperature reconstructions in NWNA through targeted site selection. However, in a warming world, a progressive weakening in temperature limitation – even at optimal sites – will likely lead to a degradation in calibration accuracy in future reconstructions.
Introduction
Numerous studies have demonstrated the effectiveness of utilising networks of tree ring proxies to reconstruct past summer temperatures across the Northern Hemisphere (Anchukaitis et al., 2017; Büntgen et al., 2021; Esper et al., 2018; Schneider et al., 2015; Wilson et al., 2016). Such work is crucial for placing recent climatic extremes and trends in both a spatial and temporal context. Northern North America is however notably underrepresented in the field of dendroclimatology (Heeter et al., 2021a; Wilson et al., 2016), in comparison to the spatial and temporal coverage in Europe (Buntgen et al., 2011; Linderholm et al., 2015; Ljungqvist et al., 2019; Rydval et al., 2017). Particularly, there are few multi-centennial to millennial length maximum latewood density (MXD) and latewood blue intensity (LWBI) records which provide a substantially more robust estimate of past summer temperatures than ring width (RW; Wilson et al., 2016). Recent research over the past 10 years has targeted this paucity of studies by expanding tree-ring networks and extending both into the 21st century as well as further back in time for northwestern North America (NWNA; Gennaretti et al., 2014; Heeter et al., 2021a, 2021b; King et al., 2024; Wiles et al., 2014). This collaborative effort to update the North American tree-ring network will improve temperature reconstructions to both contextualise past climate variability with modern climate-growth relationships and provide vital information on the spatial patterns of climate change (Anchukaitis et al., 2017; Leland et al., 2023). With the addition of this study, there will now be an increasingly dense network of RW, MXD and LWBI from a range of elevations across western and northwestern North America. Such dense networks allow an assessment of how local climatology, which changes with elevation and latitude, modulates tree growth’s response to climate.
Updating tree-ring proxy information for NWNA is also important due to a phenomenon that has been termed the Divergence Problem (DP), first described in the mid-1990s in interior and northern Alaska (Jacoby and D’Arrigo, 1995). The DP is generally defined as a decoupling in the relationship between tree rings and temperature data and has been noted at multiple mid-high elevation/latitude conifer sites (Andreu-Hayles et al., 2011; Chavardès et al., 2013; D’Arrigo et al., 2008; Porter and Pisaric, 2011). This is most often seen as a reduced temperature sensitivity of tree growth in the later 20th century, but it can also be interpreted as a trend discrepancy, whereby tree-ring data do not capture the increasing trend seen in mean observational temperatures. This loss in sensitivity presents a substantial challenge for dendroclimatology as it implies that the assumptions of uniformitarianism, which posit that modern relationships (quantified in the instrumental period) between tree-growth and climate are temporally stable, are incorrect.
The causes of the DP remain a topic of intense debate (D’Arrigo et al., 2008; Esper and Frank, 2009) but it likely represents a complex interplay of multiple factors. In temperature-limited environments, it is often attributed to the impact of warming at treeline sites, where trees may have passed a critical biological threshold, leading to a weakening or even loss of temperature limitation (D’Arrigo et al., 2004). Related to this warming impact, some regions may also be getting drier. In such cases, trees may become more limited by moisture than by temperature (Barber et al., 2000; Porter and Pisaric, 2011). Early studies observed the DP in RW records (D’Arrigo et al., 2006; Jacoby and D’Arrigo, 1995; Lloyd and Fastie, 2002), but a growing body of evidence suggests that tree-ring density parameters, MXD and LWBI, are less impacted, further emphasising the importance of investing in these parameters for studying past climate (Anchukaitis et al., 2013; Buras et al., 2018; Wilson et al., 2019). Although MXD is considered the gold standard for tree-ring based temperature reconstructions, traditional densitometric measurements are expensive and few laboratories exist which can produce such data, (Büntgen et al., 2017; Grudd, 2008; Wilson et al., 2016). An alternative is Blue Intensity (BI) – specifically measured from the latewood (LWBI) – an image analysis approach that provides a cheaper surrogate for MXD (Björklund et al., 2014b; Campbell et al., 2007; McCarroll et al., 2002; Sheppard et al., 1996). Both parameters measure similar wood properties and have been shown to express strong linear relationships with warm season temperature, although LWBI can have additional limitations due to potential wood discolouration issues (Björklund et al., 2024; Kaczka and Wilson, 2021; Reid and Wilson, 2020; Rydval et al., 2014).
This study aims to develop a strategy for enhancing tree-ring based summer temperature reconstructions in the underrepresented region of the southern Yukon, Canada. To assess whether the DP is a significant issue, a white spruce (Picea glauca) network of new and updated sites spanning a large elevational and latitudinal range will be analysed. The data will be used to establish a simple strategic plan to minimise the impacts of temporally unstable climate-growth relationships and develop a LWBI summer temperature reconstruction for the region. This research builds on initial work by Youngblut and Luckman (2008), who created a RW-based maximum temperature (Tmax) reconstruction that explained 47% of the instrumental variance using seven high elevation sites. Wilson et al. (2019) later updated and improved the fidelity of this reconstruction using LWBI, increasing the explained variance to 51%. They also noted that the highest elevation chronologies had a stronger response to temperature, fitting with the theory that sites closer to elevational or latitudinal treeline are more temperature limited (St George, 2014). However, Wilson et al. (2019) were not able to robustly quantify if site elevation was indeed the primary factor modulating response to temperature, as site ecological factors could also be important. To further explore this concept, a substantially expanded white spruce network is developed and analysed, considering site distance from local upper treeline rather than absolute elevation. This approach accounts for the latitudinal shift in treeline across this region; for example, northern sites in this study have a maximum upper treeline of 1160 m.a.s.l, while the southernmost sites reach a maximum of 1460 m.a.s.l.
Methods
Study area and network development
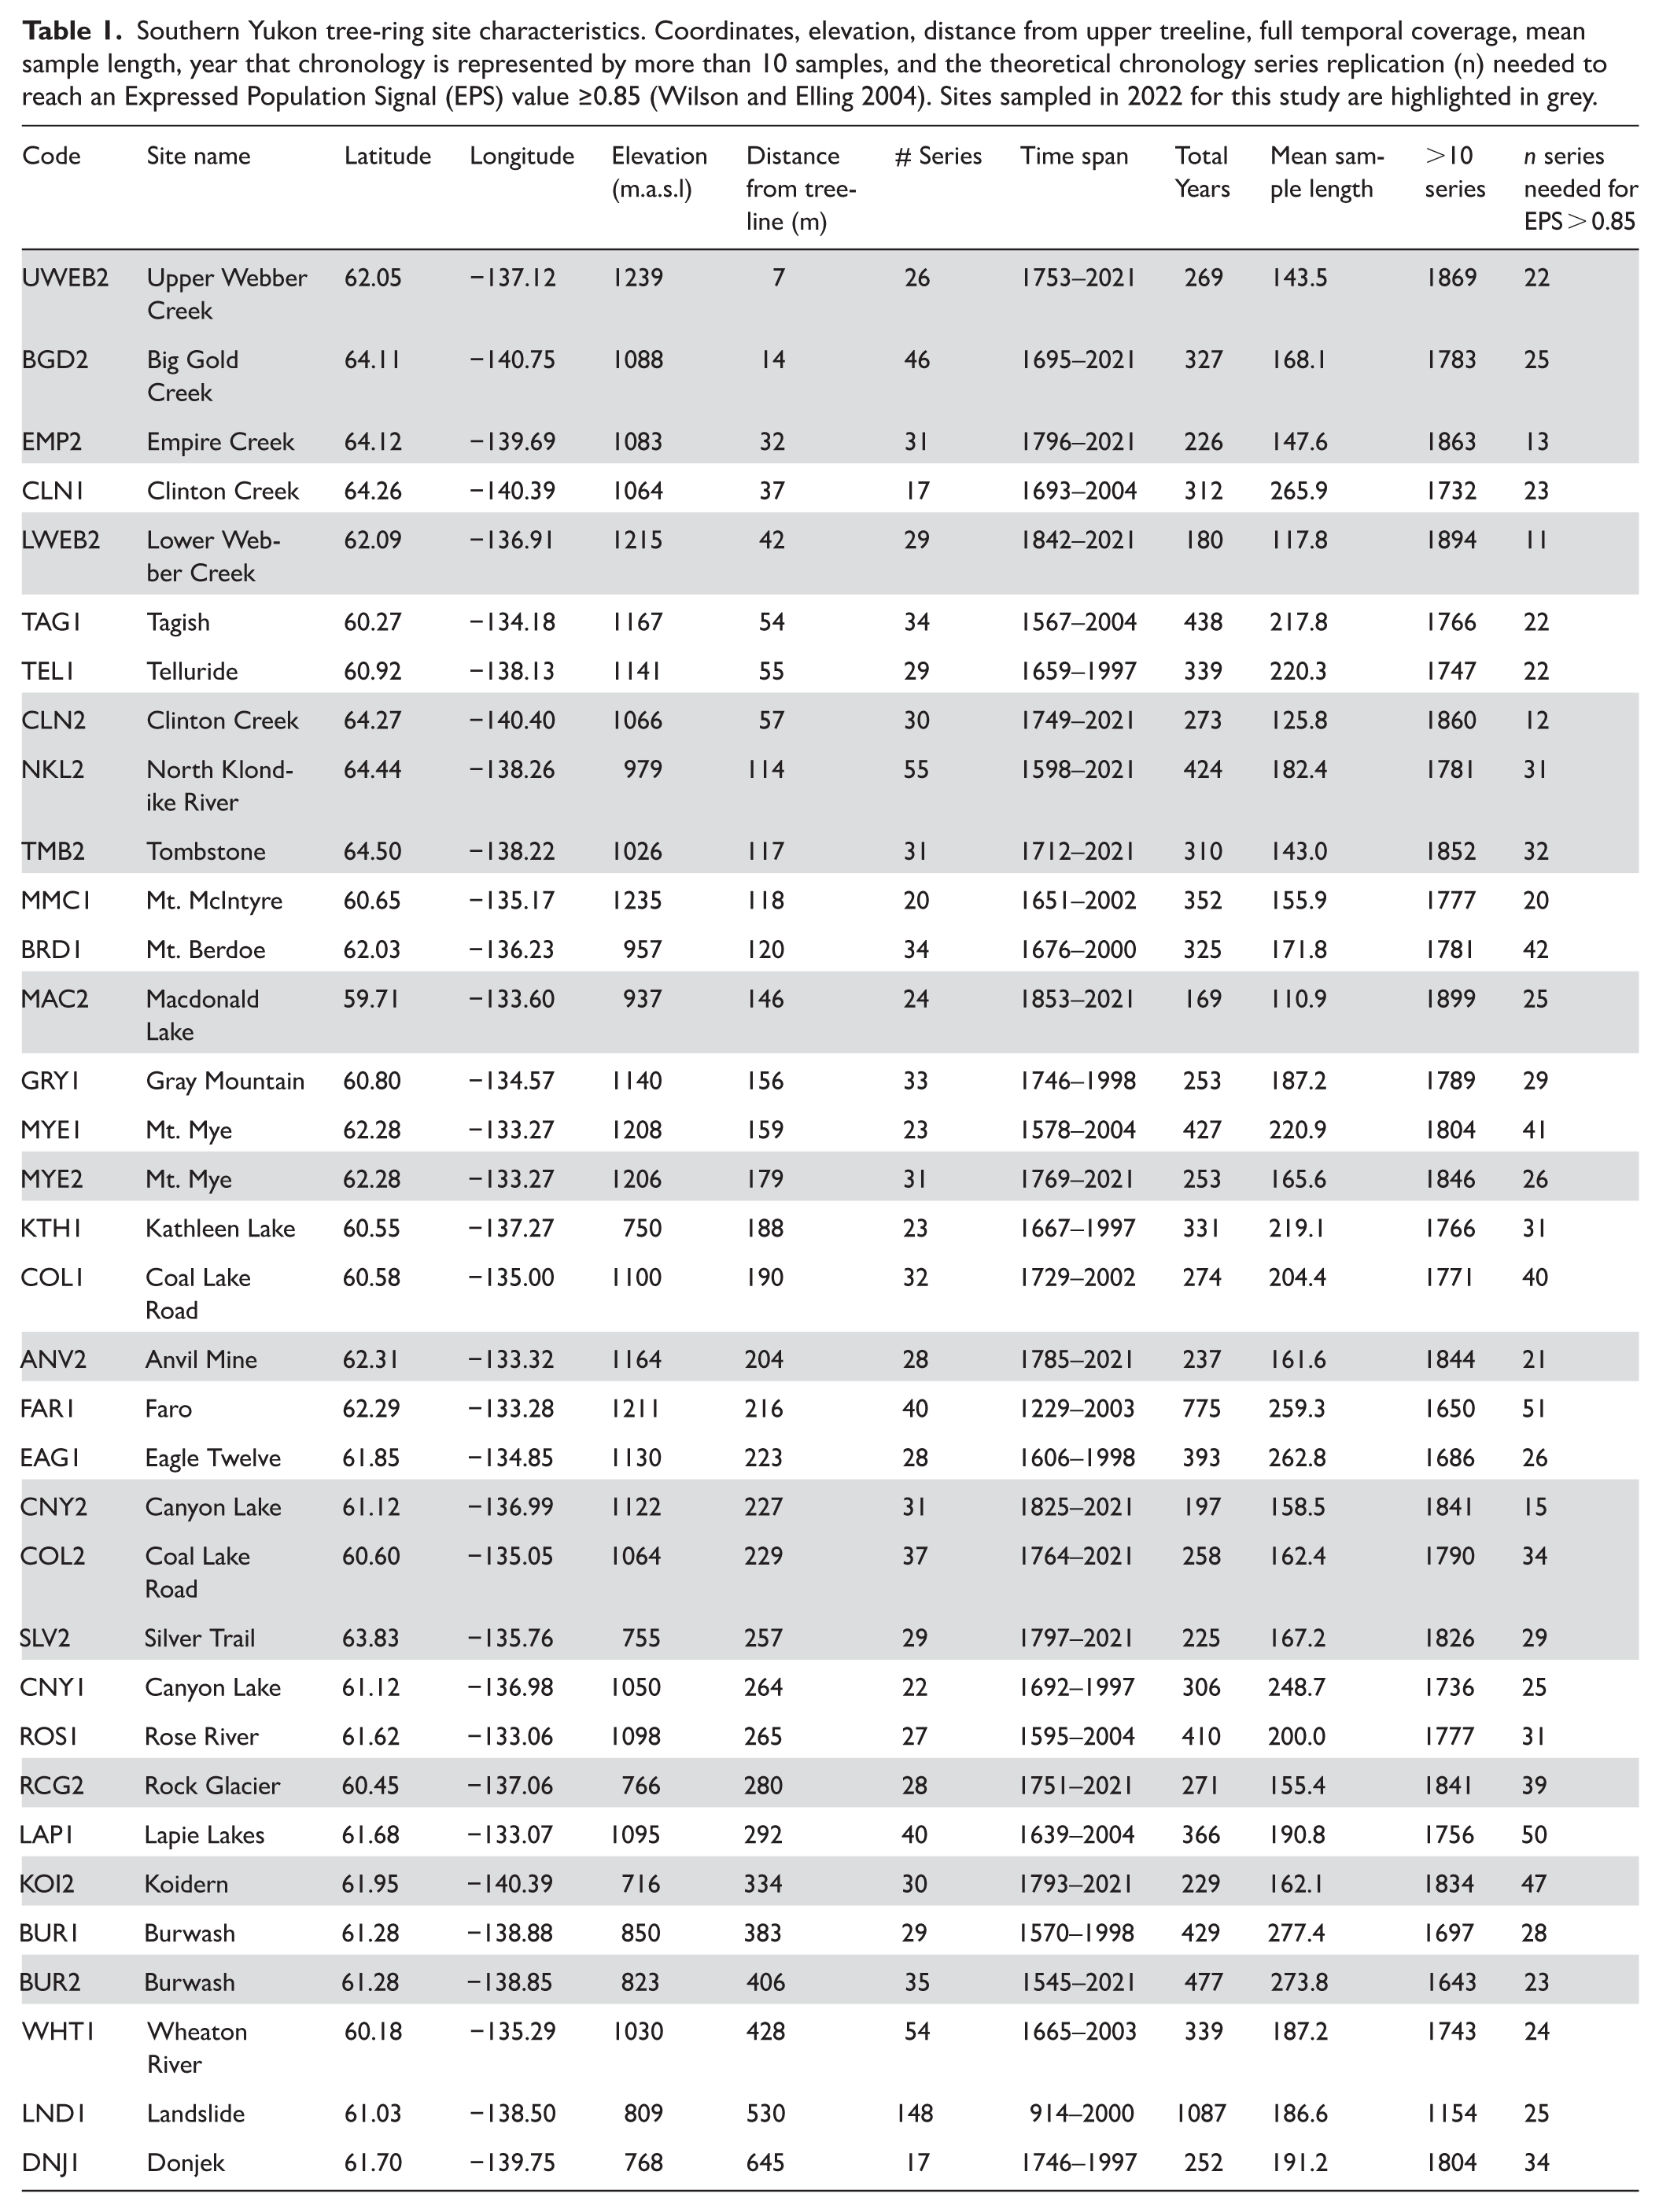
Tree ring data were obtained from 34 white spruce sites distributed over a range of elevations and varying distances from upper treeline over a 200,000 km² area spanning both the central and southern Yukon (Figure 1). Data were collected over several field campaigns with the most recent fieldwork (2022) contributing 16 new sites to the project (Table 1). The original aim was to revisit some sites sampled in the early 2000s, however, finding these sites was often difficult and it was determined that due to dissimilarities between the existing and updated site data, most sites were defined as separate. This is reflected in the site codes, for example, CNY1 is the original data and CNY2 is the 2022 update (Figure 1; Table 1). The newly sampled 5 mm tree cores were dried, sanded to 1000 grit to create a clean level polished surface and scanned at 3200 dpi using an Epson V850 pro scanner with Silverfast software. The images were used to measure and develop raw RW and LWBI data using the CooRecorder software (Cybis 2024 – version 8.1). The visual crossdating of the series was validated using Cdendro and COFECHA (Holmes et al., 1986) which utilise cross-correlation analysis to ensure that all the series are synchronised correctly in time. Raw RW and LWBI chronologies both contain non-climatic age-related growth trends which must be removed to isolate the climate signal for further analysis (Melvin and Briffa, 2008). In line with recent studies (Heeter et al., 2023; Wilson et al., 2019; Kunz in subm.), an age-dependent spline (ADS), with positive trend retention and signal free (SF), was used as the detrending option (Helama et al., 2017; Melvin and Briffa, 2008; Sullivan et al., 2016) as this allows a robust capture of mid- and high-frequency variance (Wilson et al., 2019). To determine site distance from upper treeline, the local treeline elevation was estimated in Google Earth by averaging three elevation points at the treeline limit on the same aspect as the sampled site. The absolute elevation of each sampled site – obtained via GPS for new sites and from values detailed in previous work for older sites (Morimoto, 2015) – was then subtracted from this local treeline mean to obtain the vertical distance from treeline.
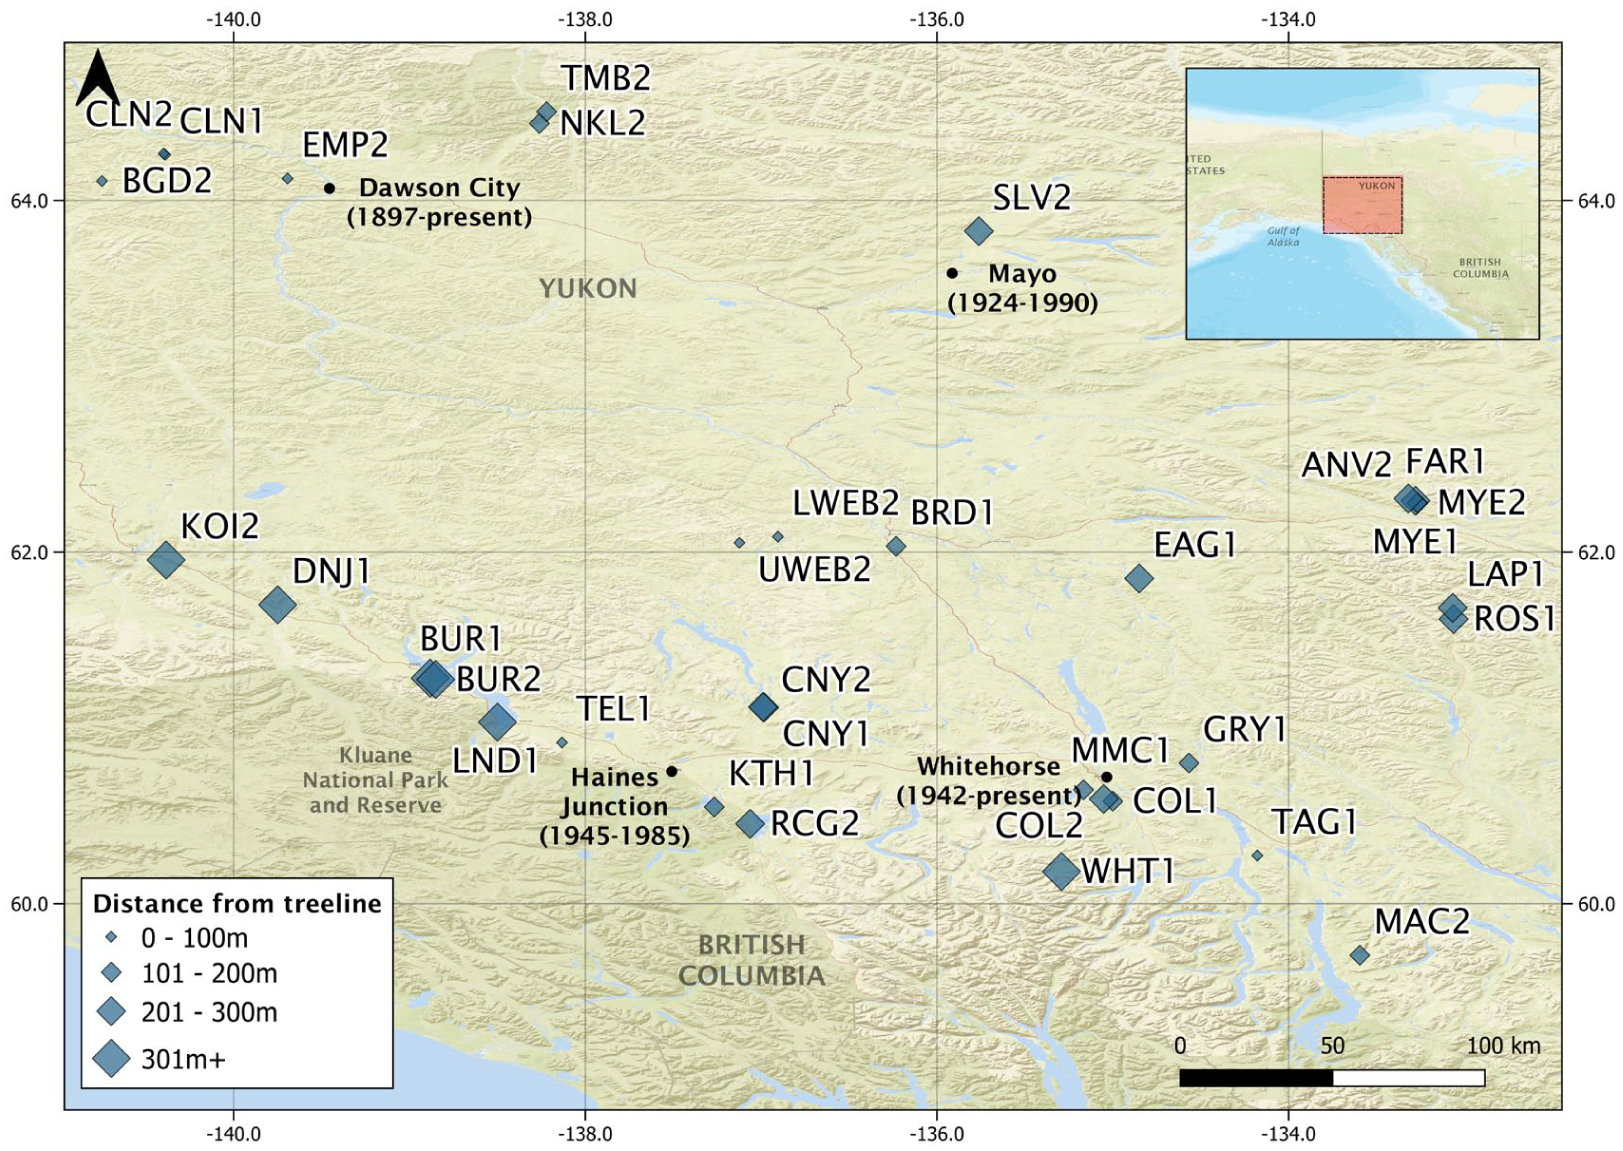
Map showing the 34 tree-ring sites used in this study (Table 1). Size of the blue diamonds represents site distance from local upper tree line. Black points represent the primary climate stations in the study area. The red box in the inset represents the study region and the CRU TS 4.07 (Harris et al., 2023) temperature regional grid used for dendroclimatic analyses.
Southern Yukon tree-ring site characteristics. Coordinates, elevation, distance from upper treeline, full temporal coverage, mean sample length, year that chronology is represented by more than 10 samples, and the theoretical chronology series replication (n) needed to reach an Expressed Population Signal (EPS) value ≥0.85 (Wilson and Elling 2004). Sites sampled in 2022 for this study are highlighted in grey.
Spatial signal assessment
Principal Component Analysis (PCA) was performed separately for RW and LWBI over the common well-replicated period (1853–1997) to assess the covariance and spatial patterns among the 34 sites in the network. PCA is useful for determining (1) whether the chronology network can be considered for use in one large regional reconstruction or two localised northern and southern reconstructions and (2) how the signal changes with site distance from local upper treeline. The chronology loadings upon the dominant principal component (PC1) were examined to assess spatial and elevational trends. It is hypothesised that PC1 represents the dominant climate signal related to temperature limitation and that sites with stronger PC1 loadings will be those closest to upper treeline.
Temperature-growth relationship
Correlations between site chronologies and climate were calculated using gridded CRU TS 4.07 (Harris et al., 2023) maximum temperatures (Tmax) over the broad regional area from 59–64.5°N and 141–133°W, which encompasses the tree-ring network. In previous studies, CRU TS had almost exclusively been used in this region (Heeter et al., 2021a; Leland et al., 2023; Wilson et al., 2017, 2019), although other gridded products are available as well as individual station data. Note that climate station coverage in the study region is very sparse: prior to 1945 (the first year of the Haines Junction record), the only other instrumental temperature records available are from Whitehorse back to 1942, Mayo to 1924 and Dawson City to 1897 (Figure 1). Therefore, using the CRU TS gridded data, analyses spanning 1901–1944 need to be interpreted with the caveat that these data are derived from mainly two stations in the northern part of the study region, which might impact the quality of the gridded data for this period and relevance for the assessment of the southern tree-ring sites.
Individual site chronologies were correlated with monthly gridded climate data to identify the dominant season of climate response. Correlations of each chronology with the overall dominant season were plotted against the site’s distance from upper treeline to examine whether there is a temperature response change with relative elevation. Subgroups of chronologies were selected based on these results to create relative elevational band composites. The temporal stability of these group chronologies was explored over early (1901–1944) and late (1945–2021) periods, as well as using running 31-year Pearson correlations with the dominant seasonal parameter.
Regional reconstruction strategy
Using PCA and climate-correlation analysis results, elevational sub-group chronologies were developed to assess their potential as proxies of past climate. Each elevational composite chronology was calibrated over the full instrumental period (1901–2021) as well as split 1901–1944 and 1945–2021 (calibration and verification) periods. The latter were selected to strategically assess the robustness of any results covering the period before 1945, represented by fewer climate stations. This follows the approach in Wilson et al. (2019) who used some of the same sites as this study. The reduction of error (RE) and coefficient of efficiency (CE) statistics (Cook et al., 1994) were used to assess the reconstructed value estimates over the verification periods while the residuals were assessed for first order autocorrelation using the Durbin-Watson (DW) test and linear trends via simple regression.
As the main aim of this study is to design an approach to refine temperature reconstructions, various methods for combining chronologies for the reconstruction model were also considered. In addition to the relative elevational composite average chronologies, PCA was used to derive the PC1 score of the chronology subgroup representing the strongest climate-growth relationship and also the PC1 score using all 34 sites in this study. These variants were also tested using the same calibration/validation and residual analysis approach.
Results and discussion
Spatial signal homogeneity
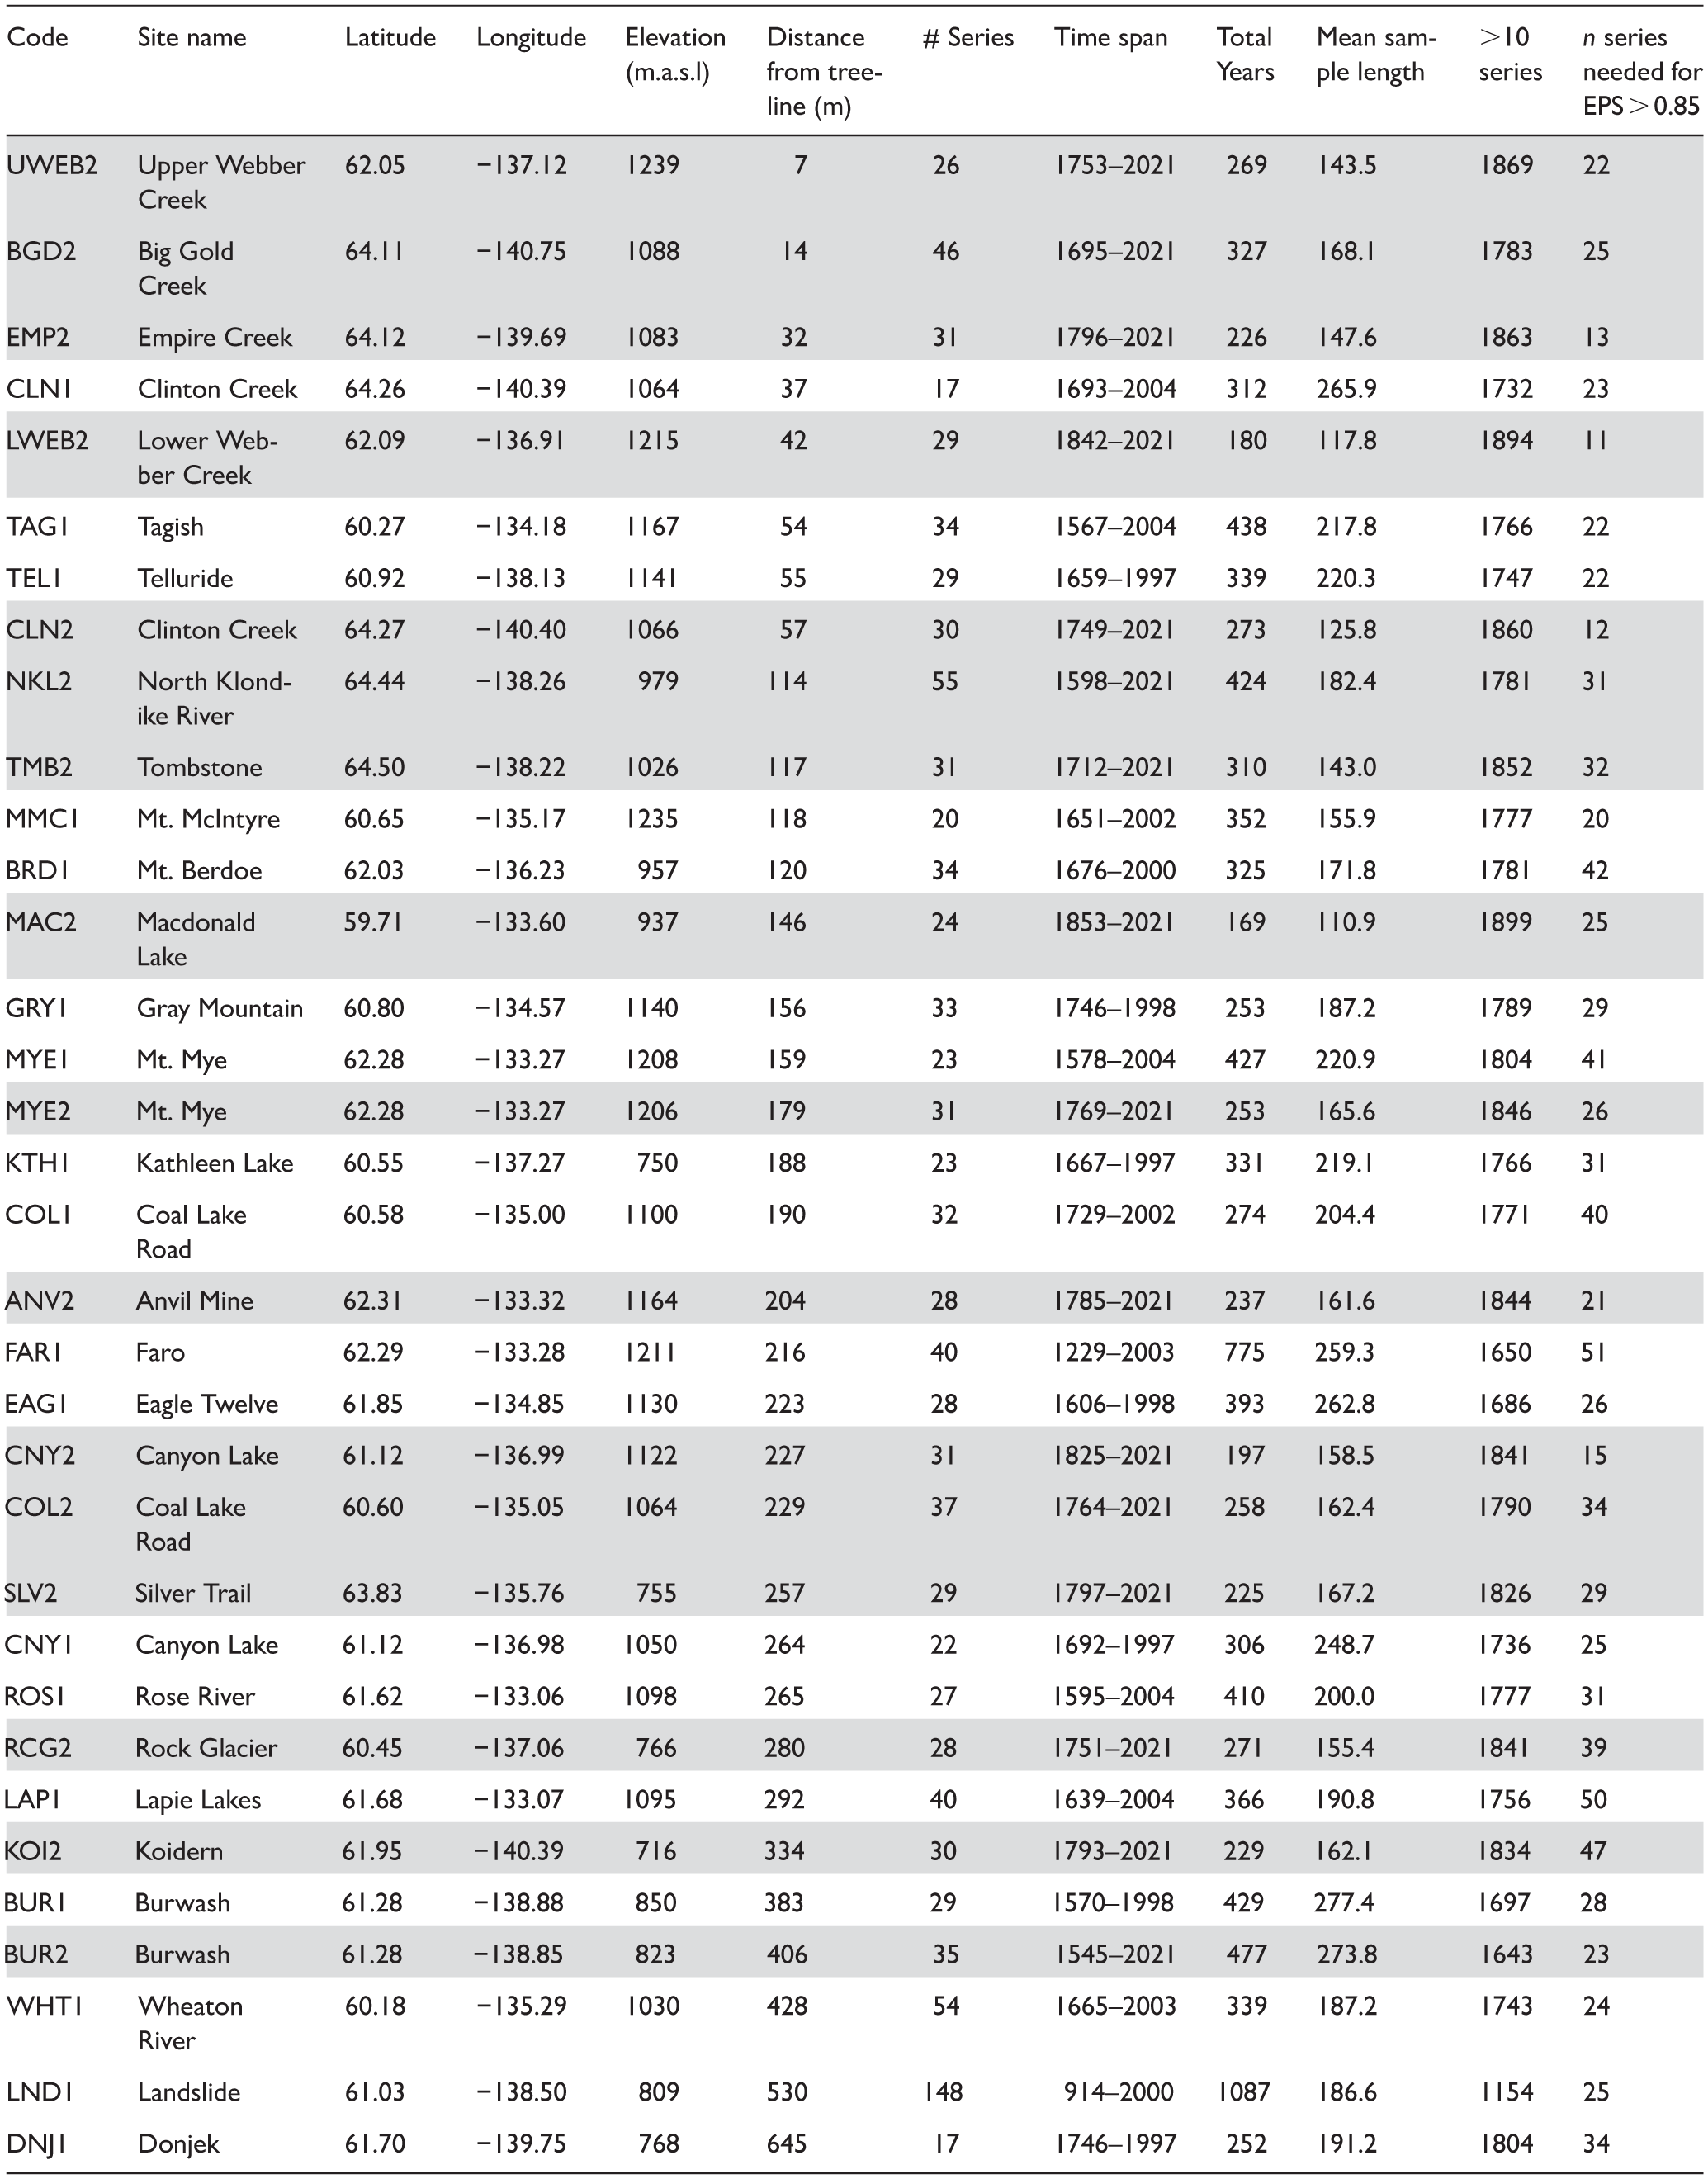
The sites in this study are spread over a 200,000 km² area with a large distance of ca. 500 kms separating distinct ‘northern’ and ‘southern’ clusters (Figure 1). To ascertain the spatial homogeneity of a common signal between the sites a PCA was performed separately using the RW and LWBI chronologies over the common period 1853–1997. The distribution of loadings on the primary PC1 is generally similar for both RW and LWBI (Figure 2a). The majority of the sites load strongly on PC1 which explains 48.2% of the common variance for both RW and LWBI. PC2 represents a more complex factor, accounting for 10.5% and 7.6%, respectively, with low elevation sites predominantly loading negatively for RW and positively for LWBI. The strong common signal of PC1 suggests that most sites in the network are influenced by a common factor. There is a negative relationship, stronger in LWBI than RW, between PC1 loadings and distance from upper treeline, indicating that the signal is more coherent among sites closest to the upper treeline (Figure 2b). Importantly, sites that have the weakest loading on PC1 tend to be those which are located furthest from upper treeline, suggesting they are influenced by different environmental factors. PC1 is hypothesised to represent the dominant climate influence on growth and is likely related to temperature limitation at or close to upper treeline. Since there is no clear geographical spatial loading bias of the PC1 loadings for either RW or LWBI (Figure 2c), the entire network will be explored as a single group for all subsequent analysis, rather than being divided into northern and southern regional groupings.
Principal component analysis (PCA) of each site chronology using ADS signal free chronologies over the common period (1853–1997). RW results in red on the left of each panel, LWBI results in blue on the right of each panel. (a) PC1 versus PC2 loading scatter plots, size of point represents distance from upper treeline. (b) PC1 loading versus Distance from upper treeline. (c) Map of site PC1 loadings expressed as point cross size and colour gradation.
Temperature response and temporal stability
The dominant seasonal response for each parameter was determined by correlating the RW and LWBI site chronologies with CRU TS 4.07 Tmax using the common 1901–1997 period (Supplemental Figures S1 and S2, available online). Correlation results with CRU TS precipitation are shown in the Supplemental Figures S3 and S4, available online, where noted significant negative correlations effectively represent the strong inverse association between summer temperature and precipitation (JJAr = −0.52). As the majority of sites are likely temperature limited due to their proximity to upper treeline, the physiological response to climate in this region should be most direct with temperature. Thus, from this point forward, the analysis will focus solely on temperature results.
RW chronologies express the strongest relationship with June–July (JJ) Tmax while LWBI correlates most strongly with June–August Tmax. However, the LWBI chronologies display a gradually weakening response to JJA temperatures with increasing distance from upper treeline that is not seen in RW. To explore the temporal stability of the chronologies going down the elevational gradient from upper treeline, the dominant season Tmax response was examined over a split period (Figure 3). RW shows no significant relationship between JJ Tmax correlations and distance from upper treeline in the early (1901–1944) or late (1945–1997) periods, although a non-statistically significant decrease in correlation away from upper treeline is noted in the latter period (p < 0.05; Figure 3). However, for the LWBI chronologies there is a strongly significant negative relationship between JJA Tmax correlations and distance from upper treeline for both periods (early (r = −0.63, p < 0.05); late (r = −0.64, p < 0.05)). This negative relationship is driven by the low correlations with temperature at the lower relative elevation sites. In the late period, these correlations weaken further, especially at sites furthest from upper treeline. Sites closest to upper treeline are much less impacted over time, suggesting that potential temporal instability of the climate signal exists mainly in the lower elevation sites.
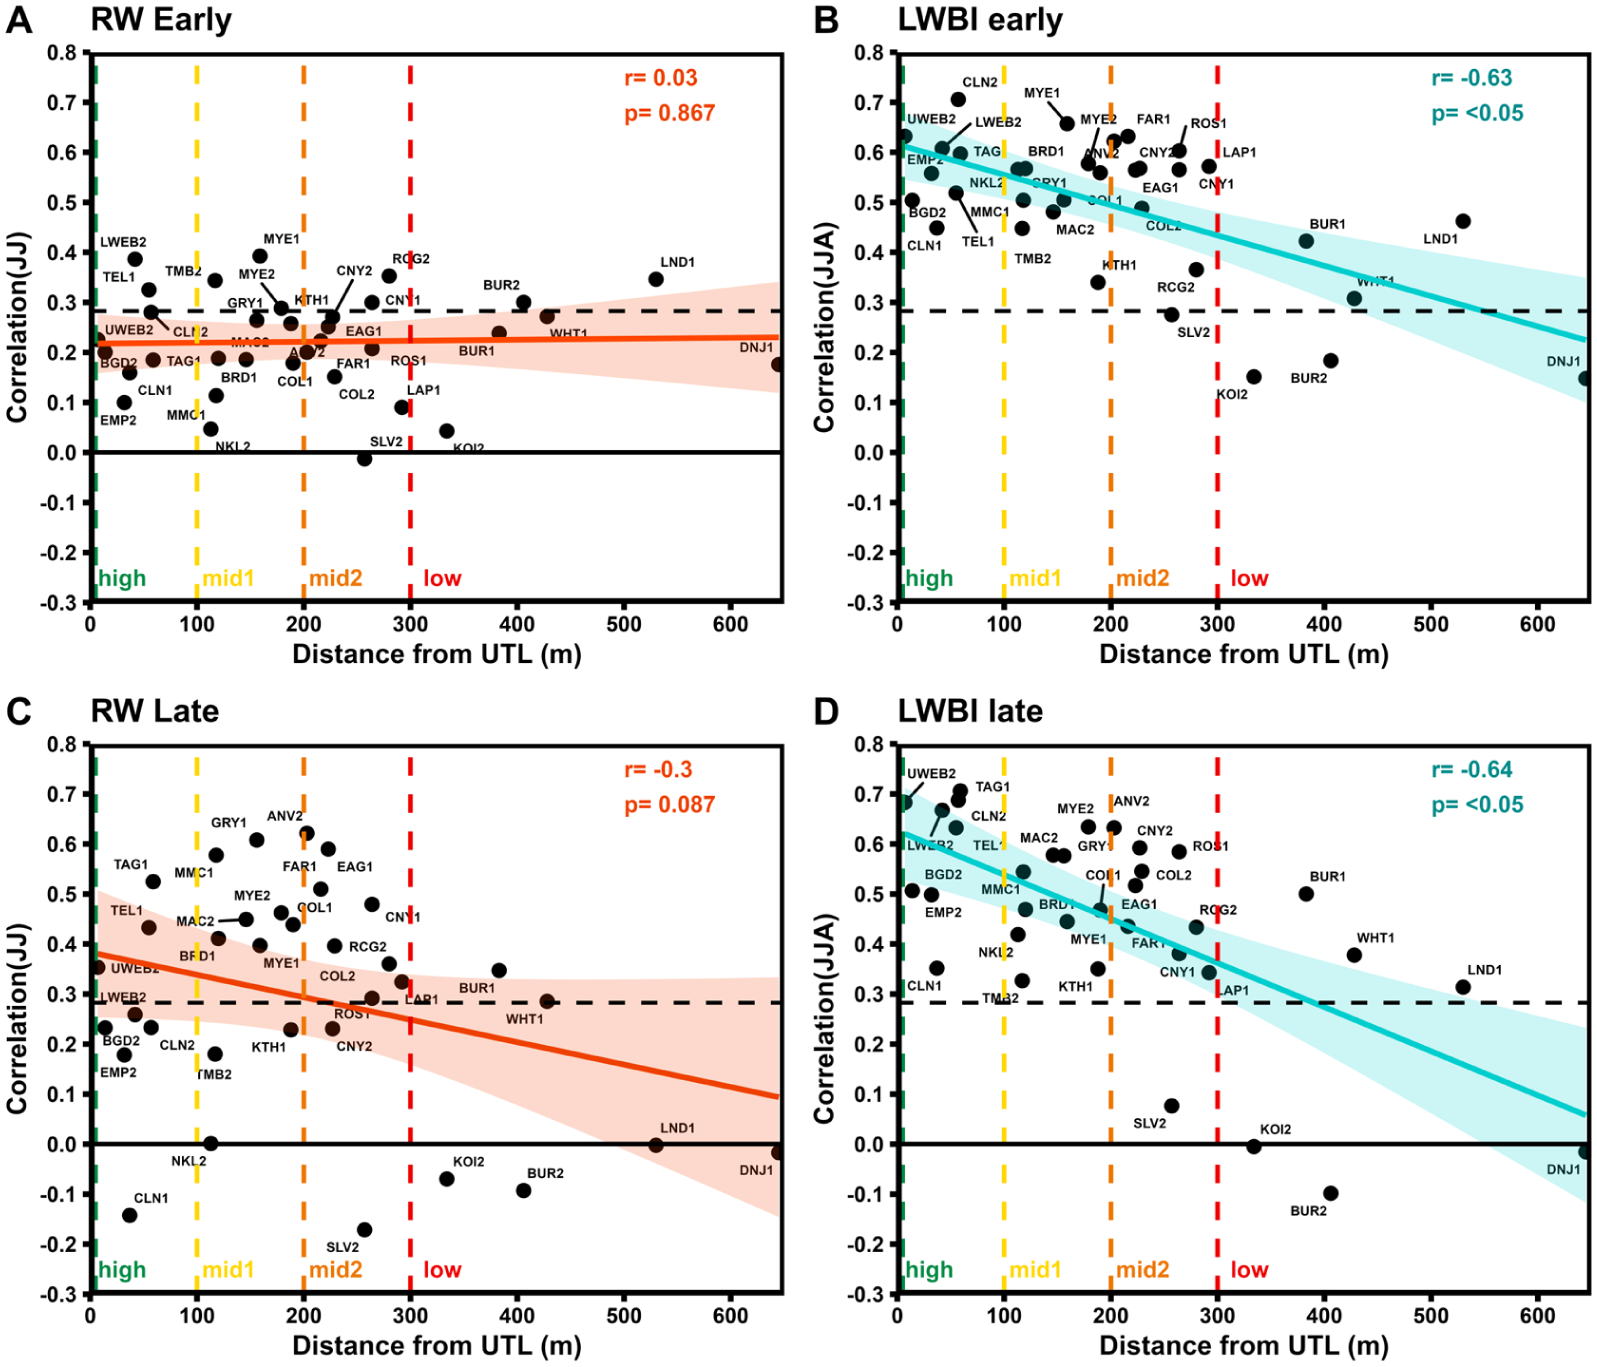
Split period correlations between dominant season and distance from upper treeline using CRU TS 4.07 maximum temperature. (a) Early (1901–1944) June–July (JJ) RW correlations versus distance from UTL. (b) Early (1901–1944) June-July-August (JJA) LWBI correlations versus distance from UTL. (c and d) as (a and b) but for the late period (1945–1997). Linear functions denote the relationship between correlation and increasing distance from upper treeline. Coloured vertical lines denote boundaries for splitting chronologies into elevational subgroups.
Regional subgroups were defined based on their relative elevations to upper treeline, as follows: High includes sites within 100 m of treeline, Mid1 101–200 m from treeline, Mid2 201–300 m from treeline and Low >301m from elevational treeline (Figure 3). Using these four relative elevational groupings, the temporal temperature-growth relationship was explored using 31-year running Pearson’s correlations. The regional RW chronology temperature correlations are generally much weaker and temporally variable than LWBI (Figure 4). For the upper three elevational bands, there is an increasing RW response through the 20th century from ~0.2 (non-significant) to ~0.5–0.6. Interestingly, while the Mid elevation RW groups maintain this strong correlation into the recent period, the High elevation RW group demonstrates a weakening response since the 1960s. The Low group expresses a substantially different response through time, with marginally significant correlations (~0.4) at the beginning of the 20th century, but then non-significant for the rest of the period.
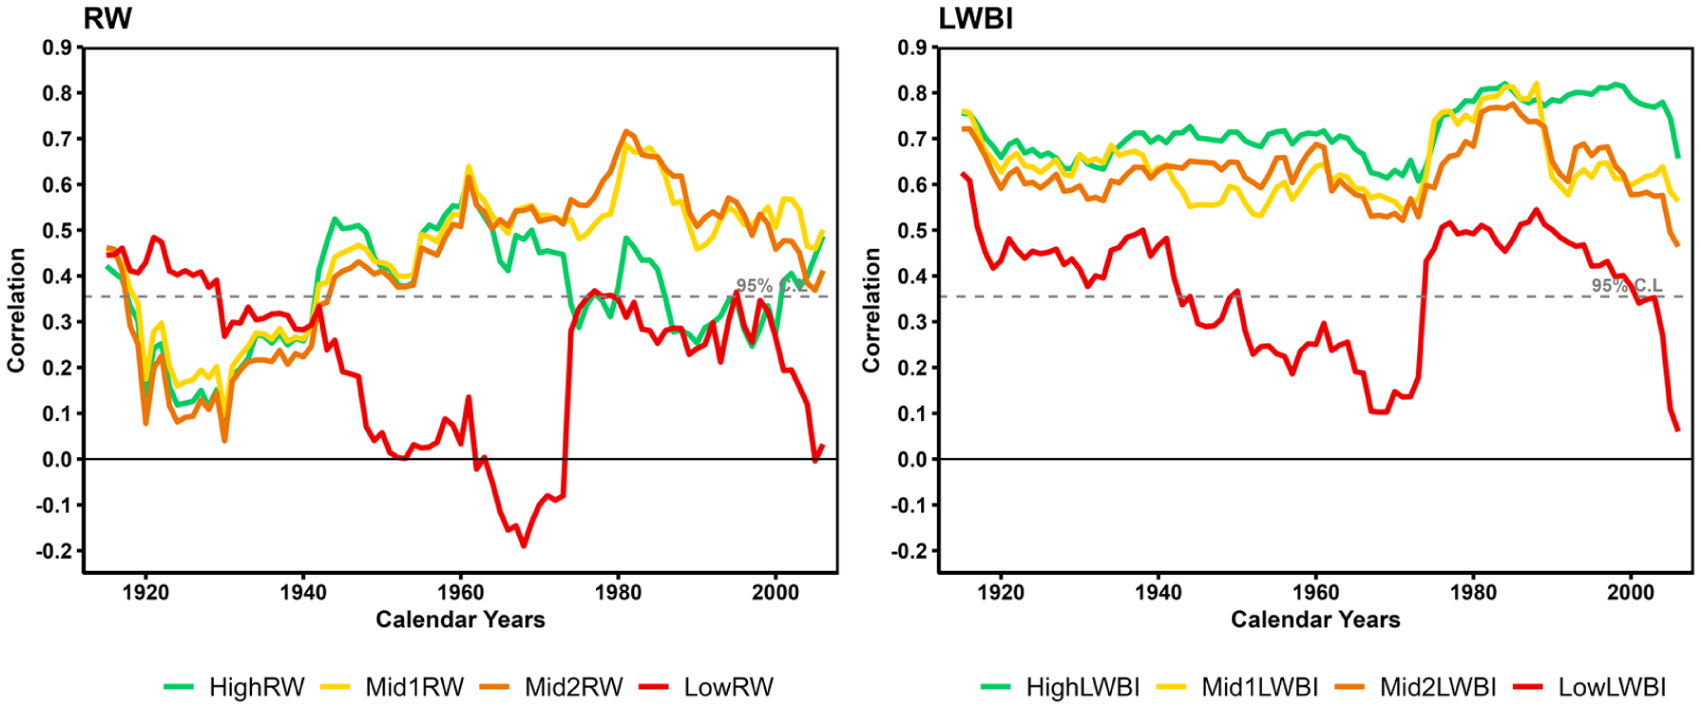
Running 31-year Pearson correlations between sub-group regional chronologies and dominant season Tmax (JJA/JJ for LWBI/RW). Dashed grey line denotes 95% confidence level.
The temporal instability in RW, at all relative elevations, signifies that this parameter is a poor candidate for producing a robust temporally stable temperature reconstruction in this region, even as a secondary variable in a multiple regression. Therefore, for the rest of this paper LWBI will be the only tree-ring parameter discussed. The High LWBI group expresses the strongest relationship with JJA Tmax through time, although an increase in correlation from ~0.65 to 0.8 is noted around 1975. Both Mid1 and Mid2 show comparable trends to the High group until ~1985 when a weakening in coherence is noted thereafter. The Low group has a predictably weaker relationship with summer temperatures, with periods of insignificance around the 1960s and recent decades. As the focus of this paper is to derive an optimal strategy for deriving a robust temperature reconstruction, this group will not be used for further analyses, but it can be concluded there is little evidence of temperature limitation in these lower elevation sites. Compared to the High group, the declining correlations in the mid-elevation groups suggest a fading temperature limitation in the recent period. This pattern aligns with the classic divergence-like decline defined in D’Arrigo et al. (2008). The High LWBI chronology demonstrates a much stronger and more temporally stable relationship with maximum temperatures indicating that targeting near tree-line sites is the optimal strategy for developing a robust temperature reconstruction and minimising the DP that has been noted in this region. This of course has implications in a warming world where the treeline will theoretically move upslope or to higher latitudes.
Despite the High elevation LWBI group providing the strongest and most temporally stable relationship with summer temperatures, there is a clear similarity in coherence in the three upper elevational chronologies, before the breakdown of the Mid groups in the 1980s. Between-chronology running correlations reveal strong coherence (r > 0.9 in most replicated periods) between the High and Mid chronologies, which weakens slightly in the recent period (Supplemental Figure S7, available online: High versus Mid1 mean r = 0.84; High versus Mid2 mean r = 0.81). This covariance indicates that incorporating lower elevation sites to create a better replicated composite chronology in earlier periods could lead to an extended temperature reconstruction. However, this would come with the risk of degrading the signal in the recent warmer period where the relationship between the elevation bands breaks down. Ultimately, there is a trade-off between prioritising higher elevation, climatically optimal sites and including more accessible, lower elevation sites that are less optimal and may introduce a divergence-like decline, but would extend the reconstruction by improving tree/site replication.
Reconstruction model strategy
Each of the three upper elevation composite LWBI chronologies were tested for their ability to derive a temporally stable summer temperature reconstruction using simple linear regression. Unsurprisingly, the High chronology is the best candidate for a robust JJA Tmax reconstruction (Figure 5) explaining the most temperature variance. Early period calibration (1901–1944) has an r² value of 0.45 while the late period validation (1945–2021) expresses an r² value of 0.47, with an RE and CE of 0.45 and 0.43, respectively. Swapping the calibration and validation periods returns an RE and CE of 0.43 and 0.41. Full period calibration r² is 0.46 with no significant first order autocorrelation or linear trends observed in the model residuals. However, it should be noted that this model appears to slightly underrepresent extreme high temperature years in the recent period, especially in the recent period, suggesting that the warmest summer seasonal temperatures are not captured well. In contrast, cold extremes are better reflected, with the model capturing some, if not all, cooler years well. This follows the hypothesis that, in a warming world, trees will reach a biological upper temperature threshold which will lead to a loss or weakening in response and a decoupling of the climate-growth relationship as climate further warms (Büntgen et al., 2006; D’Arrigo et al., 2004; D’Arrigo et al., 2008; Wilmking et al., 2004). A scatterplot of actual versus predicted temperature anomalies captures this degree of non-linearity, with the weakening in the relationship occurring for the more extreme positive anomalies (Figure 5 – right). These observations would suggest that for the very hottest summers, these high elevation near tree-line sites may already be expressing a weakening in temperature limitation, perhaps indicating a form of divergence distinct from the traditional late 20th-century trend decline.
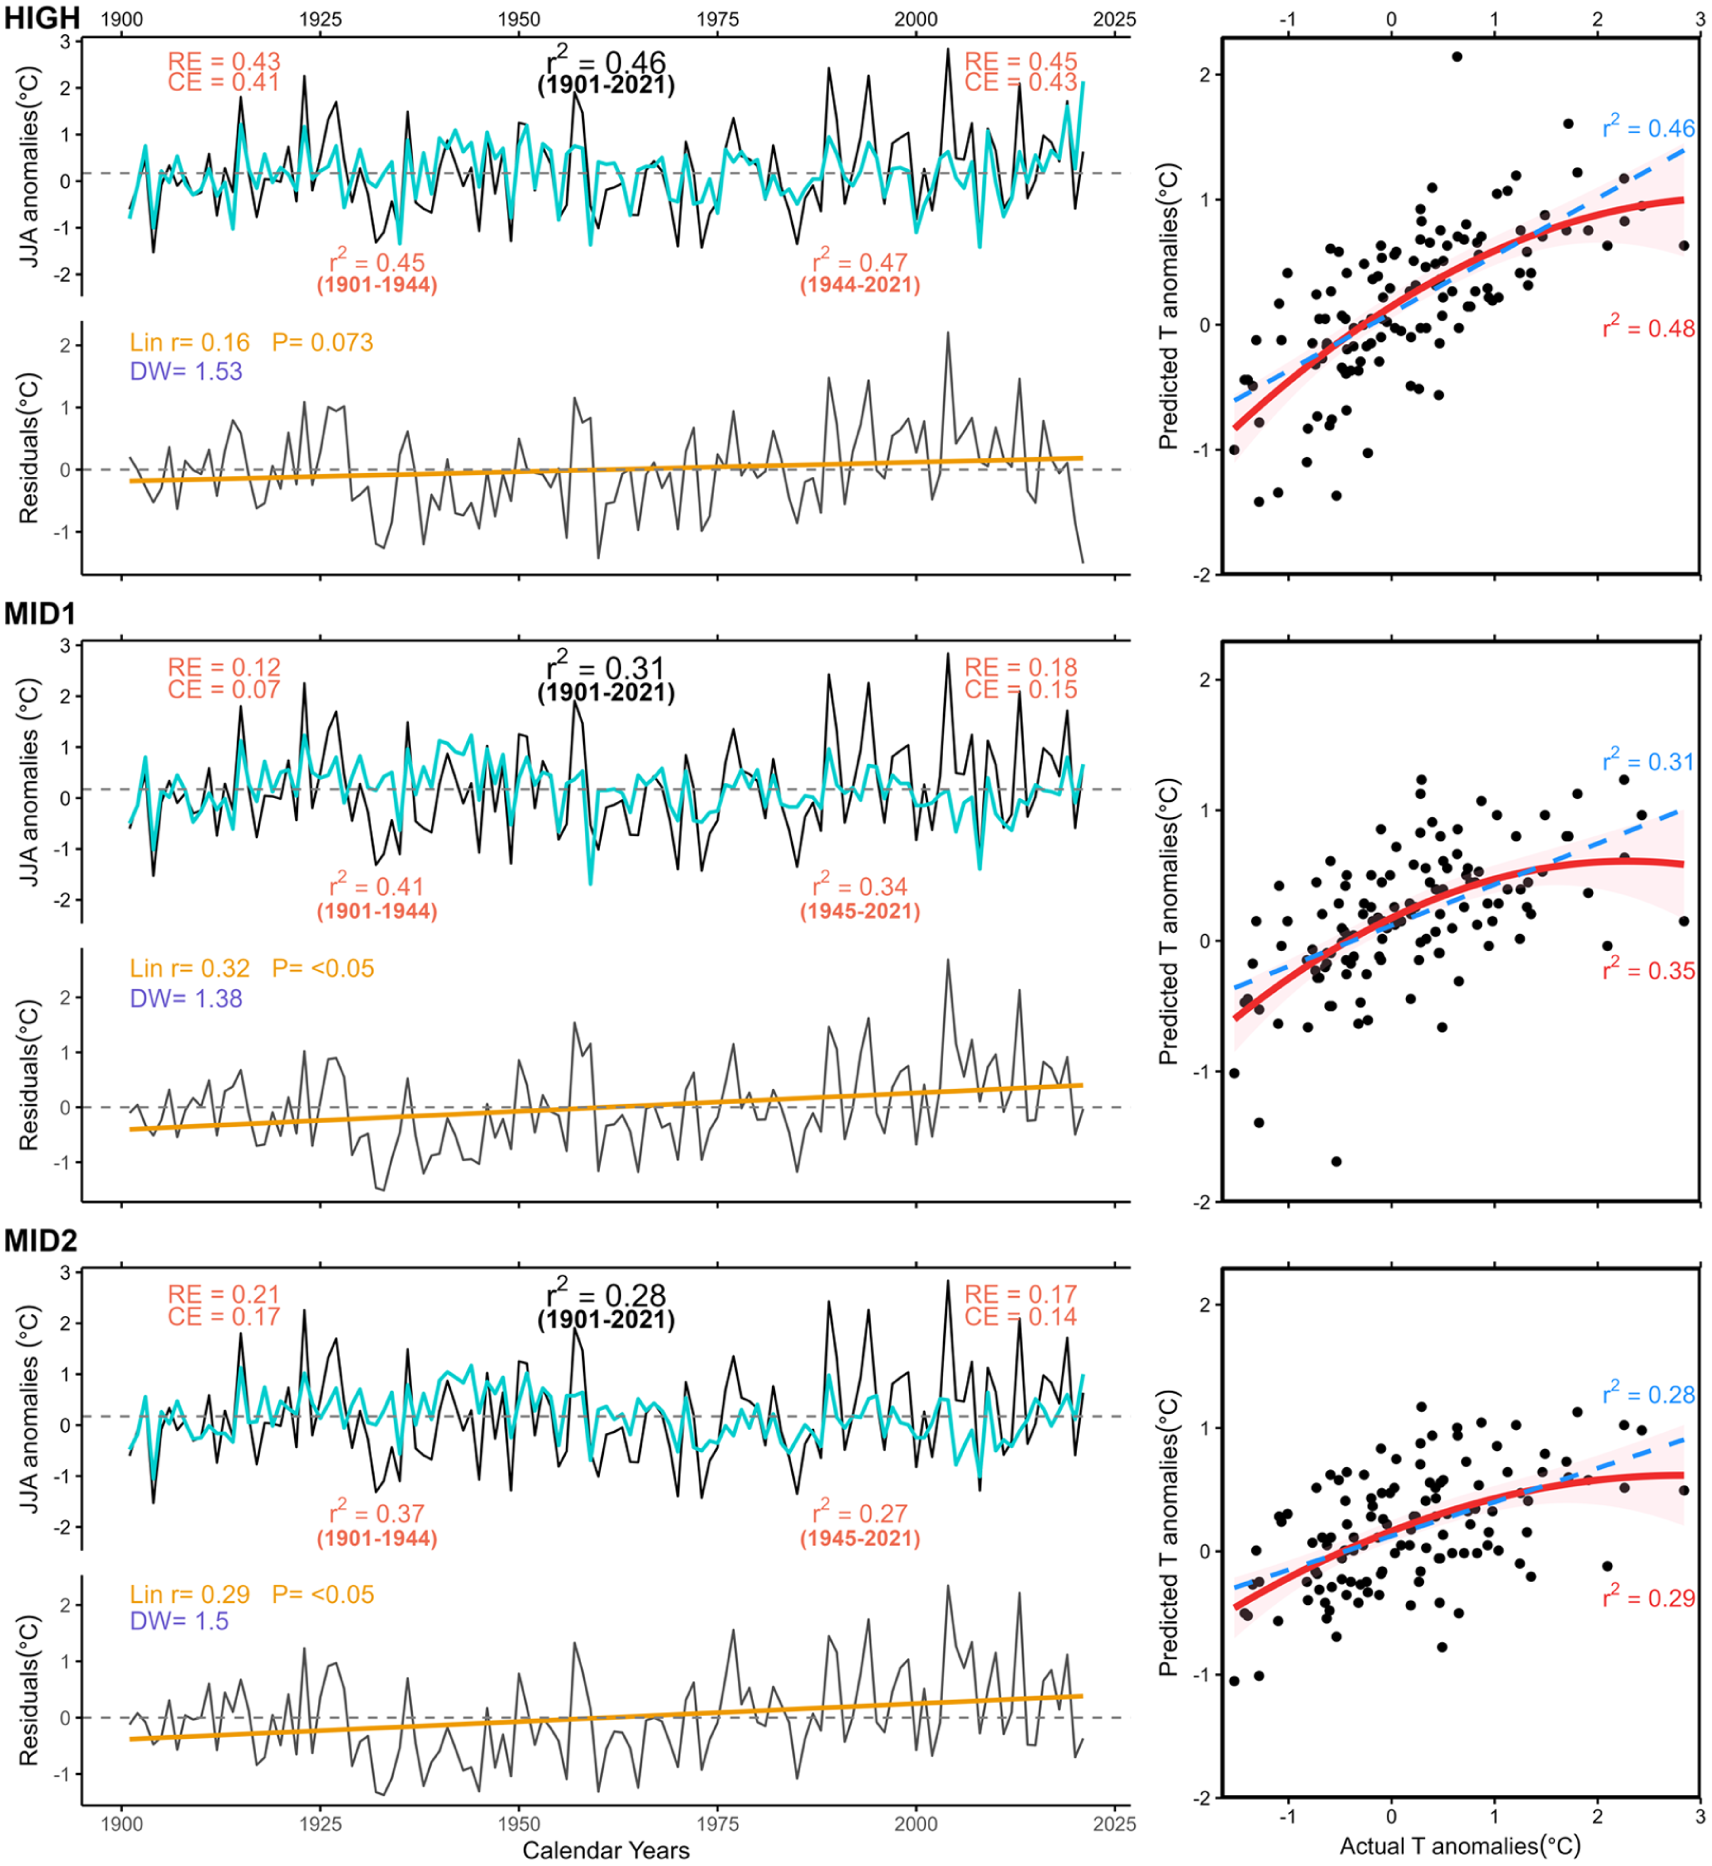
Full period reconstruction (1901–2021), residuals analyses, and scatterplot of the relationship between LWBI and temperature for each subgroup chronology using CRU TS 4.07 Tmax anomalies. Full period r2, calibration period r2 (1945–2021), validation period r2 (1901–1944) and validation RE and CE represented in the upper plot of the left panels. Black line is the instrumental temperature and turquoise the predicted temperature. Linear r2 of the residuals shown in yellow and Durbin Watson test for residual autocorrelation in purple. Scatter plots have both a quadratic function plotted with error in red and the linear function (as used for the full period calibration) in blue dashed line.
In agreement with the sliding correlations results (Figure 4), the Mid1 and Mid2 elevation band composites calibrate/validate more poorly than the High group. The stability of the Tmax reconstruction declines in Mid1, and even more so in Mid2. Late period validation expresses r² values of 0.34 and 0.27, a decrease from 0.41 and 0.37 respectively from the early period calibration. The weakening of the signal is also expressed in the full period (1901–2021) calibration with Mid1 explaining 31% of the temperature variance, while Mid2 drops to 28%. Both full period model residuals also express positive linear trends and significant autocorrelation, therefore, the justification of developing a reconstruction using sites from the elevational range below ca. 100 m below treeline should be carefully considered.
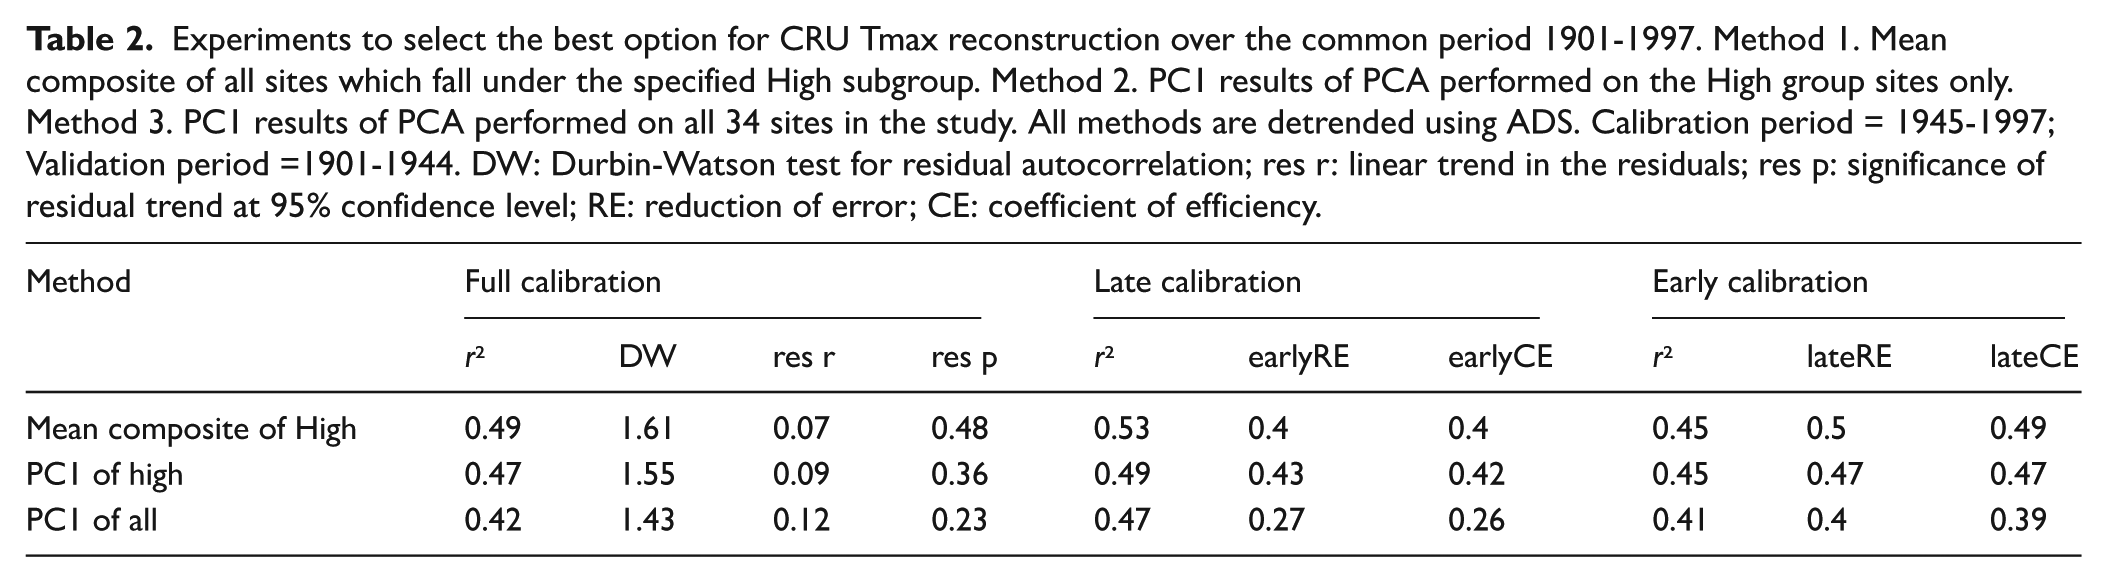
The above analyses have used arbitrary relative elevational thresholds to derive regional composites. There are of course many methodological approaches to deriving a climate reconstruction from such a network of data. Regional compositing, as used here, is an appealing approach as it helps maximise the regional composite replication back in time. PC regression, a staple method often used in dendroclimatology (Griesbauer and Green, 2012; Heeter et al., 2021b; Wilson and Luckman, 2003), is often more restrictive as individual chronologies need to be used for a period of appropriate replication and signal strength (Wigley et al., 1984). To test whether a PC regression approach would result in markedly different results, two alternative approaches to PC regression were explored. Firstly, the PC1 score time-series from a PCA analysis of only the High group LWBI chronologies was utilised, followed by the PC1 chronology from PCA analysis using all LWBI sites in the study. Due to the inclusion of the originally developed chronologies, the outer year for this analysis was restricted to 1997. Table 2 shows the calibration and validation results of this analysis over the common period shared by each method (1901–1997). This experiment reveals that overall, the High group mean composite chronology performs marginally better than the high elevation PC1 series (r² = 0.49 vs 0.47) with very similar RE and CE validation results. The PC1 using the full LWBI network also passes traditional tests for a robust reconstruction but is generally weaker than the other options (early calibration r² = 0.41, late validation r² = 0.47, RE/CE = 0.4/0.39; late calibration r² = 0.47, early validation r² = 0.41, RE/CE = 0.27/0.26). A comparison of the full-length reconstructions, limited to the common period used in the PCA (1853-1997), highlights the generally shared low frequency variability between the methods, particularly the PC regression variants (Supplemental Figure S8, available online). Therefore, given the mean composite chronology’s superior reconstruction fidelity and its ability to extend further back in time, this approach appears to be the most robust.
Experiments to select the best option for CRU Tmax reconstruction over the common period 1901-1997. Method 1. Mean composite of all sites which fall under the specified High subgroup. Method 2. PC1 results of PCA performed on the High group sites only. Method 3. PC1 results of PCA performed on all 34 sites in the study. All methods are detrended using ADS. Calibration period = 1945-1997; Validation period =1901-1944. DW: Durbin-Watson test for residual autocorrelation; res r: linear trend in the residuals; res p: significance of residual trend at 95% confidence level; RE: reduction of error; CE: coefficient of efficiency.
As was detailed earlier, within the study region, the pre-1945 period is represented by fewer instrumental stations (Figure 1). There is therefore an inevitable increased uncertainty in the instrumental data used that could impact the results. So far, the analysis in this study has utilised the gridded CRU-TS data but other gridded data products are available. The Berkeley Earth Surface Temperature (BEST – Rohde and Hausfather, 2020) data are a similar data product to CRU TS but are mapped onto a courser grid (1°) and often extends further back in time than CRU TS which begins in 1901. Correlation response to JJA Tmax for the individual sites against BEST show similar results for RW and LWBI to the CRU TS data including also the elevation weakening of the LWBI summer response with distance from treeline (Supplemental Figure S5, available online). However, for the running correlations, the coherence is stronger with BEST in the early 20th century compared to CRU TS (Figure 4 and Supplemental Figure S6, available online) although the results for the recent period are very similar. This might initially suggest that the BEST data could be the better instrumental target for dendroclimatic calibration/validation. However, when comparing CRU TS and BEST dendroclimatic results, the early period calibration is indeed much stronger (r² = 0.58 (High and Mid1) and 0.54 (Mid2)) using the BEST data (Supplemental Figure S9, available online) compared to CRU TS (Figure 5). However, there is a more marked relative weakening in the later period using the BEST data (Supplemental Figure S9, available online: r² = 0.43 (High); r² = 0.29 (Mid1); r² = 0.23 (Mid2).
Further, overall full period calibration is similar using both instrumental series, but the BEST data return significant linear trends and first order autocorrelation in the model residuals as the BEST data express a steeper overall warming trend than CRU TS (Supplemental Figure S10, available online). On balance therefore, by utilising the high elevation composite representing sites within 100 m of the upper treeline and choosing a regression model that (1) expresses the most stable calibrated signal between the two periods, (2) validates well and (3) expresses no significant autocorrelative or linear trends in the model residuals, the CRU TS data represent the most robust target for dendroclimatic reconstruction of past summer temperatures in the region. However, these results underscore the potential impact that instrumental data quality can have on dendroclimatic calibration.
Comparison of the High composite reconstruction with other published summer temperature reconstructions for NW North America highlights strong spatial correlation and similar decadal trends (Figure 6). This is particularly expressed in the similarities with the SYUK (r = 0.85; Wilson et al., 2019 – which shares some data) and WRA (r = 0.75; Davi et al., 2003 – which is independent) reconstructions. GOA (r = 0.34; Wilson et al., 2017) is more influenced by maritime weather systems (Supplemental Figure S11, available online). A key observation is the lack of long-term secular trend expressed by the Yukon High group composite reconstruction. Wilson et al. (2019) also noted this and suggested that there could be a possible frequency bias when using LWBI data. Yet, no significant residual linear trends are observed when calibrated against CRU TS (Figure 5). Additionally, Kunz et al. (in subm) compared MXD and LWBI for two of the sites from the Yukon network used herein (Canyon Lake and North Klondike) and demonstrate clearly that both parameters exhibit similar long-term trends. This suggests that no systematic bias exists from using LWBI and that the SW Yukon appears to not show as strongly the long-term trend of a cooler Little Ice Age to warmer recent period that is expressed in the other records in NWNA. Finally, the BC and ICE reconstructions represent a more southerly distinct region but express similar strong local correlations with summer temperatures. It is likely that compositing these regional records will provide a regionally relevant long temperature reconstruction for NW North America. As both the GOA (Wiles et al., 2014; Wilson et al., 2017) and Icefields data go back into the first millennium of the common era, this provides an exciting prospect for a substantial millennial length update for this region of NW North America.
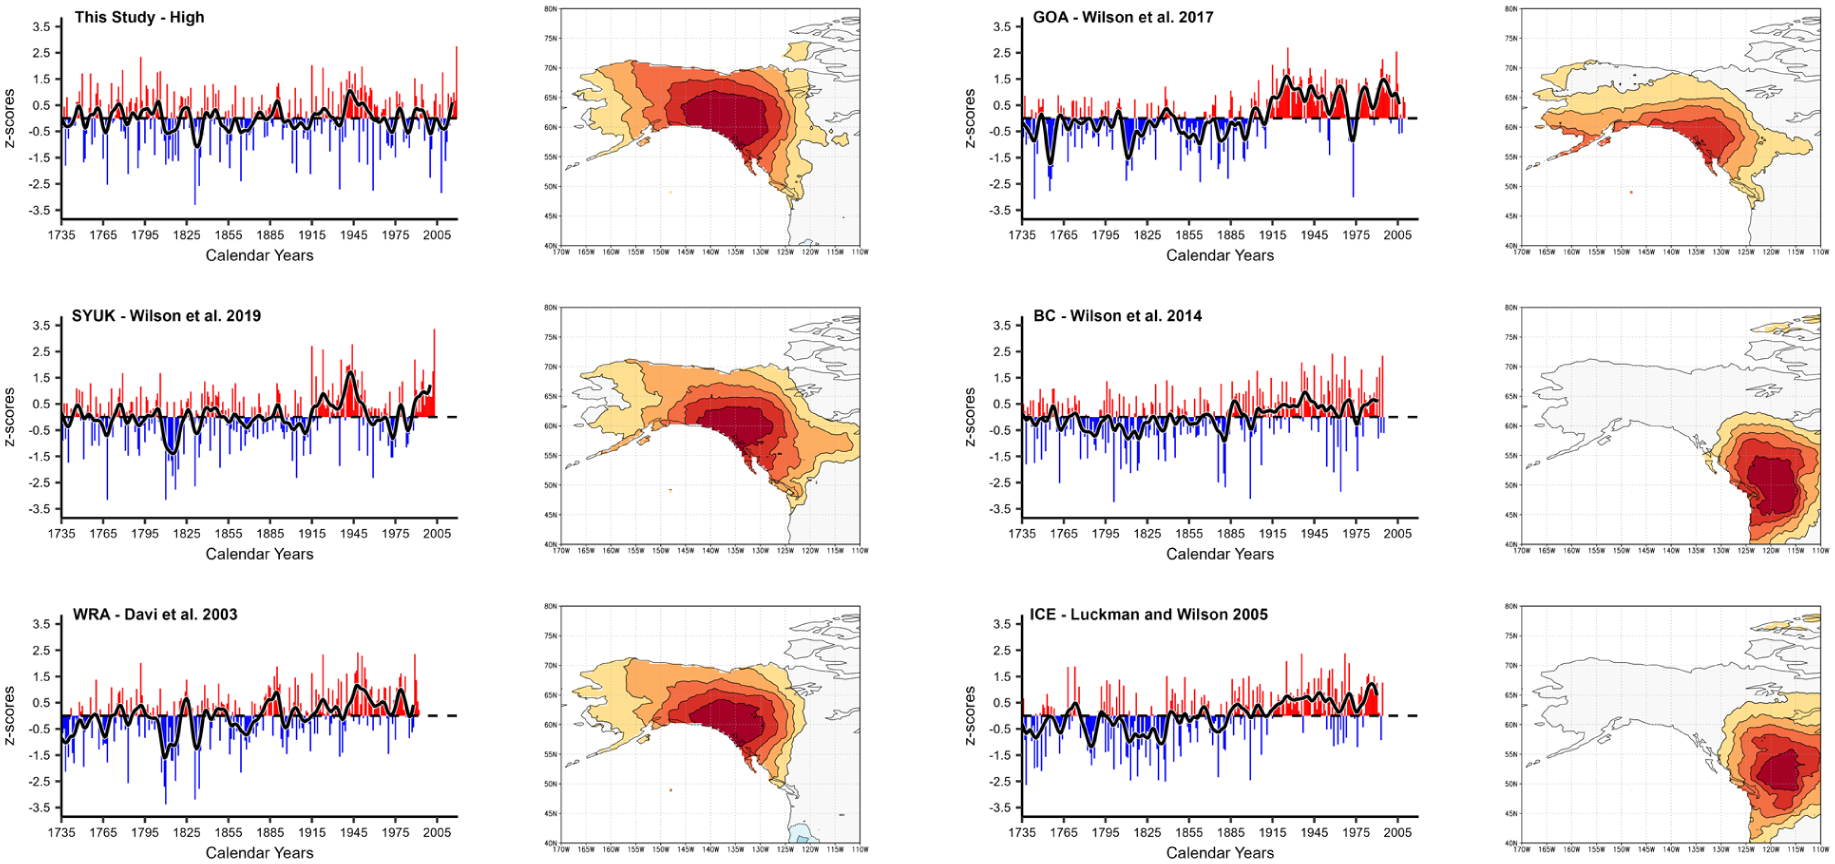
Unfiltered and Low pass filter (15-year Gaussian) comparison between the ‘High’ LWBI JJA reconstruction in this study and other regional reconstructions of various parameters in NW North America: Southern Yukon (SYUK) LWBI MJJA; Wrangells (WRA) MXD JJA; Gulf of Alaska (GOA) DBI JJAS; British Columbia (BC) RW/LWBI/MXD JJA; Icefields (ICE) RW/MXD JJA. All time-series were transformed to z-scores using the common period. Spatial plots represent the correlation of each unfiltered chronology with CRU TS maximum land temperatures over the 1901–1992 common period.
Conclusion
Using a network of 34 white spruce sites from the southern and central Yukon covering the full elevational range of the species between 59° and 65°N, and 141° and 133°W, we developed a strategy to optimise high resolution summer temperature reconstructions in the region. On average, the closer a sampled stand is located to the local upper treeline, the stronger and more stable the modelled calibrated signal is. The network was divided into four subgroups categorised by their relative elevation to local treelines to explore how this factor impacts the correlation between the chronologies and maximum summer temperature. Sites within 100 m of upper tree line (High subgroup) maintain the strongest and most time-stable response to maximum temperature in the LWBI data. RW expresses a temporally unstable relationship with summer temperatures and should not be considered for reconstructing past climate. The lower Mid1 and Mid2 LWBI chronologies both display a weakening response to temperature since the mid-1980s, demonstrating the typical representation of so-called ‘classical divergence’ (D’Arrigo et al., 2008). Experiments with different reconstruction methods indicate that the most consistent results were found by using a mean composite of all sites in the High subgroup and using CRU TS instrumental Tmax. Using the alternative BEST gridded data did not yield significant improvements, though correlations were stronger in the early period. However, the BEST data expressed an increasing linear trend that was not modelled well by the LWBI data. Thus, the suggested strategy for optimising temperature reconstructions in this region is to target sites which fall within 100 m of the near-treeline zone. However, even in this optimised group, the LWBI data underestimate the extreme hot summer years. This suggests that some upper threshold limit has been met, which may have implications as warming continues.
Restricting sites to this relatively narrow high elevation band will minimise the number of potential sites that could be included in dendroclimatic reconstructions for this region. It should be noted, however, that there is a sustained period of strong coherence between both the High/Mid1 and the High/Mid2 groups from ~1800s to 1970 (Supplemental Figure S7, available online), before coherence weakens in the recent period. Incorporating sites from these lower elevational zones could potentially help extend the temperature estimates further back in time, but there would be a risk of degrading the signal in the recent warm period, and underprediction of previous warm periods (i.e. the medieval period).
For any future study that aims to significantly extend the living datasets, preserved wood would need to be found, such as subfossil material from lakes (Esper et al., 2014; Rydval et al., 2017) or wood preserved in volcanic ash – such as the substantial material discovered preserved in the White River Ash in the Wrangell’s, Alaska from a ninth century volcanic event (Mackay et al., 2022). However, the relative elevations of these preservation environments will be crucial for determining the quality of the signal that could be gained from such material. Theoretically however, in colder periods such as intervals of the Little Ice Age when temperatures were ca. 1 degree cooler (D’Arrigo et al., 2006; Esper et al., 2014; Wilson et al., 2019), the relative optimal elevation for gaining a robust signal may well extend to lower elevations, that is, the currently defined ‘Mid1’ group could be included in the reconstruction along with the ‘High’ group as the theoretical treeline would have been lower in such cooler periods. Ultimately, for any future study that aims to identify lakes which hold preserved woody stem material in the nearshore sediments, the question of whether lower elevation lakes (200 or even 300 m below current treeline) should be considered is essentially a balance between minimising the infamous divergence problem during previous warmer periods, while maximising the potential amount of preserved material from multiple lakes.
Supplemental Material
sj-pdf-1-hol-10.1177_09596836251378010 – Supplemental material for Expanding the Yukon tree ring Blue Intensity network to assess divergence effects and enhance climate reconstructions
Supplemental material, sj-pdf-1-hol-10.1177_09596836251378010 for Expanding the Yukon tree ring Blue Intensity network to assess divergence effects and enhance climate reconstructions by Emily Reid, Brian Luckman, Marcel Kunz, Jan Esper, Rosanne D’Arrigo, Caroline Leland and Rob Wilson in The Holocene
Footnotes
Acknowledgements
David S. Morimoto generated ring-width data for several of the original sites used in this study as part of his PhD research. We thank Eileen Kuhl for her valuable assistance during fieldwork in the Yukon. We also gratefully acknowledge the Yukon First Nations who permitted sampling within their territories.
Author contributions
Funding
The authors disclosed receipt of the following financial support for the research, authorship, and/or publication of this article: This work was supported by a PhD Scholarship from the Carnegie Trust for the Universities of Scotland and the ERC Advanced Grant ‘Monostar’ [AdG 8822727]. NSF OPP 2124885. Collaborative Research: Tracking Divergent Warming and Tree Growth at Arctic Treeline. NSF Arctic Social Science grant 2112314, Collaborative Research: Understanding the Impacts of Extreme Events on the Peoples of the Arctic.
Data availability
Data supporting the findings in this study are available from the corresponding author upon reasonable request.
Supplemental material
Supplemental material for this article is available online.
References
Supplementary Material
Please find the following supplemental material available below.
For Open Access articles published under a Creative Commons License, all supplemental material carries the same license as the article it is associated with.
For non-Open Access articles published, all supplemental material carries a non-exclusive license, and permission requests for re-use of supplemental material or any part of supplemental material shall be sent directly to the copyright owner as specified in the copyright notice associated with the article.