
Abstract
The Acadian Forest is a mixed-wood forest covering the Canadian provinces of New Brunswick and Nova Scotia. Picea rubens (red spruce) is its signature species which has been prominent for circa 2000 years. We extracted a 124 cm surface core from Fish Lake, (46° 8′ 38.32″N, 66° 53′ 12.64″ W), near Fredericton, New Brunswick. A rplum age-depth model, based upon 4 14C and 15 210Pb dates, showed that the core bottom dates to AD 890. We performed a high-resolution pollen analysis on this core at a ~10 year resolution (125 samples total). Over the last millennium, Betula (birch), Tsuga canadensis (eastern hemlock) and Fagus grandifolia (American beech) declined, as Pinus sp. (pine), Abies balsamea (fir) and Picea sp.(spruce), including P. rubens increased. The Medieval Climate Anomaly (MCA – AD 900–1400), Little Ice Age (LIA – AD 1400–1850), and the European settlement period were clearly demarcated in the pollen record. A rise in Ambrosia (ragweed) marked early Acadian French agriculture at ~AD 1680. During the last 300 years of the European period, Poaceae (grasses), Ambrosia, and other herbs all increased, while Pinus strobus (eastern white pine) declined. Macrocharcoal analysis showed that natural forest fires had a continuous presence over the past millennium, with higher fire frequency during the LIA than in the MCA. The MCA had an average spring temperature of 3.2°C, and the LIA had an average spring temperature of 2.2°C.
Keywords
Introduction
The portion of the New England/Acadian Forest within New Brunswick, Canada, has received comparatively little attention from high-resolution paleo-environmental studies. Encompassing much of the Canadian Maritimes, the Acadian Forest is a 24-million hectare land area constituting the northernmost portion of the broader New England/Acadian Forest region (Canham, 2020). The existing research has focused on the whole-Holocene or late glacial-Younger Dryas past of this region (Davis et al., 2021; Jetté and Mott, 1995; Mayle et al., 1993; Mayle and Cwynar, 1995a, 1995b; Mott, 1977; Warner et al., 1991), and to the best of our knowledge, no high-resolution pollen analysis has been done in the province focusing on recent millennia. The forest is believed to have undergone a process of “borealization” or a shift toward a more boreal character at the expense of its temperate forest species and ecological communities since the arrival of European colonists (Noseworthy and Beckley, 2020). Indeed, the forest is among the most disturbed in North America, a consequence of the region’s early colonization by Europeans, and by the early role of timbering in the economies of the settler communities that emerged from it.
Picea rubens Sarg. (red spruce) is the signature species of the Acadian Forest. An important dominant today, Picea rubens is proposed to have expanded from its coastal refugia in Maine into the continental portion of the forest 1000–2000 years ago (Lindbladh et al., 2003; Mott, 1975). Long-lived P. rubens increased in inland New Brunswick during regional climatic shifts during this period in which it became more abundant. Research in Québec and Maine suggests that P. rubens became more abundant during the Little Ice Age (LIA – AD 1400–1850) (Houle et al., 2012; Paquette and Gajewski, 2013; Schauffler and Jacobson, 2002), but this has not yet been observed at high temporal resolution in New Brunswick.
Similarly, the role of fire in the Acadian Forest appears to have not been evaluated much over a longer time-scale using macrocharcoal archived in lake sediments, creating a gap in our understanding of the impacts of fires on the Acadian Forest of the most recent millennia (but see Wein et al., 1987). Some researchers have argued that the Acadian Forest is too wet for fire to play an important role in its dynamics (De Lafontaine and Payette, 2012; Taylor et al., 2020). European records both in the early French and later English colonial periods suggest that wildfires did occur in the Acadian Forest (Hay, 1903), though these observations generally correspond with the LIA, a climatic event generally associated with cooler temperatures and increased precipitation in eastern North America (Marlon et al., 2017; Wu et al., 2022). Existing scholarship arguing that fires have long-term consequences for the composition for the Acadian Forest heightens the need for an investigation of fire regimes in the region (e.g. Remy et al., 2017).
The objective of this study is to perform high-resolution pollen and macrocharcoal analyses of a lake sediment core in order to infer paleoforest dynamics in New Brunswick. The goals of this work are to identify regional vegetation changes in the Acadian Forest during the last millennium, so as to provide data to help clarify our understanding of (1) when P. rubens first became a major component in the Acadian Forest, (2) the response of the forest to climate changes over this time period, (3) the role of fire in the Acadian Forest, and (4) the possibility that the forest has been borealized since the arrival of European settlers.
Study area
We cored Fish Lake (46° 8′ 38.32″N, 66° 53′ 12.64″ W; 206 m a.s.l.) in Douglas Parish, New Brunswick (Figure 1 and Supplemental Figure S1). It is located at the border of two regions defined by the New Brunswick Department of Mines: the New Brunswick Highlands, and the New Brunswick Lowlands; the latter’s topography exhibits lower hills and gentler relief than much of the rest of the province (Burrell and Anderson, 1991). About 4.5 m deep at its center, the lake has a surface area of 1.5 ha., a single outflow, and a single inflow point at its wider, northern end. It is surrounded by conifers, principally Pinus strobus L. (eastern white pine), on three sides. It is 28 km from downtown Fredericton, has no human habitations nearby, and is at least 200 m away from lightly trafficked dirt roads.
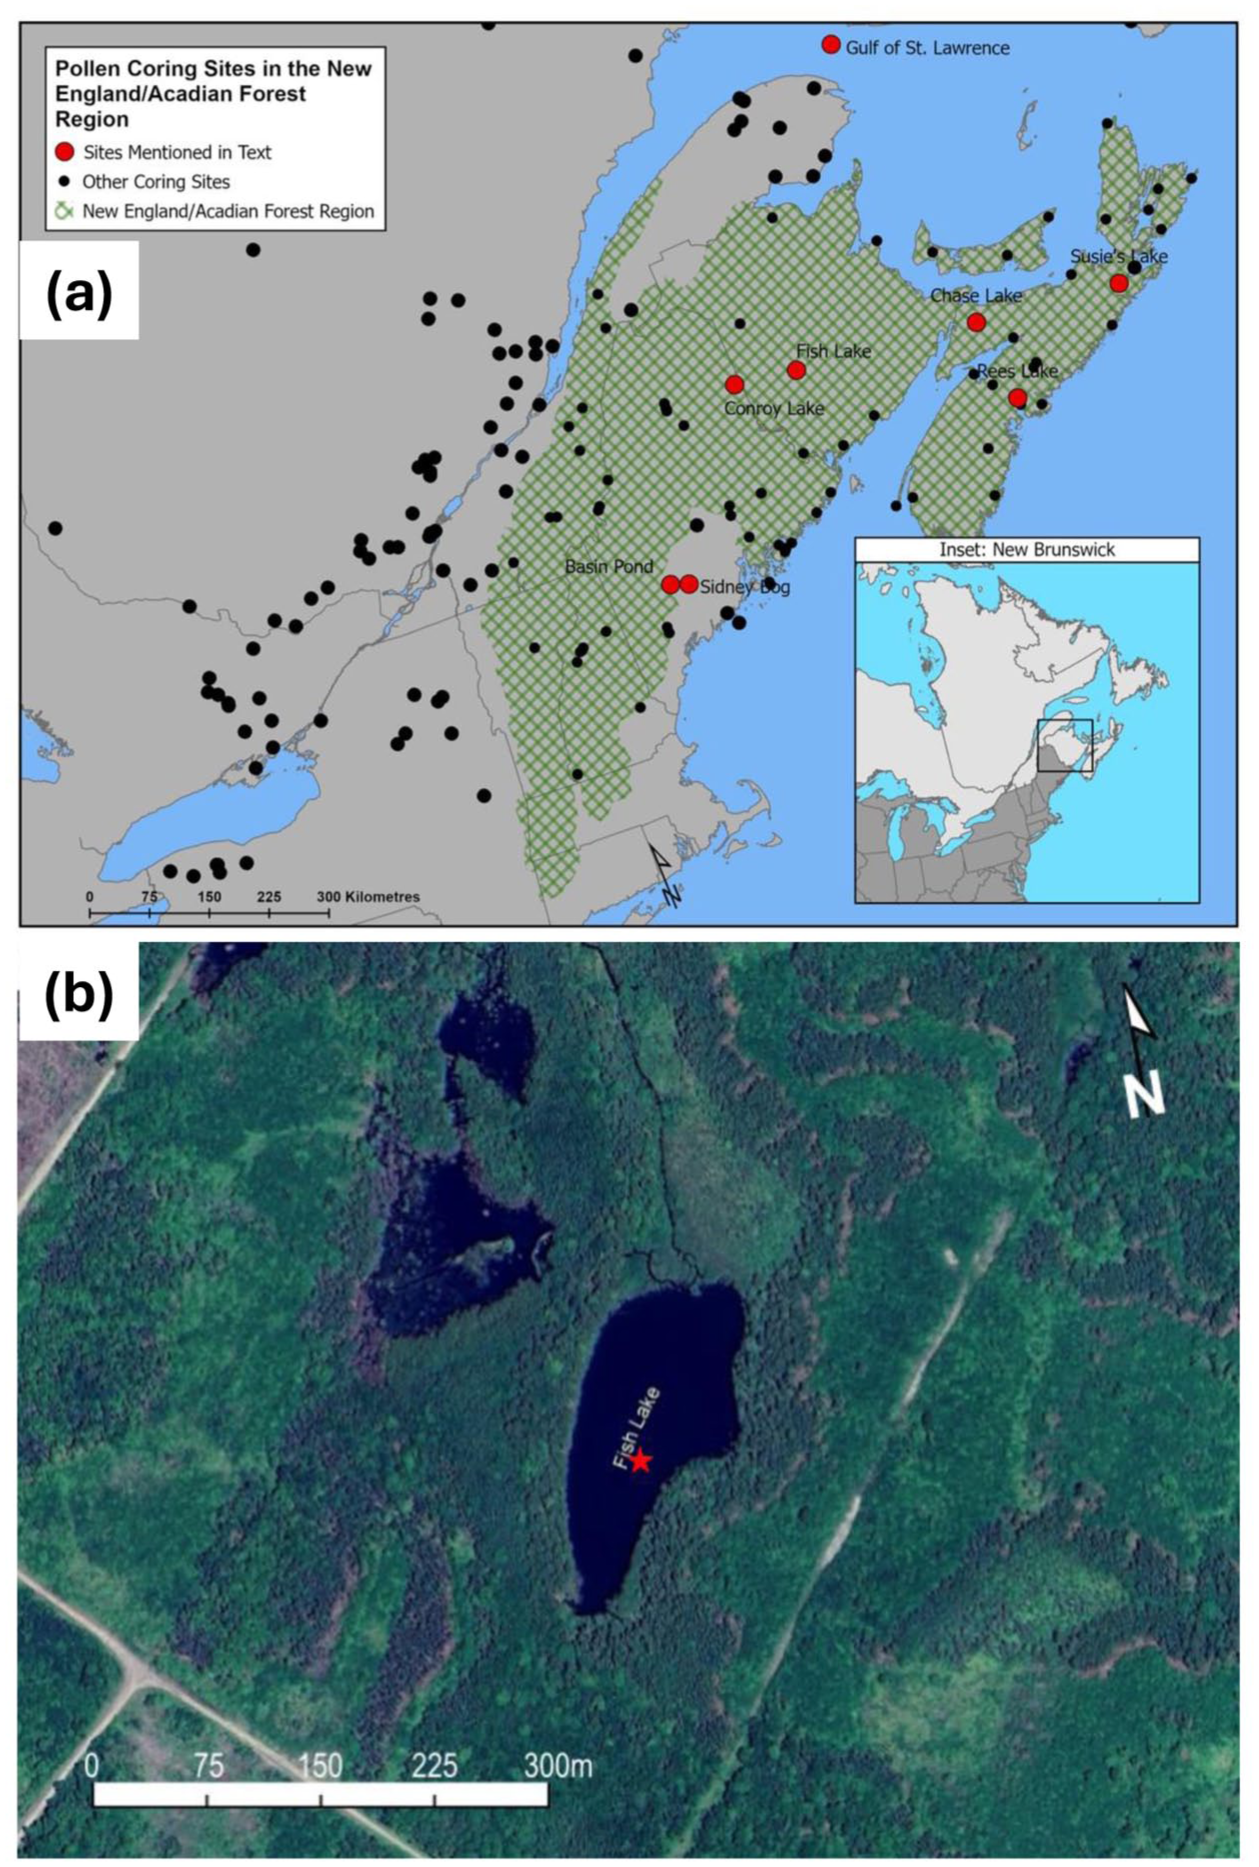
(a) Map of the New England/Acadian Forest region, with coring sites of previous researchers identified by black circles and our new site with a red circle, together with a northeastern North America inset showing the location of New Brunswick. Other sites discussed in this text are labelled and also denoted by red circles. Note the paucity of coring sites in New Brunswick relative to neighboring Québec, Maine and Nova Scotia (Adapted from Noseworthy & Beckley, 2020, Neotoma, and Google Earth). (b) Image of Fish Lake from Google Maps. The red star denotes the coring location.
Methods
Field methods and subsampling
We took a surface core in February 2023, using the ice as a coring platform and a 1.5 m long, 7.5 cm wide clear acrylic tube with an accompanying piston. The core was taken in 4.5 m of water as measured by a Secchi disk. The coring location (46o 08′ 40.1″ N, 66o 53′ 11.7″ W) was determined using a GARMIN ITRAX GPS. The surface core was stored in an upright position with the piston in place in a walk-in fridge at 4°C in the Department of Biology, University of New Brunswick. We extruded the core in the laboratory into plastic bags at contiguous 0.5 cm increments above 20 cm (because these sediments had a high water content), and at 0.25 cm increments below 20 cm (because these sediments were more consolidated), in order to arrive at roughly equal size dry sediment samples.
Chronology
Terrestrial macro-fossils found during surface core extrusion were extracted, rinsed in weak HCl, dried, weighed and then dated using AMS radiocarbon analysis at Beta Analytic, Miami, Florida, USA. Four macro-fossils were used for 14C analysis. Samples from the uppermost 32 cm of the core were dated by 210Pb at Flett Labs, Winnipeg, Manitoba, Canada, and the constant rate of supply (CRS) model was used (Ghaleb, 2009). The resulting data were modeled using Bayesian methods with the rplum package in R to create a composite chronology (Aquino-López et al., 2018).
Loss-on-ignition
Sediment samples of 0.5 cm3 were analyzed at a 1 cm intervals to determine percent organic matter and percent minerals throughout the core. Samples were heated to 100°C for 24 h to dry them, and then to 550°C for 4 h following Heiri et al. (2001).
Pollen analysis
Pollen samples of 0.5 cm3 were analyzed at 1 cm intervals along the length of the core. Each sample was spiked with one Lycopodium tablet (Benninghoff, 1962; Bonny, 1972) to calculate pollen accumulation rates (Moore et al., 1991). We prepared pollen samples using standard pollen methods (Fægri et al., 1989), which included HCl to remove carbonates, KOH to disaggregate the sediment and remove humic acids, and acetolysis to remove non-pollen organic matter. An initial 36 samples also received a HF treatment to remove possible silicates. Since silicates were not present in any quantity, HF use was discontinued. The processed samples were stored in silicone oil before being mounted on slides for microscopic pollen analysis.
For each sample, a minimum of 400 terrestrial pollen grains and spores were identified and counted at 400× and 800× using a Leica DM 2500 LED microscope. Regional pollen guides and papers (Bassett et al., 1978; Lindbladh et al., 2002; McAndrews et al., 1973; Moore et al., 1991; Philbrick and Bogle, 1981; Richard, 1970) were used as references for pollen identification. Pollen grains were identified to the highest taxonomic resolution. Picea pollen was split into that from Picea rubens, P. mariana (Mill.) Britton, Sterns & Poggenburg, and P. glauca (Moench) Voss (red, black, and white spruce, respectively) following Lindbladh et al. (2002) and Richard (1970). Pinus was split into sections haploxylon (Pinus strobus) and diploxylon (Pinus banksiana Lamb. (jack pine)) and Pinus resinosa Sol. ex Aiton (red pine)) following McAndrews et al. (1973). Alnus was split into Alnus alnobetula ssp. crispa (Ehrh.) K.Koch (green alder) type and Alnus incana ssp. rugosa (Du Roi) J. Clausen (speckled alder) type following McAndrews et al. (1973) and Richard (1970).
Pollen stratigraphic plots of relative and absolute abundances were made with the R package rioja; and CONISS was used to divide them into zones whose significance was assessed by the broken stick test (Van Buuren, 2023). To further examine changes in the taxa through time, principal components analysis (PCA) was performed on the untransformed relative abundance record using the R package vegan. The gradient length was checked using the length of the first axis of detrended correspondence analysis (DCA) to ensure that PCA was appropriate, and the significance of the first three axes was checked with a broken stick test.
Climate reconstructions
To determine if the shifts in vegetation composition were driven by regional climate changes, we inferred temperature and precipitation values from the pollen percentage data, and compared the climate signals from this site with those from other sites in the region. We assumed that if the reconstructions were similar, then the vegetation changes were presumably caused by regional climate change and not by internal drivers such as succession. We reconstructed past climate using weighted averaging partial least squares regression and calibration (WA-PLS). For the pollen-climate calibration set, we used version 1.8 of the North American Modern Pollen Database (NAMPD) of Whitmore et al. (2005). For the calculations, we used the rioja package in R (Juggins, 2024), exploring reconstructions of annually and March-April-May (MAM), June-July-August (JJA), September-October-November (SON), December-January-February (DJF) averaged temperatures, and annually and seasonally summed precipitation. The best reconstructions were chosen by maximizing R2, minimizing RMSE, and testing the significance of the WA-PLS components using a randomized t-test. Given the taxonomic decisions of the earlier researchers whose work forms the pollen-climate training set, we had to merge the Picea, Alnus, Pinus and Acer species counts to respective generic counts. Modern pollen data spanning 74o and 61o W longitude and 43o and 50o N latitude were extracted from the Whitmore dataset, resulting in 301 sites in our Maritimes pollen-climate calibration set to compensate for the low taxonomic resolution in the NAMPD. We used WA-PLS because it copes well with the irregular spatial distribution of sites in the NAMPD and successfully handles minor extrapolation.
We verified that the Maritimes pollen-climate calibration set contained adequate modern analogs for the Fish Lake pollen samples by computing the minimum squared chord distance for each Fish Lake sample to the Maritimes calibration set. Any Fish Lake sample with minimum squared Euclidean distance ⩽ 15.87 (the fifth closest percentile of comparisons within the Maritimes calibration set) has a close modern analog; any Fish Lake sample with 15.87 < minimum squared chord distance ⩽ 24.37 (the 20th closest percentile of comparisons within the Maritimes calibration set) has a modern analog; and any Fish Lake pollen sample with a minimum squared chord distance > 24.37 has no modern analog (Simpson et al., 2012; St-Jacques et al., 2008).
We compared our reconstructions to other high-resolution and well-dated terrestrial and marine sedimentary reconstructions from within a 350 km radius to examine regional past climate patterns (e.g. Clifford and Booth, 2013; Gajewski, 1988; Wu et al., 2022). We defined high-resolution sampling as at least four samples per century, and well-dated to mean varved sediments or at least four 14C dates per 1000 years. We did not include tree-ring-based climate reconstructions in our local comparison set. Although annually resolved, they do not capture centennial-scale climate variability well in this region because of the aggressive detrending methods dendro-climatologists must use to remove stand dynamics in the closed-canopy northeastern forests (e.g. Pace et al., 2025; Tardif et al., 2001).
Macrocharcoal analysis
Macrocharcoal particles archived in lake sediment cores are an ideal material from which to derive local fire frequencies, being inert, and thus able to survive long spans of time after charcoalization (Crawford and Belcher, 2014). Samples of 0.5 cm3 were taken at contiguous 0.5 cm increments continuously along the core. Each sample was soaked in 10% KOH for 24 h, which disaggregated the sediment. Commercial bleach was then added for 1 h to whiten dark organic matter, making the macrocharcoal easier to identify. Each sample was sieved using a sieve with 150 μm meshes, and the residue examined under a Leica M80 microscope. The macrocharcoal pieces were gathered using a fine paint brush and photographed using a Leica digital color MC170 HD microscope camera. These photographs were used as inputs for the imaging analysis software WinSeedle®, which calculated the aggregated cross-sectional area of macrocharcoal for each sample.
Statistical analysis of the macrocharcoal data (the time series consisting of the total cross-sectional area of all the samples) was done using the Matlab© version of CharAnalysis (Higuera, 2009; Higuera et al., 2009) to identify peaks in the macrocharcoal record marking local fire events. Charcoal area accumulation rates were interpolated using the age-depth model and proportional interpolation with a fixed time interval bin size of 5 years (the median resolution of the record), producing an interpolated series of samples (μm2 cm2·yr−1; Higuera et al., 2009; Molinari et al., 2018). The background charcoal (BCHAR) of non-local and secondary charcoal was calculated using a moving window of 300 years and a moving mode smoother to ensure that the signal-to-noise index (SNI) of the macrocharcoal peaks was above 3.0 as recommended by Kelly et al. (2011) and Brossier et al. (2014). The BCHAR series represents distant fires, long-term shifts in fire regimes and secondary taphonomic processes not related to local fire occurrences (e.g. sediment mixing, intra-lake charcoal transport, slope wash). Then CHAR was calculated as the residual of the interpolated charcoal series minus BCHAR. Peaks in macrocharcoal, interpreted as local fire events, were the CHAR values exceeding the 99th percentile of the CHAR noise distribution modeled using Gaussian mixture models with a locally set threshold (Higuera et al., 2009). The window size and smoother type were also optimized to maximize the goodness-of-fit of the noise component of the Gaussian mixture model as assessed by the Kolmogorov-Smirnov test.
Results
Age-depth model
The length of the surface core was 124 cm and consisted of dark-brown, organic-rich, undifferentiated sediment. In total, 15 210Pb and four 14C dates were obtained on the sediment core (Table 1 and Supplemental Table S1). The plot of total 210Pb activity showed a negative exponential decay (the activity of the dilute uppermost two samples was difficult to measure), hence the CRS 210Pb modeling was valid (Figure 2). Despite the proximity of two of the 14C dates near core top, and hence their wide calibrated date ranges, the 14C dates showed no reversals (Table 1 and Figure 2). Therefore, all four 14C dates were used in the construction of the age-depth model. The chronology of the surface core spanned over a millennium, from AD 890 to AD 2023 (1060 BP to −72 BP). Therefore, the core spanned both the Medieval Climate Anomaly (MCA—AD 900–1400) and the Little Ice Age (LIA—AD 1400–1850), enabling the reconstruction of the dynamics of the Acadian Forest at Fish Lake over this time span using pollen and macrocharcoal analyses.
Radiocarbon dating results from Fish Lake, New Brunswick, from Beta Analytic, showing laboratory IDs, sample names, materials, depths (cm), uncalibrated 14C years, their ±1 σ errors and the calibrated dates according to INTCAL20 (Reimer et al., 2020).
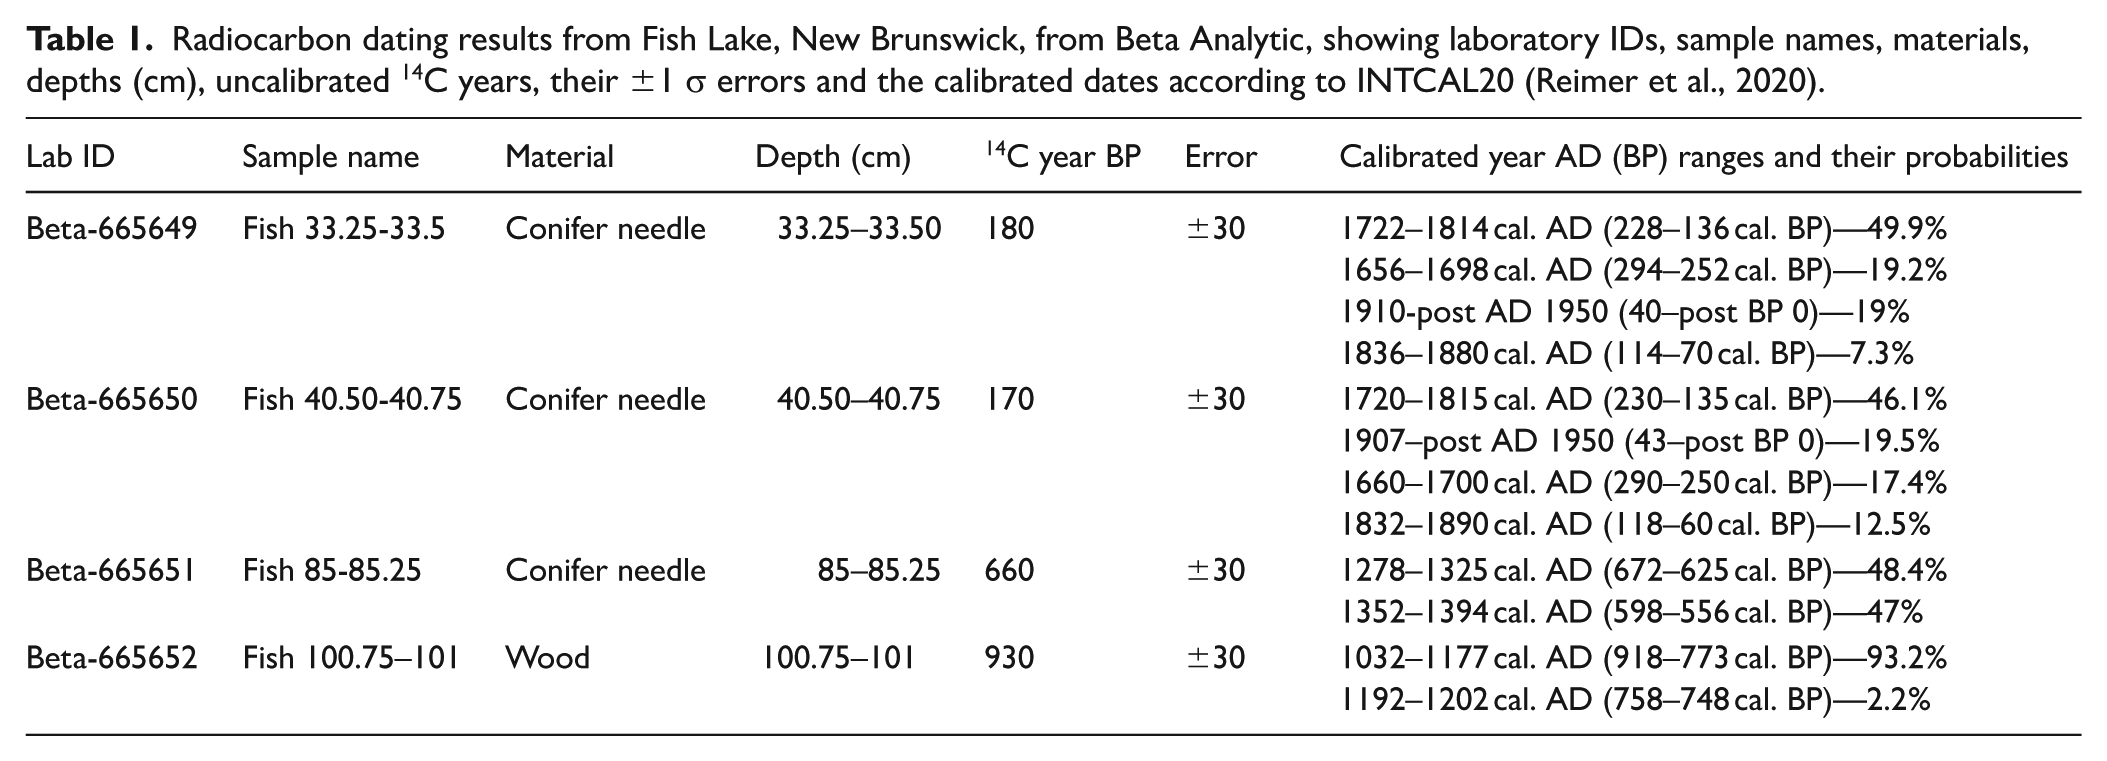
Age-depth model of the Fish Lake core using the R package rplum based on four 14C dates and 15 210Pb dates. The top panels show, from left to right, the MCMC series, and the prior (green) and posterior (gray) distributions for, respectively, the deposition time (yr/cm), the deposition time variability or memory, the flux of 210Pb (phi), and the level of supported 210Pb (s). Red text indicates the settings. The right-hand axis and left-hand portion of the bottom panel show the total 210Pb activity. The long purple violin plots denote 14C dates and their probabilities and the short blue squares denote total 210Pb activity and their errors. The greyscale is the age-depth model, the gray dots are the 95% range, and the red dots are the mean age-depth model.
Loss-on-ignition
Loss-on-ignition results showed that the wet core material on average consisted of 88.6% water; and there was a fairly linear declining percentage of water in the core toward the bottom (Supplemental Figure S2). Organic material formed an average 48.9% of the dry core weight, and reached its lowest values during the early 20th century, during the AD 1200s and during the AD 1000s.
Pollen results and interpretation
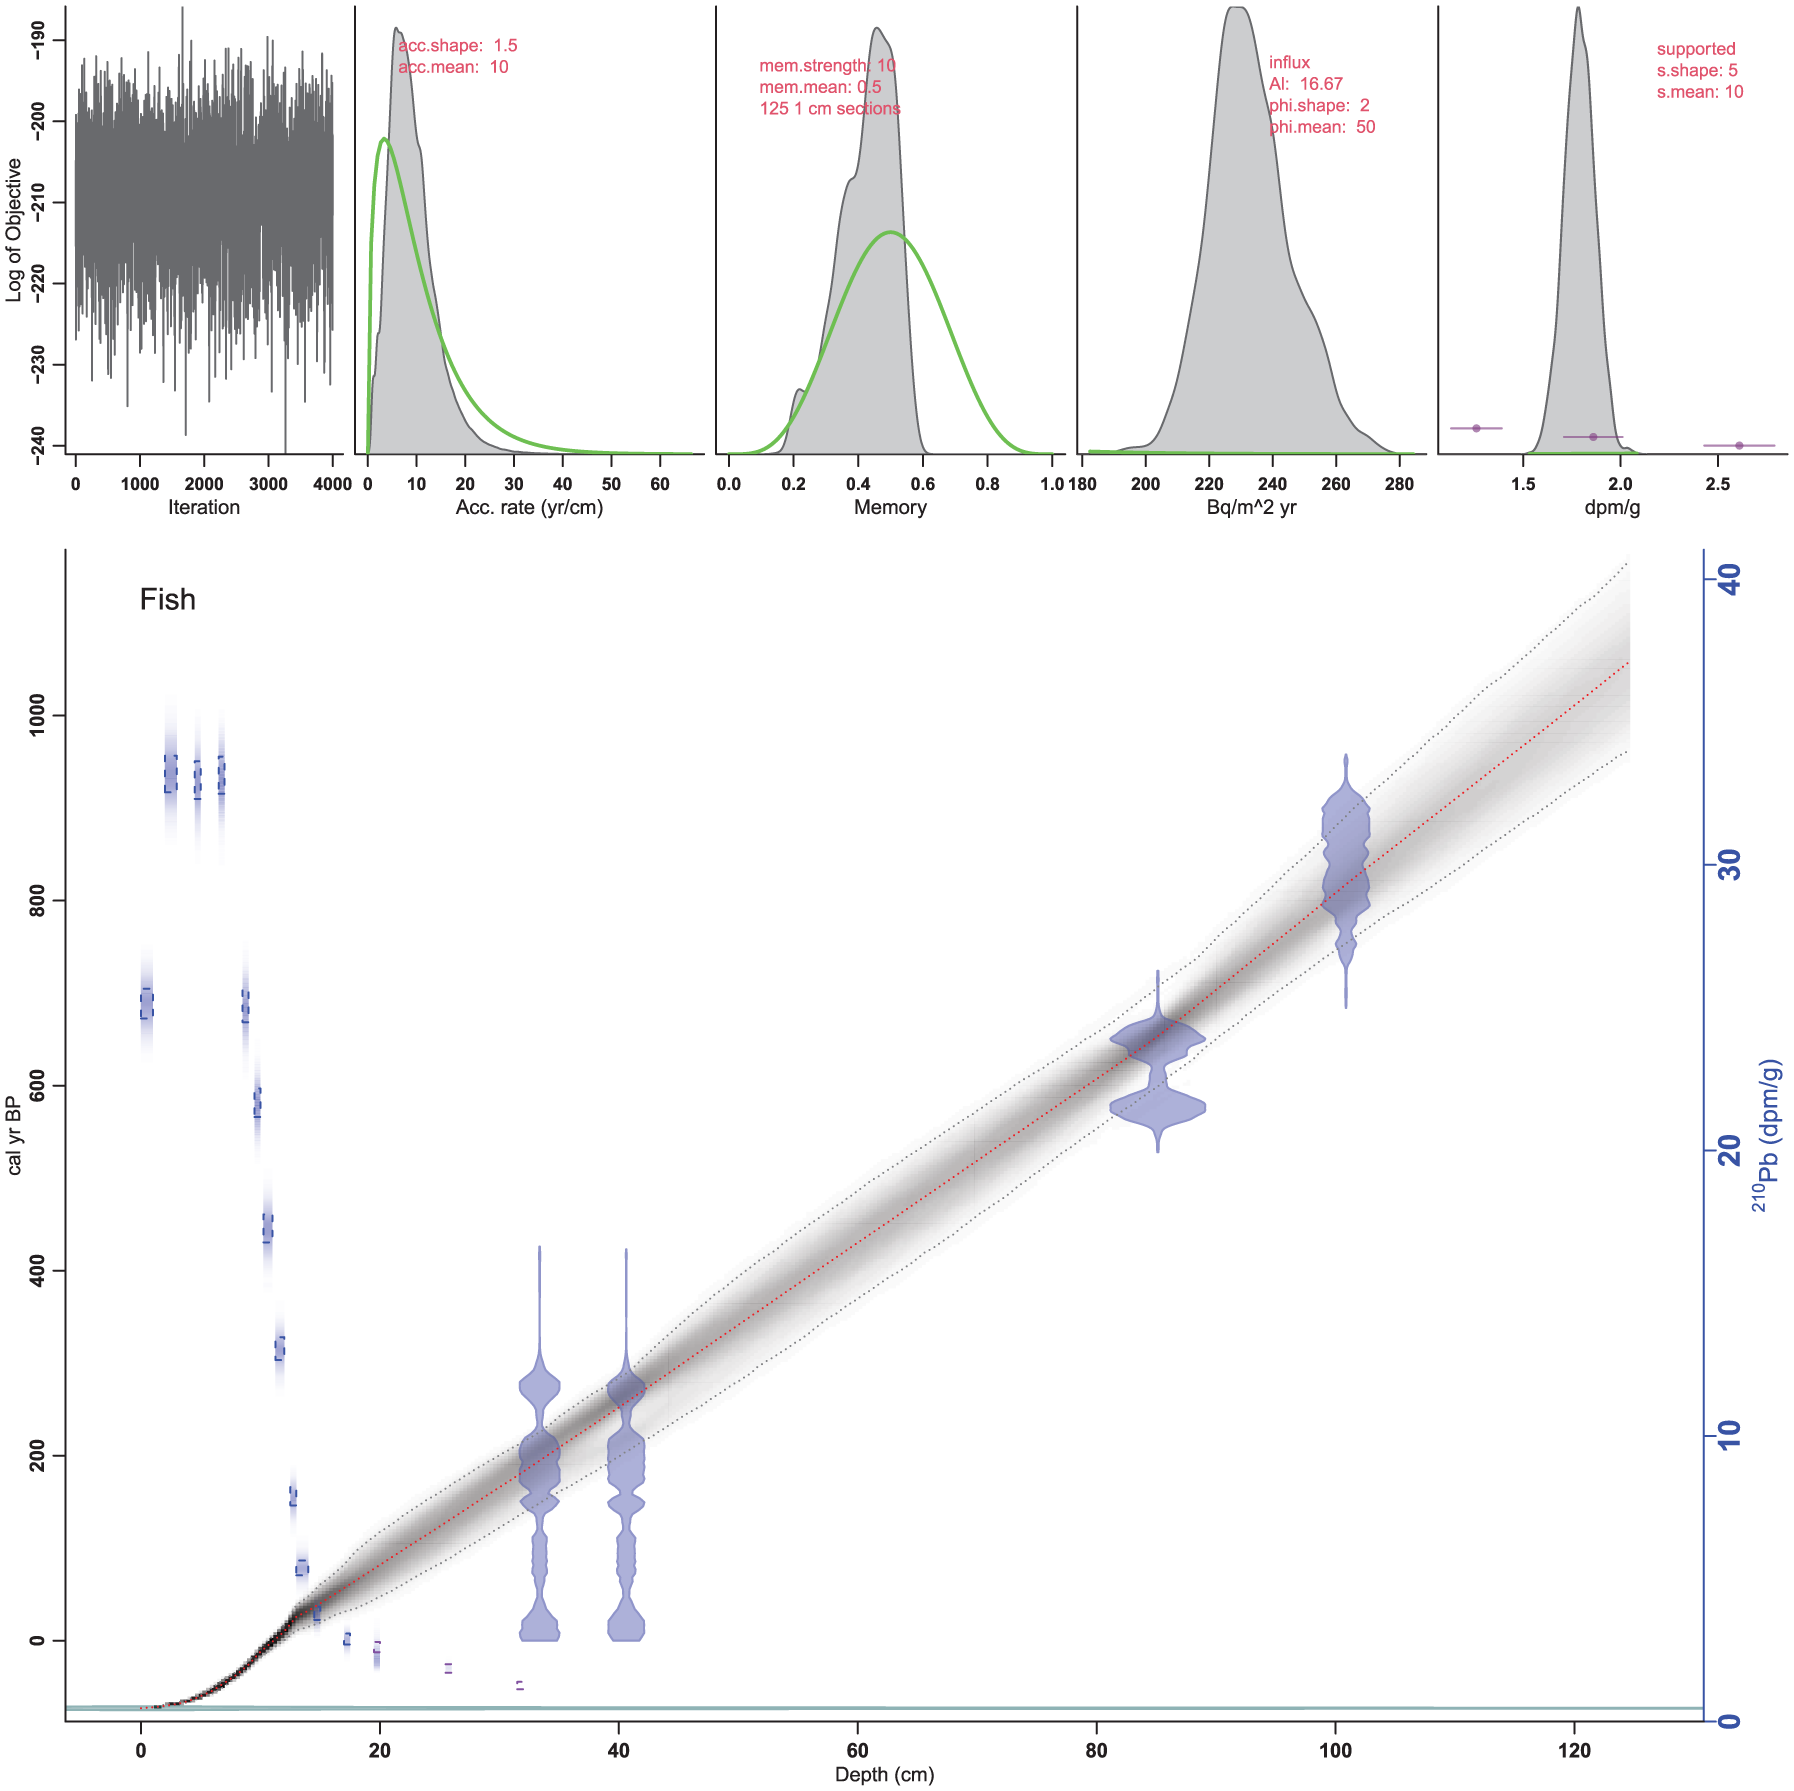
The broken-stick model and CONISS identified six distinct pollen zones in the 125 pollen samples counted. These zones are of variable lengths of time, with the shortest zone at the top of the core.
Pollen zone I: Early MCA (AD 895–1045)
Betula (birch) dominated zone I during the early MCA (Figure 3 and Supplemental Figure S3). Tsuga canadensis (L.) Carrière (eastern hemlock) was present with its highest abundance and influx. The three Picea (spruce) species, Pinus haploxylon (Pinus strobus) and Pinus diploxylon (Pinus resinosa and Pinus banksiana) were abundant; however, they had lower relative abundances and influxes in this zone than in subsequent zones. Fagus grandifolia Ehrh. (American beech) was prominent. Little pollen from shrubs such as Salix (willow) and Alnus (alder), and other herbs, indicated that the forest was likely mature and largely closed.
Pollen relative abundance (%) plot for AD 900–2023 from Fish Lake, Douglas Parish, New Brunswick, showing the most important taxa. Zonation was done using CONISS with the broken stick test to determine which zones were significant. The orange shading denotes the Medieval Climate Anomaly and blue shading denotes the Little Ice Age. A cumulative plot showing the percentage of each grouping present in each sampling appears after the individual species plots.
Pollen zone II: Middle MCA (AD 1045–1265)
At the end of pollen zone II and the MCA, Pinus diploxylon increased in percent and influx relative to pollen zone I and the early MCA, and the Picea species slightly increased (Figure 3 and Supplemental Figure S3). Pinus strobus slightly decreased in percentage and influx. Betula began a decline in relative and absolute abundances that continued through the rest of the record; as did Tsuga canadensis. The abundance and influx of F. grandifolia remained similar to that in pollen zone I. Salix and Myrica gale L. (sweetgale) increased in abundance and influx, while the abundance of Alnus slightly declined. Acer increased its relative abundance.
Pollen zone III: Transition from MCA to Early LIA (AD 1265–1530)
The end of the MCA brought a resurgence of conifers to complement a relatively substantial deciduous pollen signal (Figure 3 and Supplemental Figure S3). Picea mariana became more abundant in both percent and influx, as did P. rubens and P. glauca to a lesser extent. Pinus strobus reached a nadir in relative abundance but not influx, while Pinus diploxylon increased and reached its highest relative abundance and influx in this zone and the subsequent one. Acer remained steady and slightly elevated in percent and influx relative to the early MCA (pollen zone I). Tsuga canadensis declined substantially in percent and influx, and F. grandifolia began to decline in percent and influx toward the upper bounds of this zone. Betula declined in relative abundance but increased in influx. Ostrya virginiana (Mill.) K. Koch reached its maximum relative abundance and influx. Abies balsamea was a minor constituent. The percentage and influx of the other herbs increased in this zone relative to its predecessor.
Pollen zone IV: Middle LIA (AD 1530–1720)
Encompassing the beginnings of European (French) colonization of the region as the LIA continued in Atlantic Canada, the conifers began a significant rise (Figure 3 and Supplemental Figure S3). Every conifer taxon increased in abundance in this zone except for Tsuga. Particularly strong increases can be seen in P. mariana and P. rubens. Pollen zone IV, the middle LIA, began with a continuing increase in the relative abundances and influx of P. mariana and P. rubens. The relative abundance and influx of A. balsamea also increased at the beginning of this
Pinus strobus abundance and influx increased toward the end of this zone. Declines in Betula and Fagus percent and influx accelerated. Ostrya similarly declines relative to its high point in zone III. Acer remained fairly unchanged in percentage and influx, whereas Alnus declined. Notably, the first Ambrosia (ragweed) pollen appeared around AD 1680.
Pollen zone V: Early colonial period (AD 1720–1840)
Deciduous taxa declined, as conifer taxa increased (Figure 3 and Supplemental Figure S3). Betula and F. grandifolia continued to decline in percent and influx, and Acer declined in influx. Picea mariana and P. rubens remained relatively constant in percentage and influx, while P. glauca increased. Pinus strobus increased in percentage and influx, while Pinus diploxylon decreased. Tsuga was reduced in both abundances, while the abundance of Abies balsamea continued to rise. The relative abundances and influx of Poaceae, Ambrosia and other herbs increased throughout pollen zone V.
Pollen zone VI: British colonial and modern periods (AD 1840–present)
The topmost section of the core began in AD 1840 and formed the modern part of the reconstruction (Figure 3 and Supplemental Figure S3). Betula, Acer, and F. grandifolia relative abundances and influxes reached their minima. Ostrya virginiana practically vanished in this zone. The relative abundances of P. mariana and P. rubens had high values similar to zone V, while percent P. glauca increased at the end of this zone. However, all three Picea species showed declines in influx. Tsuga canadensis had very low values. Percent Pinus diploxylon were similar to that of zone V, however its influx declined throughout zone VI. Pinus strobus percent and influx reached their maximum in the core. Abies balsamea reached its maximum percentage in the entire record, whereas its influx was similar to that of the two preceding zones. Both A. incana spp. rugosa and A. alnobetula ssp. crispa had sustained high relative abundances and influxes. Poaceae, Ambrosia and other herbs reached their highest relative abundances and influxes.
PCA of pollen relative abundances
Principal components analysis was used to uncover the main patterns of pollen variation, explaining 55.3% of the total pollen variation with the first three principal components which were all significant (Figure 4). PCA Axis 1 explained 28.1% of the pollen variation and was defined by warmer T. canadensis, F. grandifolia and Betula (highest positive first axis species scores), and colder coniferous taxa: P. mariana, A. balsamea, and P. strobus, together with Poaceae, Ambrosia and other herbs (lowest negative first axis species scores; Figure 4a). PC 1 sample scores were highest during the MCA, clustered around zero and were more variable during the LIA, and were lowest during European settlement (Figure 4c). PC1 appears to be capturing a temperature gradient.
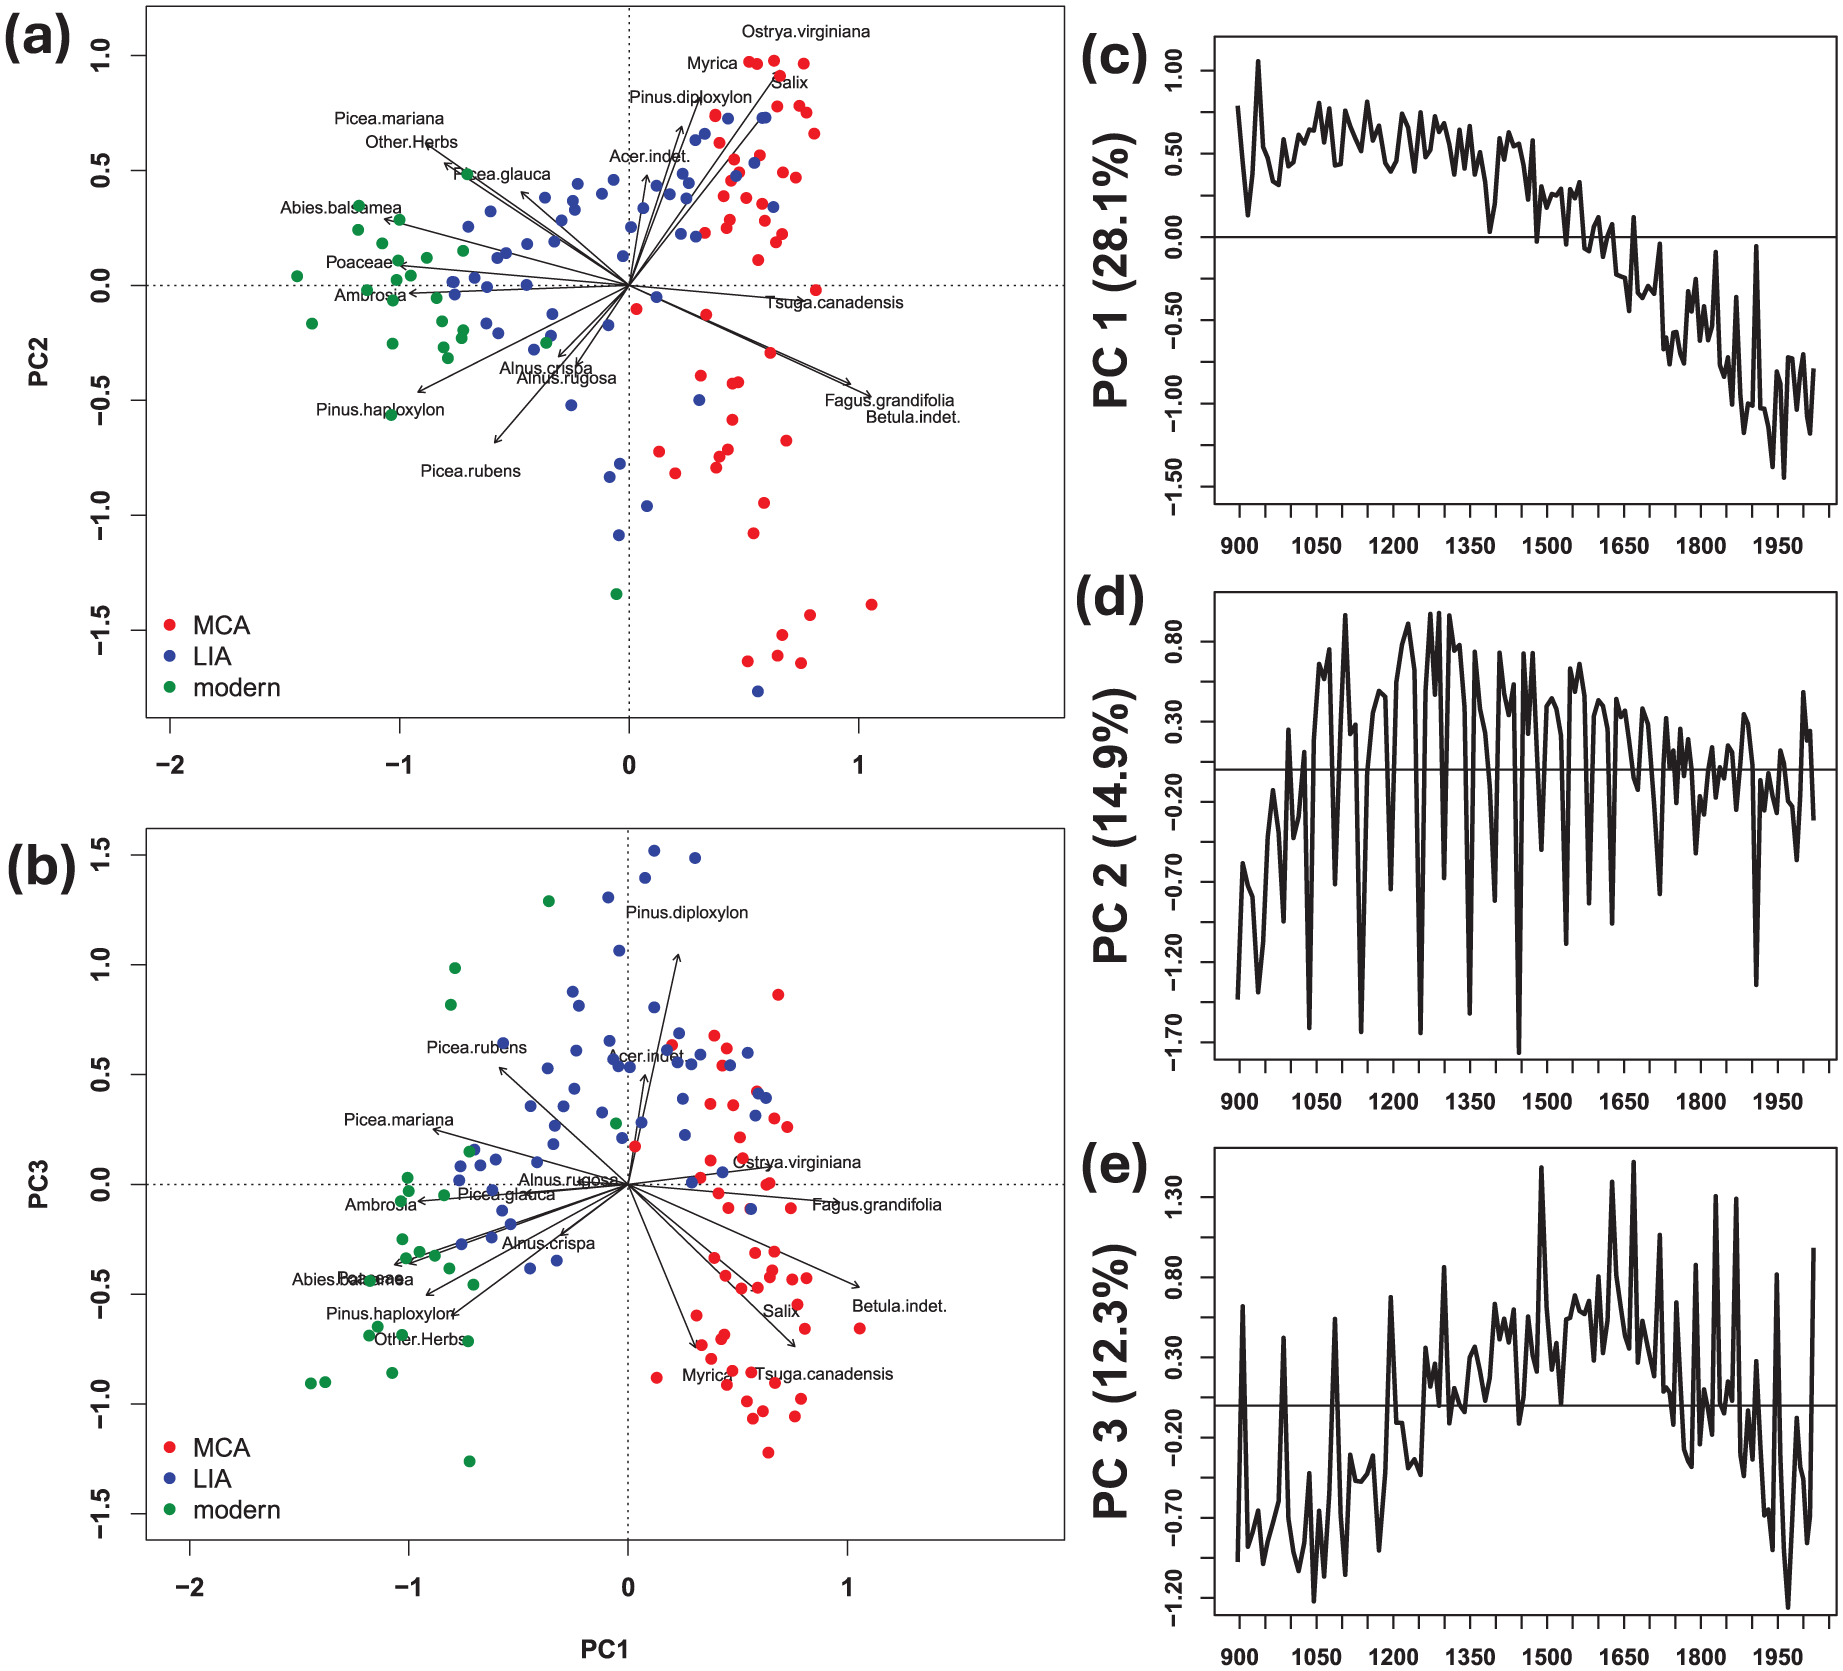
(a) Biplot of the first two principal components of the Fish Lake pollen data, (b) biplot of the first and third principal components, (c) plot of the first principal component versus time, (d) plot of the second principal component versus time, and (e), a plot of the third principal component versus time. In the biplots, the sample dots are colored according to sample age: red dots denote samples from the MCA, blue dots from the LIA, and green dots from pollen zone VI or the modern period.
PCA Axis 2 explained 14.9% of the pollen variation and was defined by O. virginiana, Myrica, Salix, Pinus diploxylon, P. mariana and other herbs (highest positive second axis species scores), and P. rubens (lowest negative second axis species scores; Figure 4a and d). PC 2 sample scores exhibited high frequency and amplitude in the MCA and LIA, with reduction in both frequency and amplitude during European settlement (Figure 4d).
PCA Axis 3 explained 12.3% of the pollen variation and was defined by Pinus diploxylon, Acer spp., and P. rubens (highest positive third axis species scores), and Myrica, T. canadensis, Salix, Pinus strobus and other herbs (lowest negative third axis species scores; Figure 4b). PC 3 sample scores exhibited an upside down U-shape, increasing in the LIA and declining to lower values during European settlement (Figure 4e). The frequency and amplitude of the PC 3 sample scores remained relatively constant throughout the last millennium.
Pollen-inferred climate reconstructions
Close modern analogs existed for 75% of the 125 Fish Lake pollen samples in the Maritimes calibration set; modern analogs existed for a further 22% of the samples; and only 2% of the samples had no modern analog (Figure 5a). The pollen samples with less close modern analogs were concentrated in the last 200 years where human disturbance was the greatest. Using our Maritimes-focused pollen-climate calibration subset derived from Whitmore et al. (2005), the best temperature reconstruction was that of MAM-averaged temperature using two significant WA-PLS components, with an R2 = 0.57, RMSE = 1.50°C, average bias = −0.02°C, and maximum bias = 3.07°C when run on itself using leave-one-out cross-validation. The reconstructed spring temperature showed a warm MCA (AD 900–1400) and a distinct cold LIA (AD 1400–1850; Figure 5b). The reconstructed warm period had an average spring temperature of 3.2°C, and the succeeding LIA had an average spring temperature of 2.2°C. The best precipitation reconstruction was that of DJF-averaged precipitation using three significant WA-PLS components, with an R2 = 0.37, RMSE = 48.7 mm, average bias = −0.63 mm, and maximum bias = 89.6 mm using leave-one-out cross-validation. The reconstructed annual precipitation showed a generally drier MCA (AD 900–1400) with an average winter precipitation of 245 mm, whereas the early LIA (AD 1400–1600) was wetter with an average winter precipitation of 254 mm, and the later LIA (AD 1665–1850) was drier again with an average winter precipitation of 245 mm (Figure 5c). Post-1900, the climate reconstructions become unreliable due to well-documented human-caused landscape modification (Kujawa et al., 2016; St-Jacques et al., 2015).
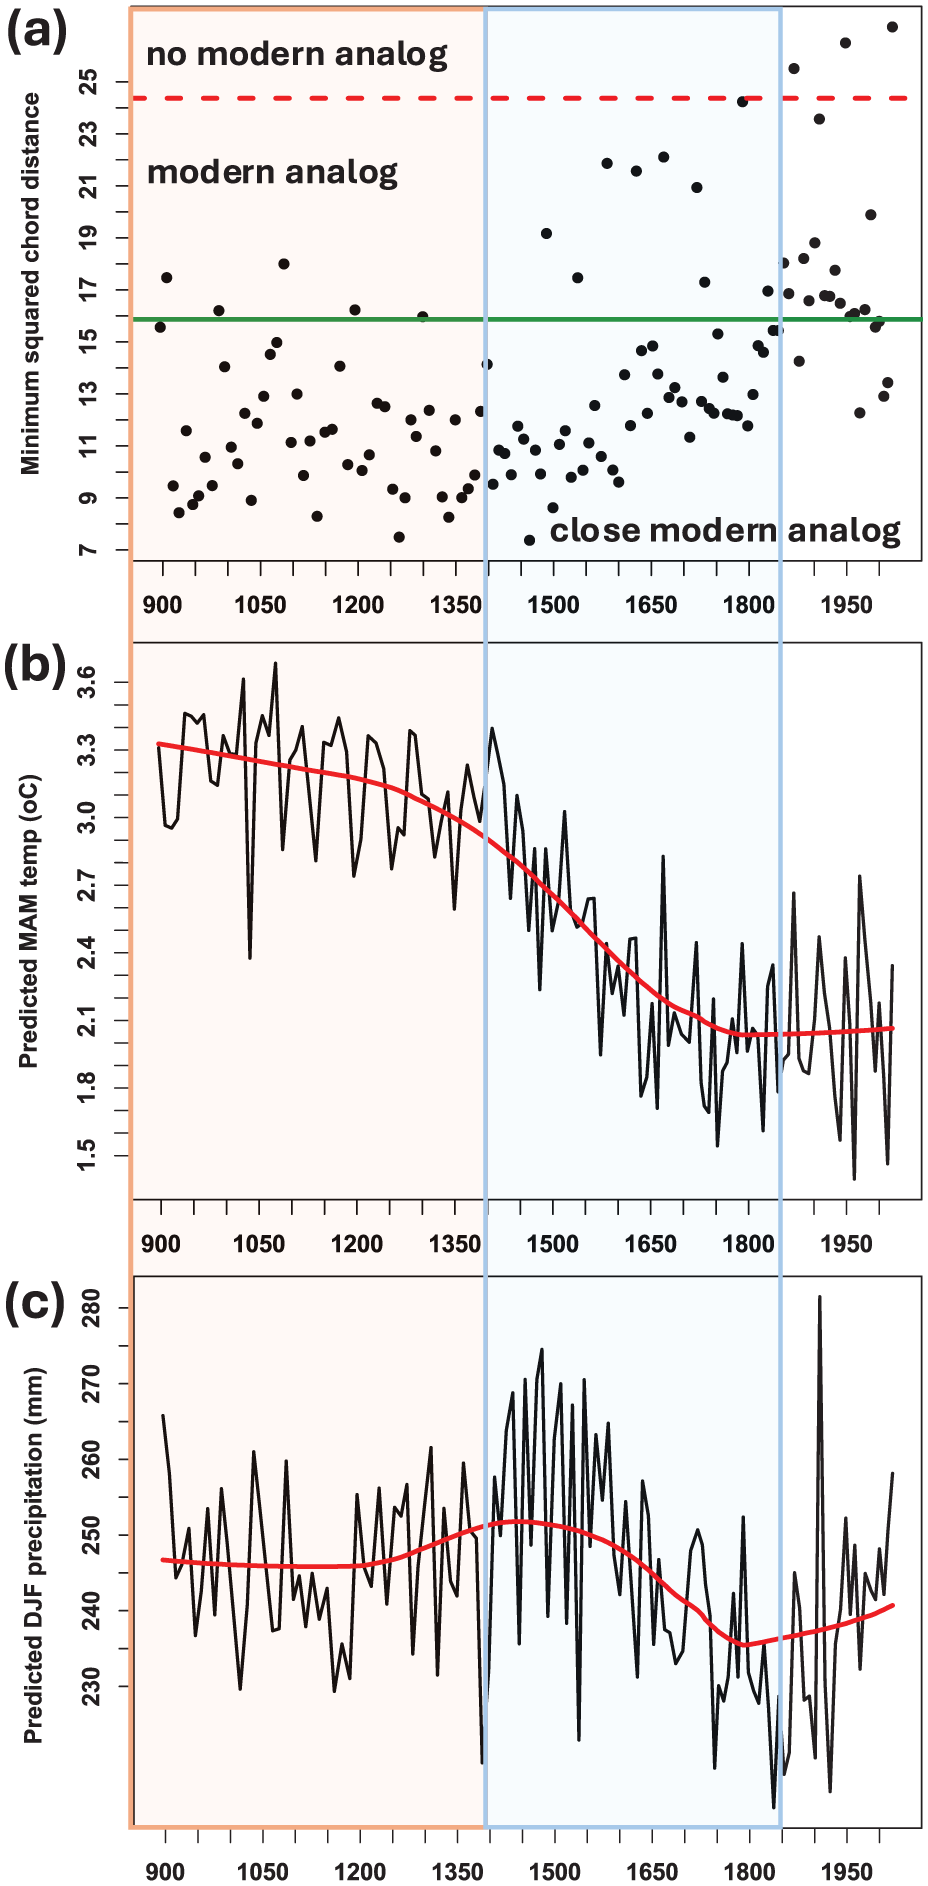
Pollen-based climate reconstructions from Fish Lake, New Brunswick: (a) minimum squared chord distances for the Fish Lake pollen samples to the Maritimes pollen-climate calibration set (b) March-April-May temperature (°C), and (c) December-January-February precipitation (mm). For (a) values less than the solid green line at 15.87 (the fifth percentile of distances within the calibration set) mean that a close modern analog exists in the calibration set, values less than the dashed red line at 24.37 (the 20th percentile of distances within the calibration set) mean that modern analogs exist in calibration set), and values greater than the dashed red line mean that no modern analogs exist in the calibration set. The orange shading denotes the Medieval Climate Anomaly and blue shading denotes the Little Ice Age.
Macrocharcoal analysis
In total, 249 macrocharcoal samples were counted from the Fish Lake core. Macrocharcoal content varied from 0 (8 samples) to 98 pieces per sample, with a mean of 9.1 and a median of 7.0 pieces per sample (Figure 6a). The SNI was ⩾3 for the entire Fish Lake record (Figure 6b) and there were good fits between the noise component of CHAR and the Gaussian mixture models in 88% of the record as assessed by the Kolmogorov-Smirnov test. The mean and median interpolated charcoal accumulation rates were 3.0 × 104 μm2/cm2·yr and 1.5 × 104 μm2/cm2·yr, respectively (Figure 6c). CharAnalysis identified 19 local fire peaks in the Fish Lake core that occurred in AD 1068, 1093, 1113, 1128, 1298, 1338, 1368, 1433, 1448, 1478, 1493, 1538, 1593, 1638, 1703, 1733, 1818, 1893, and 2023. The dates of the four fires with the highest macrocharcoal accumulation rates were: AD 1068, 1298, 1818, and 1893. Background charcoal increased over the last 200 years relative to the earlier record (Figure 6c). Local fires occurred more frequently in the LIA than in the MCA, as there were 7 fires in the MCA (AD 900–1400) with a mean FRI (fire return interval) of 67 years with a standard deviation of 71 years, versus 10 fires in the LIA (AD 1400–1850) with a mean FRI of 43 years with a standard deviation of 23 years (Figure 6d). Overall, the mean FRI between AD 900–2023 was 59 years with a standard deviation of 49 years, equivalent to 16.9 fires per millennium. (Note that because CharAnalysis uses interpolated dates, the dates are slightly different from those in the other analyses.)
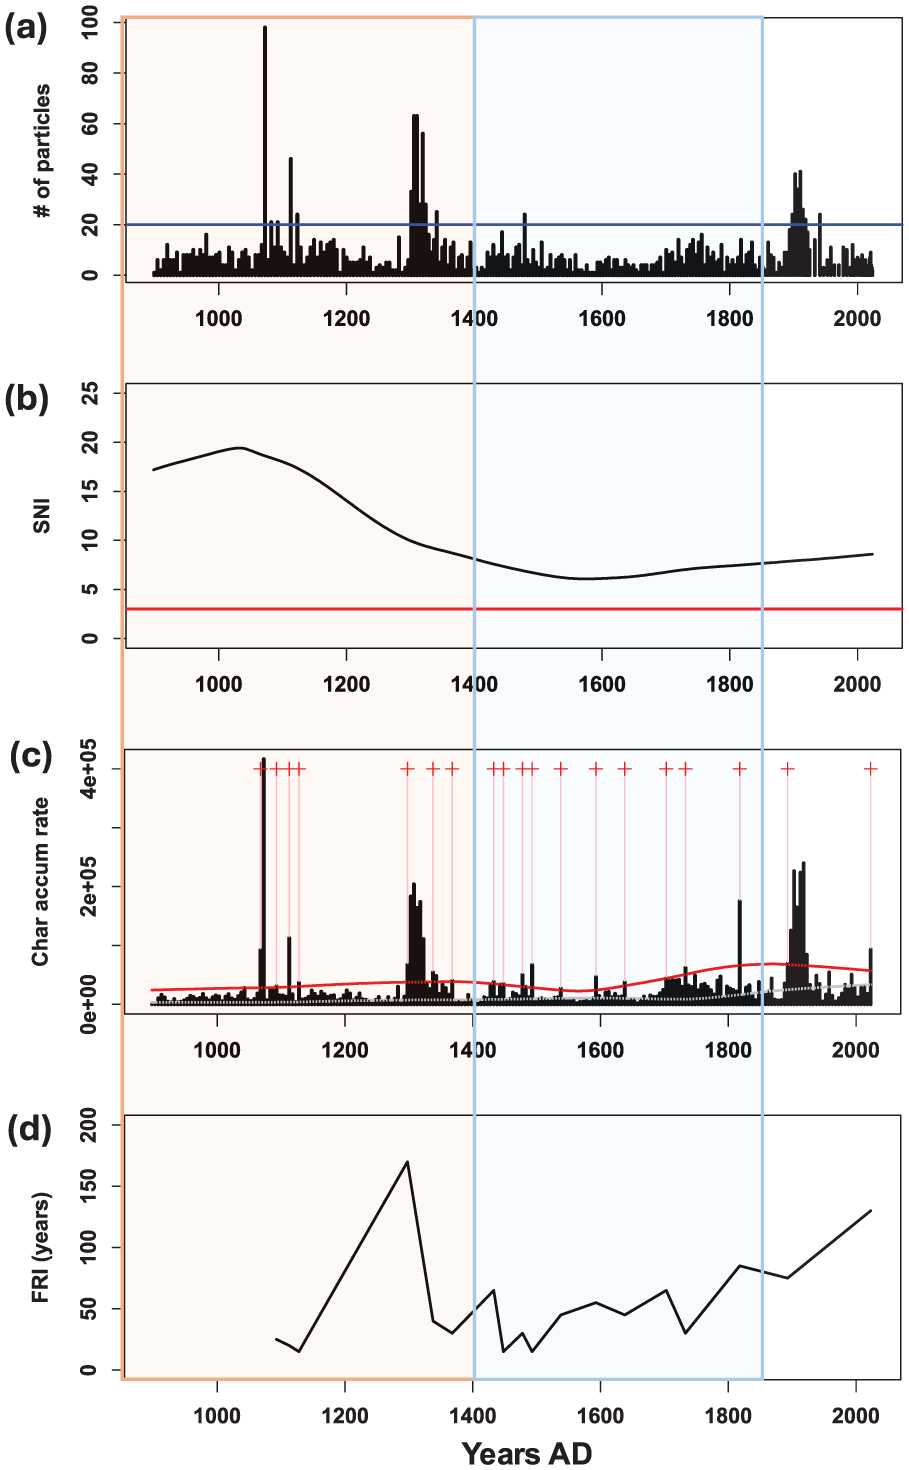
Fish Lake fire record for AD 900–2023. (a) Plot of the number of raw macrocharcoal particles counted per sample. (b) Plot of the smoothed signal-to-noise index (SNI), together with a red line at 3, the SNI cut-off. (c) Plot of the interpolated charcoal accumulation rate (μm2·cm−2·yr−1) record (black bars). Local fire peaks are marked by red crosses and pink vertical lines. The gray line shows background charcoal (BCHAR) and the red line marks the 99% threshold of the Gaussian noise models. (d) Plot of fire return intervals (FRIs). The orange shading denotes the Medieval Climate Anomaly and blue shading denotes the Little Ice Age.
Discussion
Synopsis
The Fish Lake Acadian Forest of the Medieval Climate Anomaly (AD 900–1400) was characterized by deciduous taxa, with Betula as the dominant taxa and Fagus grandifolia as an important sub-dominant (Figure 3 and Supplemental Figure S3). The close association of the Betula with F. grandifolia suggests that it was Betula alleghaniensis Britt. (yellow birch; Figures 3 and 4a and Supplemental Figure S3). Conifer taxa were present, that is, the three Picea species, the two Pinus sections, and Tsuga canadensis, but they were not dominants or sub-dominants. Seven local forest fires occurred, but fire return intervals could be relatively long, as much as 150 years (Figure 6c). The Fish Lake Acadian Forest of the Little Ice Age (AD 1400–1850) was characterized by coniferous taxa, that is, dominant Pinus diploxylon, with sub-dominants Pinus strobus, Picea mariana, Picea rubens, together with increasing amounts of Abies balsamea and decreasing amounts of T. canadensis. Deciduous Betula and F. grandifolia were present, but declining. Local fires became more frequent around Fish Lake, that is, 10 fires with regular, shorter fire return intervals of 43 years. The increase in fires would have contributed to the decline of T. canadensis, F. grandifolia and B. alleghaniensis as they are fire-intolerant, as well as late successional. The Fish Lake Acadian Forest of the later British colonial and modern periods was characterized by the rise of the disturbance taxa: Alnus alnobetula ssp. crispa and Alnus incana ssp. rugosa, Poaceae, Ambrosia and other herbs. Only two local fires occurred in these latter periods.
Climate change over the last millennium at Fish Lake
The Fish Lake spring MAM temperature reconstruction matched the coherent cooling pattern over the past 1000 years found in Marlon et al. (2017) which covers the northeastern United States (Figures 5b and 7a). Focusing more locally, our spring temperature reconstruction also closely corresponded to pollen-based mean summer (JJA) reconstructions from Gajewski (1988) who finds a shift from a warmer MCA to a colder LIA at ~AD 1450–1500 at Conroy Lake and Basin Pond in Maine (Figure 7b and c). High-resolution pollen-based reconstructions from four lakes in nearby Nova Scotia also show this temperature decline from the MCA to LIA (Gajewski et al., 2023; Neil et al., 2014). Wu et al. (2022) in their dinocyst-based summer sea surface temperature (SST) reconstruction from a core in the Laurentian Channel in the Gulf of the St. Lawrence offshore of New Brunswick find a steady cooling of ~3°C from AD 900 to AD 1850 (Figure 7d). Hence, our temperature reconstruction followed the coherent regional temperature decline, suggesting that the deciduous to coniferous shift in forest composition at Fish Lake was driven in part by this regional cooling.
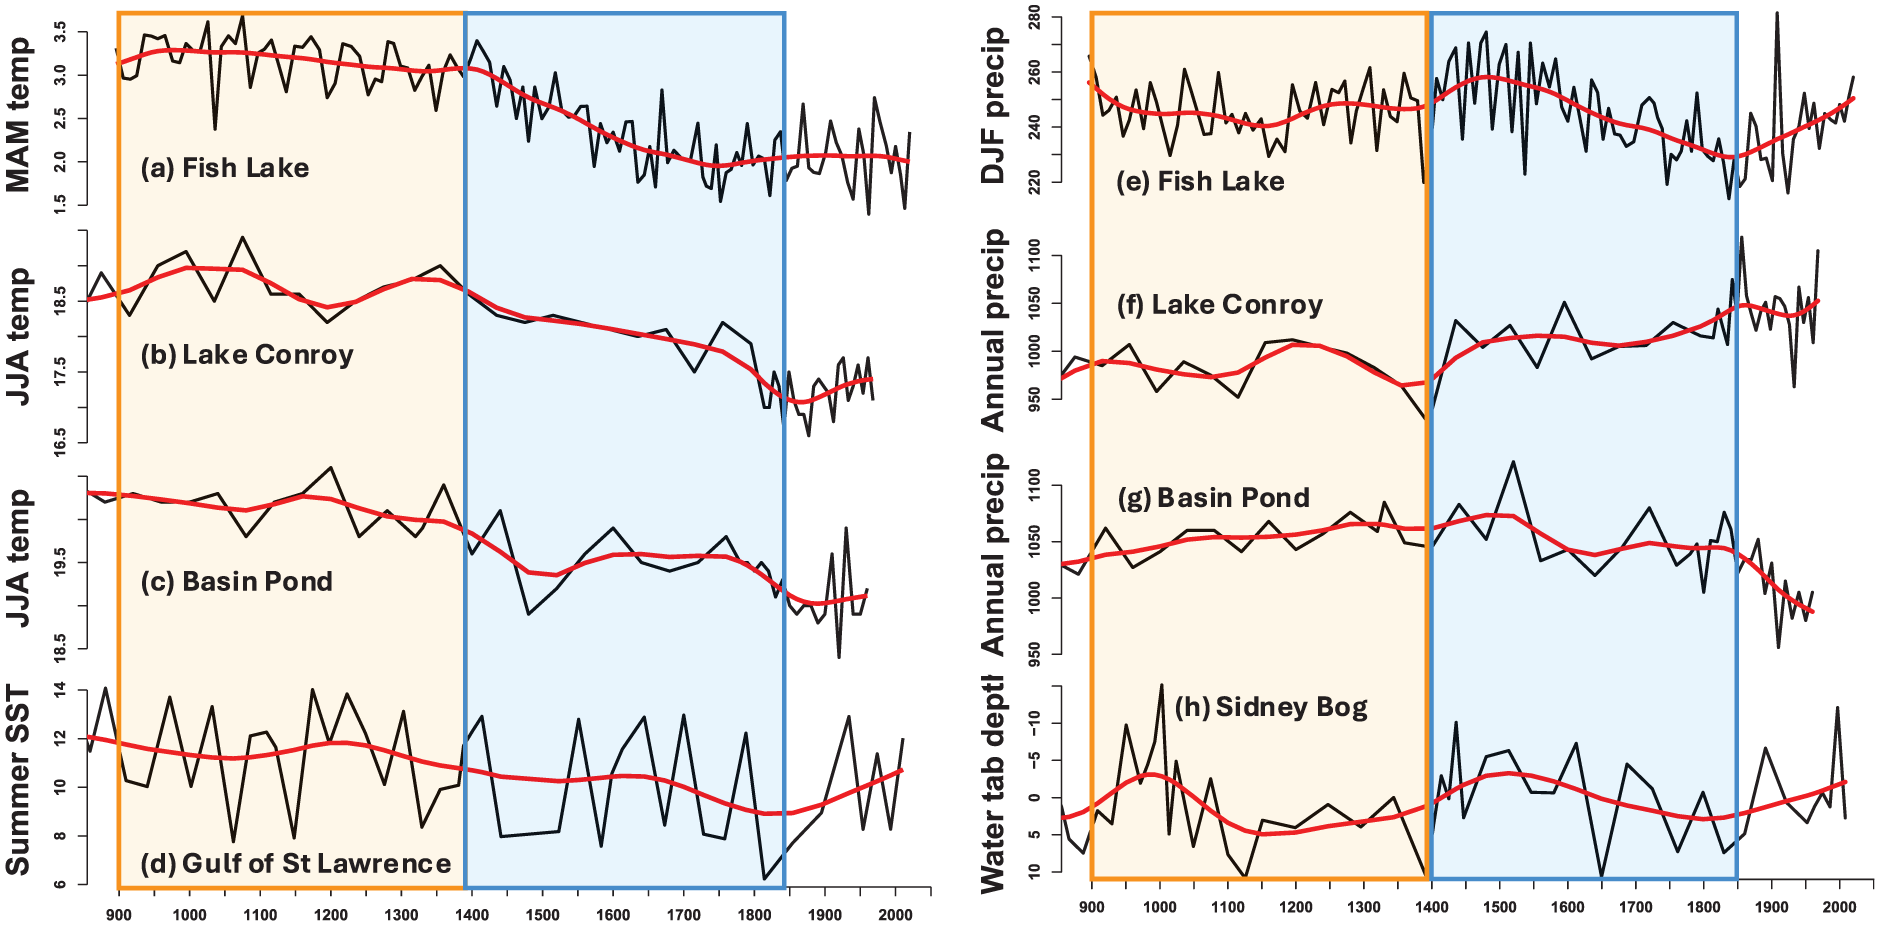
Lefthand side: reconstructed temperatures from high-resolution sites within 350 km of Fish Lake: (a) spring (MAM) temperature (°C) from this study, (b) mean summer (JJA) temperature (°C) from Conroy Lake, Maine (Gajewski, 1988), (c) mean summer (JJA) temperature (°C) from Basin Pond, Maine (Gajewski, 1988), and (d) summer sea-surface temperature (SST; °C) from dinocyst assemblages in the Gulf of St. Lawrence (Wu et al., 2022). Righthand side: reconstructed moisture from nearby high-resolution sites: (e) winter (DJF) precipitation (mm/season) from this study, (f) annual precipitation (mm/yr) from Conroy Lake, Maine (Gajewski, 1988), (g) annual precipitation (mm/yr) from Basin Pond, Maine (Gajewski, 1988), and (h) Sidney Bog, Maine, water table depth (cm) reconstruction residuals, with more negative residuals meaning wetter conditions (Clifford and Booth, 2013). Red line is a cubic smoothing spline (spar = 0.6). The orange shading denotes the Medieval Climate Anomaly, and blue shading denotes the Little Ice Age.
Additionally, the Fish Lake winter precipitation reconstruction somewhat matched the general increasing precipitation pattern of the most recent 1000 years for northern New England described in the reviews of Ladd et al. (2018), Marlon et al. (2017), and Shuman and Marsicek (2016), that is, a wet LIA relative to a drier MCA (Figure 7e–h). A winter pollen-based reconstruction may seem odd since vegetation is dormant at this time, but snowpack is crucial in New Brunswick for soil moisture recharge for the subsequent growing season. Focusing on close high-resolution reconstructions, Gajewski (1988)’s pollen-based annual precipitation reconstruction from Conroy Lake, Maine, demonstrates this wetting trend over the past millennium (Figure 7f). Gajewski (1988)’s pollen-based annual precipitation reconstruction from Basin Pond, Maine, matches Fish Lake’s pattern of a wetter early LIA and a drier late LIA (Figure 7g), as does Clifford and Booth (2013)’s testate amebae-based water-table depth reconstruction from Sidney Bog, Maine (Figure 7h). Gajewski et al. (2023)’s pollen-based annual precipitation reconstruction from Chase Lake in western Nova Scotia shows a wetter MCA and early LIA versus a drier late LIA. Hence, this LIA wet precipitation trend was less coherent in northern New England than the cooling temperature one was. Some compiled records demonstrate opposite or mixed trends as both rain and snow are more heterogenous over small spatial scales than is temperature (Shuman and Marsicek, 2016). In sum, our winter precipitation reconstruction follows a general weak northern New England pattern, suggesting that the shifts in forest composition at Fish Lake are also being driven in part by regional LIA wetting, as well as by the stronger regional cooling. Therefore, together the late Holocene cooling and wetting trends in the northern New England and New Brunswick regions appear to be driving the forest composition changes at Fish Lake.
A few cautions must be raised with respect to the Fish Lake climate reconstructions. A major issue in doing climate reconstructions based upon modern pollen-climate calibration sets arises because human-caused landscape disturbance is so severe in much of the world (certainly in northern New England, the Maritimes, and southern Québec) that vegetation no longer reflects climate in the same way that it used to prior to this severe anthropogenic disturbance (Kujawa et al., 2016; St-Jacques et al., 2008, 2015). Hence, when transfer functions constructed using modern pollen-climate calibration sets are used for the inference of past climates of more pristine landscapes, unavoidable errors arise such as substantial climate signal bias and underestimation (St-Jacques et al., 2008, 2015). A further source of loss of sensitivity in our reconstructions arises from having to pool all Picea, all Pinus, all Alnus and all Acer species together, despite their different climate optima (Thompson et al., 2015) due to the low taxonomic resolution used by previous researchers whose compiled results form the pollen-climate calibration set (Whitmore et al., 2005). Despite issues existing with the precise values of our climate reconstructions, they are sufficiently reliable for comparison to the general patterns found in regional syntheses (e.g. Ladd et al., 2018; Marlon et al., 2017; Shuman and Marsicek, 2016).
Rise of Picea rubens
Conditions for the arrival of P. rubens, a pivotal species in the Acadian Forest, changed during the LIA. Red spruce is a long-lived, shade-tolerant conifer that defines the Acadian Forest today and has been a constant presence since European settlement (Dewolfe et al., 2005; Taylor et al., 2017). Hamburg and Cogbill (1988) identified warmer temperatures through the 1800s as a possible agonist reducing the populations of red spruce in New Hampshire resulting in fragmented populations, especially along cooler coastal areas, for this research, coastal Maine is the most significant (Schauffler and Jacobson, 2002). Bashalkhanov et al. (2023) suggests that red spruce may have hybridized with the hardier Picea mariana in these smaller coastal populations, giving red spruce the hardiness necessary to move inland and northward toward Fish Lake.
During the mid-Holocene, red spruce was rare throughout the Northeast (Watts, 1979). The Holocene refugia for red spruce during this hiatus from 8000 to 3000 BP are unclear, but at least one refugium was along the Atlantic coast in the Maritimes and Maine (Lindbladh et al., 2003; Schauffler and Jacobson, 2002). Gajewski et al. (2023) observed an increase in Picea rubens/mariana in their three lakes in Nova Scotia during the most recent millenium, together with a corresponding decline in B. alleghaniensis, F. grandifolia and T. canadensis. Mott (1975) observed that red spruce emerged in the inland Acadian forest between 1000 and 2000 years ago, which is confirmed by the Fish Lake pollen record. This expansion was consistent with the rapid and synchronized population explosion in the last 2000 years in the mountains of the Northeast (Jackson and Whitehead, 1991; Spear, 1989). The factors allowing red spruce expansion into inland New Brunswick are unclear, but started before the cooling of the LIA and continued during the warming of the last 200 years. Regardless of the reason, the recent rise of spruce pollen throughout the area south of the current boreal forest zone was not the expansion of black spruce in the cooling of the Late-Holocene. The available regional evidence is somewhat scarce but speaks broadly to a coniferous shift in regional forest compositions, while regional climate reconstructions generally describe conditions amenable for red spruce growth in the Acadian forest during the LIA (Marlon et al., 2017; Wu et al., 2022).
This substantial coniferous shift occurred in a broader region than the Acadian Forest during the LIA. Paquette and Gajewski (2013) and Lafontaine-Boyer and Gajewski (2014) note an increase in Picea, together with declines in F. grandifolia and T. canadensis during the LIA in southwestern Québec, as does O’Neill-Sanger et al. (2021). Houle et al. (2012) similarly reports an abundance of Picea rubens in the LIA and a corresponding decline in Fagus grandifolia in Charlevoix, Québec.
Pre-European fire dynamics of the Acadian Forest at Fish Lake
It has been argued that the Acadian Forest of New Brunswick was simply too humid to experience frequent naturally occurring wildfires in the last millennium (De Lafontaine and Payette, 2012; Taylor et al., 2020). However, this study showed that the forest around Fish Lake experienced frequent forest fires, especially in the LIA (Figure 6c).
The MCA (AD 900–1400) at Fish Lake was characterized by warmer, drier regional conditions and a forest with a high proportion of hardwoods, particularly Betula and Fagus grandifolia (Figure 3 and Supplemental Figure S3). The fire record suggests fewer fires in the MCA than in the LIA (AD 1400–1850; Figure 6c). The relative paucity of fires in the MCA compared to in the LIA is also supported by the lower amounts of Alnus pollen (a pioneer species indicating disturbance and a more open canopy) in the MCA than in the LIA (Figure 3 and Supplemental Figure S3). This is counterintuitive given the warmer, drier MCA identified by multiple regional climate reconstruction studies (Marlon et al., 2017). A possible explanation is that the hardwood-heavy composition of the Acadian Forest at this time limited the conditions conducive to fire, as deciduous trees are generally less combustible than conifers on account of the greater moisture content of their leaves vis-à-vis conifer needles (Park et al., 2024).
Long MCA fire intervals also suggest that local Indigenous populations were not widely using fire as a land clearance technique locally. This, together with the limited indications of land disturbance in the pollen record (Figure 3 and Supplemental Figure S3), further supports research by Betts and Hrynick (2021) that suggests that Indigenous populations in the area did not practice extensive land clearing.
European impacts on the Acadian Forest: The French regime
French explorers in the latter half of the LIA identified the presence of both the tree taxa that we found and forest fires in the Acadian Forest, supporting our results. Nicolas Denys, the governor of the French Cape Breton Company, wrote in 1633 recounting the presence of “Oaks. . .[pines], [firs] of three sorts, [birches], [black birches], [aspens], [maples], [and ashes]” on the shores of what is now Annapolis Royal, Nova Scotia (Denys, 1908). In 1677, Father Leclercq commented on what was presumably the scars of a wildfire that had burned “two hundred and fifty leagues” near the modern community of Pabineau Falls, New Brunswick, noting that trees were blackened very high on their trunks (Hay, 1903).
The earliest surviving records of the population of the early French colonizers or Acadian settlers come from the census of 1671, recording 392 colonists (Massignon, 1947; Supplemental Figure S4). The Acadians primarily relied on fishing and fur trading for sustenance until equipment and especially horses arrived, facilitating the earliest known timbering industry in what is now New Brunswick. Their first sawmill was constructed in 1692 and the eastern white pine industry for ship’s masts started in 1695 (Hay, 1903). Our record’s first Ambrosia pollen in AD 1680 appears to have captured early Acadian agriculture (Figure 3 and Supplemental Figure S3), potentially from Fort Nashwaak, an Acadian garrison constructed near modern Fredericton in 1692 (Parks Canada, 2025). Post-1715, the Acadian economy shifted more toward agriculture and the increasing population may have spread and amplified Acadian land disturbances. The expulsion of the Acadians from the region in 1755 resulted in the widespread burning of Acadian farms and a broader attempt to stamp out the Acadian identity (Hynes, 1973). It is possible that our 1733 fire is this 1755 burning, though proving this conclusively given dating uncertainty would be difficult (Figure 6c). With the Acadians expelled from some of the best agricultural lands, the British began consolidating and stabilizing what would become known as New Brunswick in 1784. The wave of Loyalist refugees from New England after US independence, seeking new farms, received significant tracts of land that were once farmed by Acadians.
European impacts on the Acadian Forest: The British Colonial Period
Newly created New Brunswick marked a turning point for the anthropogenic disturbance regime impacting the Acadian Forest. Witness tree data from early British land surveyors in the nearby Miramichi basin identified spruce, birch, and fir as the common trees of the pre-Colonial regional forest (Aubé, 2008). At Fish Lake, disturbance indicators Poaceae, Ambrosia and other herbs reach their highest relative abundances and influxes in this period, as do pioneer successional A. incana ssp. rugosa and A. alnobetula ssp. crispa (Figure 3 and Supplemental Figure S3). The population of the British colony increased significantly with the arrival of American Loyalists and a more diversified economy, increased exploitation of regional natural resources, and a rapid expansion of timbering and shipbuilding operations occurred (Supplemental Figure S4). By 1835, major stands of eastern white pine were largely deforested (Austin, 1980). Timbering continued to adapt through-out the 19th century, with an opening of the American market to colonial timber products (Parenteau, 2013). Sawmills opened and closed through the 1800s (Austin, 1980), and by the beginning of the 20th century hydroelectric projects further industrialized New Brunswick’s timbering operations. This growth of both population and forestry in New Brunswick thus accelerated the transformation of the Acadian Forest in a manner concurrent with the borealization hypothesis posited by Noseworthy and Beckley (2020).
In Fredericton, the present-day provincial capital located 28 km from Fish Lake, English settlement began in 1785 with its transformation from Acadian Pointe-Sainte-Anne to the British administrative capital and garrison town and continued as the city’s logging industry grew. Like much of the rest of New Brunswick, Fredericton experienced cycles of booms and busts in the timbering industry and a surging population (Austin, 1980). Fredericton’s industrialization continued through the 1880s, epitomized by the city’s Gibson sawmill empire, and slowed by the dawn of the 20th century.
Several major fires during the English colonial period were visible in our macro-macrocharcoal record. The 1825 Miramichi fire burned one-fifth of the province and was the largest forest fire recorded in northeastern North America (MacEachern, 2020). Our study’s 1818 fire likely corresponds to it (Figure 6c). In Fredericton, the Gibson sawmill burned down in a major fire in 1893, which our macrocharcoal record records as occurring in this year. Major fires in Saint John, New Brunswick, took place in 1816, 1823, 1841, 1845, 1847, and 1871 (Stewart, 1877). Hence, historical records in New Brunswick contain ample record of fires in the 1800s, likely explaining the increase in background macrocharcoal found in the macrocharcoal record (Figure 6c).
Conclusions
Our study showed that the Acadian Forest at Fish Lake, New Brunswick, underwent a compositional shift from a mix of hardwoods and softwoods in the MCA to a more softwood-dominated forest in the LIA. Mott (1975)’s hypothesis that Picea rubens arrived in the interior of the Acadian Forest as a minor species between 1000 and 2000 years ago is likely correct, but the emergence of P. rubens as a major species at our site appeared to occur within the last 600–700 years. Our terrestrial climate reconstruction affirmed the regional temperature shifts found by Wu et al. (2022) offshore in the Gulf of the St. Lawrence and Marlon et al. (2017) in their New England synthesis, by showing a warmer, drier MCA and a cooler, wetter LIA. Our macrocharcoal study shows that the role of fire in shaping the Acadian Forest appears to have been much greater than previously expected by previous researchers. With fires being more frequent in the wet LIA than the dry MCA, the results suggest that the shift in forest composition from mixed deciduous/coniferous to coniferous played a greater role in intensifying the fire regime of the Acadian Forest than the temperature change did. The relationship between fire and vegetation in the Acadian Forest is informed by the increasing quantity of conifers, which burn more readily than deciduous trees with a higher moisture content and a lower content of inflammable chemicals.
This study also demonstrated the impacts of human habitation on the Acadian Forest. A lack of palynological and macrocharcoal evidence in the pre-European contact record supports the existing archeological consensus that the Maliseet and Mi’kmaq populations did not practice agriculture that required extensive land clearance (Betts and Hrynick, 2021). Evidence of Acadian colonization includes the first detection of Ambrosia pollen circa 1680 and a rise in early successional taxa such as Alnus and herbaceous pollen, while an increase in the number of fires recorded in the 19th century can be plausibly connected to the historical fire record of the timber industry in post-Expulsion New Brunswick and the increased human population. Our record furthers existing comprehension of the long history of the Acadian Forest, including its early modification by European settlers.
Supplemental Material
sj-pdf-1-hol-10.1177_09596836251378004 – Supplemental material for High-resolution forest and fire dynamics from Fish Lake, New Brunswick, Canada, during the last millennium
Supplemental material, sj-pdf-1-hol-10.1177_09596836251378004 for High-resolution forest and fire dynamics from Fish Lake, New Brunswick, Canada, during the last millennium by Ryan J Collins, Jeannine-Marie St-Jacques, Kelly A Kyle, Les C Cwynar and Charles V Cogbill in The Holocene
Footnotes
Acknowledgements
We thank Mario Theriault for his help in the field, as well as Maddie McIntyre, Cesar Vera Flores, and James Beaver for their assistance in the field and in the lab. We thank Jesse Vermaire and two anonymous reviewers whose helpful comments have made this a better manuscript.
Author contribution(s)
Funding
The authors disclosed receipt of the following financial support for the research, authorship, and/or publication of this article: We acknowledge the support of a NSERC CREATE Grant to Damon Matthews (PI) and J.M. St-Jacques (co-PI) and NSERC Discovery Grants to J.M. St-Jacques (RGPIN-2023-04813) and L. C. Cwynar (RGPIN-2021-2753).
Data availability statement
The pollen and charcoal data and reconstructions are available at the Neotoma (https://www.neotomadb.org/), Global Paleo-fire (https://paleofire.org/home), and the NOAA Paleoclimate (![]() ) websites, respectively.
) websites, respectively.
Supplemental material
Supplemental material for this article is available online.
References
Supplementary Material
Please find the following supplemental material available below.
For Open Access articles published under a Creative Commons License, all supplemental material carries the same license as the article it is associated with.
For non-Open Access articles published, all supplemental material carries a non-exclusive license, and permission requests for re-use of supplemental material or any part of supplemental material shall be sent directly to the copyright owner as specified in the copyright notice associated with the article.