
Abstract
Mesomediterranean vegetation with abundant evergreen broadleaved trees and shrubs is dominant along the coast of northern Greece. Well-dated palynological records are available from the inland submediterranean zone, where evergreen broadleaved trees and shrubs are absent or rare, but less is known about the vegetation history of the coastal area. For instance, it is unclear when and why evergreen broadleaved vegetation expanded during the Holocene. Here we present a new record from a mesomediterranean site, Limni Volvi, near the coast of the Aegean Sea. To understand Holocene vegetation history, we combined palynology, microscopic charcoal analysis and biogeochemical proxies (Ti, Ca, RABD655–680max). At the start of the Holocene, open steppe vegetation and high fire activity prevailed around Limni Volvi. Afforestation by deciduous trees was likely delayed compared to sites further inland, due to the lack of moisture at the start of the Holocene, but vegetation composition was generally similar (i.e. submediterranean), with barely any evergreen broadleaved element. Around 8150 cal. BP (6200 cal. BC) trees and shrubs declined in the open woodlands or parklands, and the landscape returned to steppe conditions at 8000 cal. BP (6050 cal. BC), likely because of drier and colder conditions during the “8.2 ka event.” Around the same time, cultural indicators suggest the start of Neolithic agriculture in the region. The present-day mesomediterranean vegetation with evergreen oaks only began to develop after 6000–5000 cal. BP (4050–3050 cal. BC), likely in response to increasing winter temperatures and reduced frost occurrence, further advantaged by human impact during the past 3600 years.
Introduction
Following an extended process of agricultural emergence in southwest Asia (Arranz-Otaegui et al., 2016; Asouti and Fuller, 2013; Behre et al., 2023; Bogaard et al., 2021; Weide et al., 2022) around the Aegean the shift to food production began about 9000–8500 years ago (Reingruber, 2017). About 8500 years ago, Neolithization reached Greek Macedonia, as evidenced by several Early Neolithic settlements situated on the western margin of the Thessaloniki plain, at that time the coastal zone of the Thermaic Gulf (Urem-Κotsou and Kotsos, 2020). Since the introduction of agriculture, land use profoundly altered vegetation over millennia. It led to the introduction of new species, the reduction and even extirpation of others, long-term deforestation, and the increase of native plants favoured by human disturbances (e.g. Behre et al., 2023; Bottema, 1982; Gassner et al., 2020). All this happened in a dynamic environment, with several climate oscillations reported for the Holocene that impacted the vegetation, but likely also influenced human actions (Gassner et al., 2020; Glais et al., 2023; Masi et al., 2018; Weninger et al., 2009). Probably the best known abrupt climatic changes of the Holocene are the “8.2 ka event” and the “4.2 ka event,” delimiting the Early from the Mid Holocene and the Mid from the Late Holocene, respectively (Alley et al., 1997; Lang et al., 2023a; Walker et al., 2019; Weiss et al., 1993). There are, however, many more cold and/or dry periods recorded for the eastern Mediterranean by various marine and terrestrial proxy records (see Figure 1 and references therein).
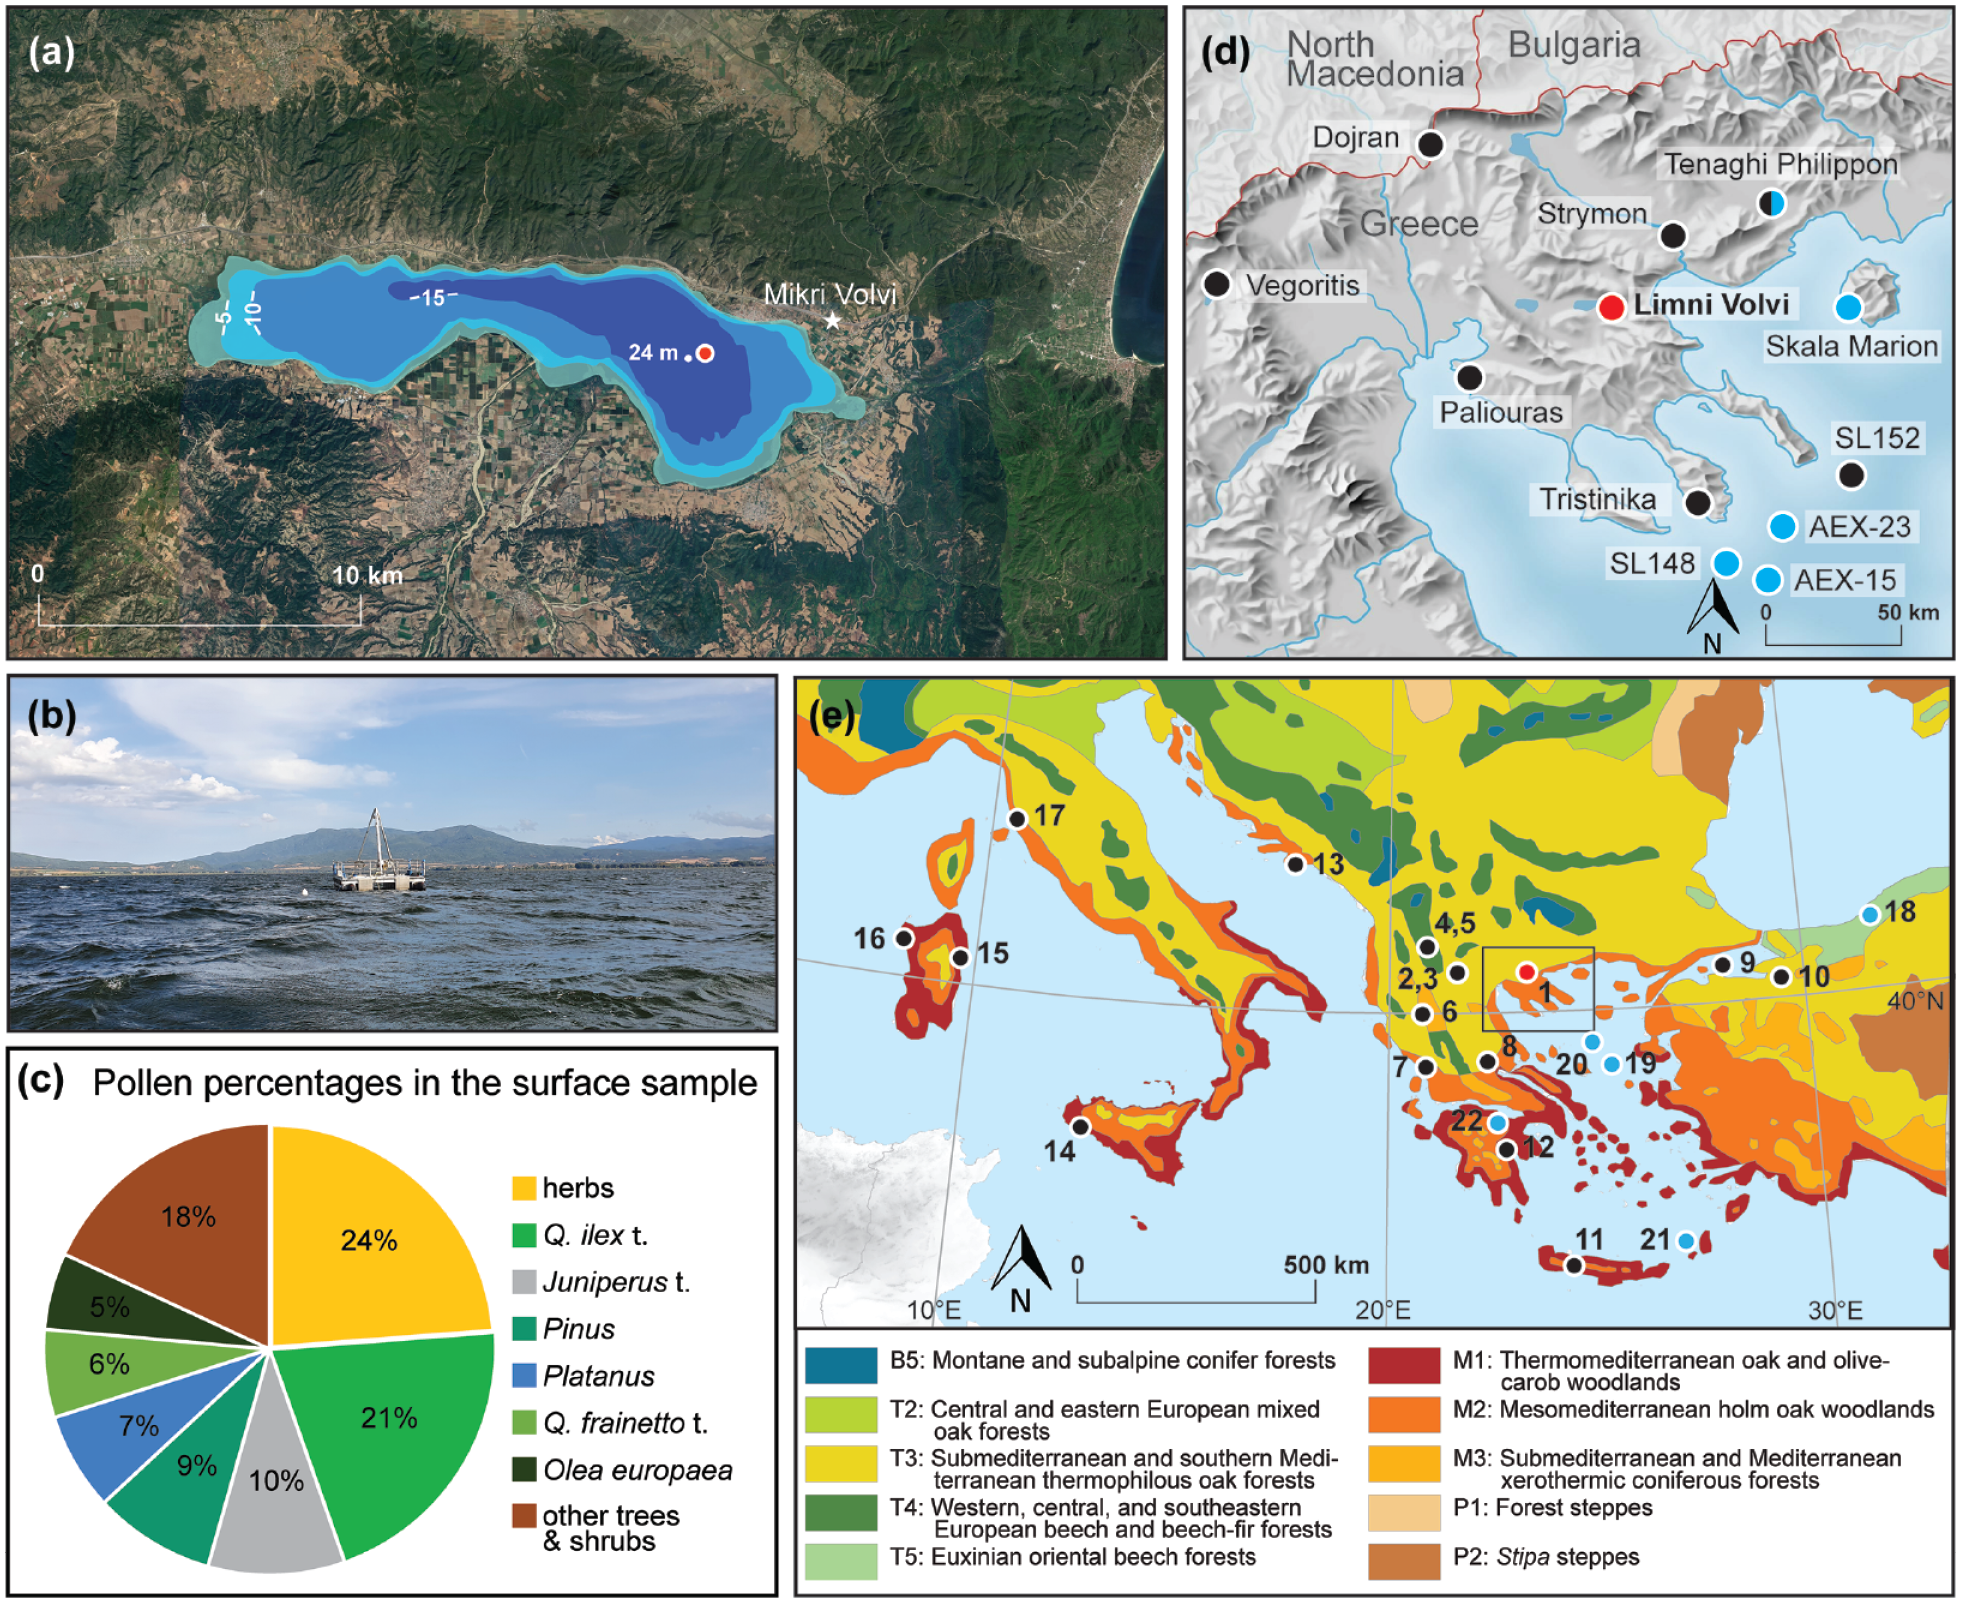
Overview over the study area. (a) Satellite picture of Limni Volvi (Google Earth Pro [7.3.6.9750]) overlain with the bathymetric map (modified from Papamarinopoulos, 1978). The red dot indicates the coring spot, the white star the location of the Neolithic settlement of Mikri Volvi (Kotsos and Urem-Kotsou, 2016). (b) Picture of the coring platform on Limni Volvi. (c) Pollen percentage composition of the surface sediment sample from Limni Volvi (Q. = Quercus, t. = type). (d) Limni Volvi (red dot), other relevant vegetation history records nearby (black dots): Lower Strymon Valley (Glais et al., 2023; Lespez et al., 2016), Tenaghi Philippon (Peyron et al., 2011; Pross et al., 2009; Turner and Greig, 1975; Wijmstra, 1969), Tristinika marsh (Panajiotidis and Papadopoulou, 2016), Paliouras Lagoon (Masci et al., 2022), marine core SL152 (Kotthoff et al., 2008a, 2008b), Lake Dojran (Masi et al., 2018), Limni Vegoritis (Bottema, 1982, Morales-Molino et al., 2024) and climate reconstructions (blue dots): speleothem record from Skala Marion (Psomiadis et al., 2018), marine sediment core SL148 (Ehrmann et al., 2007), marine sediment cores AEX-15 and AEX-23 (Giamali et al., 2019) and plant wax δD from Tenaghi Philippon (Schemmel et al., 2016, 2017). (e) Map of the modern natural potential vegetation for the central and eastern Mediterranean (modified after Bohn et al., 2003; Lang et al., 2023b) with important palynological sites for this study from the wider region (black dots): 1. Limni Volvi (Bottema, 1982; Masci et al., 2024; this study), 2. Limni Zazari (Gassner et al., 2020; van Vugt et al., in press), 3. Limni Orestiás (Kouli and Dermitzakis, 2008, 2010), 4. Limni Prespa (Panagiotopoulos et al., 2013; Wagner et al., 2010), 5. Lake Ohrid (Brechbühl et al., 2024; Sadori et al., 2016), 6. Limni Ioannina (Lawson et al., 2004), 7. Limni Voulkaria (Jahns, 2005), 8. Limni Xinias (Bottema, 1979), 9. Sea of Marmara (Valsecchi et al., 2012), 10. Lake Iznik (Miebach et al., 2016), 11. Limni Kournas (Jouffroy-Bapicot et al., 2021), 12. Limni Lerna (Jahns, 1993), 13. Malo Jezero (Jahns and van den Bogaard, 1998), 14. Gorgo Basso (Tinner et al., 2009), 15. Stagno di Sa Curcurica (Beffa et al., 2016), 16. Lago di Baratz, (Pedrotta et al., 2021), 17. Lago dell’Accesa (Colombaroli et al., 2008; Drescher-Schneider et al., 2007; Vannière et al., 2008) and climate reconstructions (blue dots): 18. Sofular cave (Fleitmann et al., 2009; Göktürk et al., 2011), 19. marine sediment core SL21 (Marino et al., 2009), 20. marine sediment core MNB-3 (Geraga et al., 2010; Gogou et al., 2007), 21. marine sediment core LC21 (Marino et al., 2009; Rohling et al., 2002), 22. Limnon cave (Peckover et al., 2019). The black square indicates the map excerpt shown in d).
A significant proportion of mainland northern Greece belongs to the submediterranean vegetation zone, with mixed deciduous oak forests, whereas mesomediterranean woodlands containing substantial proportions of evergreen oaks are only present as a band along the coast (Figure 1, Bohn et al., 2003; Lang et al., 2023b). Such differences in vegetation composition are a result of the rather steep altitudinal and thus temperature and moisture gradient and a rapid decline of oceanicity (and increase of continentality) with distance from the Aegean Sea (Čarni et al., 2018). Vegetation history and human impact are relatively well known for the cooler and more continental inland submediterranean vegetation of northern Greece (see Figure 1 and references therein), but a complete, well-dated Holocene record close to the coast of northern Greece, revealing mesomediterranean vegetation dynamics, is so far missing.
In our study, we address this scientific gap by analyzing Limni Volvi, situated in central Greek Macedonia in the mesomediterranean vegetation zone. The lake close to the coast of the Strymonian Gulf (ca. 9 km distance) is located on one of the main supposed routes of first agricultural spread into Europe (Maniatis et al., 2015). The uppermost 7 m of sediment from Limni Volvi have previously been analyzed by Bottema (1982) and Masci et al. (2024) and cover approximately the past 2500 years. These records documented a landscape strongly affected by human impact with various indicators of land use (e.g. Cerealia t., Juglans, Castanea, Olea; t. = type) and maquis vegetation (Q. ilex t., Ericaceae, Phillyrea) in alternation with episodes of forest recovery. However, when exactly farming started and how vegetation changed from a natural state at the beginning of the Holocene to the present-day cultural landscape, remains unstudied. Our study has the following aims: i) to reconstruct vegetation, fire, and environmental history of the entire Holocene at a mesomediterranean site close to the coast in northern Greece and to compare it to the dynamics at submediterranean sites further inland; ii) to assess the timing and impact of the first agricultural activities as well as their evolution over the Holocene; and iii) to track the timing and possible causes of the development of the current mesomediterranean vegetation. To address these aims, we present a new multiproxy record from Limni Volvi, combining palynology with microscopic charcoal analysis and biogeochemical proxies based on X-ray fluorescence (XRF) and hyperspectral imaging (HSI) for the last 11,700 years.
Study site
Limni Volvi (40°40′50″N, 23°27′40″E, 37 m a.s.l., Figure 1), situated about 40 km east of Thessaloniki in central Greek Macedonia, is the second largest lake in Greece (lake area: 68.6 km2, catchment: 1247 km2, maximum depth: 23.5 m; Stefanidis and Papastergiadou, 2012). The lake is of tectonic origin and covers the largest part of the Langadas basin (also called the Mygdonian basin). The basin is bordered to the north and south by hills and mountains, the highest peak being Mount Cholomon on Chalkidiki (1165 m a.s.l.). Limni Volvi and the adjacent Limni Koroneia, to the west, are remnants of a single lake that occupied the whole Langadas basin during the Pleistocene (Konidaris et al., 2021; Stefanidis et al., 2011). The bedrock of the basin is composed of gneiss, amphibolites, schist, granites, and marbles (Ibraheem et al., 2018; Rani et al., 2020). Volvi is today a meso- to eutrophic lake (Gantidis et al., 2007). To the east, it has a natural outflow (Richios River) to the Strymonian Gulf in the Thracian Sea. The whole area is designated as a National Park because of its high ecological significance and under further protection by the Ramsar Convention and the Natura 2000 network (Alexandridis et al., 2007). Annual precipitation at lake level amounts to about 400–500 mm (Meteosearch, 2024; Stefanidis et al., 2011; Tzimopoulos et al., 2018). Mean January and July temperatures are 3.8°C and 25.8°C, respectively (2008–2023, Langadas weather station at 87 m a.s.l., Meteosearch, 2024).
Today, the vegetation around Limni Volvi is mesomediterranean (Lang et al., 2023b), which is well reflected in the pollen composition of the sediment surface sample (Figure 1c). The following vegetation description is based on Konstandinidis and Tsiourlis (2003) and our own observations during fieldwork. The lakeshores are lined by extensive reed-beds (Phragmites australis). At lowest altitudes, up to 200–300 m a.s.l. most of the area around the lake is either under cultivation (e.g. cereals, maize, olive) or consists of maquis with evergreen species such as Quercus coccifera, Quercus ilex, Pistacia lentiscus, Erica arborea, Phillyrea latifolia, and Cistus spp. Around settlements, large degraded areas dominated by Q. coccifera are the result of centuries of grazing and logging (Konstandinidis and Tsiourlis, 2003). There are also a few remnants of riparian forests with Platanus orientalis, Alnus glutinosa, Populus, and Salix. At higher altitudes, between ca. 300 and 800 m a.s.l., the vegetation is dominated by submediterranean deciduous forests with Quercus frainetto, Quercus pubescens, and Castanea sativa followed by oromediterranean forests dominated by Fagus sylvatica, Fagus orientalis, and intermediate Fagus varieties at an altitude above ca. 800 m a.s.l. (Konstandinidis and Tsiourlis, 2003).
Material and methods
Coring, lithology and chronology
In 2020 and 2021, we retrieved six parallel sediment cores from Limni Volvi (coring location: 40°39′51.40″N, 23°32′30.70″E) at a water depth of 19.3 m using a UWITEC piston corer (6 cm diameter, Figure 1a and b). Additionally, we took four surface cores (0.2–1.2 m) using a UWITEC gravity corer. Four of the long cores (VOL-A, VOL-D, VOL-E, and VOL-F) and one surface core (VOL surface 3) were combined to a composite sequence of 19.65 m. Because sediment color and texture were overall quite uniform, we constructed the composite sequence using magnetic susceptibility measurements in addition to lithological marker horizons. The lithology was described according to Troels-Smith (1955). To find suitable short-lived terrestrial plant macrofossils for accurate radiocarbon dating (Rey et al., 2019, 2023), we sieved 477 sediment subsamples (thickness: 2 cm; volume: 5–13 cm3) through a 200 μm mesh. To facilitate sieving, clayey samples were deflocculated using sodium hexametaphosphate (Schwörer et al., 2017; Tchillingarian, 1952). We then identified plant remains under a stereomicroscope at 8–100× magnification, using published atlases (e.g. Cappers et al., 2006) as well as the reference collection at the University of Bern and plant specimens collected during fieldwork in Greece. Thirty-one macrofossil samples were radiocarbon-dated using accelerator mass spectrometry (AMS) at the laboratory for the analysis of radiocarbon using AMS (LARA) of the University of Bern (Table 1). We calibrated the radiocarbon dates to years before present (cal. BP) with the IntCal20 calibration curve (Reimer et al., 2020) and modeled the age–depth relationship with a Bayesian approach implemented in the package “rbacon” (version 3.2.0; Blaauw and Christen, 2011), which runs in R version 4.3.2 (R Core Team, 2023). The deposition time (acc.mean) was set to 6 year cm−1, otherwise the default settings were used. Additionally, we calculated an extended 95% confidence envelope using mixed-effect modeling according to Heegaard et al. (2005) which takes into account uncertainty of both the age and depth of samples.
Radiocarbon dates from Limni Volvi.
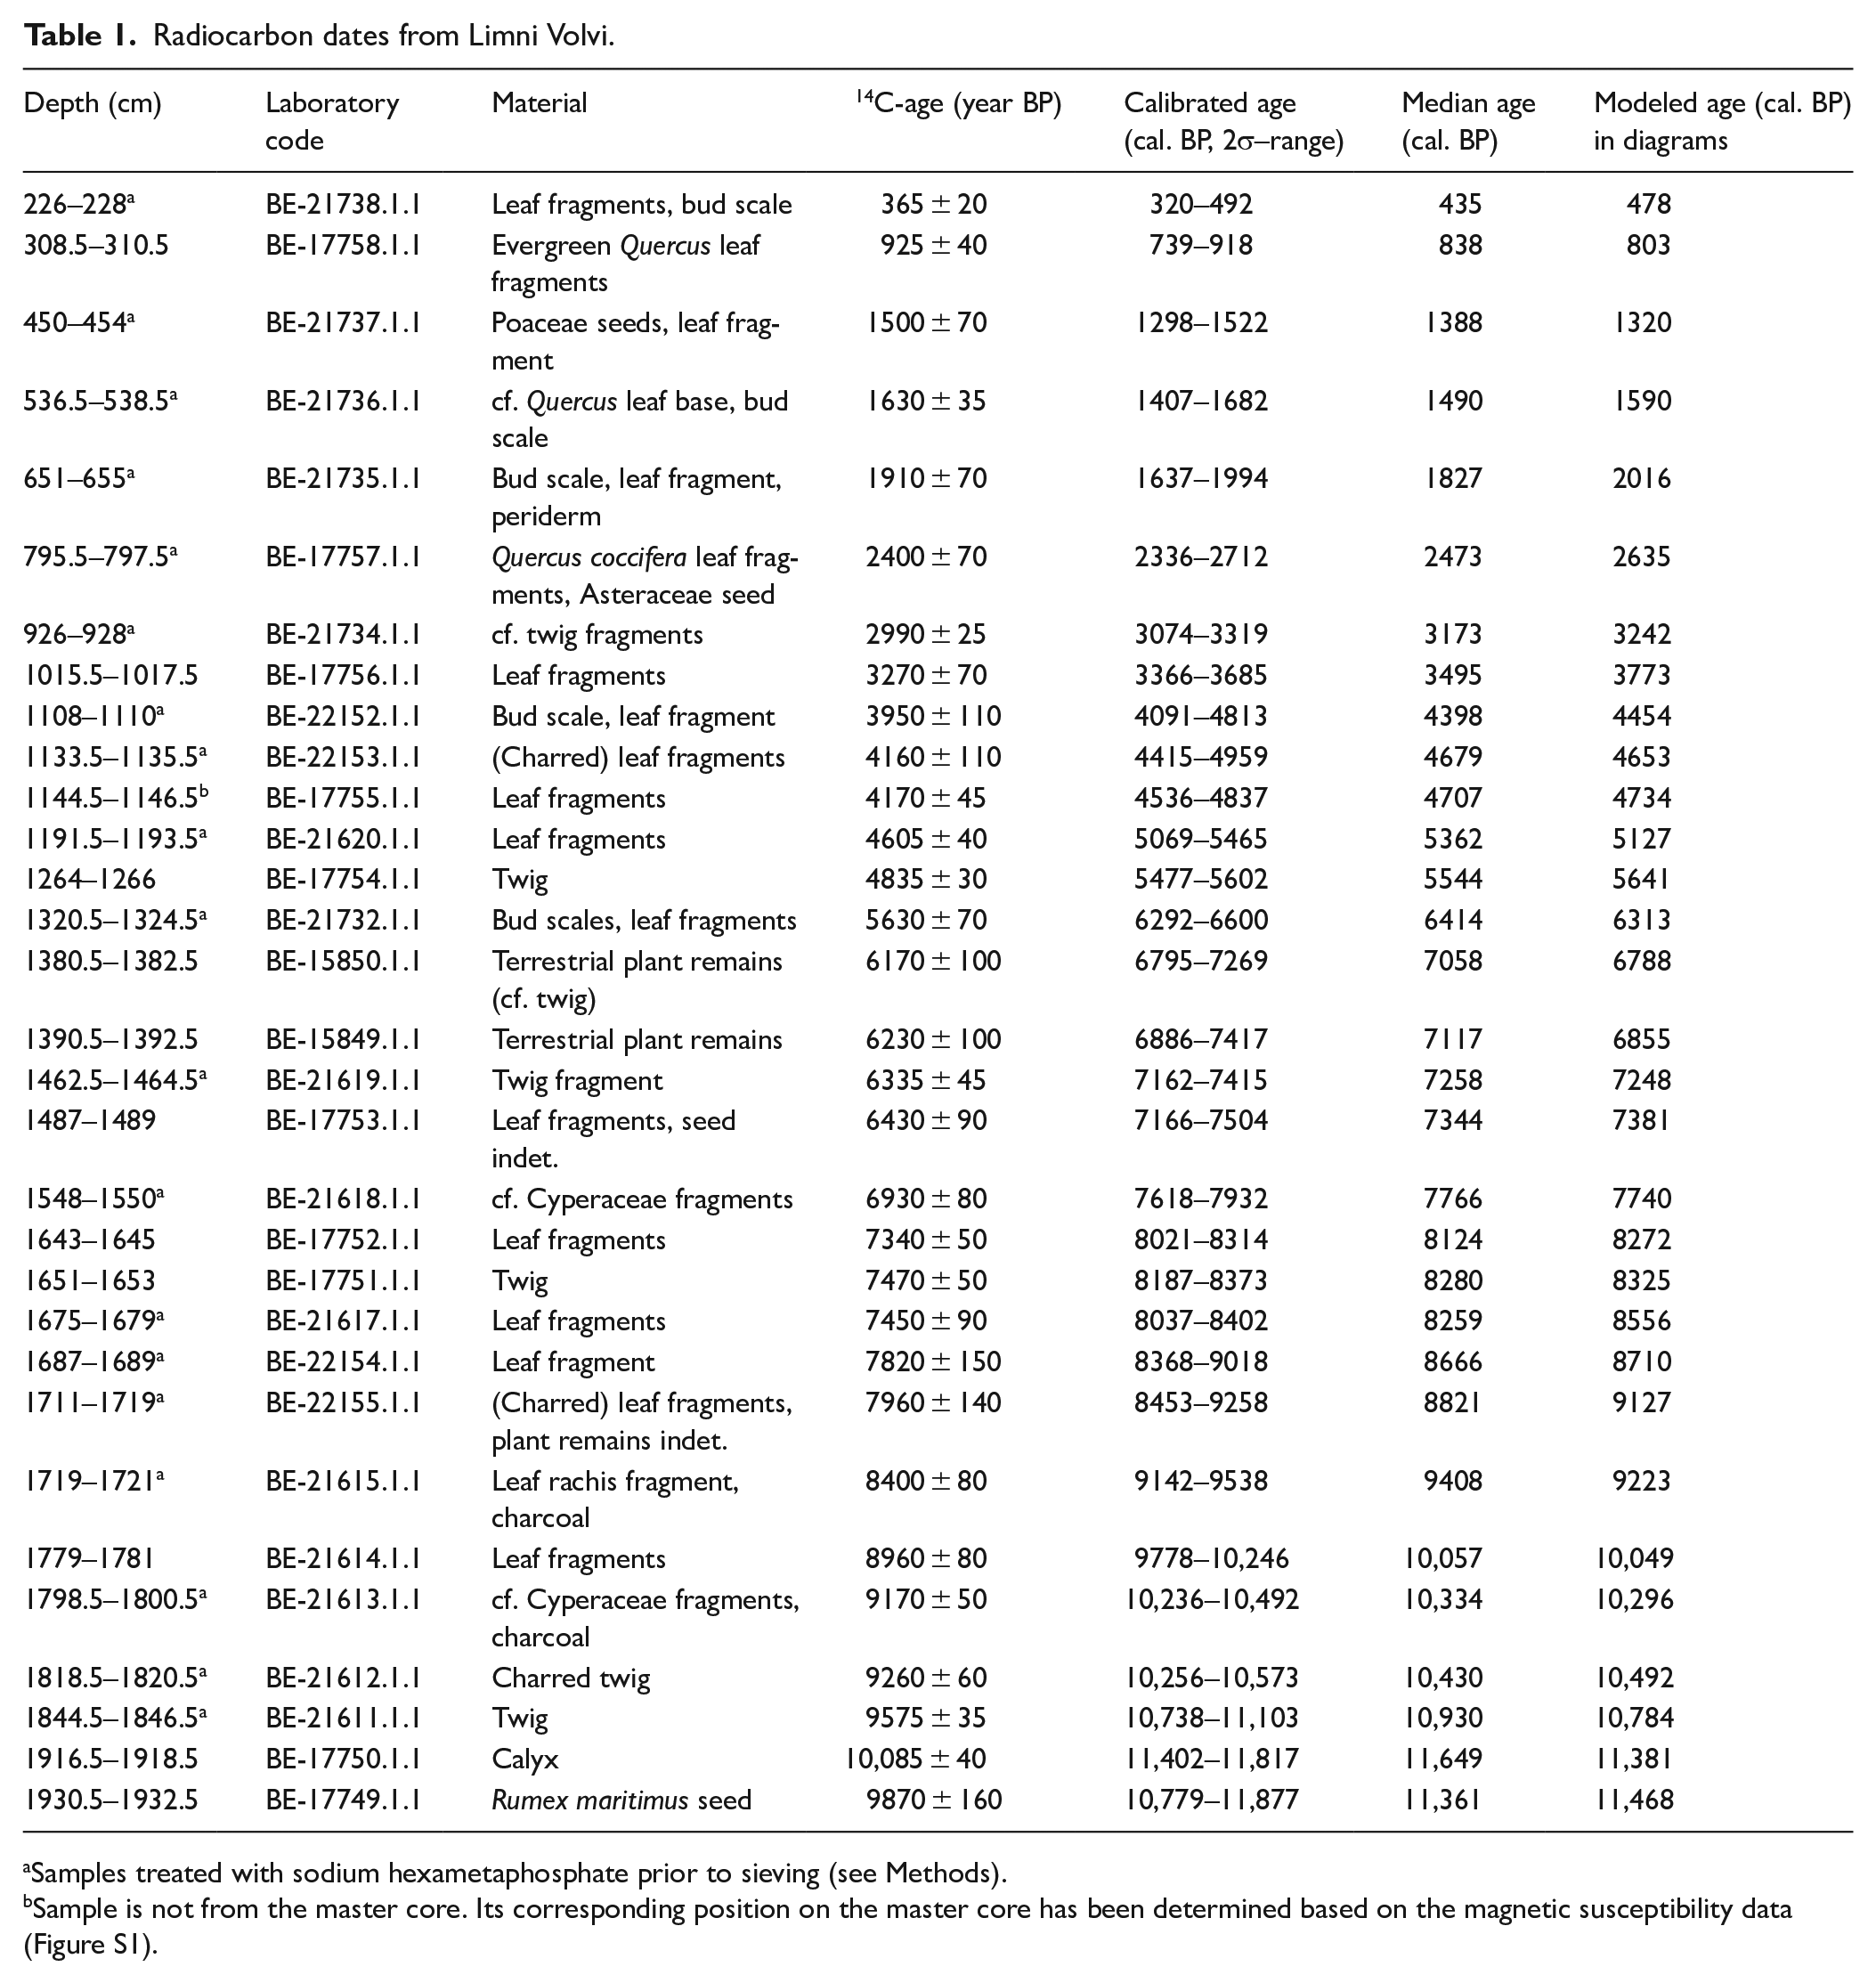
Samples treated with sodium hexametaphosphate prior to sieving (see Methods).
Sample is not from the master core. Its corresponding position on the master core has been determined based on the magnetic susceptibility data (Figure S1).
Biogeochemical analyses
We measured magnetic susceptibility (MS) at a 5-mm resolution, using a Bartington MS2E sensor. Elemental analysis of the sediment half-cores was performed at the Swiss Federal Institute of Aquatic Science and Technology (Eawag) with an AVAATECH X-ray fluorescence (XRF) core-scanner (AVAATECH XRF Technology, Dodewaard, The Netherlands) with a resolution of 5 mm. Low-energy elements from Al to Fe were measured at 10 kV with 1500 A and no filter, and exposed for 15 s. Mid-energy elements Cu to Mo were acquired using 30 kV setting, 2000 A, with Pd thin filter at 40 s count time. The X-ray was sourced using Oxford 100 Watt with a rhodium anode. The scanner had a Canberra X − PIPS/DSA 1000 (MCA) detector. We interpret titanium (Ti) as representing detrital input from the watershed, with higher values pointing toward higher erosion (Gassner et al., 2020; Panagiotopoulos et al., 2014; Vogel et al., 2010). To account for a potential matrix effect due to variations in sediment accumulation over time, Ti values are normalized to the deposition time (year cm−1). The natural logarithm of the ratio of calcium over titanium (ln(Ca/Ti)) indicates sedimentary endogenic calcite concentrations and is interpreted as a proxy for moisture and/or temperature with higher values indicating wetter and/or warmer conditions (van Vugt et al., in press).
Hyperspectral imaging (HSI) scans were performed using a Specim PFD-xx-V10E hyperspectral single core scanning system (Butz et al., 2015). The following settings were used for all scans: field of view: 109.33 mm; resolution: 0.0833 mm; exposure: 160 ms; tray speed: 0.5 mm s−1; frame rate: 6 hz; aperture: 1.9. Of the measured spectral indices, we will focus in this publication only on RABD655–680max. RABD655–680max is considered to reflect the relative abundance of chloropigments (green pigments) and is an index for the abundance of Chlorophyll-a and its degradation products from algal production (Zander et al., 2021). We use it here as a proxy for trends in net aquatic primary production (i.e. balance between what is produced minus what is degraded/respired before preservation), with higher values indicating higher trophic states (Michelutti et al., 2010; Michelutti and Smol, 2016). As with Ti, values of RABD655–680max are normalized to the deposition time (year cm−1). Original values of RABD655–680max, as well as element counts of Ca and Ti can be found in supplementary Figure S1.
Palynology and microscopic charcoal analysis
We took 115 sediment samples for pollen and microscopic charcoal analysis. Sample volume was 1 cm3. Sampling intervals range from 4 to 128 cm. Lycopodium tablets were added prior to sample treatment to estimate pollen concentrations (grains cm−3) and influx (= accumulation rates; grains cm−2 year−1; Stockmarr, 1971). Sediment subsamples were treated chemically (KOH, HCl, HF, and acetolysis) and physically (0.5 mm sieving and decanting) following standard procedures (Moore et al., 1991). Pollen, stomata, spores, and other non-pollen palynomorphs were stored in glycerin and counted under a light microscope with 400–1000× magnification, using published identification keys and photographic atlases (Beug, 2004; Finsinger and Tinner, 2020; Jankovská and Komárek, 2000; Moore et al., 1991; Reille, 1999; van Geel and Aptroot, 2006), as well as the reference collection of the University of Bern. With some exceptions listed below, pollen and spore taxonomy follows Moore et al. (1991), which is why we use, for example, Chenopodiaceae instead of Amaranthaceae. Quercus was differentiated after Beug (2004) into the two deciduous oak groups Q. frainetto t., including Q. frainetto, Q. petraea and Q. pubescens, and Q. cerris t., including Q. cerris and Q. trojana in the study region. The separation of Q. frainetto t. and Q. cerris t. is sometimes difficult and in case of uncertainty, pollen grains were assigned to Q. frainetto t. The evergreen Q. ilex t. includes Q. ilex and Q. coccifera. Well preserved Cerealia t. pollen grains ⩾40 µm were further distinguished into Avena t., Hordeum t., and Triticum t. after Beug (2004), using phase contrast and 1000× magnification. Additionally, also their size was noted and pollen grains were assigned to three different size classes after Bottema (1992): Group 1 (40–49 µm) includes domesticated species, as well as many wild grasses, Group 2 (50–59 µm) includes domesticated species, as well as various wild grasses, Group 3 (⩾60 µm) includes only domesticated species and no wild grasses (see also van Vugt et al., in press). The fungal spore Sporormiella t. that grows on the dung of large herbivores is used as a proxy for grazing (e.g. Baker et al., 2013). In all samples more than 500 terrestrial pollen grains were counted. The pollen, spore, and other non-pollen palynomorph curves in the diagrams are based on percentages calculated with respect to the terrestrial pollen sum, which includes pollen of trees, shrubs, and terrestrial herbs. To determine the statistically significant local pollen assemblage zones (LPAZ), optimal partitioning by minimal sum-of-squares (Birks and Gordon, 1985) and the broken-stick model (Bennett, 1996) were used in R v. 4.3.2 (R Core Team, 2023). Microscopic charcoal particles >10 μm were counted on the pollen slides following Tinner and Hu (2003) and Finsinger and Tinner (2005). Microscopic charcoal concentration (particles cm−3) and influx values (particles cm−2 year−1) were calculated as for pollen, and are used as a proxy for regional fire occurrence (e.g. Adolf et al., 2018; Conedera et al., 2009).
Numerical analysis
To quantify the effect of environmental variables on the vegetation we conducted redundancy analysis (RDA) on square root transformed and centered pollen percentage data. The analysis was done on the whole sequence as well as for the time period after the first archeological evidence of agriculture from the Langadas basin, which has been assigned to the end of the 7th millennium cal. BC (Urem-Κotsou and Kotsos, 2020; LPAZ 5–7; 8150 cal. BP – present, 6200 cal. BC – present). RDA was chosen because detrended correspondence analysis (DCA) axis 1 was rather short for both sequences (1.9 and 1.2 standard deviation units of turnover, respectively). As environmental variables we used Sporormiella t. influx as a proxy for grazing, microscopic charcoal influx as a proxy for fire activity, ln(Ca/Ti) as a proxy for moisture and/or temperature, January insolation (Laskar et al., 2004) and modeled mean January near-surface (2-m) air temperature from the CHELSA-TraCE21k 1.0 dataset (Karger et al., 2023) as proxies for winter temperatures (and frost occurrence), and July insolation (Laskar et al., 2004) and modeled mean July near-surface (2-m) air temperature from the CHELSA-TraCE21k 1.0 dataset (Karger et al., 2023) as proxies for summer temperatures (Laskar et al., 2004). We hypothesize that frost-sensitive species such as Q. ilex, Q. coccifera, and Olea europaea may have benefitted from decreasing frost occurrence and that grazing sensitive trees such as Tilia, Fraxinus, and Ulmus may have been disadvantaged during the Late Holocene. In order to explore the response of selected taxa to winter temperatures and frost occurrence (January insolation, mean January temperature) and grazing pressure (Sporormiella t. influx), we fitted generalized additive models (GAMs; Hastie and Tibshirani, 1990) assuming a Poisson distribution for the response variables and using a log link function with a maximum of two degrees of freedom. We chose the best fitting model improving the null model by using a stepwise selection based on the degrees of freedom and the Akaike Information Criterion (AIC). We used the program Canoco 5.1 (ter Braak and Šmilauer, 2017) to run RDA and fit taxon response curves.
Early agriculture is much more difficult to identify palynologically in the Mediterranean than in temperate Europe. Plant taxa producing pollen considered diagnostic of arable or pastoral farming, such as Cerealia t. and Plantago lanceolata t., are present naturally in the vegetation (Bottema, 1979, 1992; Turner et al., 2010). Therefore, to summarize human impact intensity, we used the agricultural land use probability index (LUP) proposed by Deza-Araujo et al. (2022), which intends to overcome such difficulties. The LUP index consists of the sum of the weighted pollen abundances of cultural indicator taxa and can be adapted to account for regional differences in plant distributions, abundances and agricultural practices (Deza-Araujo et al., 2022). Here, we used the default parameters proposed for the mesomediterranean vegetation zone.
To estimate changes in biodiversity over time, we calculated the palynological richness index (PRI; Birks and Line, 1992) using rarefaction analysis with a constant pollen sum of 504, and the probability of interspecific encounter (PIE; measure of evenness; Hurlbert, 1971). The closer PIE is to 1, the more evenly the taxa are distributed within the sample. To eliminate the effect of evenness on PRI, we also calculated the evenness-detrended palynological richness (DE-PRI; Colombaroli and Tinner, 2013) to estimate if palynological evenness may have affected PRI (Brechbühl et al., 2024; Senn et al., 2022). We used the software R v. 4.3.2 (R Core Team, 2023) for all numerical analyses, unless specified otherwise.
Results and interpretation
Lithology and chronology
Overall, the sediment is very inorganic, consisting mainly of silt and/or clay, with some gyttja (Figure 2, Table S1). Between 535.5 and 444.5 cm the sediment is silty and nearly palynologically sterile. The age-depth model suggests that our record goes back to 11,650 cal. BP (9700 cal. BC; Figure 2). Considering the large age uncertainties of the bottom dates (Table 1, Figure 2) and specifically the date of 10,085 ± 40 uncal. BP (11,817–11,402 cal. BP, 9867–9452 cal. BC) at a depth of 1918.5–1916.5 cm (i.e. almost 50 cm above the start of the sequence) the record may cover the entire Holocene, or even the Late Glacial–Holocene transition. The average deposition time over the whole core is 6.0 year cm−1 (min: 2.3 year cm−1, max: 19.3 year cm−1, median: 5.5 year cm−1; see also Figure S1). The relatively low deposition time is due to the huge catchment with numerous seasonal small rivers and streams feeding the lake with large quantities of particulate matter (Gantidis et al., 2007).
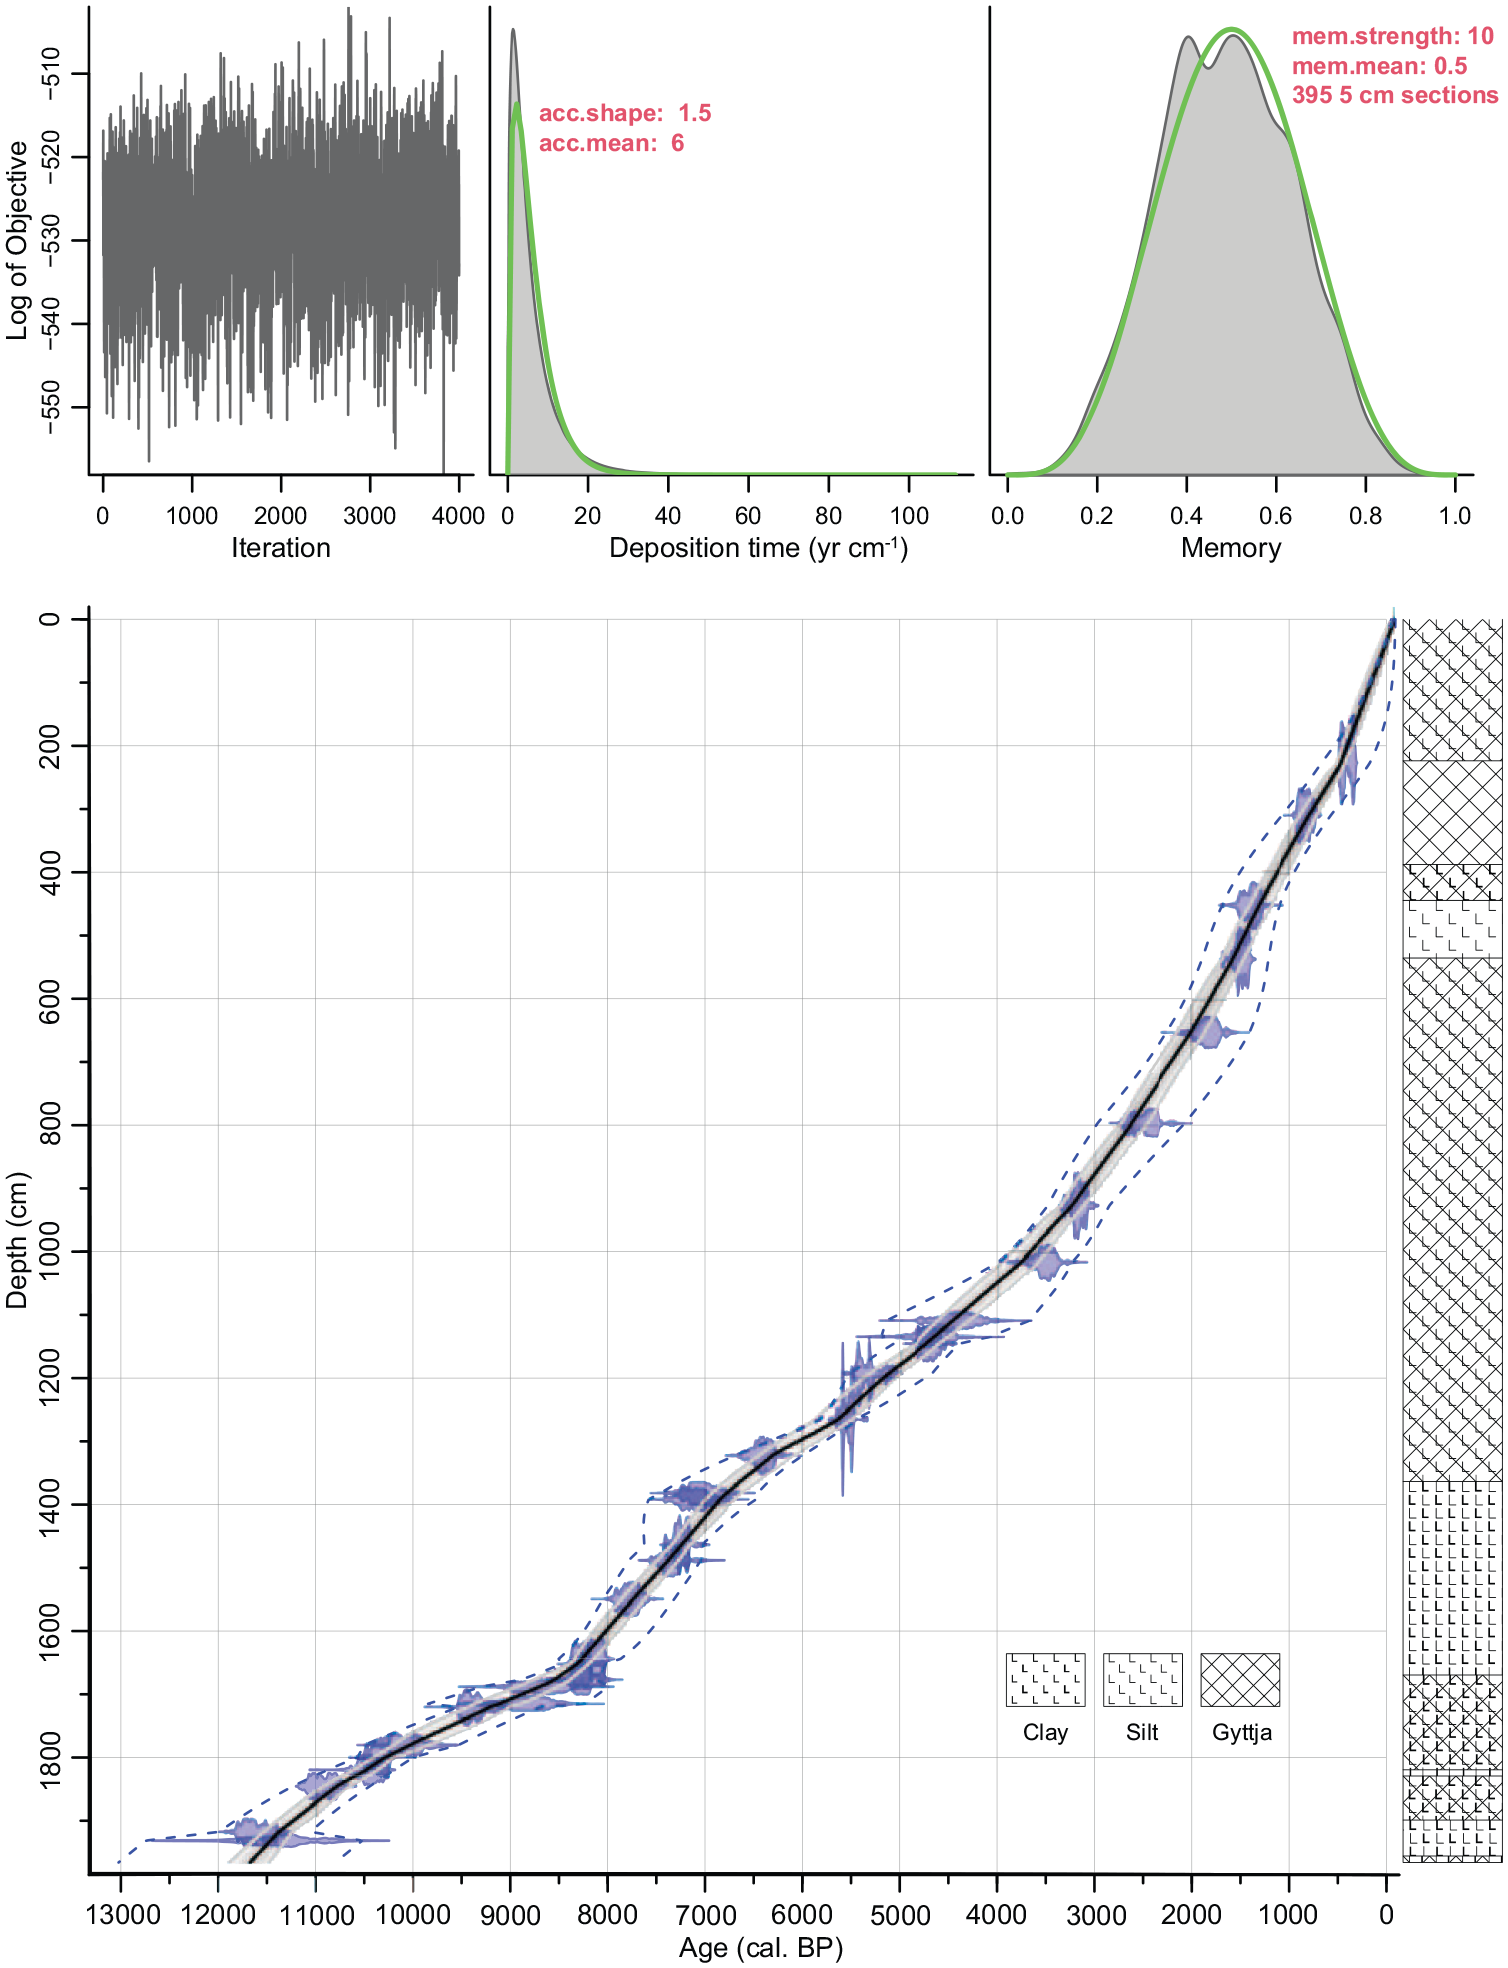
Age-depth model (left) and lithology (right) of the sediment record from Limni Volvi. The age-depth model was fitted using the Bayesian approach in “rbacon” (version 2.5.7, Blaauw and Christen, 2011). The deposition time (acc.mean) was set to 6 year cm−1, otherwise the default settings were used. Blue density plots = calibrated radiocarbon dates used to fit the model; solid black line = mean age–depth model; grey envelope = 95% confidence intervals of the model; blue dashed lines = 95% confidence interval of a mixed effect model taking into account between-object variance (calibration error and sample thickness, Heegaard et al., 2005). Top left: Number of Markov Chain Monte Carlo (MCMC) iterations used to generate the grey-scale graphs. Top middle: Prior (green) and posterior (grey) distributions of the sediment accumulation rates. Top right: Prior (green) and posterior (grey) distributions of memory (defines how much the accumulation rate of a particular depth depends on the depth above it).
Biogeochemical proxies
From the start of our record, ca. 11,650 cal. BP (9700 cal. BC) until ca. 11,400 cal. BP (9450 cal. BC), high values of titanium indicate high detrital input, whereas low ln(Ca/Ti) suggests rather dry and/or cold conditions (Figure 3). Relatively low values of RABD655–680max point toward rather low aquatic primary production. Between about 11,400 and 8600 cal. BP (9450 and 6650 cal. BC), detrital input is low (Ti) and ln(Ca/Ti) shows its highest values, indicating a decrease in detrital input and an increase in endogenic calcite content as a result of moist and warm climate. RABD655–680max decreases slightly until ca. 10,300 cal. BP (8350 cal. BC) and stays afterwards relatively constant on a low level until 8600 cal. BP (6650 cal. BC), indicating stable, but low aquatic primary production for this period. Starting at about 8600 cal. BP (6650 cal. BC), detrital input (Ti) increases again substantially, culminating in a peak at 8000 cal. BP (6050 cal. BC), a transient lowering and another peak at 7200 cal. BP (5250 cal. BC), before decreasing again (Figure 3). During the same period low ln(Ca/Ti) suggests that moisture and/or temperature decreased, starting 8600 cal. BP (6650 cal. BC), with a culmination of driest and/or coldest conditions around 8000 cal. BP (6050 cal. BC). Subsequently, moisture and/or temperature increased, declining again at 7200 cal. BP (5250 cal. BC). RABD655–680max also increases at 8600 cal. BP (6650 cal. BC) before decreasing again at 6800 cal. BP (4850 cal. BC), suggesting that the period between 8200 and 6800 cal. BP (6250–4850 cal. BC) was characterized by increasing aquatic primary production or higher trophic state. After 6700 cal. BP (4750 cal. BC), Ti is again relatively low, indicating a decrease in catchment erosion. At the same time, ln(Ca/Ti) increases, indicating again a moister and warmer climate until about 3700 cal. BP (1750 cal. BC). After 5600 cal. BP (3650 cal. BC) RABD655–680max slightly increases, suggesting minor raises in aquatic primary production. The past 3700 years are characterized by a strong increase in detrital input (Ti), interrupted only between 1400 and 500 cal. BP (AD 550 and 1450). Ln(Ca/Ti) decreases after 3700 cal. BP (1750 cal. BC), pointing toward a decrease in moisture and/or temperature. At the same time, RABD655–680max as a proxy for aquatic primary production and trophic state increases markedly to unprecedented levels, peaking during the past 500 years, and even further accelerated in the past ca. 50 years. Notable for the past two millennia is the increase in Ti between ca. 2000 and 1200 cal. BP (50 cal. BC and AD 750), culminating around 1400 cal. BP (AD 550) which is concurrent with a decrease in ln(Ca/Ti), pointing toward high erosional input and reduced moisture and/or temperature for this period (Figure 3).
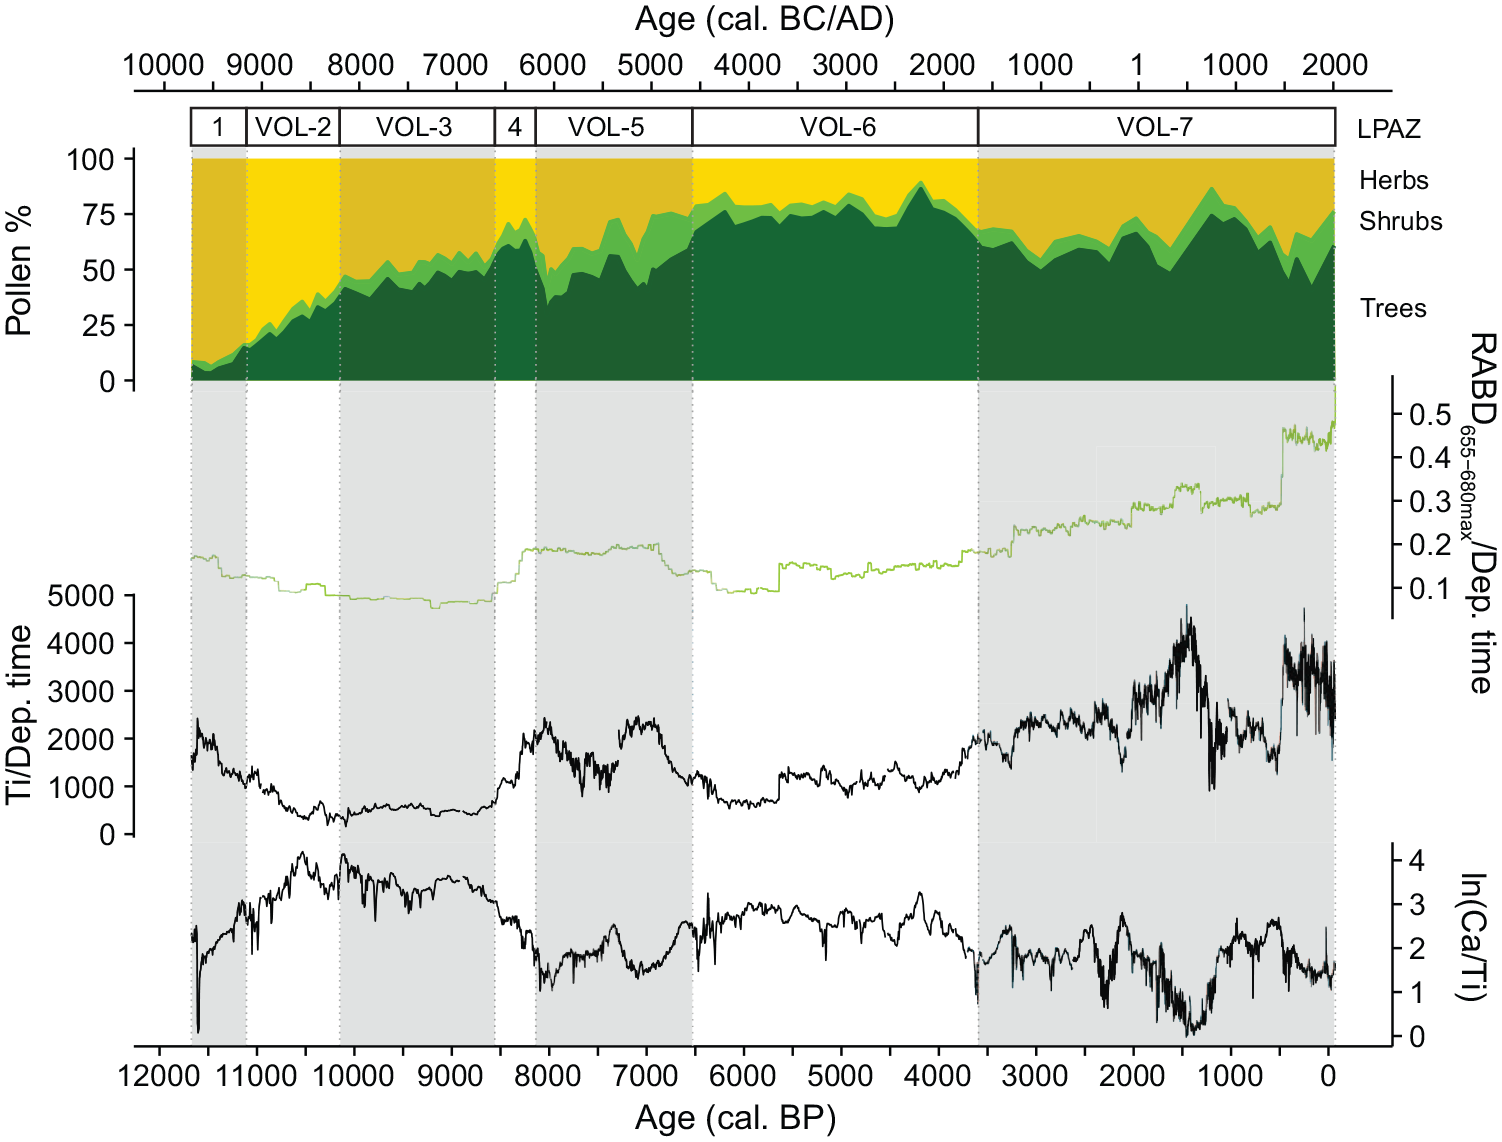
Comparison of the summary pollen diagram from Limni Volvi with RABD655–680max normalized by the deposition time (year cm−1) as a proxy for aquatic primary production, titanium (Ti, counts per second) normalized by the deposition time (year cm−1) as a proxy for detrital input, and the natural logarithm of Ca divided by Ti as a proxy for moisture and/or temperature. For better readability, every second local pollen assemblage zone (LPAZ) is shaded in grey.
Vegetation and fire history
The pollen record from Limni Volvi can be divided into seven statistically significant LPAZ (VOL-1 to VOL-7; Figure 4 and Figure S2). Below, we describe and interpret the main results of each LPAZ in terms of vegetation, fire, and land use history.
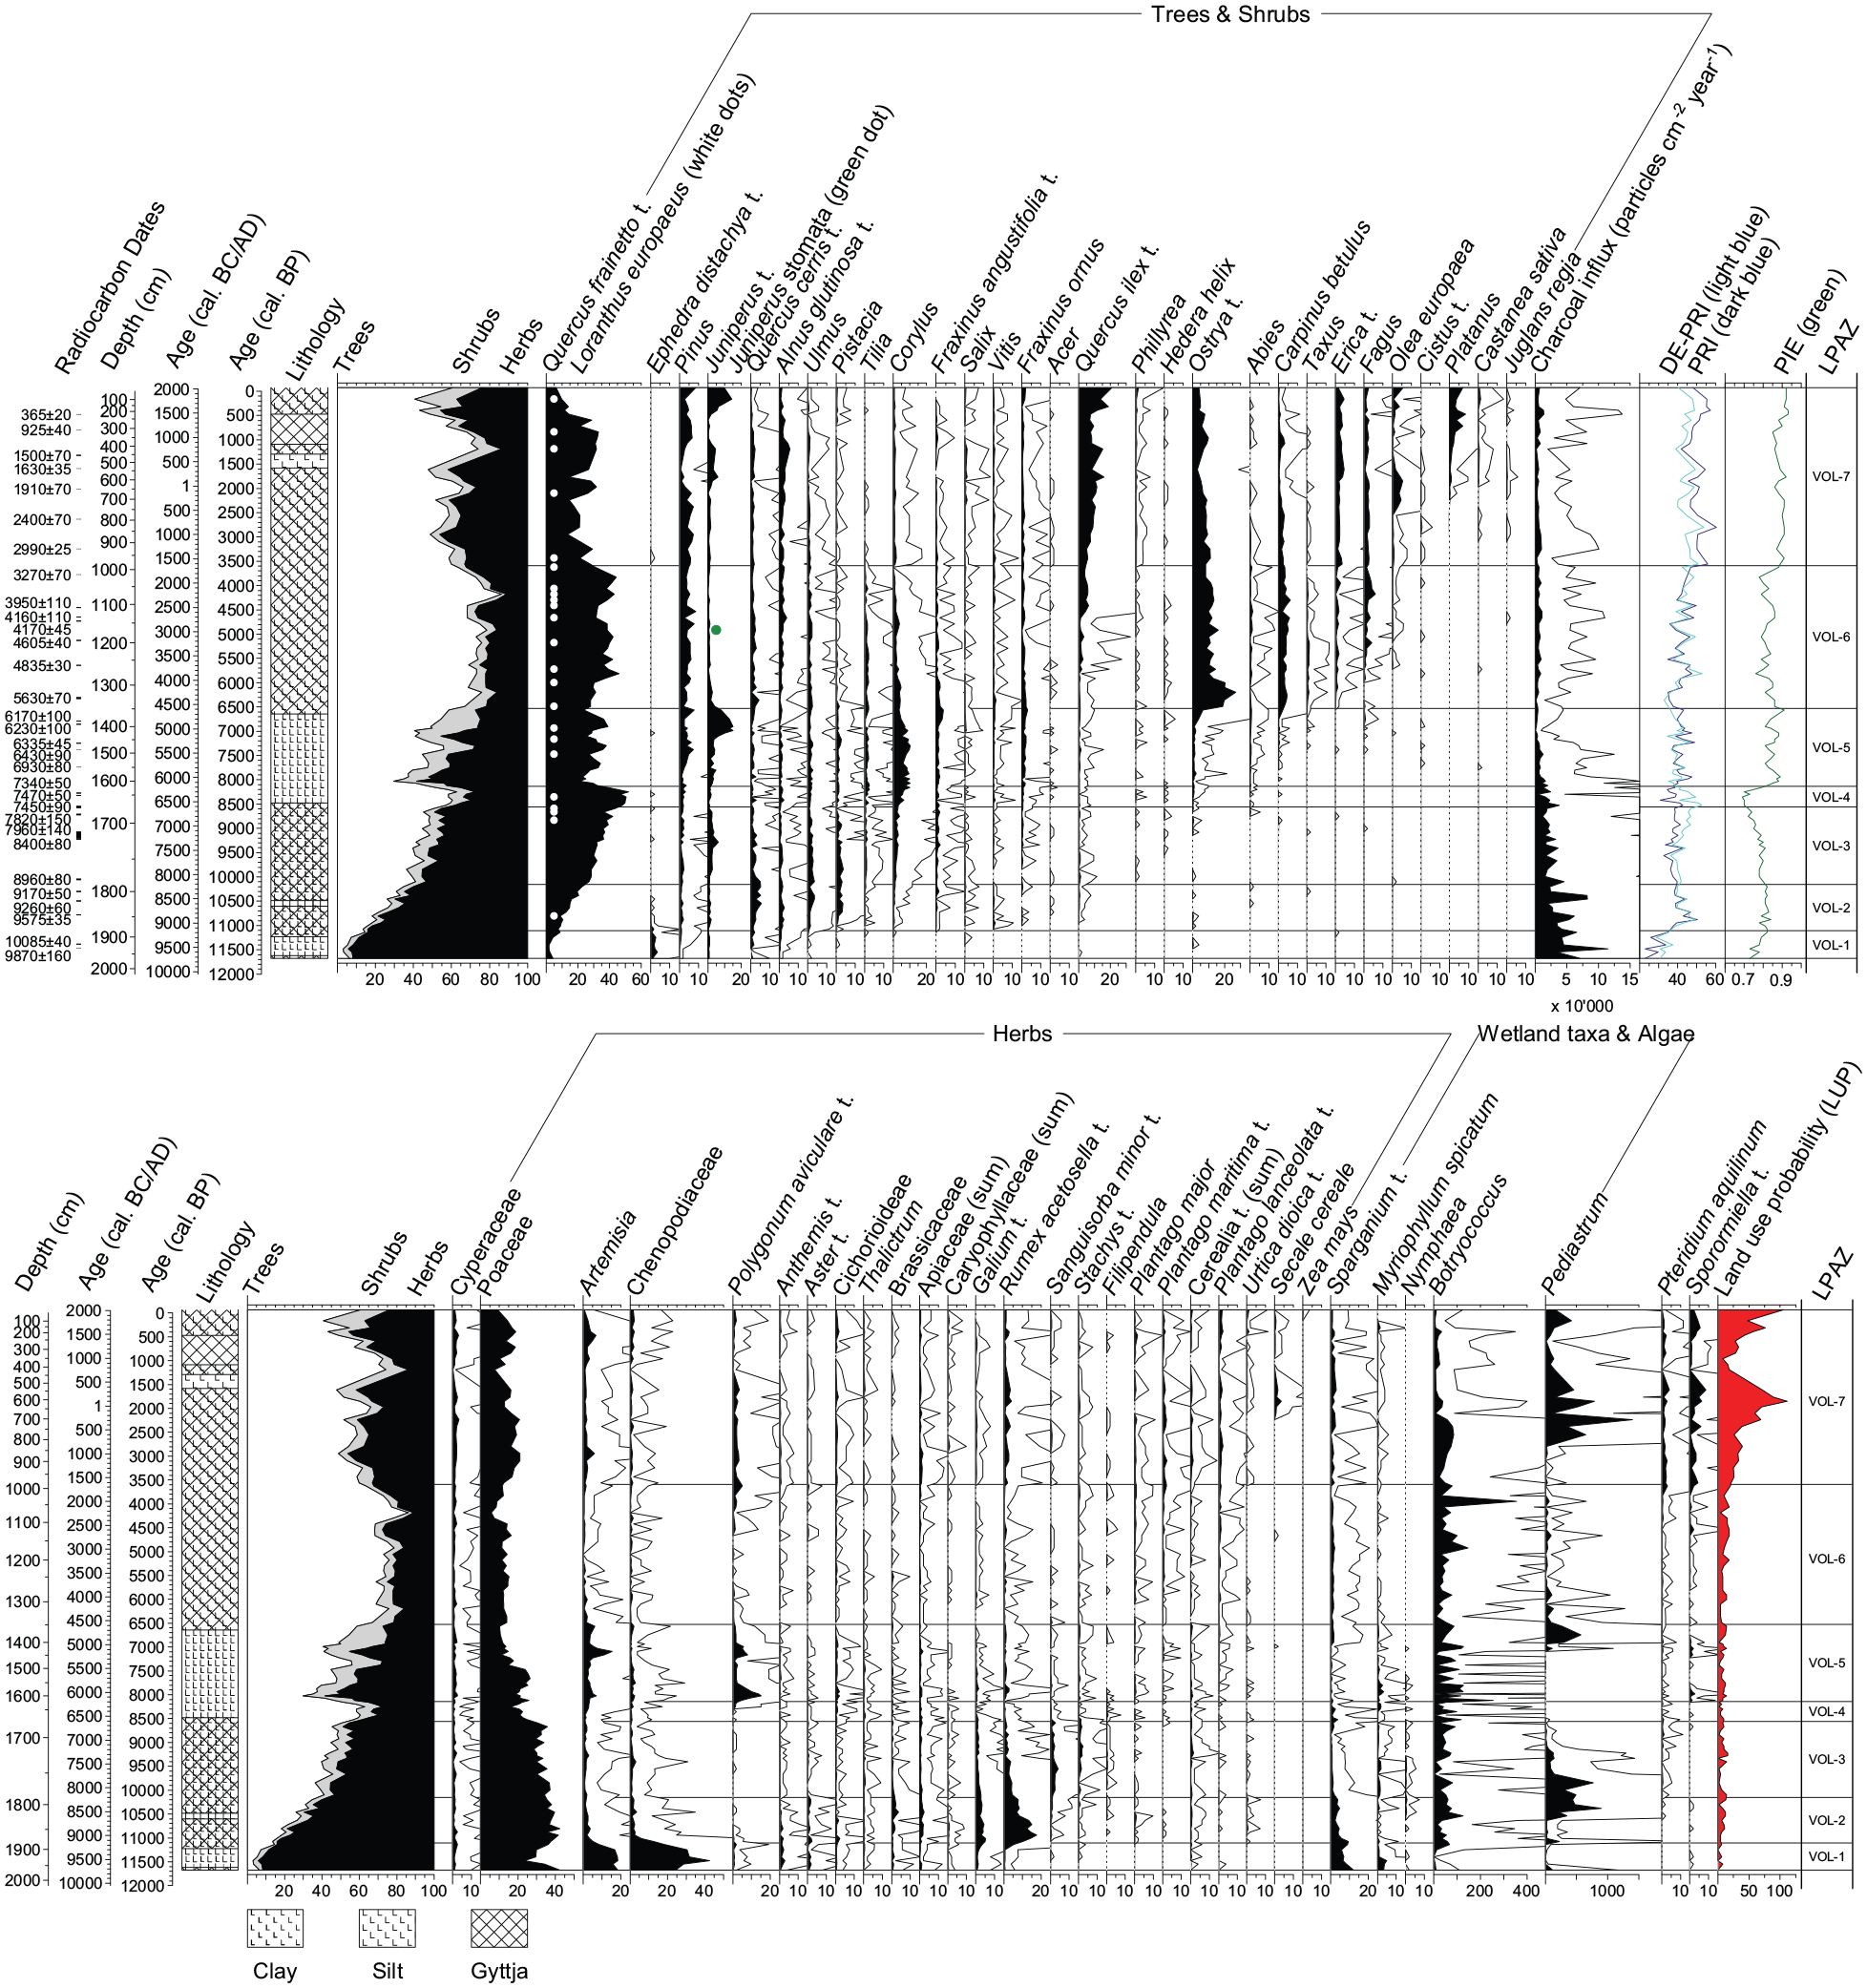
Percentage pollen diagram of Limni Volvi showing selected trees, shrubs, and herbs as well as wetland taxa, algae, Pteridium aquilinum, Sporormiella t. (dung fungal spore), microscopic charcoal influx (particles cm−2 year−1), palynological richness (PRI, dark blue), evenness-detrended palynological richness (DE-PRI, light-blue), probability of interspecific encounter (PIE, green), the land use probability index (LUP; Deza-Araujo et al., 2022) and the radiocarbon dates. The values shown for all taxa are percentages of the terrestrial pollen sum (i.e. trees, shrubs, and herbs). Empty curves show 10x exaggerations. LPAZ = local pollen assemblage zone, t. = type. The depiction of the different sediment types is based on Troels-Smith (1955).
VOL-1: 1965–1884 cm, 11,650–11,100 cal. BP (9700–9150 cal. BC): From cold-arid Chenopodiaceae-Artemisia steppe to temperate steppe with tree stands
The oldest zone in our diagram shows the highest percentage of non-arboreal pollen (NAP; 85–95%) and is dominated by Chenopodiaceae (20–40%), Artemisia (10–20%) and Poaceae (20–40%). The few arboreal pollen (AP) is mainly from Quercus frainetto t. (2–10%), Ephedra distachya t. (1–4%), Quercus cerris t., and Juniperus t. Cerealia t. pollen, more specifically Cerealia t. undiff. (<50 µm) and Hordeum t. (mostly <50 µm), is already present (Figure 4 and Figure S2). Sparganium t., Myriophyllum spicatum, as well as microscopic charcoal influx reach their highest values of the whole sequence (Figure 4).
The high abundance of drought-resistant taxa (Chenopodiaceae, Artemisia, Poaceae, Ephedra distachya t.) suggests the absolute dominance of steppe vegetation at the beginning of the Holocene with very few trees (mainly deciduous oaks) in the catchment and frequent burning. The dominance of Chenopodiaceae over Artemisia is typically associated with desert-steppe areas nowadays (El-Moslimany, 1990; Li et al., 2011). This steppic vegetation composition points to Late Glacial conditions or transitional conditions at the very onset of the Holocene. Cerealia t. pollen likely represents wild grasses (see Methods; Bottema, 1992). Wetland and water plants (Sparganium t., Myriophyllum spicatum) might have been abundant due to lake-level low stands, increasing the area of shallow water conditions suitable for the growth of those taxa, or moving the shoreline closer to the coring site.
VOL-2: 1884–1788 cm, 11,100–10,150 cal. BP (9150–8200 cal. BC): Expansion of temperate tree stands into the steppe
NAP shows a drastic decline of Chenopodiaceae and Artemisia concurrent with an expansion of Rumex acetosella t. (5–17%), Galium t., Brassicaceae, and Apiaceae, whereas Poaceae percentages remain stable. AP increases steadily from 15 to 40%, mainly due to the expansion of deciduous oaks (Q. frainetto t.: 7–22%, Q. cerris t.: 2–5%), but also Ulmus, Tilia, Fraxinus angustifolia t., Alnus glutinosa t., Pistacia, and Corylus. Quercus ilex t. reaches the empirical limit (i.e. start of continuous curve). Pediastrum increases massively around 10,600 cal. BP (8650 cal. BC). Sparganium t. and microscopic charcoal influx decrease but are still high.
Overall, this zone suggests a collapse of steppic, cold-adapted Chenopodiaceae and Artemisia communities as well as a continuous, albeit slow expansion of temperate mixed deciduous oak-elm-linden stands into the steppe. Herbs such as Rumex acetosella t. and Galium t. may have grown in grasslands or open woodlands. The first occurrence of Q. ilex t. pollen indicates that regionally, if not locally, likely at the seashore, conditions were favorable for the growth of this frost sensitive evergreen Mediterranean tree.
VOL-3: 1788–1677 cm, 10,150–8550 cal. BP (8200–6600 cal. BC): Forest-steppe development
AP continues to increase from 40 to 55%, mainly through an increase of Q. frainetto t. (22–43%) as in VOL-2. Fraxinus ornus pollen reaches its empirical limit (Figure 4). Regarding the NAP, Rumex acetosella t. and Galium t. decrease, whereas Sanguisorba minor t. and Stachys t. increase. Microscopic charcoal influx decreases. VOL-3 suggests the establishment of a deciduous oak parkland or forest steppe (AP 50–70%; Lang et al., 2023c) with a diverse assemblage of temperate broadleaved tree species and less fire activity than in the steppe before (i.e. VOL-1 and VOL-2).
VOL-4: 1677–1620 cm, 8550–8150 cal. BP (6600–6200 cal. BC): Conversion of forest steppe into open woodlands
AP reaches its highest percentages in the record so far (60–70%), with Q. frainetto t. rising up to 50% and also Corylus increasing significantly. Toward the end of the zone, Artemisia and Polygonum aviculare t. increase. Ostrya t. and Abies reach their empirical limit. Sparganium t. shows a minor increase, whereas microscopic charcoal influx stays similar to the previous zone. Overall, vegetation composition is similar to VOL-3, but with a pronounced expansion of deciduous oak woodlands.
VOL-5: 1620–1349 cm, 8150–6550 cal. BP (6200–4600 cal. BC): Transient “resurrection” of temperate steppe
AP drops rapidly below 50% at ca. 8000 cal. BP (6050 cal. BC), followed by a transient recovery and another, though less pronounced, drop at ca. 7100 cal. BP (5150 cal. BC). Both declines in AP are mainly due to decreases in Q. frainetto t. and are contemporaneous with peaks in herbs such as Polygonum aviculare t. and Artemisia, and Sporormiella t., Corylus reaches its highest abundance of the whole sequence in this zone (up to 10%) and Juniperus t. increases massively (i.e. 3–15%) after the second opening around 7100 cal. BP (5150 cal. BC). Carpinus betulus reaches its empirical limit. The Plantago lanceolata t. curve becomes continuous at ca. 7900 cal. BP (5950 cal. BC) and the first Triticum t. >60 µm occurs toward the end of the LPAZ at 6550 cal. BP (4600 cal. BC; Figure S2 and Figure 7). Microscopic charcoal decreases further.
The increase in herbaceous pollen to values >50% indicates a temporary re-establishment of steppe at ca. 8000 cal. BP (6050 cal. BC), followed by the recovery of the previous forest steppe with a high abundance of shrubs (Corylus, Juniperus t.) and after 6950 cal. BP (5000 cal. BC) the re-establishment of woodlands or open forests (AP 70–80%). Agricultural activities occurred (first Triticum t. >60 µm, continuous P. lanceolata t.) at rather low levels.
VOL-6: 1349–987 cm, 6550–3600 cal. BP (4600–1650 cal. BC): Submediterranean and mesomediterranean forests
AP reaches its highest value of the entire Holocene (70–90%). Q. frainetto t. remains the dominant tree taxon, but there is a marked compositional shift involving the mass expansion of Ostrya t. (6–27%) starting at 6500 cal. BP (4550 cal. BC) and, to a lower extent Carpinus betulus (Figure 4). Furthermore, Taxus and Erica t. expand, followed by Fagus around 5950 cal. BP (4000 cal. BC), whereas Pistacia declines. Evergreen Quercus ilex t. increases after ca. 5600 cal. BP (3650 cal. BC) to >2% and Olea europaea reaches the empirical limit a few centuries later at ca. 5100 cal. BP (3150 cal. BC). Between 4700 and 4300 cal. BP (2750 and 2350 cal. BC), there is a minor, transient decrease in AP, which is again mainly due to a reduction in Q. frainetto t. pollen. Within this AP decrease, Q. ilex t. expansion accelerates after 4500 cal. BP (2550 cal. BC) to >5%. The sum of all Cerealia types decreases, P. lanceolata t. increases slightly (Figure 4). Microscopic charcoal influx is low.
The high AP values indicate the formation of mixed submediterranean deciduous forests until ca. 6000–5000 cal. BP (4050–3050 cal. BC), followed by the establishment of first mesomediterranean stands (e.g. Q. ilex t., Olea europaea) around Limni Volvi after ca. 5600 cal. BP (3650 cal. BC). Agricultural activities most likely increased after ca. 5000 cal. BP (3050 cal. BC; Figure 4 and Figure S2) but remained generally low.
VOL-7: 987–0 cm, 3600 cal. BP – present (1650 cal. BC – present): Establishment of modern mesomediterranean open vegetation
During the past 3600 years, AP fluctuates between 55 and 85%. Q. frainetto t. and Fraxinus angustifolia t. decrease, whereas Tilia and Taxus disappear almost completely. Q. ilex t., Erica t., and Phillyrea expand. Between 2500 and 1500 cal. BP (550 cal. BC and AD 450), Olea europaea increases to up to 5%. Platanus establishes after 2200 cal. BP (250 cal. BC), together with Juglans regia (Figure 4 and Figure S2). Castanea sativa follows at ca. 1900 cal. BP (AD 50). Highest AP are found between 1400 and 800 cal. BP (AD 550 and 1150) and co-occur with transient decreases in Olea europaea, Secale cereale, Polygonum aviculare t., Pteridium aquilinum, and Sporormiella t.. Pediastrum shows high values after 2800 cal. BP (850 cal. BC). Microscopic charcoal influx remains low.
Cultural landscapes with evergreen sclerophyllous shrublands (maquis), cereal fields, fruit trees such as Olea europaea, Juglans regia, Castanea sativa, and ornamental or riparian trees such as Platanus became increasingly dominant during the past 2000 years. High abundances of Sporormiella t. and Pteridium aquilinum indicate high grazing pressure on vegetation (Behre, 1981; Perrotti and van Asperen, 2019). Quercus ilex likely continued to spread in the remaining forests (increases are usually associated with raises in AP, e.g. ca. 800 and 300 years ago), while Q. coccifera was probably more abundant in the maquis. The increase in Pediastrum algae might point toward a gradual eutrophication of the lake.
Numerical analysis: Ordination, response curves, LUP, and biodiversity
Over the whole sequence, RDA shows that mean January temperature explains 30.6% (p = 0.002), mean July temperature 30.4% (p = 0.002), January insolation 27.4% (p = 0.002), July insolation 26.9% (p = 0.002), microscopic charcoal influx (proxy for fire activity) 19.4% (p = 0.002), ln(Ca/Ti) (proxy for moisture and/or temperature) 11.5% (p = 0.002), and Sporormiella t. influx (proxy for grazing) 11.2% (p = 0.002) of the variation (simple effects). Together, the environmental variables explain 62.4% of the variation (Figure 5a). In the RDA for the period with archeological evidence of agriculture, that is, after the start of the Neolithization in the Langadas basin (VOL-5 to VOL-7; 8150 cal. BP – present, 6200 cal. BC – present) July insolation, mean July temperature, January insolation, mean January temperature, Sporormiella t. influx, ln(Ca/Ti) and microscopic charcoal influx separately explain 28.6% (p = 0.002), 28.4% (p = 0.002), 28.3% (p = 0.002), 26.4% (p = 0.002), 15.6% (p = 0.002), 15.1% (p = 0.002), and 3.0% (p = 0.054) of the variation, respectively (simple effects). Together they explain 57.2% of the variation (Figure 5b).
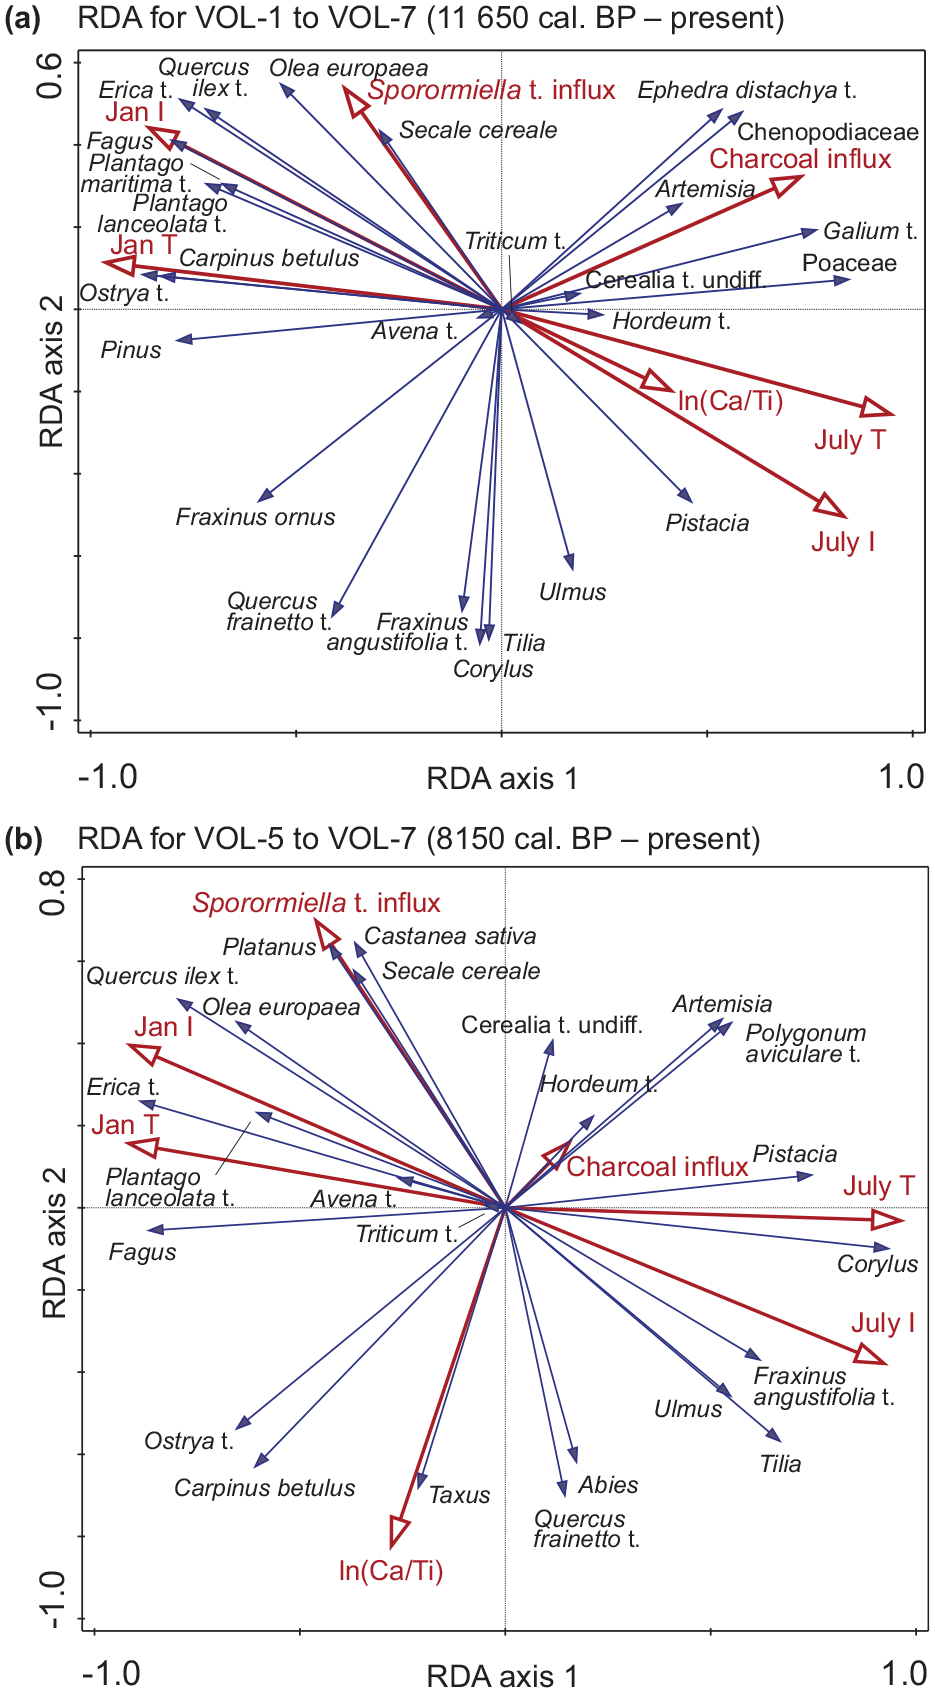
Redundancy analysis (RDA) with the terrestrial pollen taxa as response variables (square-root transformed percentages), and Sporormiella t. (proxy for grazing), microscopic charcoal influx (proxy for fire activity), ln(Ca/Ti) (proxy for moisture and/or temperature), January insolation (Jan I), July insolation (July I; Laskar et al., 2004), mean January temperature (Jan T, proxy for frost occurrence) and mean July temperature (July T; Karger et al., 2023) as environmental variables. (a) RDA for the whole sequence. The 20 best fitting taxa are shown and additionally also Artemisia, Cerealia t. undiff., Avena t., Hordeum t., Triticum t., and Secale cereale. (b) RDA for the time period when there is archeological evidence of agriculture from the Langadas basin, that is, after the start of Neolithization (VOL-5 to VOL-7; 8150 cal. BP – present, 6200 cal. BC – present). The 20 best fitting taxa are shown, and additionally also Cerealia t. undiff., Avena t., Hordeum t., and Triticum t.
For the whole sequence, charcoal influx is highly positively correlated with herbaceous taxa such as Chenopodiaceae, Poaceae, Galium t., and Artemisia, and with the shrub Ephedra distachya t. (Figure 5a). Furthermore, microscopic charcoal influx is negatively correlated with Pinus, Fraxinus ornus, and Q. frainetto t. However, since the start of Neolithization (after 8150 cal. BP, 6200 cal. BC), charcoal influx is mainly positively correlated with Artemisia and Polygonum aviculare t., and explains only a very small portion of the variation (3.0%, Figure 5b). Altogether, these results suggest that fire occurrence might have favored the herbaceous/steppe taxa at the beginning of the Holocene, whereas fire did not play a major role anymore in the more forested landscape of the past ca. 8000 years.
January insolation and mean January temperature, and July insolation and mean July temperature are highly correlated, as explained by the importance of orbital parameter forcing for climate modelling. For both sequences, mean January temperature and insolation are positively correlated with Quercus ilex t., Erica t., Olea europaea, Fagus, Plantago lanceolata t., as well as Sporormiella t. influx. Sporormiella t. influx is strongly positively correlated with Secale cereale and Castanea sativa, suggesting a close link between crop production and pastoral farming activities. The response curves (Figure 6) further highlight the positive relationship between the winter-temperature increase (and thus a decrease in winter frost occurrence) and frost sensitive Mediterranean taxa such as Q. ilex t., Erica t., and Olea. Increasing grazing pressure (Sporormiella t. influx) is also positively linked with disturbance-adapted Q. ilex t. and Erica t., Q. frainetto t. on the other hand seems to have been disadvantaged by increasing land use and the competition with Q. ilex t. Our data further show that after a threshold in (modelled) mean January temperature of ca. 4°C for Q. ilex t., and slightly more for Erica t. and Olea, was crossed, evergreen broadleaved Mediterranean trees expanded massively (Figure 6 and Figure S3). Altogether, this suggests a strong influence of winter-temperature changes and human activities, especially grazing, on the development of the present-day mesomediterranean vegetation around Volvi.
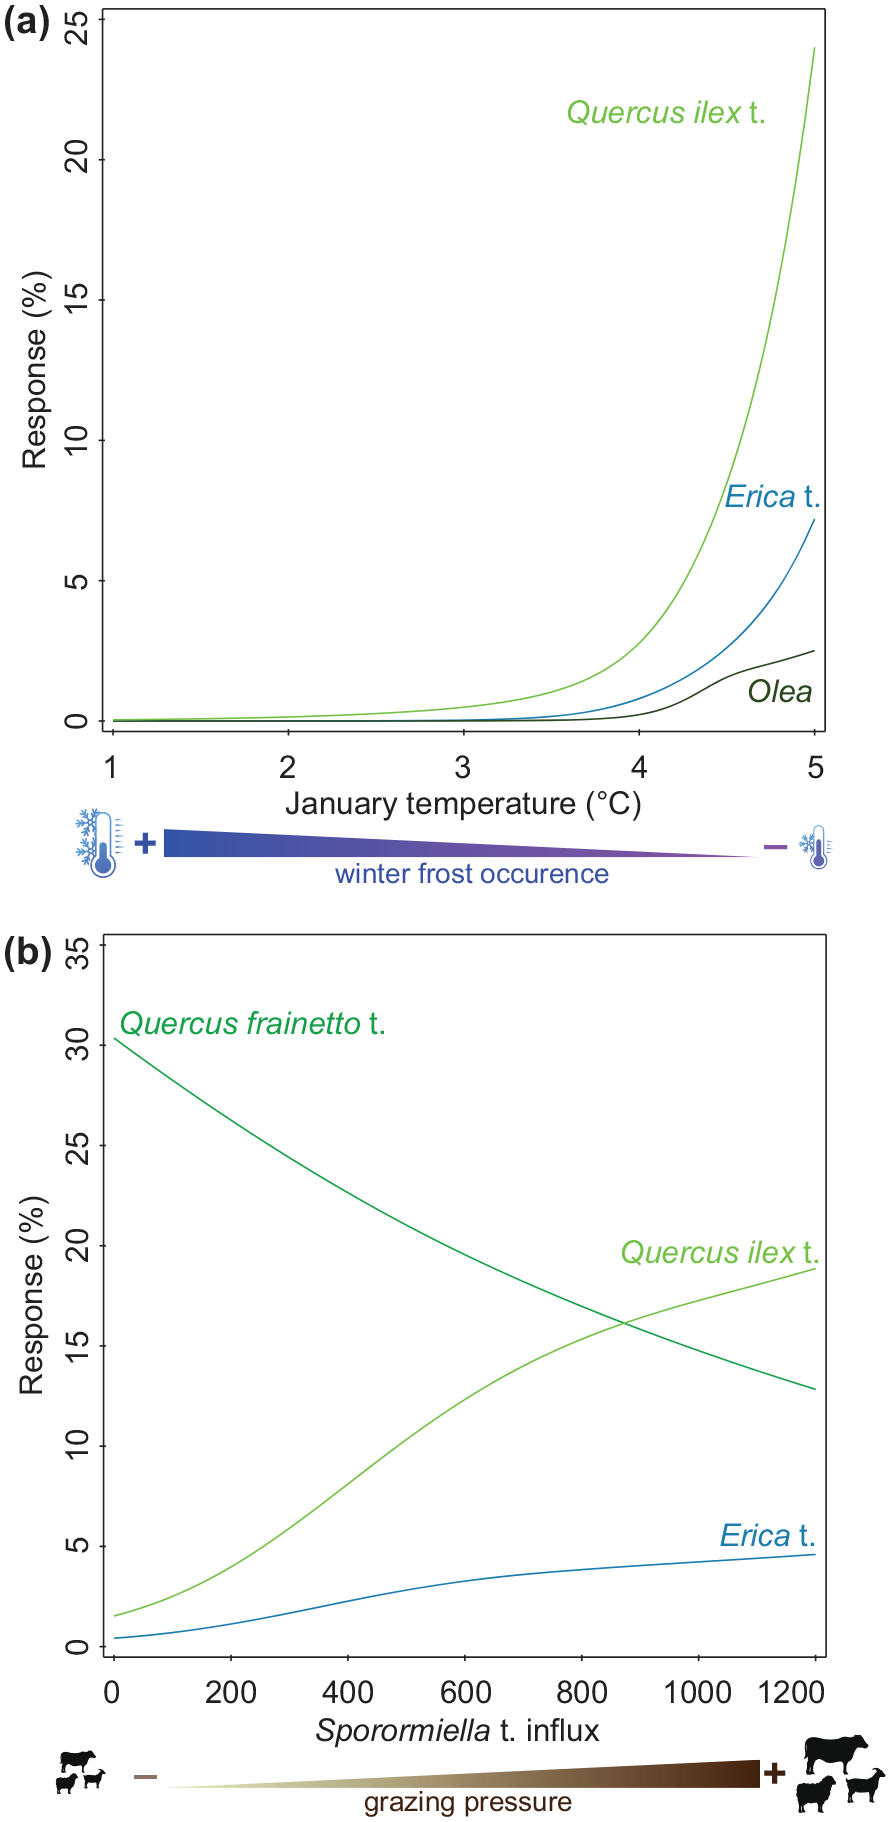
Selected taxon response curves from Limni Volvi to (a) modelled mean January temperature from the CHELSA-TraCE21k 1.0 dataset (Karger et al., 2023) as a proxy for frost occurrence, with higher mean temperature indicating less winter frost. (b) Sporormiella t. influx (spores cm−2 year−1) as a proxy for grazing pressure on the vegetation, with higher values indicating more grazing pressure.
Land use probability (LUP, Figures 4 and 7, Figure S2) is lowest at the onset of the Holocene to reach a first minor peak around ca. 4500 cal. BP (2550 cal. BC) but remains low, that is, <20, until ca. 3600 cal. BP (1650 cal. BC). It then increases, first gradually, before peaking between ca. 2300 and 1400 cal. BP (350 cal. BC and AD 550). After a massive (ca. tenfold) transient decline from ca. 1400 to 900 cal. BP (AD 550 to 1050), LUP increases again and shows a second major peak in the present day.
Paleodiversity indices (PRI, DE-PRI) are lowest at the start of our record around 11,650 cal. BP (9700 cal. BC), followed by a strong increase around ca. 11,100 cal. BP (9150 cal. BC), an overall relatively stable phase with some superimposed fluctuations between ca. 11,100 and 4000 cal. BP (9150 and 2050 cal. BC) and a slight increase in the past ca. 4000 years (Figure 4). Palynological evenness (PIE) is overall high (0.7–0.95) and shows a stepwise increase around 8200 and 3600 cal. BP (6250 and 1650 cal. BC). The comparison of PRI and DE-PRI reveals no major evenness-related distortions of PRI, probably because large pollen producers such as Pinus or Alnus were never dominant (Brechbühl et al., 2024; Colombaroli and Tinner, 2013; Dziomber et al., 2024; Senn et al., 2022). Overall, the indices suggest that diversity increased with the establishment of the forest steppe in the Early Holocene and again in the past millennia, likely in response to land use.
Discussion
Climate driven vegetation changes during the Early Holocene
At the Late Glacial-Holocene transition, cold-arid steppe vegetation prevailed around Limni Volvi (Figure 4). Apart from a few oaks and alders, stands of trees were almost non-existent (NAP >90%), as the few Betula and Pinus pollen grains may also have originated from long-distance transport (Bottema, 1982; Lisitsyna et al., 2011). Further inland, steppe was also the dominant vegetation type before ca. 11,500 cal. BP (9550 cal. BC) around Zazari (Gassner et al., 2020) and Dojran (Masi et al., 2018), where tree stands were rare but still more abundant than around Volvi. Our ln(Ca/Ti) record from Limni Volvi reports dry and/or cold conditions for the Late Glacial–Early Holocene transition, which is in agreement with several climate records from the region that report dry (e.g. Fleitmann et al., 2009; Göktürk et al., 2011; Peckover et al., 2019), dry and/or cold (Gogou et al., 2007; Wagner et al., 2010), or cold (Marino et al., 2009; Rohling et al., 2002) conditions for this period (Figure 7).
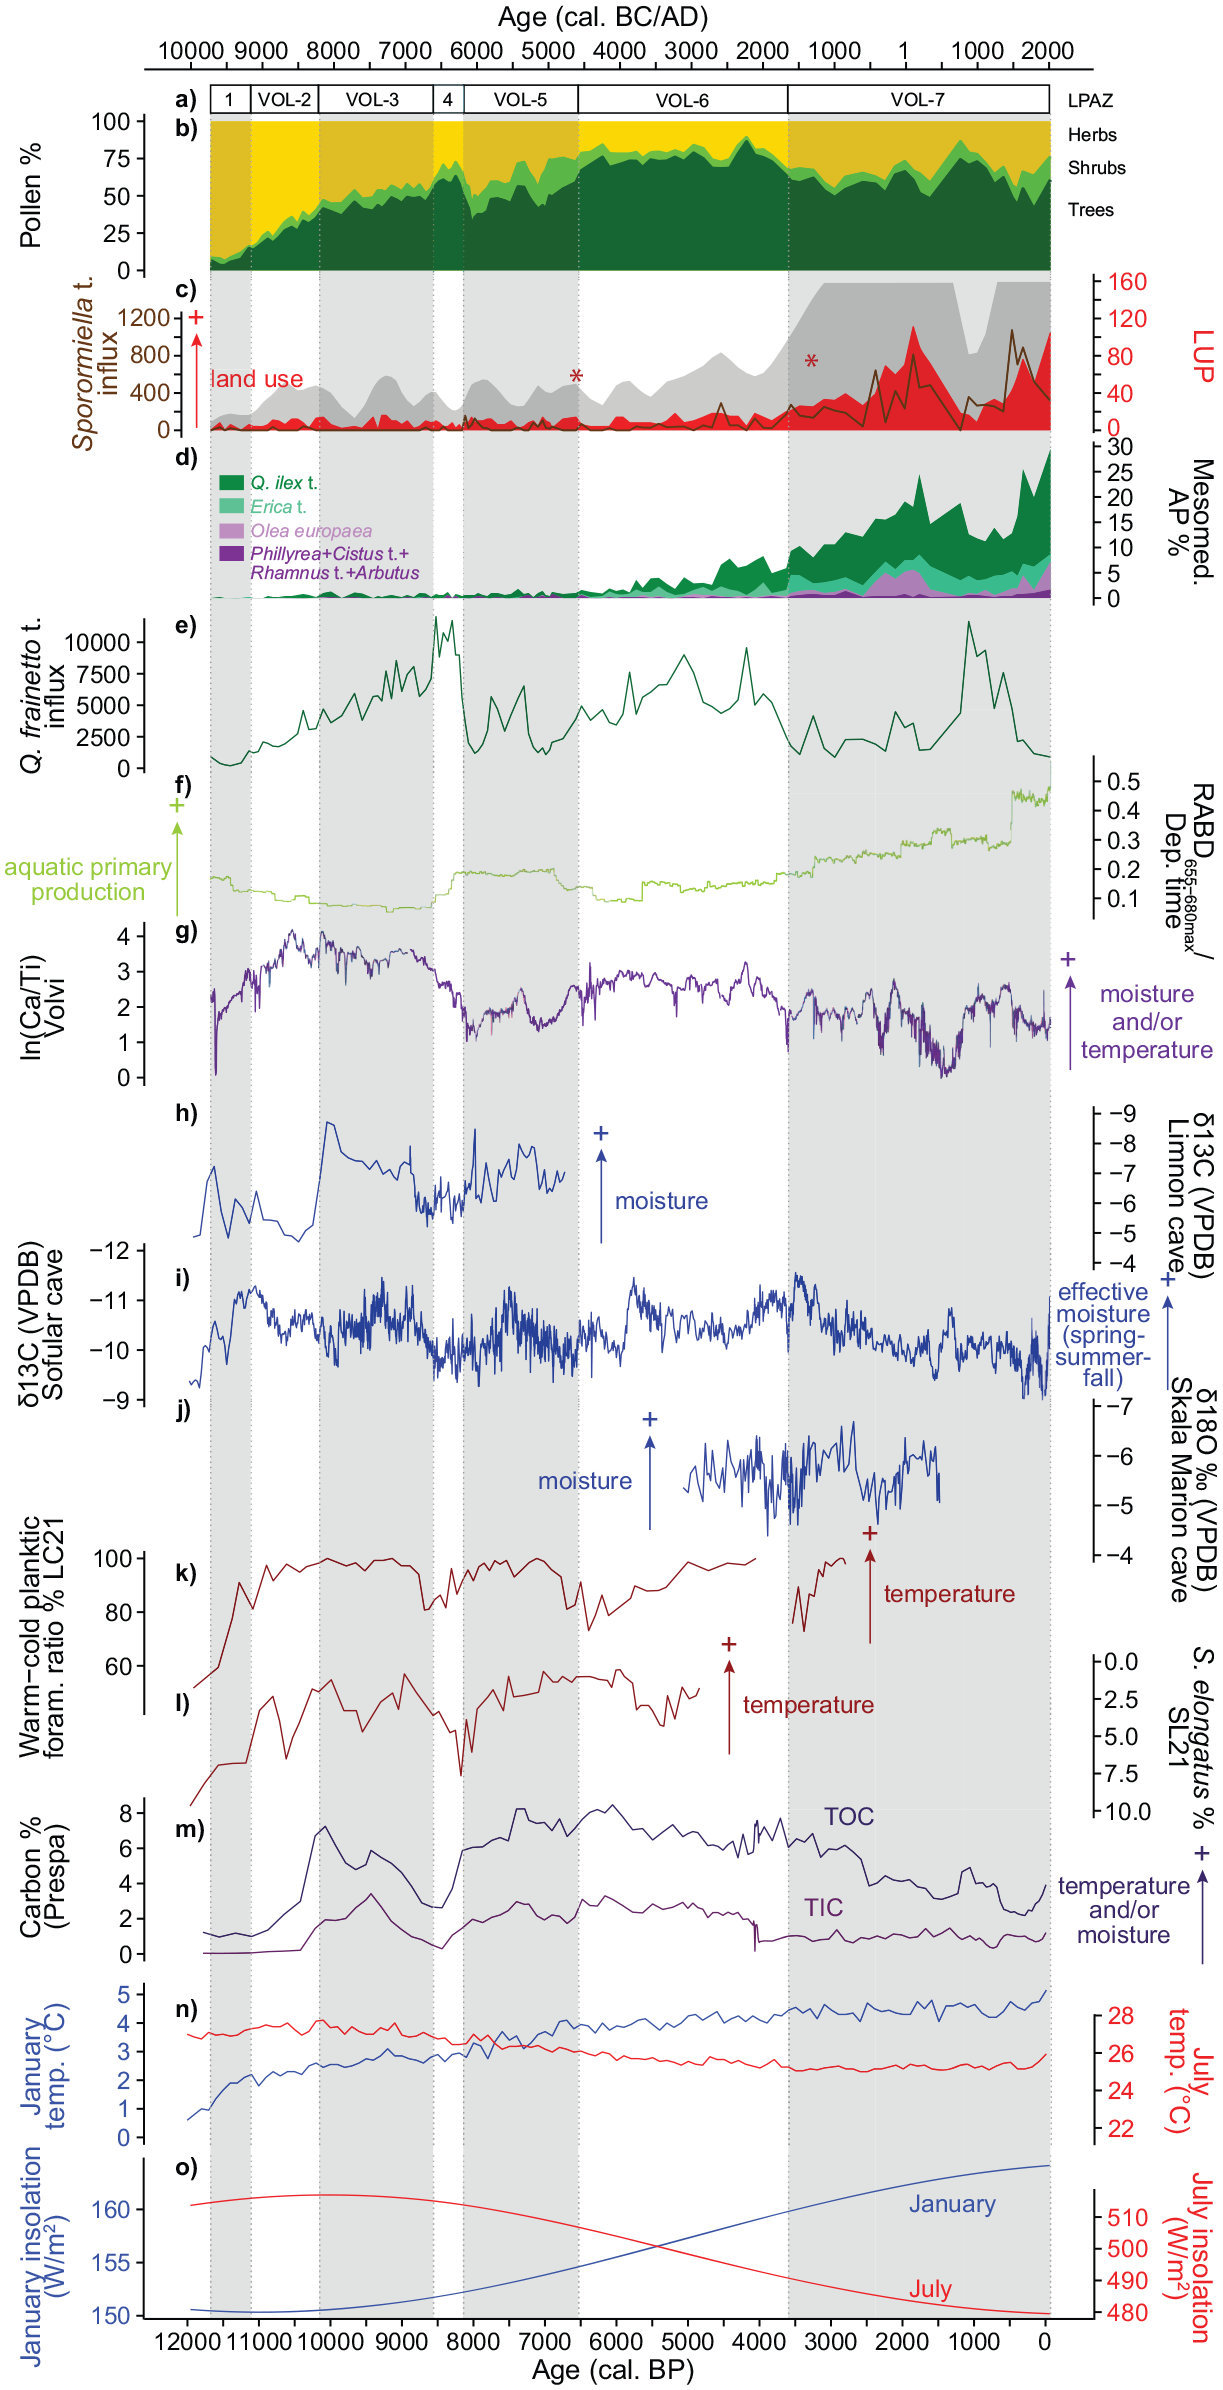
Summary diagram with (a) statistically significant local pollen assemblage zones (LPAZ). (b) Percentage pollen diagram showing herbs, shrubs and trees. (c) Land use probability index (LUP after Deza-Araujo et al. 2022; red curve with 5× exaggeration in grey using loess smoothing with span = 0.1) and Sporormiella t. influx (spores cm−2 year−1; brown curve). The two red asterisks denote the age of the two Triticum t. pollen grains >60 µm. (d) Mesomediterranean arboreal pollen (AP) percentages. (e) Quercus frainetto t. influx (pollen grains cm−2 year−1). (f) RABD655–680max normalized to the deposition time (year cm−1). (g) Log-transformed ratio (natural logarithm) between calcium and titanium from Limni Volvi (this study). (h) δ13C record, relative to the VPDB (Vienna PeeDee Belemnite) standard, from Limnon Cave on the Peloponnese, Greece (Peckover et al., 2019). (i) δ13C record, relative to the VPDB standard, from Sofular Cave in northern Türkiye (Fleitmann et al., 2009; Göktürk et al., 2011). (j) δ18O record, relative to VPDB, from Skala Marion Cave on Thassos Island, ca. 90 km from Limni Volvi (Psomiadis et al., 2018). (k) Relative abundance (%) of warm-water to cold-water planktonic foraminifera from marine core LC21 (south-eastern Aegean Sea; Rohling et al., 2002; Marino et al., 2009). (l) Relative abundance (%) of Spiniferites elongatus with respect to the gonyaulacoid-only dinocyst sum from marine core SL21 (central Aegean Sea; Marino et al., 2009). (m) Percentages of total organic carbon (TOC) and total inorganic carbon (TIC) from Lake Prespa (core Co1204; Wagner et al., 2010). (n) Modelled mean January and July temperatures for Limni Volvi from the CHELSA-TraCE21k 1.0 dataset (Karger et al., 2023). (o) January and July insolation for 40°N (Laskar et al., 2004). For better readability every second local pollen assemblage zone (LPAZ) is shaded in grey.
After 11,500 cal. BP (9550 cal. BC) afforestation at Limni Volvi might have been delayed compared to the submediterranean sites further inland and westwards due to lower moisture availability. Specifically, moisture may have decreased from west to east over Greece, caused by orographic effects in the Pindos mountain range, as it does today (e.g. Gofa et al., 2019; Kostopoulou et al., 2024; Xoplaki et al., 2000). Additionally, precipitation might not have kept pace with increasing temperatures, resulting in greater dryness in the warmer coastlands (Bottema, 1992). According to our microscopic-charcoal evidence, Early Holocene climatic conditions increased regional burning, possibly resulting in a negative feedback loop between fire and tree cover (Laskar et al., 2004; Turner et al., 2010; Vannière et al., 2008).
After ca. 11,000 cal. BP (9050 cal. BC), a diverse forest-steppe, dominated by deciduous oaks (mainly Q. frainetto t.), gradually became established. Galium t. spread in the woodlands or scrublands and Rumex acetosella t. in the dry grasslands, contributing to the strongest increase in palynological diversity of the entire Holocene (Figure 4). The co-occurrence of Pistacia and Sanguisorba minor t. in the Early Holocene is typical of the eastern Mediterranean, indicating a (winter) temperature increase together with a gradual rise in moisture, and has been used as a stratigraphic marker (Kotthoff et al., 2008a; Miebach et al., 2016; Rossignol-Strick, 1995; Valsecchi et al., 2012). Even though woodlands were much less widespread around Limni Volvi, vegetation composition was very similar to submediterranean Limni Zazari further inland (Gassner et al., 2020, van Vugt et al., in press) and to present-day sub- to mesomediterranean Lake Dojran (Masi et al., 2018) and Xinias (ca. 200 km south; Bottema, 1979). This finding implies that today’s mesomediterranean sites were dominated by submediterranean vegetation during the Early Holocene, likely because of rather dry and continental climatic conditions with harsh winters.
An interesting feature of our record is the maximum of arboreal pollen between 8600 and 8200 cal. BP (6650 and 6250 cal. BC), which is mainly due to an increase in deciduous oaks (Q. frainetto t.). Around 8600–8500 cal. BP (6650–6550 cal. BC), many records in the central and eastern Mediterranean report significant vegetation changes. In striking contrast to Limni Volvi, some inland records in northern Greece show a notable decrease in arboreal pollen percentages, mainly of deciduous oaks (e.g. Limni Zazari, Gassner et al., 2020, van Vugt et al., in press; Limni Vegoritis, Morales-Molino et al., 2024). Further south in Greece, and westwards in Italy, deciduous oaks were partly replaced by evergreen oaks (Limni Kournas, Jouffroy-Bapicot et al., 2021; Lago dell’Accesa, Colombaroli et al., 2008; Drescher-Schneider et al., 2007) during this time. Interestingly, in agreement with Limni Volvi, increases in arboreal pollen occurred at other Mediterranean sites (e.g. several broadleaved trees and shrubs at Tenaghi-Philippon, Peyron et al., 2011; Pross et al., 2009; Olea at Gorgo Basso in Sicily, Tinner et al., 2009). After around 8600 cal. BP (6650 cal. BC), our ln(Ca/Ti) record suggests a period of drier and/or cooler conditions, in agreement with several other pollen-independent climate reconstructions from the eastern Mediterranean (e.g. Fleitmann et al., 2009; Göktürk et al., 2011; Marino et al., 2009; Peckover et al., 2019; Rohling et al., 2002; Schemmel et al., 2017; Wagner et al., 2010; Figure 7). The increase in deciduous oaks between 8600 and 8200 cal. BP (6650 and 6250 cal. BC) at Limni Volvi, in contrast to decreases further inland (e.g. Zazari, van Vugt et al., in press; Vegoritis, Morales-Molino et al., 2024), but in agreement with other Mediterranean records, is difficult to explain. We hypothesize that the difference mainly resulted from altitudinal or seashore effects, mitigating climate shifts at Limni Volvi and other sites close to the coast (e.g. Gorgo Basso in southern Sicily, Tinner et al., 2009). A similar explanation has been put forward for Lake Dojran (144 m a.s.l., ca. 60 km to the coast) to explain the absence of evidence for the “8.2 ka event” in the pollen assemblage (Masi et al., 2018). Additionally, though less likely due to the sites being well dated, chronological uncertainties may also explain the difference between the sites.
At Limni Volvi, vegetation changed markedly around 8200 cal. BP (6250 cal. BC; statistically significant LPAZ border at 8150 cal. BP, 6200 cal. BC), delimiting the start of the forest decline. Although the onset of the forest decline at Limni Volvi is not synchronous with the well-dated high-resolution sites Limni Zazari and Vegoritis (van Vugt et al., in press; Morales-Molino et al., 2024), spanning from ca. 8600 to 8200 cal. BP (6650–6250 cal. BC), the absolute minimum in forest cover at 8000 cal. BP (6050 cal. BC) is regionally coeval, from the seashore to inland sites. A pronounced forest decline between 8400 and 8000 cal. BP (6450 and 6050 cal. BC) has also been found in marine core SL152 (Kotthoff et al., 2008b), confirming a large spatial extent of this decline. The vegetation shift starting around 8200 cal. BP (6250 cal. BC) was most likely a response to the so-called “8.2 ka event,” a rapid excursion toward cold and dry conditions in the eastern Mediterranean (e.g. Göktürk et al., 2011; Marino et al., 2009; Rohling et al., 2002; Wagner et al., 2010; Figure 7). Alkenone-derived sea surface temperatures show a temperature drop of about 2.5°C and models suggest a precipitation decrease of 50–100 mm year−1 during the “8.2 ka event” for the Aegean region (Gogou et al., 2007; Renssen et al., 2002). Regional chironomid records from the Mediterranean and Carpathians show no clear cooling, suggesting that summer temperatures remained high and cooling mainly took place in winter (Samartin et al., 2017; Tóth et al., 2015). In contrast to the wetter and colder inland sites where forest shifted to forest steppe, the lack of moisture caused the coastal landscape around Limni Volvi to return briefly to full steppe conditions around 8000 cal. BP (6050 cal. BC; Figures 4 and 7). Woodland recovery afterwards was slow and incomplete.
A second though less pronounced forest decline occurred at 7100 cal. BP (5150 cal. BC; Figures 4 and 7). The overall vegetation changes are very similar to those observed about 1000 years earlier at around 8000 cal. BP (6050 cal. BC), with a decline mainly in deciduous oaks (Q. frainetto t.) and an increase in herbs (Artemisia, Polygonum aviculare t.). Our ln(Ca/Ti) curve from Limni Volvi shows a distinct minimum for this time period, suggesting a transient decline in moisture and/or temperature at ca. 7200–6700 cal. BP (5250–4750 cal. BC; Figures 3 and 7). Paleoclimate records report increased aridity at 7200 cal. BP (5250 cal. BC; Peckover et al., 2019; Figure 7) and a cooling around 7100 cal. BP (5150 cal. BC; Giamali et al., 2019). Moreover, 7100 cal. BP (5150 cal. BC) corresponds to the end of sapropel S1b in the northern Aegean Sea (Kotthoff et al., 2008a). Taken together, it is therefore likely that the forest opening at ca. 7100 cal. BP (5150 cal. BC) was primarily a consequence of climate change (see also rather low LUP values).
Human impact and the development of the present-day mesomediterranean vegetation
Indicators of first agricultural activity (Cerealia types, Sporormiella t., P. lanceolata t.) peaked or became continuous around 8000 cal. BP (6050 cal. BC, Figure 4 and Figure S2), when the climate-caused forest opening reached its maximum. Several Neolithic settlements are known from the Langadas basin (Andreou and Kotsakis, 1994; Kotsos and Urem-Kotsou, 2016; Urem-Κotsou and Kotsos, 2020). One of the earliest settlements known, Mikri Volvi, is situated close to the north-eastern shore of the lake. Mikri Volvi has been assigned to the end of the 7th millennium cal. BC based on its ceramic evidence (i.e. around 8100 cal. BP; Kotsos and Urem-Kotsou, 2016; Lioutas and Kotsos, 2008; Urem-Κotsou and Kotsos, 2020). Possibly, more Neolithic settlements existed around Limni Volvi, but were covered by the abundant alluvial deposits that built up over the Holocene (Andreou et al., 1996; Urem-Κotsou and Kotsos, 2020). However, despite many uncertainties, the archeological evidence seems in good agreement with the palynological inferences from Limni Volvi.
Unambiguous palynological evidence of arable farming dates to ca. 6550 cal. BP (4600 cal. BC, find of Triticum t. >60 µm). Interestingly, the land-use pattern does not differ from previous phases of the Neolithic, except that forests were rather closed during this time. The unambiguous palynological evidence of arable farming is concurrent with a marked vegetation change involving the mass expansion of Ostrya t. (includes both Ostrya carpinifolia and Carpinus orientalis) and Carpinus betulus (statistically significant LPAZ border VOL-5 to VOL-6). The remarkable expansion of Ostrya carpinifolia and/or Carpinus orientalis around 6500 cal. BP (4550 cal. BC) has been observed at many sites in northern Greece (Bottema, 1979; Wijmstra, 1969; Willis, 1994). Both species, as well as Carpinus betulus, are well adapted to disturbance and Ostrya carpinifolia and Carpinus orientalis are able to easily colonize open and degraded areas and to regenerate vigorously (Pasta et al., 2016; Sikkema and Caudullo, 2016). It is thus likely that the mass expansion of these disturbance-adapted trees was promoted by human impact, as observed at other sites in the Mediterranean (e.g. Brechbühl et al., 2024; Gobet et al., 2000).
Around 6000–5000 cal. BP (4050–3050 cal. BC), mesomediterranean vegetation started to gradually establish around Limni Volvi when Q. ilex t. and Erica t. expanded and Olea europaea formed first stands (continuous pollen curve). The expansion of evergreen broadleaved vegetation accelerated slightly at ca. 4500 cal. BP (2550 cal. BC) with a forest opening and later at ca. 3600 cal. BP (1650 cal. BC) with the increase of human impact (LUP, Sporormiella t., Figure 4 and Figure S2). The spread of evergreen, Mediterranean taxa (Q. ilex t.) around 6000–5000 cal. BP (4050–3050 cal. BC) has also been observed at other sites in the eastern and central Mediterranean (e.g. Lake Lerna, Jahns, 1993; Lake Voulkaria, Jahns, 2005; Ioannina, Lawson et al., 2004; Lago di Baratz, Pedrotta et al., 2021; Stagno di Sa Curcurica, Beffa et al., 2016; Malo Jezero, Jahns and van den Bogaard, 1998; Figure 1) and was explained as a result of climate change or intensification of land use. Colombaroli et al. (2009) investigated the contribution of fire to the expansion of evergreen forests in the Mediterranean region and concluded that climatic changes were the main driver rather than fire occurrence, which is in line with the results from our RDA (Figure 5). Based on our RDA and the response curves (Figures 5 and 6, Figure S3), we propose that at Volvi the initial establishment of evergreen taxa was triggered by decreasing seasonality and less intense and recurrent frost as a result of increasing winter temperatures during the Mid to Late Holocene (Figures 5–7; Behre et al., 2023; Karger et al., 2023; Laskar et al., 2004). Indeed, according to our data and archeological data as inferred from summed radiocarbon density curves the settlement activity in northern Greece was rather low between 6000 and 5000 cal. BP (4050 and 3050 cal. BC; Weiberg et al., 2019). Whether or not this truly indicates low population levels, a sampling bias, or just a relocation of population in the landscape, is however unclear (Weiberg et al., 2019). Later, around 3600 cal. BP (1650 cal. BC), the spread of evergreen broadleaved vegetation was probably facilitated by human disturbance (Figures 4–7: RDA, response curves, LUP, Sporormiella t.). Additionally, climate shifts toward drier conditions from 3900 to 3700 and 3600 to 3400 cal. BP (1950–1750 and 1650–1450 cal. BC; Psomiadis et al., 2018) possibly further advantaged drought-adapted evergreen Q. ilex, Q. coccifera, Erica, and Olea europaea on the cost of more mesophilous deciduous trees. This change in vegetation composition was accompanied by a marked change in vegetation structure after ca. 3600 cal. BP (1650 cal. BC), when maquis vegetation spread (e.g. Erica, Phillyrea, Cistus t.). Human disturbance contributed to the expansion of maquis and garrigue all across the Mediterranean (Behre et al., 2023) during the Late Holocene. In our region this finding is in agreement with archeological and palynological evidence of higher human activity and increased land use during the Bronze Age (e.g. Weiberg et al., 2019).
A striking feature of our record is the high LUP values in Hellenistic and Roman times (ca. 2250–1600 cal. BP, ca. 300 cal. BC – AD 350), with a peak around 1850 cal. BP (AD 100) that has only barely been surpassed nowadays. Particularly notable is the expansion of olive cultivation, also observed elsewhere in Greece during Hellenistic and Roman times (e.g. Jouffroy-Bapicot et al., 2021; Vignola et al., 2022). The area around Limni Volvi was likely intensively used for crop production (Secale, Olea, Juglans, Castanea) at that time, as well as substantial herding (peak in Sporormiella t. influx). Around 1400 cal. BP (AD 550) land use suddenly collapsed (LUP, Sporormiella t. influx), in agreement with evidence from nearby Tristinika marsh on Chalkidiki (Figure 1; Panajiotidis and Papadopoulou, 2016) and to a lesser extent from Paliouras Lagoon close to Thessaloniki (Masci et al., 2022). Panajiotidis and Papadopoulou (2016) suggested that the “Plague of Justinian” devastated the local population leading to the total collapse of agriculture in the region. Additionally, the transition from the Late Roman Empire to the Early Byzantine marked a period of political instability in the region (Masci et al., 2024; Panajiotidis and Papadopoulou, 2016). The cultural collapse falls within a period of high erosion and possibly also a dry and/or cold event according to our ln(Ca/Ti) curve, suggesting that the societal crisis may have been connected to climate change. Also at the same time, hydromorphological changes led to a disruption of the deposition process at the nearby Lower Strymon Valley (Glais et al., 2023). The climate change in the centuries between ca. 1700 and 1200 cal. BP (AD 250 and 750) has also been described as the “Migration Period Cooling,” a time of colder-than-average temperatures, reported for the Aegean and the extra-tropical Northern Hemisphere in general (Helama et al., 2017; Kozanoglou et al., 2023; Ljungqvist, 2010) and drier conditions reported from central Europe and the eastern Mediterranean (Büntgen et al., 2021; Ehrmann et al., 2007; Finné et al., 2014; Göktürk et al., 2011). Finally, during the past 1000 years, land use recovered (LUP, Sporormiella t. peaks) leading to massive eutrophication of the lake (RABD655–680max), deforestation of the landscape, and erosion of the catchment (Ti).
Conclusions
Our record from Limni Volvi provides the first well-dated complete Holocene vegetation, environmental and fire record from a mesomediterranean site close to the coast in northern Greece. Afforestation of the steppe at the start of the Holocene was likely delayed due to aridity. Parklands and later woodlands were established during the Early Holocene, but moisture deficiency during the “8.2 ka event” led to a transient return of steppe vegetation, when agriculture started in the Limni Volvi area. Mesomediterranean vegetation expanded 6000–5000 years ago in response to increasing winter temperatures, accelerated about 3600 years ago by land use, which ultimately led to increasingly eutrophic conditions in the lake and strong erosion of the catchment.
In the future, climate change will lead to warmer temperatures, a reduction in annual precipitation across Greece, and an increase in extreme daily heat that will mostly affect inland plains and lowlands (IPCC, 2021; Kostopoulou et al., 2024; Malamataris et al., 2020). Vegetation models show that an increase in temperature of 3°C would turn mesomediterranean vegetation into thermomediterranean vegetation within only 50–150 years (Behre et al., 2023; Henne et al., 2015). Specifically, the currently most abundant deciduous oak in the catchment of Limni Volvi, Q. frainetto, will likely decline in the near future under warmer and drier conditions (Fyllas et al., 2022). In the worst case and if moisture should decline to reach the low Early Holocene levels, forests may disappear completely, allowing the re-expansion of steppes and increase the risk of fires (Henne et al., 2015). Already during the past decades, Lakes Volvi and Koroneia have suffered from pollution and continuous extraction of water for irrigation, resulting in water scarcity (especially at Koroneia), a decline in water quality and ultimately a loss of biodiversity (Emmanouil et al., 2024). Across Greece, 82% of average annual water consumption is used for irrigation, in central Greek Macedonia 81% (Karavitis and Oikonomou, 2024). Under a future drier climate, pressure on the valuable aquatic ecosystems of the Langadas basin will likely increase and intensify the conflict between conservation, agriculture and industry.
Supplemental Material
sj-docx-1-hol-10.1177_09596836241297665 – Supplemental material for Holocene climate–vegetation–land use interactions in the mesomediterranean coastlands of northern Greece
Supplemental material, sj-docx-1-hol-10.1177_09596836241297665 for Holocene climate–vegetation–land use interactions in the mesomediterranean coastlands of northern Greece by Kathrin Ganz, Lieveke van Vugt, Erika Gobet, César Morales-Molino, Tryfon Giagkoulis, Sarah Ogi, Luc Hächler, Emmanuel Schaad, Paul D. Zander, Ronald Lloren, Nathalie Dubois, Martin Grosjean, Hendrik Vogel, Kostas Kotsakis, Amy Bogaard, Albert Hafner and Willy Tinner in The Holocene
Footnotes
Acknowledgements
We would like to thank Peter Ruprecht, Elmar Gosteli, Remo Diethelm, and Antoine Thévenaz for their help during fieldwork, Irene Brunner for the XRF-scanning of the sediment cores and Stefan Hersberger for help with the sieving of the sediment. We are grateful to Ilya Dziomber for tips & tricks regarding figure design and to Christoph Schwörer for providing the R-code to extract temperature data from the CHELSA-TraCE21k 1.0 dataset. We thank the Management Body of the Lakes Koroneia – Volvi and the Ministry for Environment and Energy, Directorate General for the Protection and Development of Forests and the Rural Environment, Directorate of Forest Management for the permits to work in the National Park of Koroneia – Volvi and the Macedonian Tempe (reference number 83049/3963), the Hellenic Survey of Geology and Mineral Exploration (HSGME; reference numbers 1825 and 2651), and the Greek Ministry of Culture and Sports, Department of Underwater Sites, Monuments and Research (reference number 246307), for the coring permits. Thanks to B. B. S. and Skála for keeping our spirits high during fieldwork. We would like to thank the editor and the two anonymous reviewers for their constructive comments that helped to improve the manuscript.
Author contributions
Funding
The author(s) disclosed receipt of the following financial support for the research, authorship, and/or publication of this article: The research was conducted in the framework of the project “Exploring the dynamics and causes of prehistoric land use change in the cradle of European farming” (EXPLO), financially supported by the European Union’s Horizon 2020 research and innovation programme under the grant agreement No. 810586 (ERC synergy project EXPLO). C.M.-M. was supported by an “Atracción de Talento Modalidad 1” grant (2022-T1/AMB-23788) funded by the Comunidad de Madrid region.
Data availability
The pollen and charcoal datasets will be available in the Alpine Palynological Database (ALPADABA), constituent database of Neotoma Paleoecological Database (neotomadb.org). The XRF, HSI, and MS data will be uploaded to Pangaea (![]() ).
).
Supplemental material
Supplemental material for this article is available online.
References
Supplementary Material
Please find the following supplemental material available below.
For Open Access articles published under a Creative Commons License, all supplemental material carries the same license as the article it is associated with.
For non-Open Access articles published, all supplemental material carries a non-exclusive license, and permission requests for re-use of supplemental material or any part of supplemental material shall be sent directly to the copyright owner as specified in the copyright notice associated with the article.