
Abstract
Schmidt-hammer exposure-age dating (SHD) was used to evaluate the surface age, dynamics and evolution of eight talus (scree) slopes located between ~520 and ~1010 m a.s.l. in the upper Jostedalen area of southern Norway. Statistically significant differences in mean R-values were found between talus slopes but there was no consistent difference in R-values between three mid- to lower-slope positions, two operators, or first and second impacts from the same boulders. A new regional age-calibration equation yielded SHD ages ranging from 8425 ± 700 years to 2620 ± 740 years. SHD ages from talus slopes and other landforms with diachronous surfaces (such as alluvial fans, snow-avalanche fans, pronival ramparts and rock glaciers) represent the average exposure age of the surface boulders and provide insights into landform evolution. Here, our SHD ages are interpreted in terms of Early Holocene paraglacial rock-slope instability, Mid-Holocene permafrost degradation, low but possibly variable rates of rockfall activity in the Late-Holocene, and spatial variations affected by local site differences. Survival of rock particles with relatively old exposure ages towards the distal margins of the talus slopes is attributed to their slow development with low levels of modern activity. SHD ages from diachronous surfaces may considerably underestimate landform age (defined as the onset of landform formation). Greater application can be anticipated, however, in the inference of landform dynamics from the R-value distributions of diachronous surfaces and in the use of SHD age as an indicator of the extent of modern activity.
Keywords
Introduction
Talus (scree) slopes are well-known periglacial landforms that are typically formed by the accumulation of rockfall debris (talus) downslope of bedrock cliffs subject to frost weathering. The standard model of rockfall talus slope form and development envisages a rectilinear upper (proximal) slope segment with a surface gradient of ~33°–38°, and a lower (distal) slope segment that is concave in profile (Ballantyne, 2018; Luckman, 2013; Francou and Manté, 1990; Rixhon and Desmoulin, 2013; Sanders, 2010; Statham, 1976). The surface layer of the talus slope often consists exclusively of boulders, which tend to exhibit a downslope increase in size due to fall sorting whereby larger clasts have greater momentum and travel farther. However, as talus accumulates, the upper slope segment increases in height and extends at the expense of the lower slope segment while cliff height diminishes. Relatively few boulders would then have sufficient kinetic energy to travel the increased distance necessary to reach the distal segment. On mature talus slopes, therefore, boulders on the surface of the distal segment may fail to be buried by later rockfall material and hence may survive in the landscape as relicts and exhibit greater exposure ages. Preservation potential is enhanced by the high volume of voids between the boulders leading to free drainage, a lack of surface water and a sparse vegetation and soil cover.
Previous dating of talus has been attempted based on various techniques, including weathering-rind thickness (Chinn, 1981; Whitehouse and McSaveney, 1983; Whitehouse et al., 1980), lichenometry (McCarroll, 1994; McCarroll et al., 1998, 2001; Sass, 2010), dendrochronology (Lafortune et al., 1997; Moya et al., 2010; Perret et al., 2006; Šilhán, 2010; Stoffel et al., 2006) and radiocarbon dating using buried palaeosol material (Blikra and Nemec, 1998; Curry and Black, 2003; Hétu and Gray, 2000; Hinchliffe and Ballantyne, 2009; Innes, 1983). Several previous studies have included SHD of talus samples (e.g. Nesje et al., 2021; Peña-Monné et al., 2024; Santos-González et al., 2024; Scapozza et al., 2021; Scotti et al., 2017; Sumner et al., 2002) but talus was not the focus of these studies and detailed dating of talus using SHD methods has not been attempted.
Schmidt-hammer exposure-age dating (SHD) is used for calibrated-age dating of weathered bedrock surfaces and the boulder surfaces associated with depositional landforms (see the comprehensive review of Matthews and Winkler, 2022). SHD provides a relatively simple, non-destructive and inexpensive method that has been found particularly useful in glacial and periglacial landscapes where exposed bedrock and boulder surfaces are extensive, the organic material needed for several alternative dating techniques (such as radiocarbon dating, lichenometry and dendrochronology) is sparse and there are relatively few restrictions on obtaining the necessary large number of Schmidt-hammer measurements. In Scandinavia, the technique has been applied over the last decade to a wide range of active and relict periglacial landforms, including rock glaciers, pronival ramparts, snow-avalanche landforms, patterned ground, block streams, rock-slope failures, alluvial fans and cryoplanation terraces (see Matthews and Nesje, 2022 and references therein).
SHD is underpinned by the principle that the hardness and compressive strength of a rock surface declines following exposure to subaerial weathering and hence is time dependent (Matthews and Winkler, 2022). Schmidt hammers measure R-values, that is the ‘rebound values’ or ‘rebound numbers’, of a spring-loaded plunger as it impacts a rock surface. The decline in R-values with time since exposure to the atmosphere proceeds at a rate that is determined by age-calibration (i.e. defining the numerical relationship between R-value and rock-surface age for surfaces of known age). Based on large samples of R-values, the age-calibration equation is used to predict the exposure age of similar rock surfaces of unknown age within statistical confidence intervals.
Although talus slopes provide landscape surfaces that may appear suitable for the application of SHD, they present the technique with a number of challenges that are not experienced by synchronous surfaces (i.e. surfaces built in one event and then abandoned and hence entirely composed of material with the same exposure age, such as recessional moraines and rock-slope failures). As well as the burial of surface material during talus-slope development, the surface material of an active talus slope is typically unstable and, during the accumulation of talus, previously deposited debris is commonly reworked (Hinchliffe, 1999; Stoffel et al., 2006). Furthermore, variations in the quantity of rock fall and hence the talus accumulation rate may occur due to changes in the environment, including the intensity of the paraglacial response of slopes to deglaciation (André, 1997; Hinchcliffe, 1999; Hinchliffe and Ballantyne, 2009) and climatic changes during the Holocene (Hétu and Gray, 2000; Innes, 1983; Stoffel et al., 2005a, 2005b). Like many other landform surfaces, including, for example, the surfaces of alluvial fans, pronival ramparts and rock glaciers, the surface of the talus slope tends therefore to be diachronous (i.e. constructed continually or incrementally and hence composed of a boulder population of mixed exposure ages). The average exposure age of the talus surface may therefore bear little or no relationship to landform age defined as the time elapsed since the onset of talus-slope formation. It can nevertheless provide insights into the timing of rockfall activity and the development of talus slopes in relation to environmental change, including climatic change. Thus, SHD of talus is of interest not only for broadening the range of applications of this dating technique and for improving our understanding of the dynamics and evolution of talus slopes but also for potential insights into the application of SHD to other landfoms characterised by diachronous surfaces.
The four main aims of this paper can therefore be summarised as follows: (1) to present the first detailed application of SHD to talus slopes; (2) to determine the exposure ages of the boulder surface of several talus slopes in the upper Jostedalen region of southern Norway; (3) to evaluate the potential of SHD for determining talus-slope age, dynamics and evolution; and (4) to consider the usefulness of SHD more broadly in the context of diachronous surfaces.
Study area
Talus slopes are located downslope of bedrock cliffs in several valleys east of the Jostedalsbreen ice cap in the upper Jostedalen area of southern Norway (Figure 1). We selected the eight longest talus slopes in Stordalen and the tributary valleys of Sprongdalen, Vetlestølsdalen and Vanndalen, where the talus is typically dominated by coarse, boulder-sized debris (Figures 2–4). Sites in the former two valleys lie in the sub-alpine zone but are not tree covered due to the coarse substrate, whereas the latter two valleys are located above the tree line in the alpine zone. Site altitudes (distal talus surfaces) range from ~520 m to ~1010 m a.s.l. with south- or west-facing aspects.
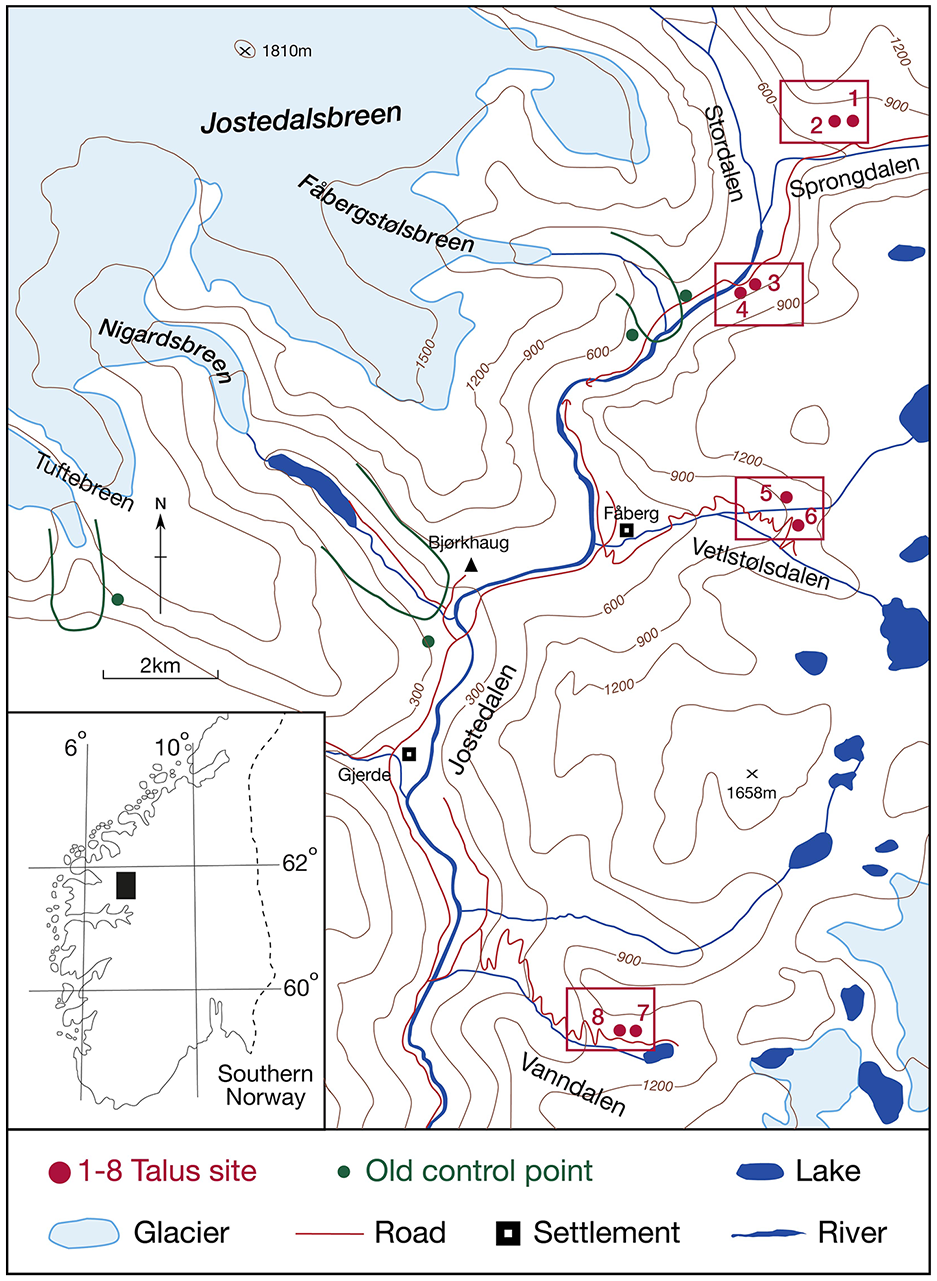
Location of eight talus sites (numbered) in Sprongdalen, Stordalen, Vetlestølsdalen and Vanndalen, upper Jostedalen region, southern Norway. The location of Bjørkhaug meteorological station (Δ) at 324 m a.s.l. and old control points outside the Little Ice Age glacier forelands of three Jostedalsbreen outlet glaciers are also shown. Glacier-foreland boundaries (green lines) are defined in the field by latero-terminal moraines. Rectangles (red) identify the areas covered in Figures 2 and 3.
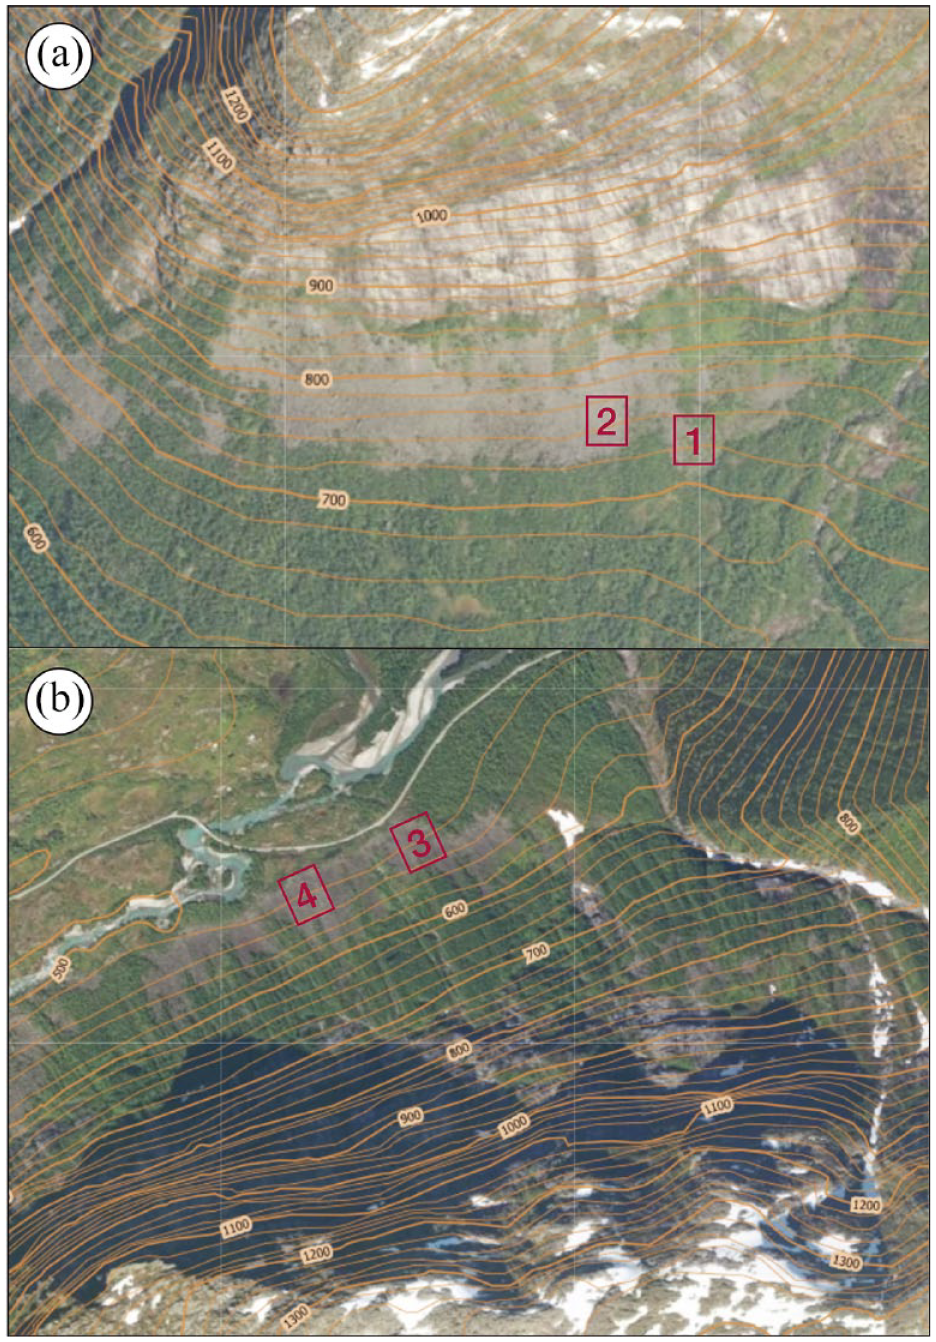
Landscape setting of the talus sites in Sprongdalen (a, Sites 1 and 2) and Stordalen (b, Sites 3 and 4) from aerial photographs with superimposed contours at 100 m intervals (http://www.norgeibilder). Sites are 60 m × 40 m as shown in Figure 4.
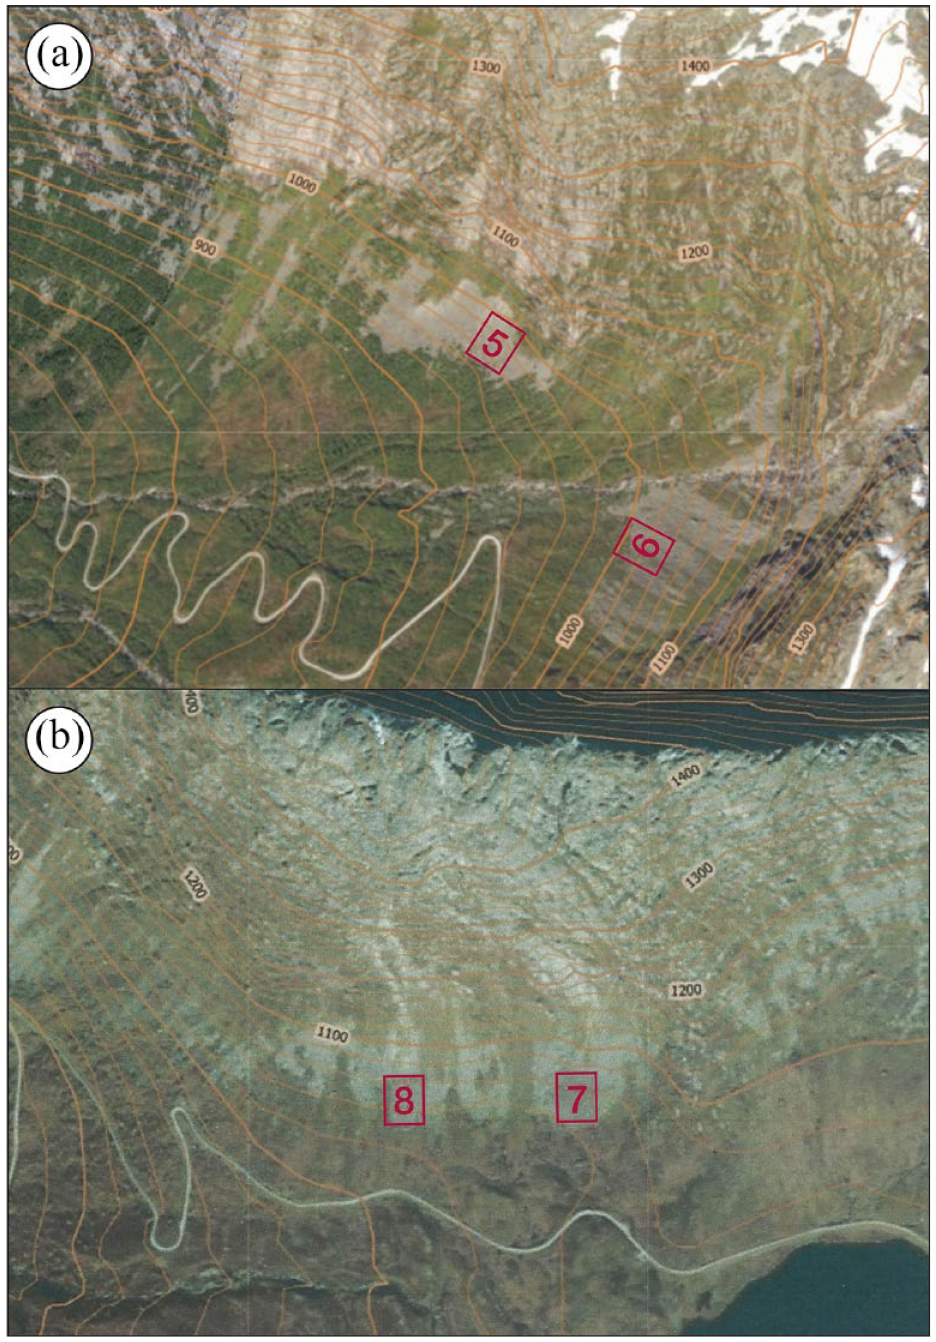
Landscape setting of the talus sites in Vetlestølsdalen (a, Sites 5 and 6) and Vanndalen (b, Sites 7 and 8) from aerial photographs with superimposed contours (http://www.norgeibilder). Sites are 60 m × 40 m as shown in Figure 4.
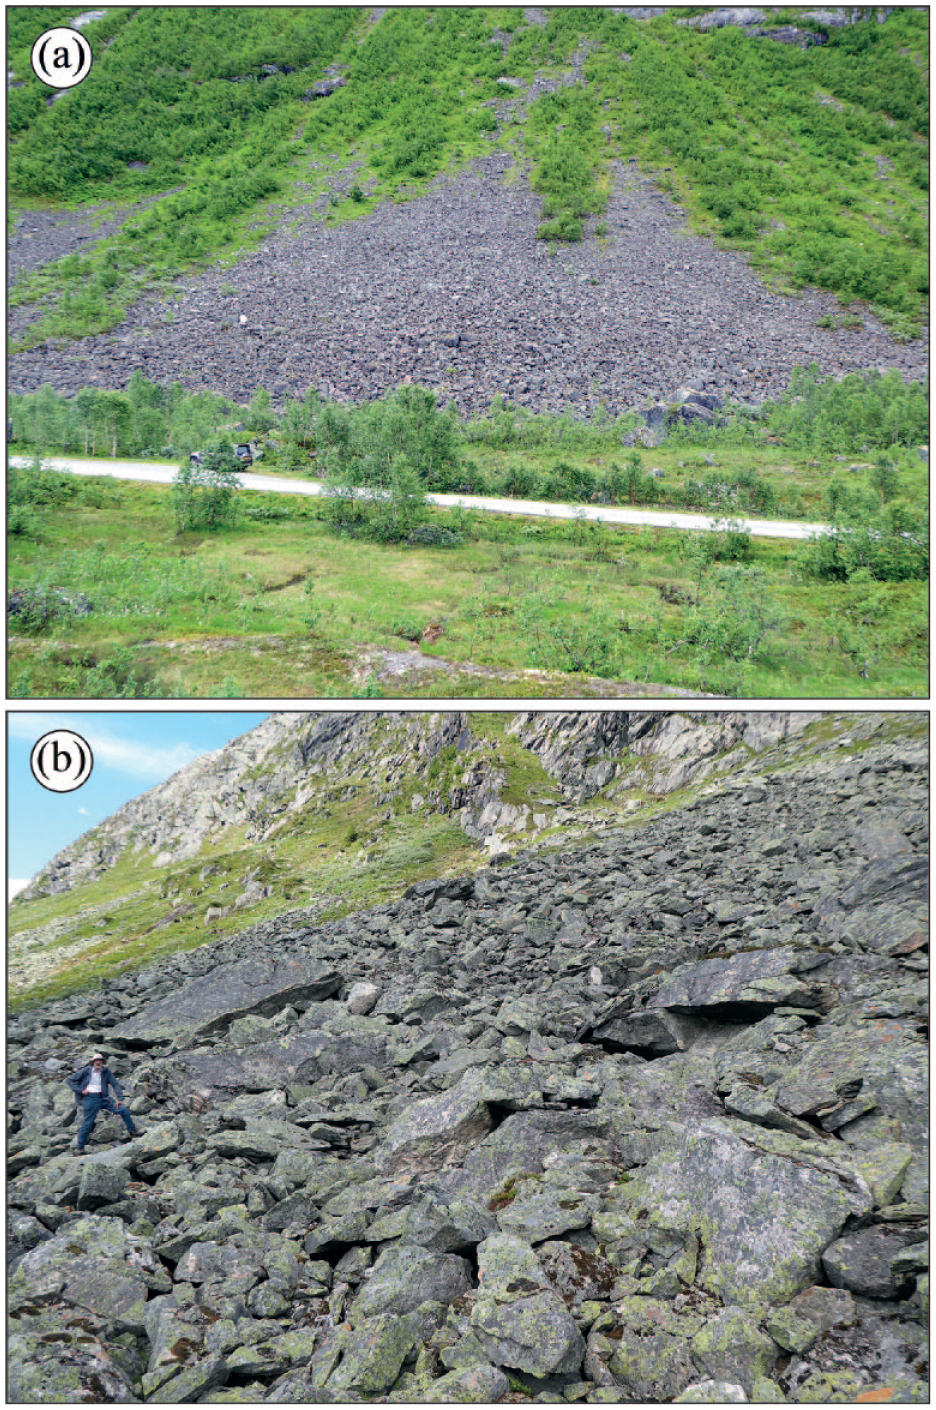
Representative photographs of talus slope characteristics in (a) Stordalen and (b) Vanndalen (note Shogun and person for scale, respectively).
Based on climatic normals (AD 1961–1990) from Bjørkhaug weather station located on Figure 1 at 324 m a.s.l. (adjusted for a temperature gradient of −0.6°C per 100 m rise in altitude), estimated mean annual air temperature (MAAT) at the sites is between −2.5°C and −0.5°C (Aune, 1993). Corresponding mean July and January air temperatures are 9.2°C–12.2°C and −0.5°C to 2.5°C, respectively. Mean annual precipitation totals are ~1400 mm (Førland, 1993), and snow depths are up to ~4.0 m (http://www.senorge.no). Bedrock is predominantly granite and granitic gneiss (Lutro and Tveten, 1996) and this is reflected in the talus boulders.
All sites are located well beyond the prominent ‘Little Ice Age’ moraines that extend up to 5 km from the present day limits of the main outlet glaciers of the Jostedalsbreen ice cap. The maximum extent of the glaciers in the Little Ice Age has been precisely dated to the mid-eighteenth century by historical evidence (e.g. Gjerde et al., 2023; Grove, 1988; Østrem et al., 1977). Early-Holocene moraines located up to about 1 km beyond these Little Ice Age limits have been dated by radiocarbon and 10Be to the Erdalen Event at 10,200–9,700 cal years BP (Dahl et al., 2002; Matthews et al., 2008). Prior to the Erdalen Event, Jostedalen and its neighbouring valleys were deglaciated by ~10,200 cal years BP following the very rapid temperature rise that occurred at the transition from Younger Dryas to Holocene (Eldevik et al., 2014; Mottershead and Colin, 1976; Nesje, 2009; Nesje and Matthews, 2024; Nesje et al., 1991). With the possible exception of nunataks, the whole region was ice-covered during the Younger Dryas (Hughes et al., 2016; Mangerud et al., 2023; Matthews et al., 2023)
Methods
R-value measurements were made using two original mechanical N-type Schmidt hammers (Proceq, 2017). Care was taken to reduce possible sources of non-age-related variability (Matthews and Winkler, 2022). Use only of boulders composed of granite or granitic gneiss ensured that the effects of lithological differences were minimised (cf. Matthews et al., 2016; Tomkins et al., 2016, 2018a). All measurements were made in dry conditions (Karakul, 2017; Sumner and Nel, 2002). Impacts were restricted to horizontal or near-horizontal surfaces where possible (cf. Karakul, 2020). Rock-surface irregularities, cracks, joints, edges and flakes, and lichen and moss cover were avoided (Matthews and Owen, 2010; Shakesby et al., 2006). Rock-surface smoothing using a carborundrum stone was not attempted (cf. Shepherd et al., 2024). Other possible rock-surface pretreatment (cleaning) of the rock surfaces was not attempted other than removal of moss and loose rock particles by hand picking.
Outliers (anomalous readings) were not discarded other than those resulting from plunger slippage. Other possible causes of anomalous readings, such as minor surface irregularities, individual minerals or hidden fractures, cannot be identified with certainty. These are assumed to randomly affect R-values from both the control surfaces and the surfaces to be dated, and to represent a relatively small component of the large natural variability in R-values that affect rock surfaces of the same age.
On each of the eight talus slopes, R-values were recorded in a grid of six, 400 m2 plots (20 m × 20 m) using the sampling design shown in Figure 5. In each plot, two impacts were made at different spots on 50 of the largest boulders, providing replicate samples of size n = 50. The sample of 50 first impacts was designated R1 and the sample of second impacts was designated R2. Two operators (O1 and O2) sampled adjacent plots at three levels – occupying lower (L1), mid (L2) and upper (L3) slope positions on the distal half of the talus slope. This design allowed variability in mean R-values between first and second impacts, between operators and between levels on the talus to be measured and any differences to be tested statistically.
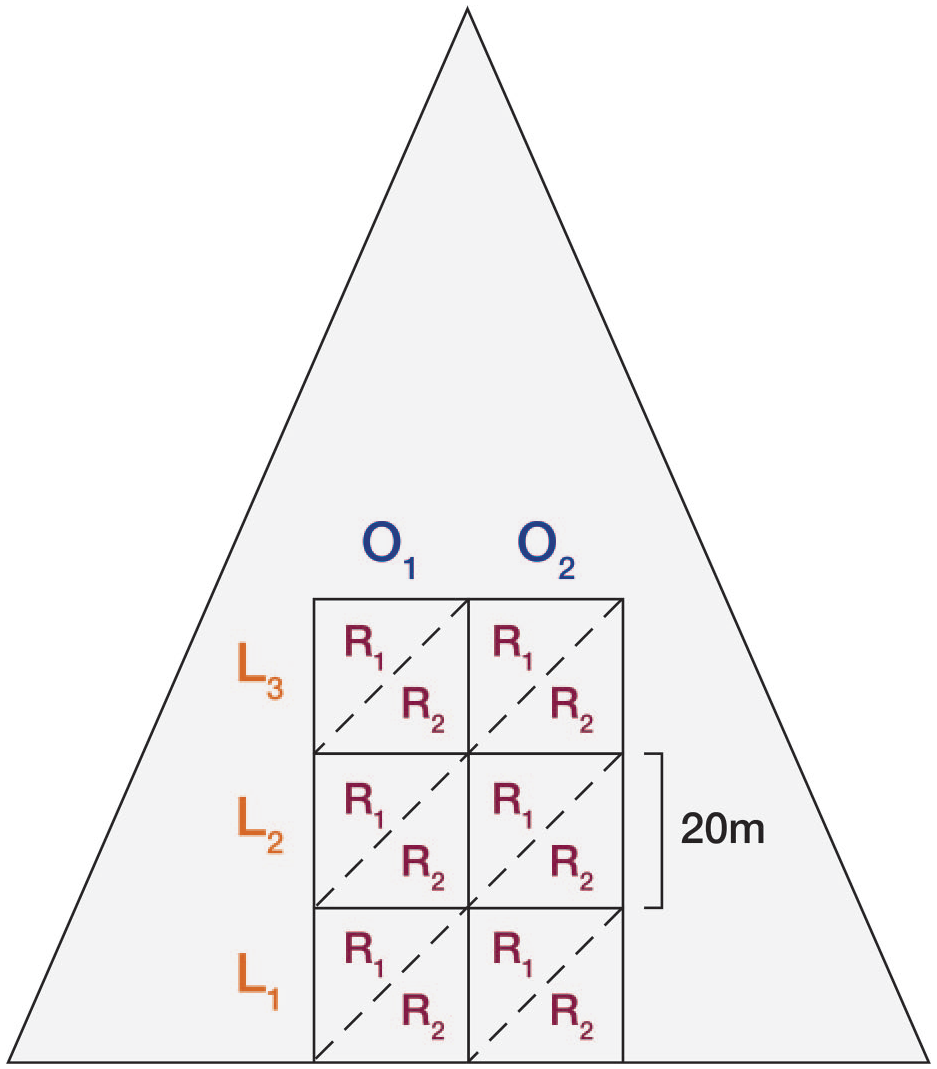
Sampling design on a hypothetical talus cone. Schmidt-hammer R-values were recorded from 50 boulders within each of six plots each measuring 20 m × 20 m; two impacts per boulder are designated R1 and R2. Plots were located in a grid at three levels (L1–L3) on the talus slope and adjacent plots were recorded by two operators (O1 and O2).
Age-calibration of mean R-values employed the ‘two-point solution’ as developed by Matthews and Owen (2010), Matthews and Winkler (2011) and Matthews and McEwen (2013) and summarised in Matthews and Winkler (2022) using a new linear calibration equation based on young and old surfaces of known age (control points). Although an approach to age-calibration based on two control points has the statistical weakness of being unable to prove the existence of a linear relationship between mean R-value and exposure-age, it can be justified on empirical and theoretical grounds. Most importantly, in applications where a sufficiently large number control points are available a linear relationship can be demonstrated, at least over the relatively short Holocene timescale (e.g. Shakesby et al., 2011; Tomkins et al., 2018a). Because chemical weathering rates are slow on crystalline rock surfaces, the non-linear weathering rate expected over longer timescales (Colman and Dethier, 1986) and detectable using control-points exposed on 104–105 timescales (Stahl et al., 2013; Tomkins et al., 2018b) can be rejected. Instead, it can be assumed that the exposure-age/R-value relationship is approximately linear in the present context involving gneissic lithologies over a timescale of ~10 ka. This is fortunate given the force majeure of a lack of suitable surfaces intermediate in age between young and old control points in the region.
The two control points actually used in this study are summarised together with other potential control points of similar exposure-age from the region in Table 1. Unweathered talus boulders recognised from their clean rock surfaces without moss or lichen growth provided the young control point mean R-value of 59.67 ± 1.06. This is the mean R-value from 142 boulders on 6 of the 8 talus slopes investigated in Sprongdalen, Vetlestølsdalen and Stordalen. The estimated age of <20 years for these young rock surfaces is based on the time required for the establishment of visible yellow-green lichens (Rhizocarpon geographicum agg.) in this area (Bickerton and Matthews, 1992, 1993; Trenbirth and Matthews, 2010).
Potential control-point R-values from granitic lithologies within the broader region (±95% confidence intervals). Young and old control points in bold were used in this study as explained in the text. Values from the other potential control points were not used in this paper but are included in the table for comparative purposes.
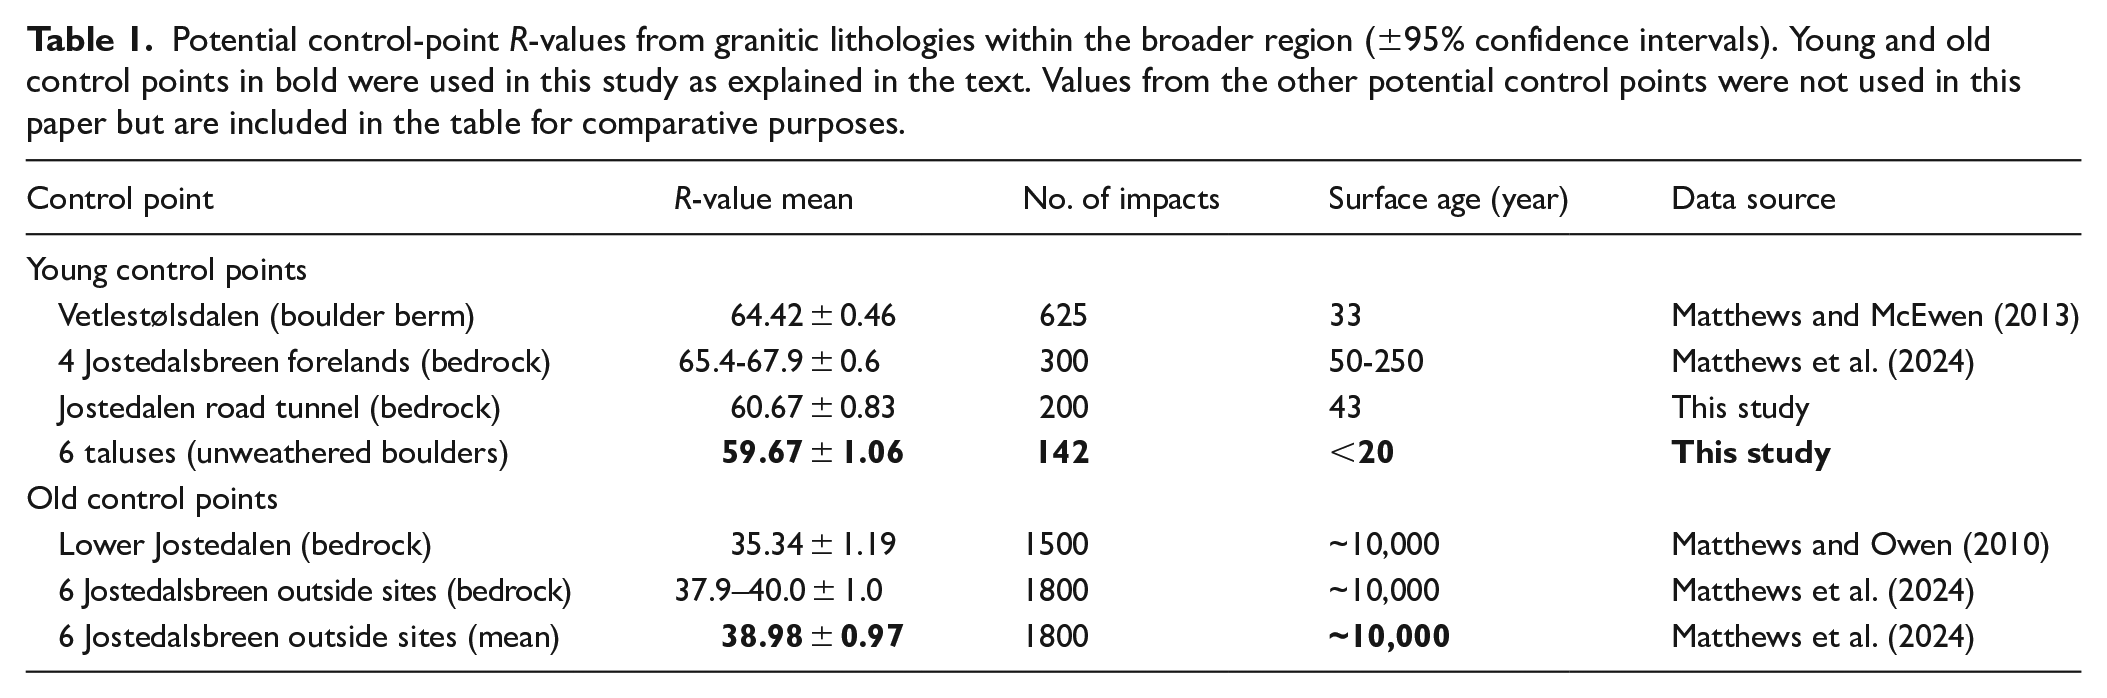
The other potential young control-point R-values shown in Table 1 are less appropriate on account of the nature of the surface of unweathered talus boulders, which tends to be rough and irregular. Mean R-values used in previous studies in the area come from glacially-scoured bedrock outcrops (Matthews and Owen, 2010; Matthews et al., 2024) or fluvially transported boulders (Matthews and McEwen, 2013; Matthews et al., 2015), the smoother, abraded surfaces of which yield higher R-values. The mean R-value of 60.67 ± 0.83 obtained from non-abraded bedrock surfaces inside the road tunnel excavated near Fåberg in AD 1979 is in close agreement with and hence supports the validity of the young control-point value used in this study. Rock fracturing during tunnel excavation seems not to have affected the R-values in this case.
Our old control point mean R-value of 38.98 ± 0.97 is the average value obtained from a total of 1800 impacts obtained using identical methods from six glacially scoured granitic bedrock surfaces located outside (distal to) the Little Ice Age glacier forelands of five Jostedalsbreen outlet glaciers (Matthews et al., 2024). Four of these surfaces are associated with the glaciers Fåbergstølsbreen, Nigardsbreen and Tuftebreen (Figure 1). The other two sites are associated with Bødalsbreen and Austerdalsbreen, which are located beyond the area shown in Figure 1. All these old control sites were deglaciated immediately prior to the glacier advance of the Erdalen Event when the outlet glaciers of Jostedalsbreen extended up to 1 km beyond their Little Ice Age extent (Dahl et al., 2002). The use of 10 ka for the age of the old control point in this study is based on radiocarbon dating at Nigardsbreen where Erdalen Event moraines formed at 10,200–9,700 cal. BP (Dahl et al., 2002).
The range of mean R-values between the six outside sites (37.9–40.0 ± 0.97) indicates consistent rates of long-term weathering following exposure for a similar period of time at these sites (discussed fully in Matthews et al., 2024) and hence supports the derivation of a single age-calibration equation for SHD dating of our talus slopes from different valleys in the region. Other potential old control sites included in Table 1 were not used as control points in this study as they yielded less consistent R-values, most likely due to small differences in environmental and/or lithological conditions.
The significance of differences between the SHD ages of the talus slopes is judged using 95% confidence intervals (Ct), which combine the statistical errors associated with the calibration equation (Cc) and the sampling error associated with each talus slope (Cs). Variations in the shape of the frequency distributions of R-values from each talus slope are used to aid further the interpretation of the SHD ages. This is particularly appropriate for diachronous surfaces, such as talus slopes, where mixed boulder populations of varying age can be expected (Matthews and Winkler, 2022).
Results
Variation in mean R-values
Mean R-values derived from first and second impacts combining all the data (n = 300 impact pairs) from both operators and from all three levels on the eight talus slopes were compared using the non-parametric Wilcoxon matched-pairs signed-ranks test (Matthews, 1981; Siegel, 1956). This tested for a consistent difference between the first and second impacts from the eight talus slopes. The difference in R-values from each of the eight talus slopes was very small, ranging from +0.26 (Vanndalen 2) to −1.23 (Vetlestølsdalen 1), and the null hypothesis of no difference between first and second impacts could not be rejected (p > 0.05). Application of the same Wilcoxon test of the difference in mean R-value between the two operators, which ranged from +2.98 (Sprongdalen 1) to −0.59 (Sprongdalen 2), produced a similar, statistically insignificant result that indicates no consistent operator error.
Small differences in mean R-value between the three levels on the eight talus slopes (Table 2) were tested using the non-parametric Friedman two-way analysis of variance by ranks (Matthews, 1981; Siegel, 1956), with the conclusion that there is no consistent difference (p > 0.05) between the three levels. Nevertheless, relatively large differences of >4 units between certain levels at two of the taluses (Vanndalen 2 and Sprongdalen 2) are exceptional in that they are statistically significant according to their 95% confidence intervals. In general, however, the non-significant differences in R-values between first and second impacts, operators and levels permit similar sample mean values to be combined and relatively large sample sizes to be used for age-calibration and SHD age estimation for each talus slope as a whole (600 impacts).
R-values from three levels on eight talus slopes (n = 200 impacts for each level at each site). Sites are located on Figure 1.
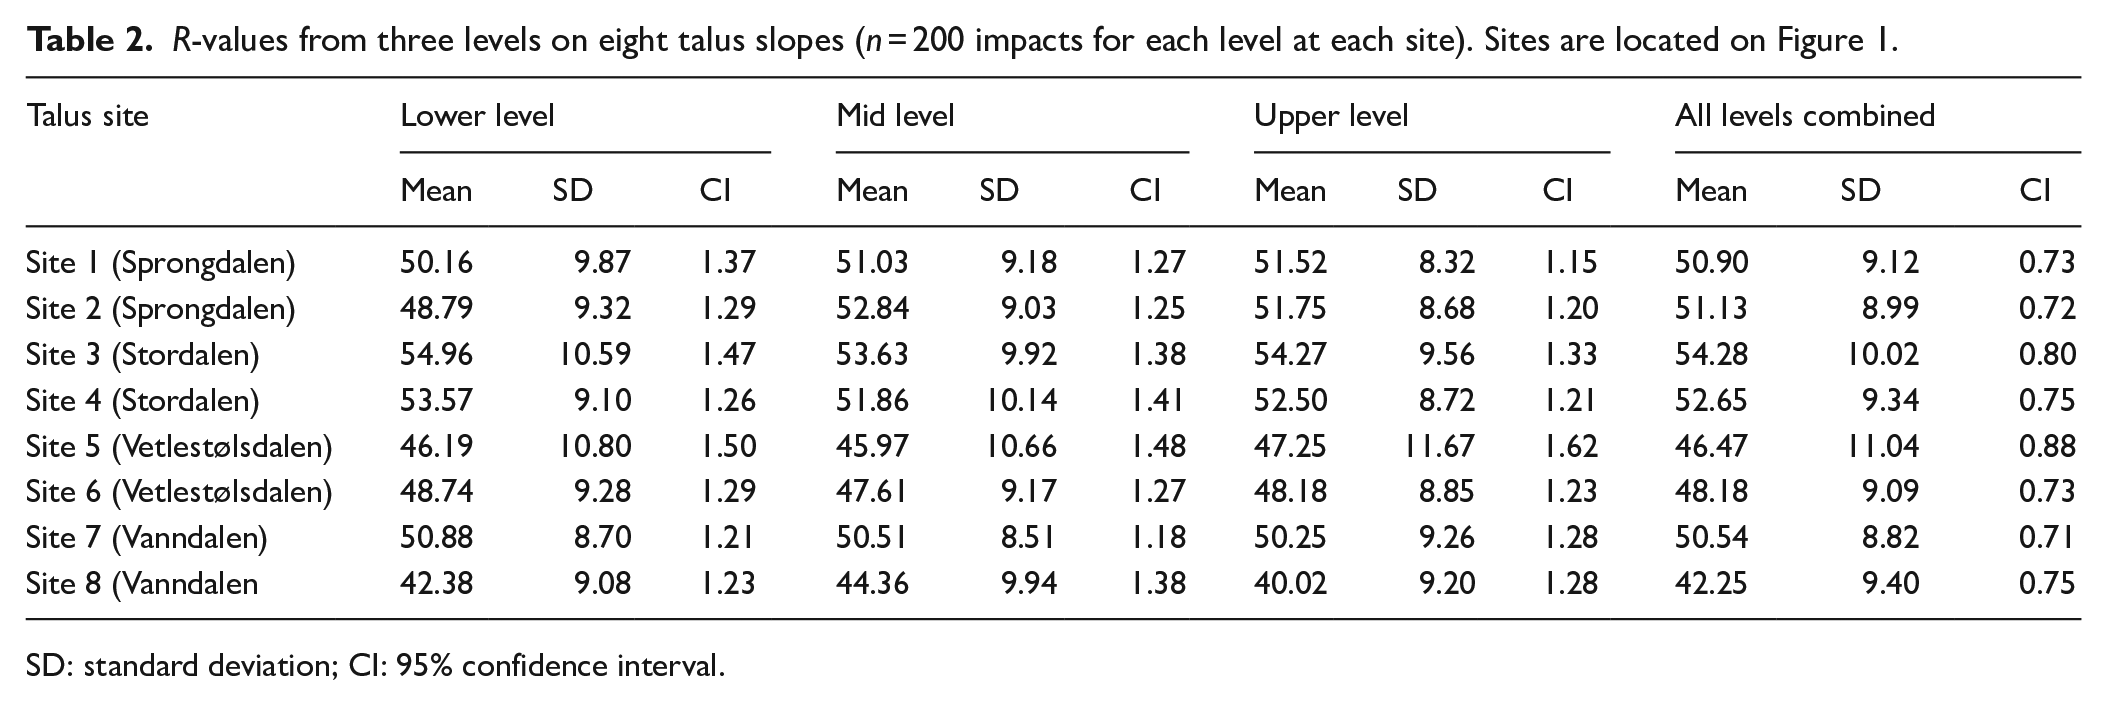
SD: standard deviation; CI: 95% confidence interval.
Calibration equation and predicted SHD ages
The linear calibration equation (y = 28,802.34 − 482.36x) derived from the ~20 unit difference between the mean R-values of the two control points of contrasting exposure age is illustrated in Figure 6. Resulting SHD ages for the eight talus slopes, which are summarised in Table 3, can be visualised with reference to Figure 7. All the SHD ages lie between and are significantly different from the exposure ages of the young and old control points. Most exhibit Mid-Holocene ages. SHD ages of 8425 ± 700 (Vanndalen 2) to 2620 ± 740 years (Stordalen 1) demonstrate a wide range of exposure ages from the transition between the Early and Mid-Holocene to the first half of the Late-Holocene.
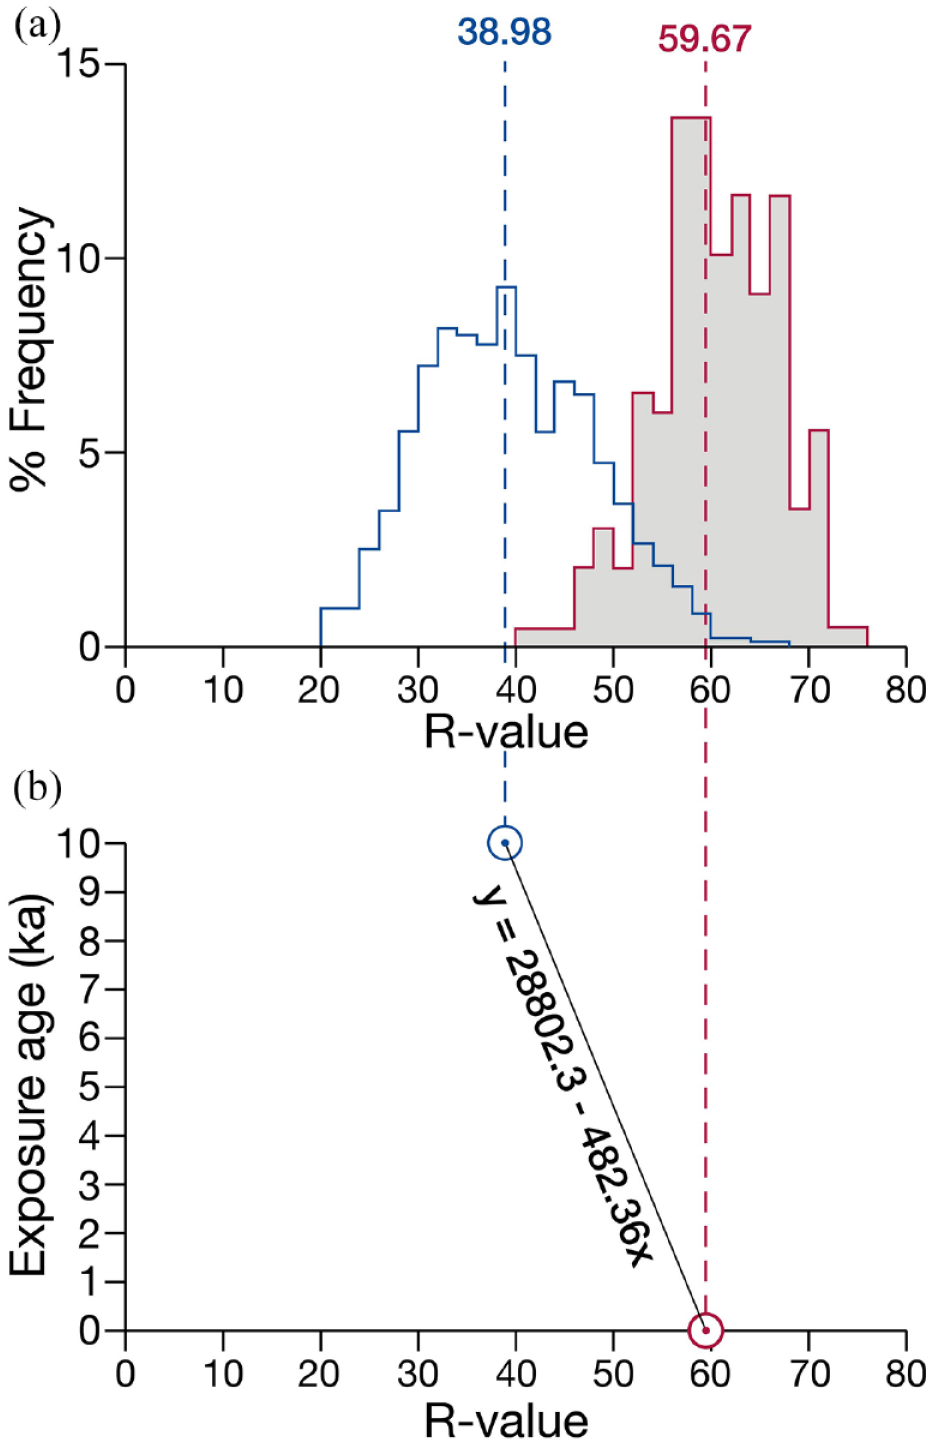
(a) R-value distributions and mean R-values of the old (blue) and new (red and shaded) control points linked to (b) the linear relationship between mean R-value and surface age and the age-calibration equation.
R-values and SHD ages from the eight talus slopes (600 impacts per talus; data from all levels combined).
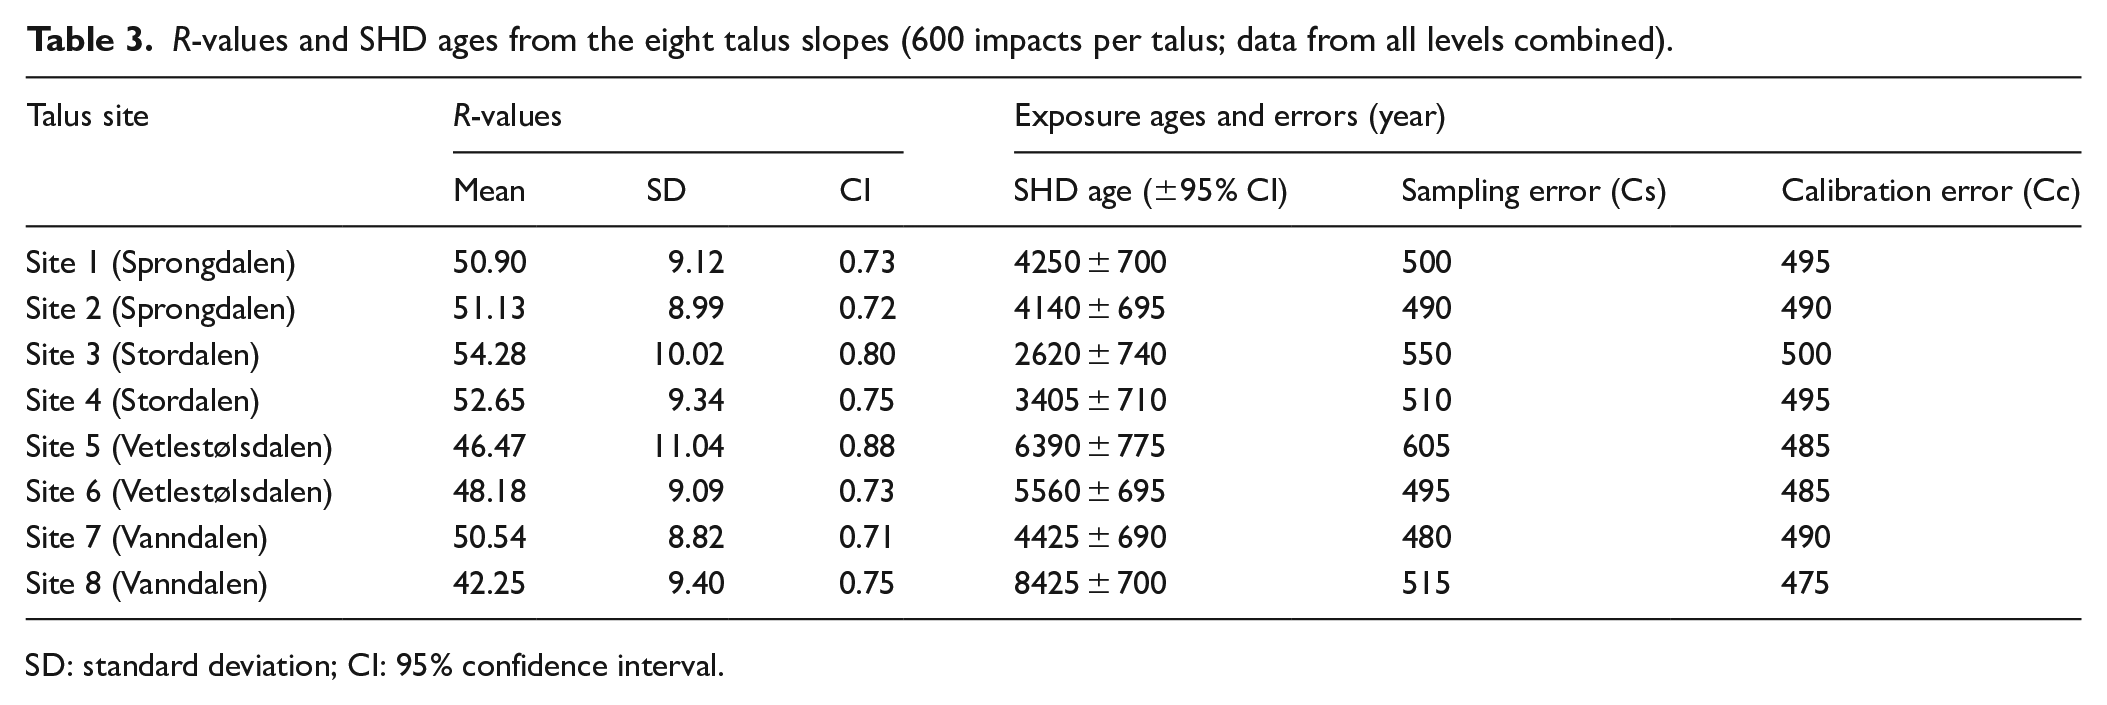
SD: standard deviation; CI: 95% confidence interval.
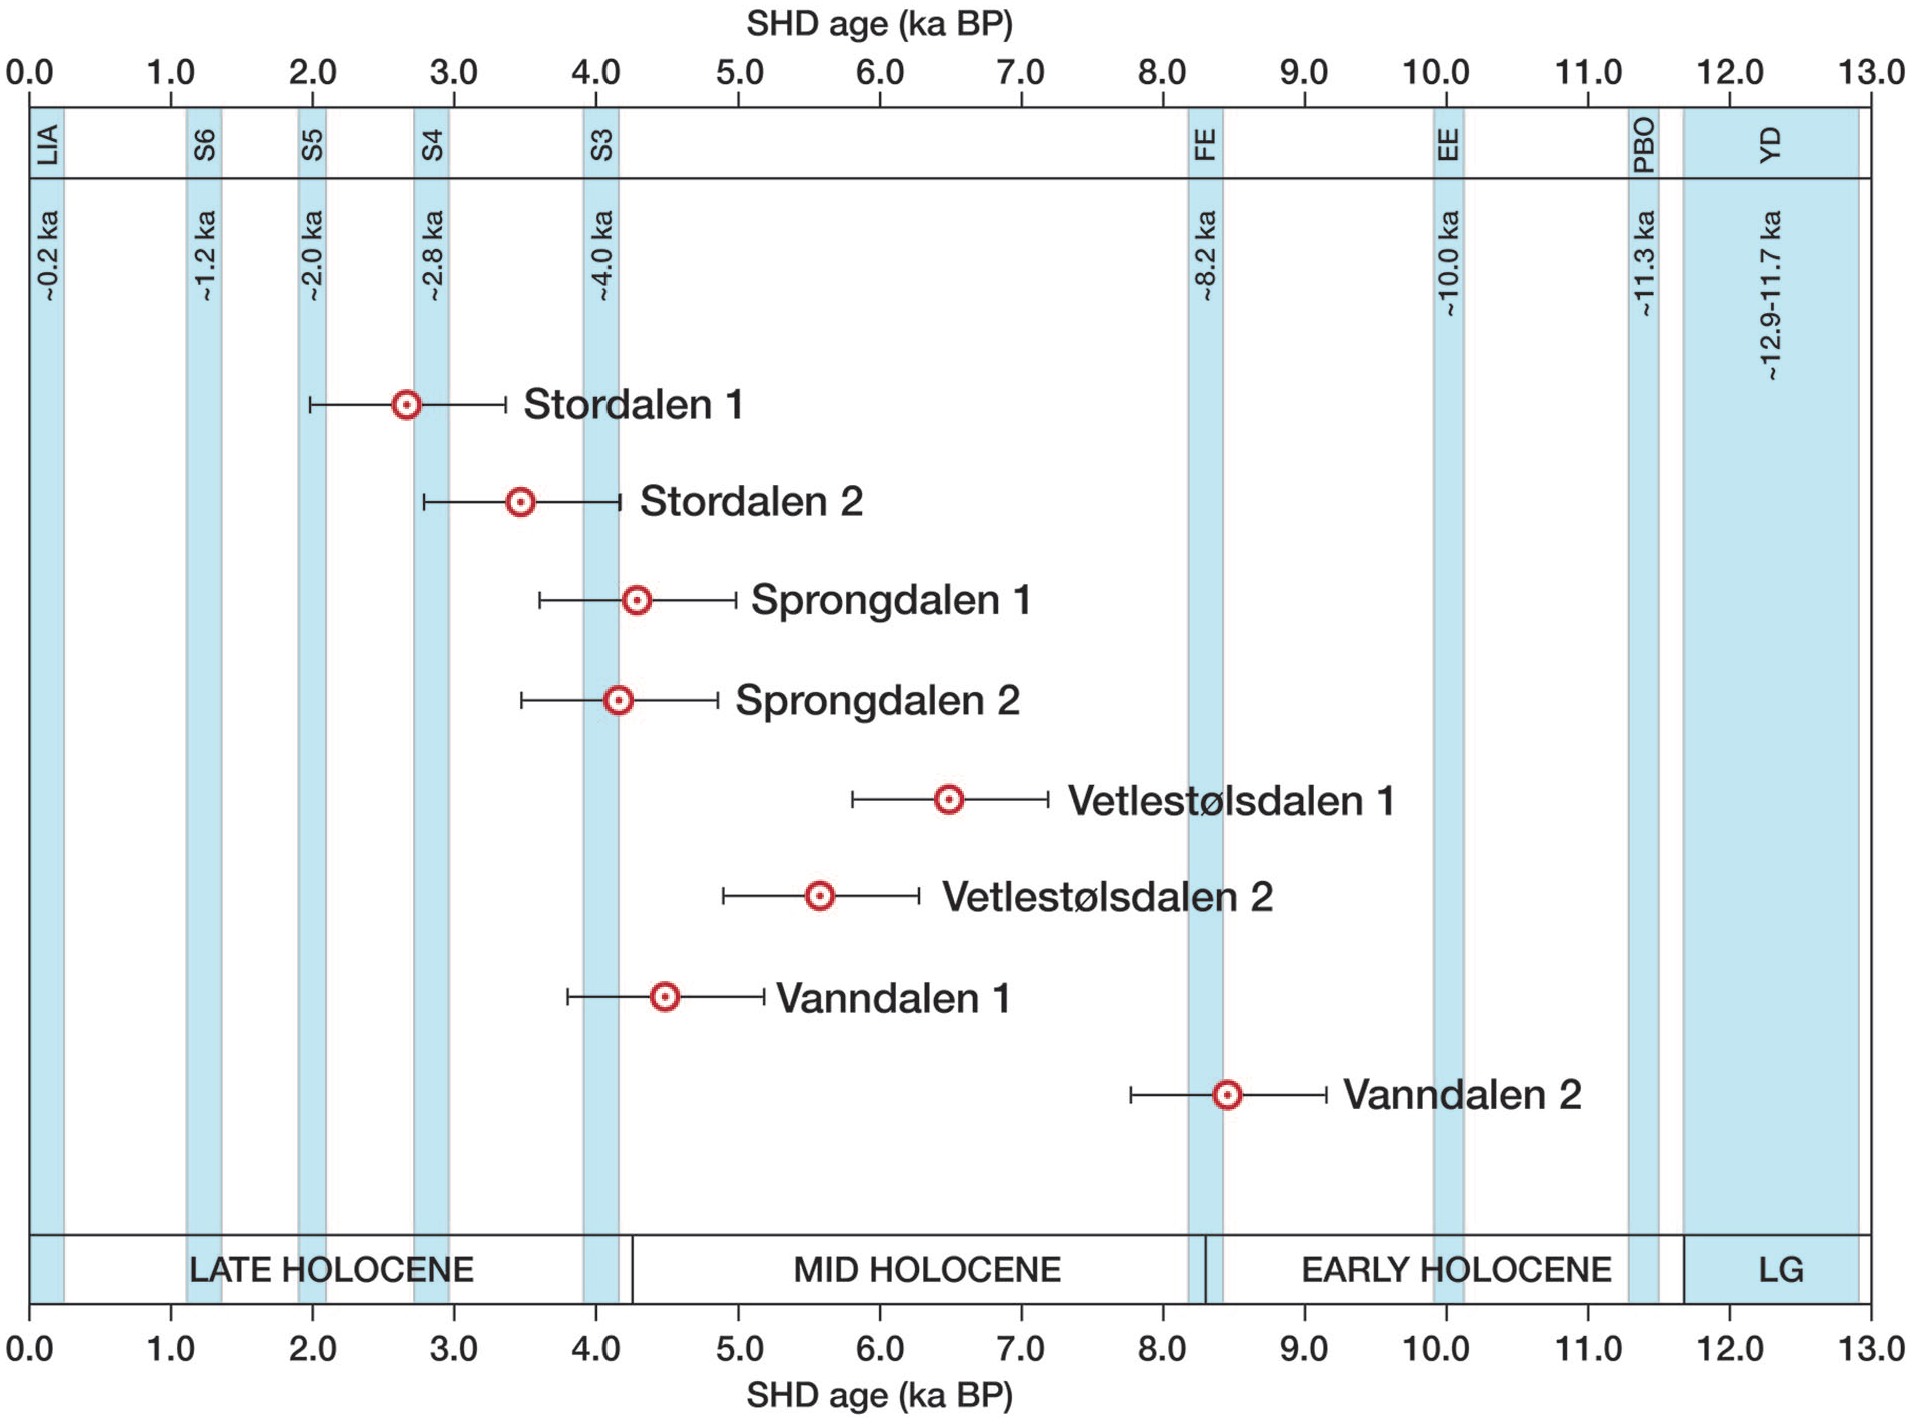
SHD ages (with 95% confidence intervals) of eight talus slopes in relation to the maxima of centennial- to millennial-scale glacier-expansion episodes indicative of cold periods in southern Norway (cf. Bakke et al., 2010; Nesje and Matthews, 2024; Matthews and Dresser, 2008).
Non-overlapping confidence intervals in Figure 7 show statistically significant differences in SHD age between many of the talus slopes. In three valleys (Vetlestølsdalen, Sprongdalen and Stordalen), the SHD ages of the two sites do not differ significantly, as indicated by overlapping confidence intervals. Thus, the SHD ages of the talus slopes in Vetlestølsdalen lie between 7.2–4.9 ka with 95% certainty; those in Sprongdalen between 5.0 and 3.5 ka; and those in Stordalen between 4.1 and 1.9 ka. In contrast, non-overlapping confidence intervals indicate significantly different SHD ages of 9.1–7.7 ka and 5.1–3.7 ka for Vanndalen 2 and Vanndalen 1, respectively.
R-value frequency distributions
The frequency distributions of R-values from the talus slopes (Figure 8) differ in shape from those of the control points (Figure 6). The asymmetrical distributions of the talus slopes are characterised by various degrees of negative skew with relatively long lower tails. In contrast, the control surfaces have near symmetrical distributions without long lower tails. The kurtosis of the talus-slope distributions tend to be intermediate in comparison to the strongly peaked (leptokurtic) distribution of the young control surface and the broader, platykurtic distribution of the old control surface. Two of the distributions, Vetlestølsdalen 1 and Vanndalen 2, exhibit evidence of secondary modes below the mean value of the old control surface (R-values of 30–33), but these modes are poorly developed. Such differences in skew, kurtosis and modality of the talus-slope distributions are interpretable in relation to the diachronous nature of talus-slope surfaces (see below).
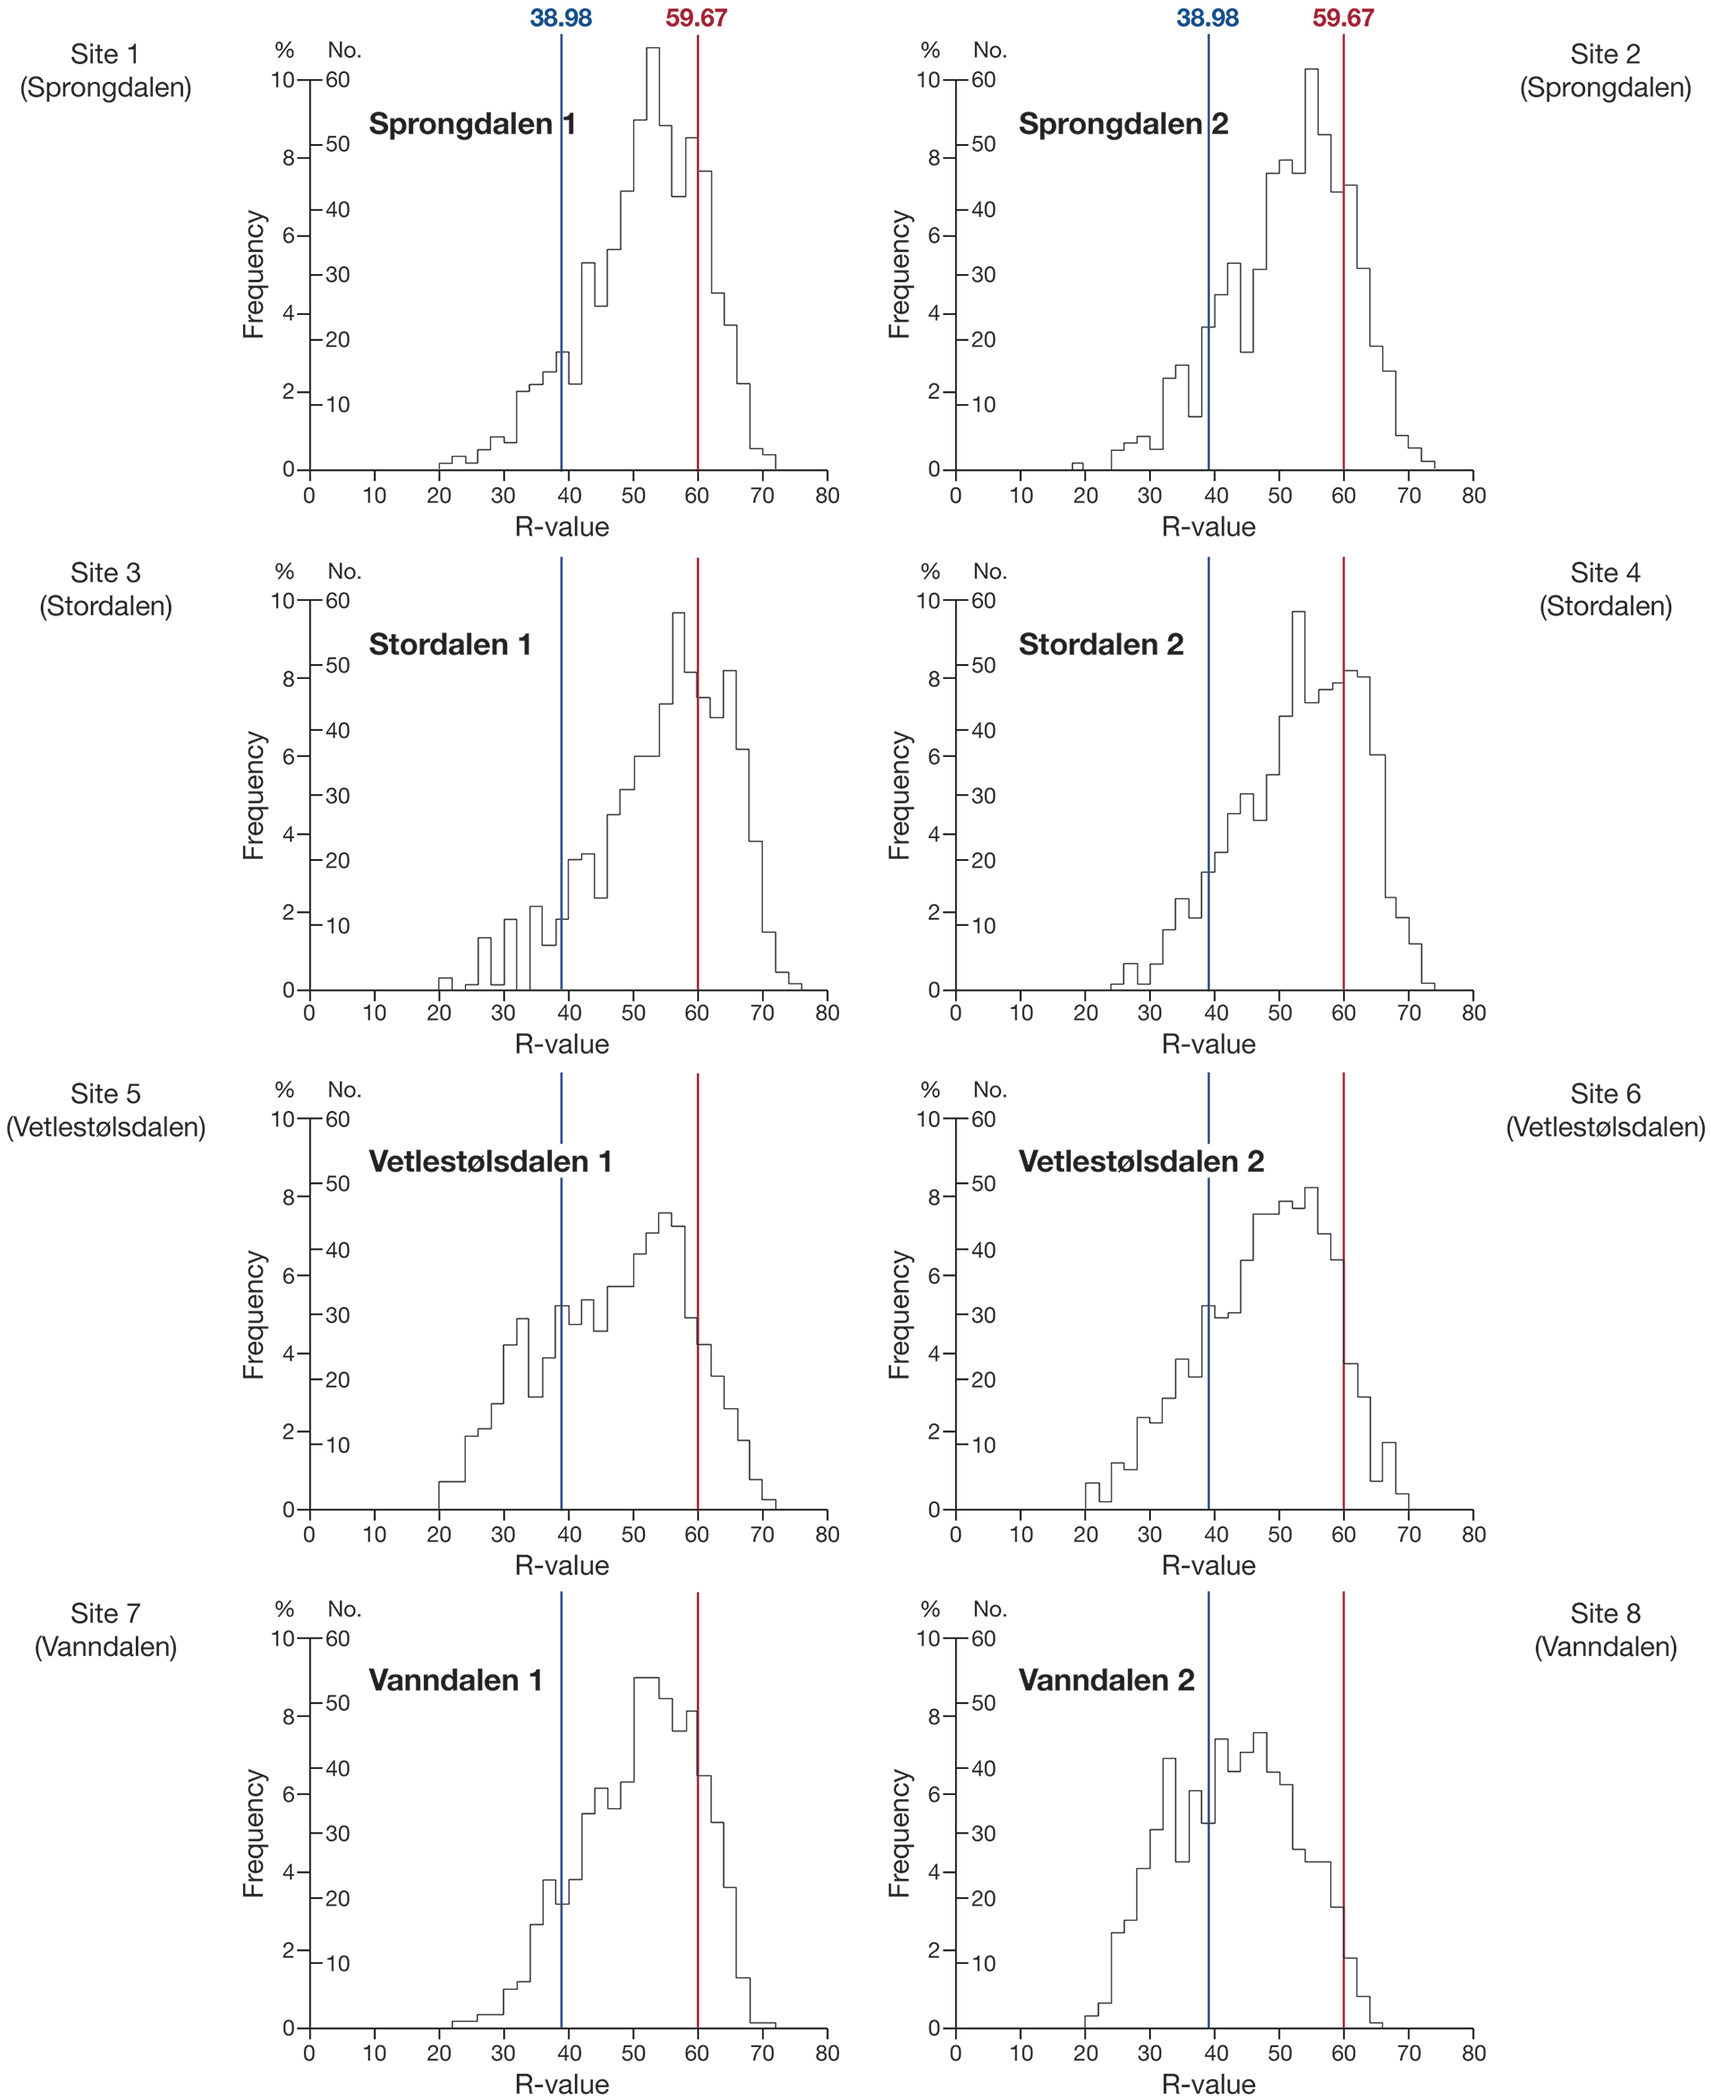
R-value distributions for eight talus slopes. Each frequency histogram is based on 600 R-values. Vertical lines indicate the mean R-values for old (left, blue) and young (right, red) control points.
Discussion
SHD ages from talus slopes as diachronous surfaces
SHD ages derived from boulder landforms represent the average exposure-age of a large number of boulders, that is the average time elapsed since exposure of the boulder surfaces to subaerial weathering (see Matthews and Winkler, 2022; Matthews et al., 2014). The meaning of a SHD age is simple for a landform, such as a recessional moraine or rock-slope failure, deposited by a single event over a very short time span (at one moment in time or perhaps over decades or even centuries). Such synchronous surfaces are characterised by boulders all of which were exposed to the atmosphere at approximately the same time. The interpretation is more complex for diachronous surfaces, such as talus slopes, alluvial fans, rock glaciers and protalus ramparts, which consist of boulders that were deposited continuously or incrementally over millennia. Thus, whereas the SHD age of a synchronous surface may approximate the landform age, that is the time elapsed since the onset of the formation of the landform, the exposure age of a diachronous surface provides only a minimum estimate of landform age, which may be appreciably younger than the landform age.
With the exception of one site (Vanndalen 2, 8425 ± 700 years), Figure 7 demonstrates that the SHD ages from the talus slopes are Mid- to Late-Holocene, ranging from 6390 ± 775 years (Vetlestølsdalen 1) to 2620 ± 740 years (Stordalen 1). Combined with evidence from the R-value distributions, these average exposure ages of the surface boulders indicate that the talus slopes are essentially relict, diachronous surfaces with low levels of modern activity. This conclusion is supported by the small number of boulders that lack lichen growth as well as the frequency distributions of R-values (Figure 8). Even in the case of the youngest SHD age (Stordalen 1), the mean R-value is >5 units lower than that of the (synchronous) modern control surface. Furthermore, R-values as low as 20–40, which are characteristic of the (synchronous) old control surface (Figure 6) are present in appreciable numbers on the talus slopes.
The negative skew of the talus slope R-value distributions appear, moreover, to be a reliable indicator of the presence of surface boulders with a relatively old exposure age. The boulders that comprise the ends of the lower tails of the distributions likely survived burial by later talus deposition. This interpretation is consistent with the association of the youngest SHD ages (Stordalen 1 and 2) with the longest, tapering lower tails, which contain only a small number of boulders with low R-values. The four relatively old talus slopes from Vanndalen and Vetlestølsdalen exhibit more platykurtic distributions with a higher frequency of boulders characterised by low R-values and/or a tendency in some cases towards secondary modes close to the mean R-value of the old control-point distribution. The near-symmetrical distribution of the R-values from the oldest talus slope (Vanndalen 2) provides the exception that proves the rule. This talus slope is close to the (synchronous) old control surface in terms of both its R-value distribution and SHD age. Its combination of a high frequency of R-values <40 with an equally anomalously low frequency of R-values > 60 indicates a relict landform with an almost complete lack of modern activity.
Talus slope development, rockfall activity and environmental change
Prior to regional deglaciation around 10,000 years ago, it can be assumed that during successive glaciations, scouring by ice streams efficiently eroded oversteepened valley sides even though plateau landscapes may have been little affected by cold-based ice sheets (Andersen et al., 2018, 2019; Kleman et al., 2008; Nesje and Willans, 1994). During and following deglaciation, rock-slope instability would have been high as a consequence of such factors as ice-sheet thinning, glacial debutressing, glacio-isostatic uplift and seismic shock (Böhme et al., 2015; Curry, 2021; Hermanns et al., 2017). Paraglacial triggering is likely to have led to higher rates of rock-slope failure and rockfall and hence faster development of talus-slopes than later in the Holocene (Blikra and Nemec, 1998; Matthews and Nesje, 2022; Rapp, 1960). Secondary modes in our talus-slope R-value distributions (Figure 8), which lie close to the mean R-value of the older control surface, are consistent with this concept of a paraglacial maximum in the accumulation of talus.
Later in the Holocene, as the paraglacial influence waned, rapid warming (Eldevik et al., 2014; Mauri, et al., 2015) would have provided a new source of rock-slope instability, namely permafrost degradation. Evidence of significant slope instability from this source is widespread in southern Norway in relation to rock-slope failures both large (Hilger et al., 2018, 2021) and small (Matthews et al., 2018). The small rock-slope failures in Jotunheimen ranging in volume from 12 to 2520 m2 increased in frequency during the Early- and Mid-Holocene reaching peak frequency at ~4.5 ka, close to the end of the Holocene Thermal Maximum when permafrost depth was at a minimum (Matthews et al., 2018). The decline in activity after that date was attributed to the exhaustion of permafrost at depths shallow enough to host small rock-slope failures. Rates of rockfall activity, defined as the release of individual rock particles from rock-slopes, are likely to have had a similar response to thawing permafrost, and hence to have contributed to the continued growth of talus-slopes as well as related landforms such as pronival (protalus) ramparts (Matthews and Wilson, 2015; Matthews et al., 2011) and snow-avalanche fans (Matthews et al., 2020). However, peak rockfall activity associated with permafrost degradation may have occurred earlier in the Jostedalen area because the rock faces there occur further below the lower altitudinal limit of mountain permafrost than in Jotunheimen (cf. Etzelmüller et al., 2003; Lilleøren et al., 2012; Magnin et al., 2019; Matthews and Nesje, 2022).
Different climatic controls on talus-slope development seem to have come into play in the Late-Holocene, when seasonal frost rather than permafrost affected rockfall activity. Blikra and Nesje (1997) and Blikra and Nemec (1998) record a progressive increase in rockfall activity after ~3.8 ka interrupted by the development of radiocarbon-dated humic palaeosols, which signify stable phases with non-deposition of talus. Cooler and possibly wetter conditions appear to be associated with the increase in active talus deposition in the Late-Holocene and also with shorter-lived episodes of activity dated by lichenometry and analysed further by simulation modelling (McCarroll et al., 1998, 2001). They concluded that the rate of rockfall-talus accumulation in the 18th century (the coldest phase of the Little Ice Age) could have been five times the background rate during the Late-Holocene. Similar episodes of enhanced activity might be postulated for several other centennial- to millennial-scale glacier-expansion episodes, which are indicative of intervals of relatively cold climate (see Figure 7). However, the SHD evidence from the present study indicates that most talus-slope development took place as a result of paraglacial rockfall in the Early Holocene followed by generally low acquisition of debris thereafter. Little rockfall activity occurred at our sites during the Little Ice Age (unless it was deposited on the upper slopes and did not affect the mid and lower slopes).
Differences in SHD ages between sites indicate that local factors moderate regional controls on rates of rockfall and talus accumulation. In general, talus slopes in Stordalen and Sprongdalen at altitudes of 500–700 m a.s.l. yielded younger exposure ages than those around 1000 m a.s.l. in Vetlestølsdalen and Vanndalen. For three of the valleys (Stordalen, Sprongdalen and Vetlestølsdalen), overlapping confidence intervals indicate site pairs that do not differ significantly in exposure age. Local geological differences and/or differences in the extent of the bedrock cliffs between valleys likely provide such valley-specific controls, which would bear further investigation. The anomalous R-value distribution and exposure age of the Vanndalen 2 site may have been affected by one or more rock-slope failures in the Early Holocene, the debris from which survived later burial.
The chance of survival of highly weathered surface boulders with relatively old exposure ages, especially at the distal fringe of talus slopes, increases if the rate of accumulation of talus is slow. Under such circumstances, it is possible but unlikely that the SHD age of such diachronous surfaces may approximate the onset of talus-slope formation (landform age). On more active talus accumulations with higher rates of rockfall, the younger exposure-age of surface boulders should be more useful as an indicator of the extent of modern activity, with exceptionally active landforms yielding modern ages.
Conclusions
We demonstrate, for the first time, the detailed application of SHD to talus-slopes with implications for other coarse-grained depositional landforms with diachronous surfaces (such as rock glaciers, pronival ramparts, snow-avalanche landforms and alluvial fans). Our SHD dates, which range from late in the Early Holocene to early in the Late-Holocene, represent the average exposure age of the surface boulders, and reflect spatial and temporal variation in the rate of rockfall activity. With the aid of an analysis of R-values distributions, relatively old SHD ages are interpreted as indicating the primary importance of Early Holocene paraglacial instability of oversteepened rock slopes following regional deglaciation, combined with later permafrost degradation associated with the Holocene Thermal Maximum and short-term Late-Holocene cold-climate events. Generally slow rates of talus accumulation led to inefficient burial of surface material, especially on the distal part of the talus slope, and survival at the talus-slope surface of boulders with a relatively old exposure-age. However, SHD ages from talus slopes and other diachronous surfaces, provide only minimum estimates of landform age (defined as the timing of the onset of landform formation). Even where deposition rates are low, SHD ages are unlikely to be close estimates of landform age. On the other hand, SHD ages can be a reliable estimate of land-surface age and, where deposition rates are relatively high SHD ages should prove useful for inferring land-surface dynamics and as an indicator of modern activity levels.
Footnotes
Acknowledgements
Author contributions
Funding
The author(s) received no financial support for the research, authorship, and/or publication of this article.