
Abstract
The Aegean region has a wealth of archeological data originating from a long and rich human history and is frequently used as a testbed for climate-society interactions at different time scales. Here, we summarize and synthesize 31 proxy records derived from lake and wetland sediments, marine sediments, and speleothems reflecting hydroclimatic conditions over the last 10,000 years in the Aegean. To enable comparison and numerical analyses, we convert each record into z-scores and average values into centurial and decadal bins. The long-term hydroclimatic trajectory is best described by individual trends in three sub-regions that periodically converge and diverge. The results from our analyses highlight the complex long- and short-term spatio-temporal patterns of the hydroclimate with periods of wetter and drier conditions. Statistical analyses of the last 3500 years, the most data-rich period, corroborate the complex climate picture. Three periods that appear dry in the regional averages, at 7250–6650 BP, 3350–2750 BP, and 1200–700 BP, highlight spatio-temporal variability and underpin the importance of local data when comparing hydroclimate data with archeological information. Considering the complexities and uncertainties in hydroclimate records, we advocate for careful consideration when utilizing these in studies of climate-society interactions, including transparency regarding their uncertainties and the relevance of each record to a respective archeological site. We have produced a freely available, simplified dataset that can be used by those interested in studying the region, as well as maps displaying climatic conditions during each century.
Introduction
The long and diverse human history of the Aegean has left rich archeological and paleoenvironmental remains. These have been studied extensively, producing a detailed history of societal, agricultural, and environmental change. Since the Neolithic, societies in the Aegean region have primarily relied on a rain-fed agro-pastoral economy for their subsistence, with surplus turned into commodities for trade (Izdebski et al., 2020; Weiberg et al., 2021). The semi-arid and often unpredictable climate made this economic basis constantly exposed to the risk of reductions in rainfall. This, in combination with a growing number of hydroclimate records from the area (Figure 1), makes the Aegean a very promising testbed for climate-society interactions at different timescales and in different environmental settings. In the Aegean, like in much of the Mediterranean, the links between societal change and climate change have been discussed and investigated on different spatio-temporal scales (e.g. Post, 2022; Roberts et al., 2018, 2019; Schirrmacher et al., 2020; Weiberg et al., 2021). In many instances, climate change has been used to interpret and explain profound and rapid societal transformations both on long (multi-centurial to millennial) and short (decadal to centurial) time scales. Most well-known are perhaps the hotly-contested narratives that link short-term climate change with societal “collapse” at certain intervals in time. These time intervals are, for example, the 8.2, the 4.2, and the 3.2 ka climate events (Bini et al., 2019; Flohr et al., 2016; Hazell et al., 2022; Kaniewski et al., 2020; Kaniewski and Van Campo, 2017; Knapp and Manning, 2016; Weiss et al., 1993; Weninger et al., 2006). However, recent research shows that the interplay between climate change and societal transformation can take on many forms and consists of a complex bundle of processes and interactions (Degroot et al., 2021; Haldon et al., 2020; Weiberg and Finné, 2022). Short-term perspectives on societal change in the face of a changing climate may also lead to overly simplistic and incomplete explanations, since socio-economic and socio-political processes operating at longer timescales influence the ability of a society to adapt to changing climate conditions. For example, recent case studies show communities taking advantage of more beneficial climate conditions by expanding agricultural land into previously marginal areas; a process that was not tenable when climatic conditions deteriorated and rapid societal change ensued. Such occurrences have been demonstrated on supra-regional (e.g. the Near East: Lawrence et al., 2021), regional (e.g. the Peloponnese and SW Türkiye: Jacobson et al., 2022; Weiberg et al., 2021), and local (e.g. Gordion, Türkiye: Marston, 2015) scales. These examples demonstrate that to understand rapid short-term societal change we also need to analyze processes on longer timescales, both in the societal and natural realms. In fact, the ability of archeology and history to view things as part of a longue durée is perhaps their greatest potential for informing modern policy discussions (Jacobson, 2022; Silva et al., 2022).
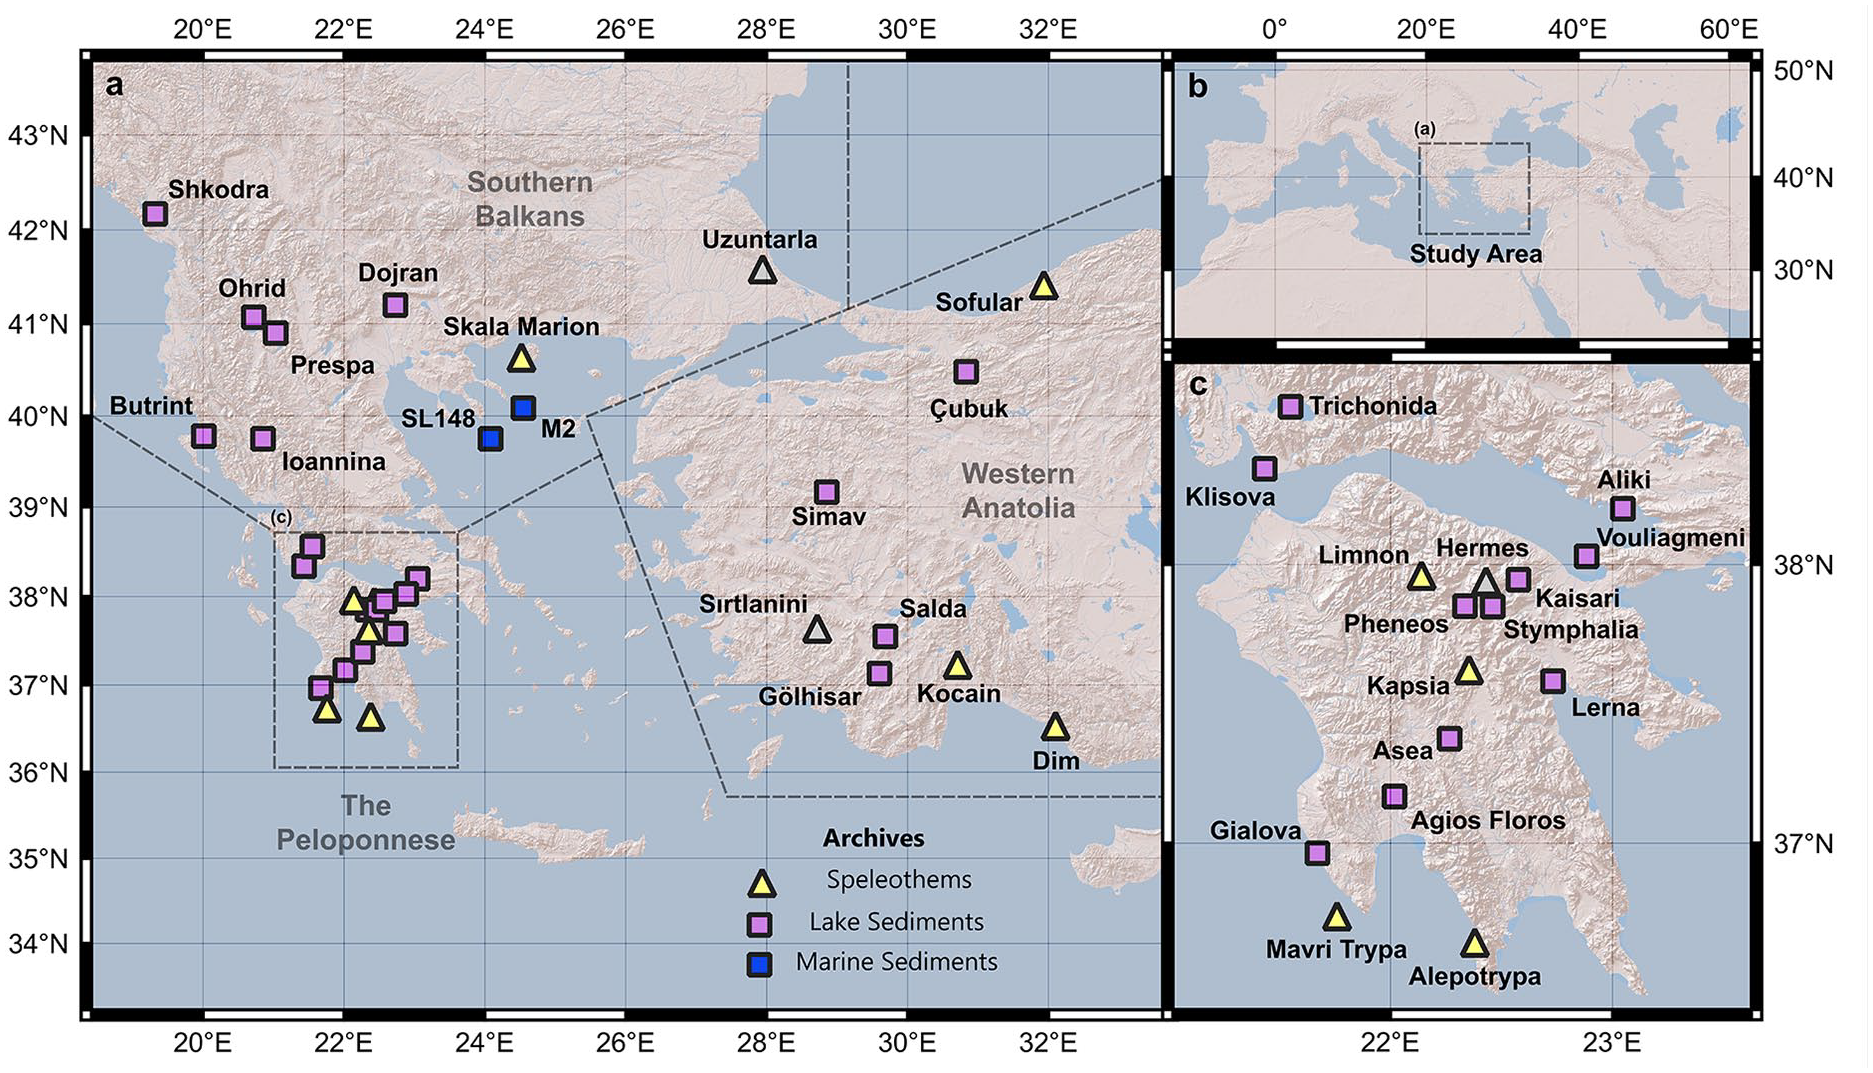
Map showing the locations of Aegean hydroclimate archives used in this study. Gray archives are work in-progress and currently unpublished, they are included here for comprehensiveness and future reference.
Many areas of the Mediterranean are semi-arid and the strong seasonal nature of precipitation, in combination with a pronounced seasonal evaporation, means that hydrological resources in the region were (and still very much are) sensitive to climate change (García-Ruiz et al., 2011; Ulbrich et al., 2012; Zervakis et al., 2004). Understanding climate change on a longer time-scale is also important for this reason: paleoclimate data is crucial for constraining patterns of climatic change that we cannot assess with modern data; furthermore, it is utilized as a vital input for future climate modeling that can inform policy.
Previous syntheses of climate data from the Peloponnese, central and northern Aegean show that, during the course of the Holocene, the long-term climate follows that of the Mediterranean and is linked to orbitally-induced changes in insolation and the position of the storm tracks in the North Atlantic (Brayshaw et al., 2011; Finné et al., 2011, 2019; Roberts et al., 2008). However, given the modern and past heterogeneity in the Aegean climate (Jacobson et al., 2021; Ulbrich et al., 2012) and the publication of numerous hydroclimate records from the Aegean in the years since previous summaries (15 in the last 5 years), a more detailed analysis of past spatio-temporal climate variability is required. This paper incorporates the old and new records to provide an updated, higher-resolution and more spatially-focused synthesis that will enable a greater understanding of Aegean hydroclimate variability throughout the Holocene. This more coherent picture of local and regional climate fluctuations will also facilitate more nuanced future analyses of its role in the history of Aegean societies. Additionally, we frame this synthesis as a guide for researchers from the historical sciences that aim to integrate discussion of climatic factors in their research. We do this by discussing the important considerations when utilizing hydroclimate data in such studies and by making our data fully accessible (see Data Availability).
Materials and methods
Following a review of published research articles, paleoclimate proxy data from the wider Aegean region (19–33°E, 34–43°N) interpreted to reflect Holocene hydroclimate were compiled (Figure 1, “hydroclimate records” hereafter). The period of interest was defined as 10,000 BP–present (“study period” hereafter) and all included datasets were cut to this timeframe. The study period starts after the large climatic shifts at the transition into the Holocene to avoid their influence on our results. Records were selected based on a set of criteria which include: (1) robust chronological control (each record must be absolutely dated and proxy samples must be assigned a date via age-depth modeling), (2) unambiguous proxy interpretation (as far as reasonably possible), and (3) a minimum of 10 samples in the last 10,000 years. Hydroclimate proxy records derived from trees were excluded due to their short duration, and the removal of long-term trends in data processing methods (Büntgen, 2022). We do not include pollen data or pollen-based climate reconstructions in our analysis as they do not provide a single unambiguous proxy relating to hydroclimate variability and can be heavily influenced by human activity, especially in later periods (Roberts et al., 2019). Additionally, a recent compilation for the Eastern Mediterranean (Cruz-Silva et al., 2023) comprehensively reviews pollen evidence for climate change. We compare our dataset with their findings, where appropriate. For each identified site, one representative archive and proxy was selected indicating hydroclimatic fluctuations, following the interpretations of the original studies. All records with Holocene data were compiled (Table 1); however, not all records are included in the subsequent analyses.
Hydroclimate records analyzed in this study.
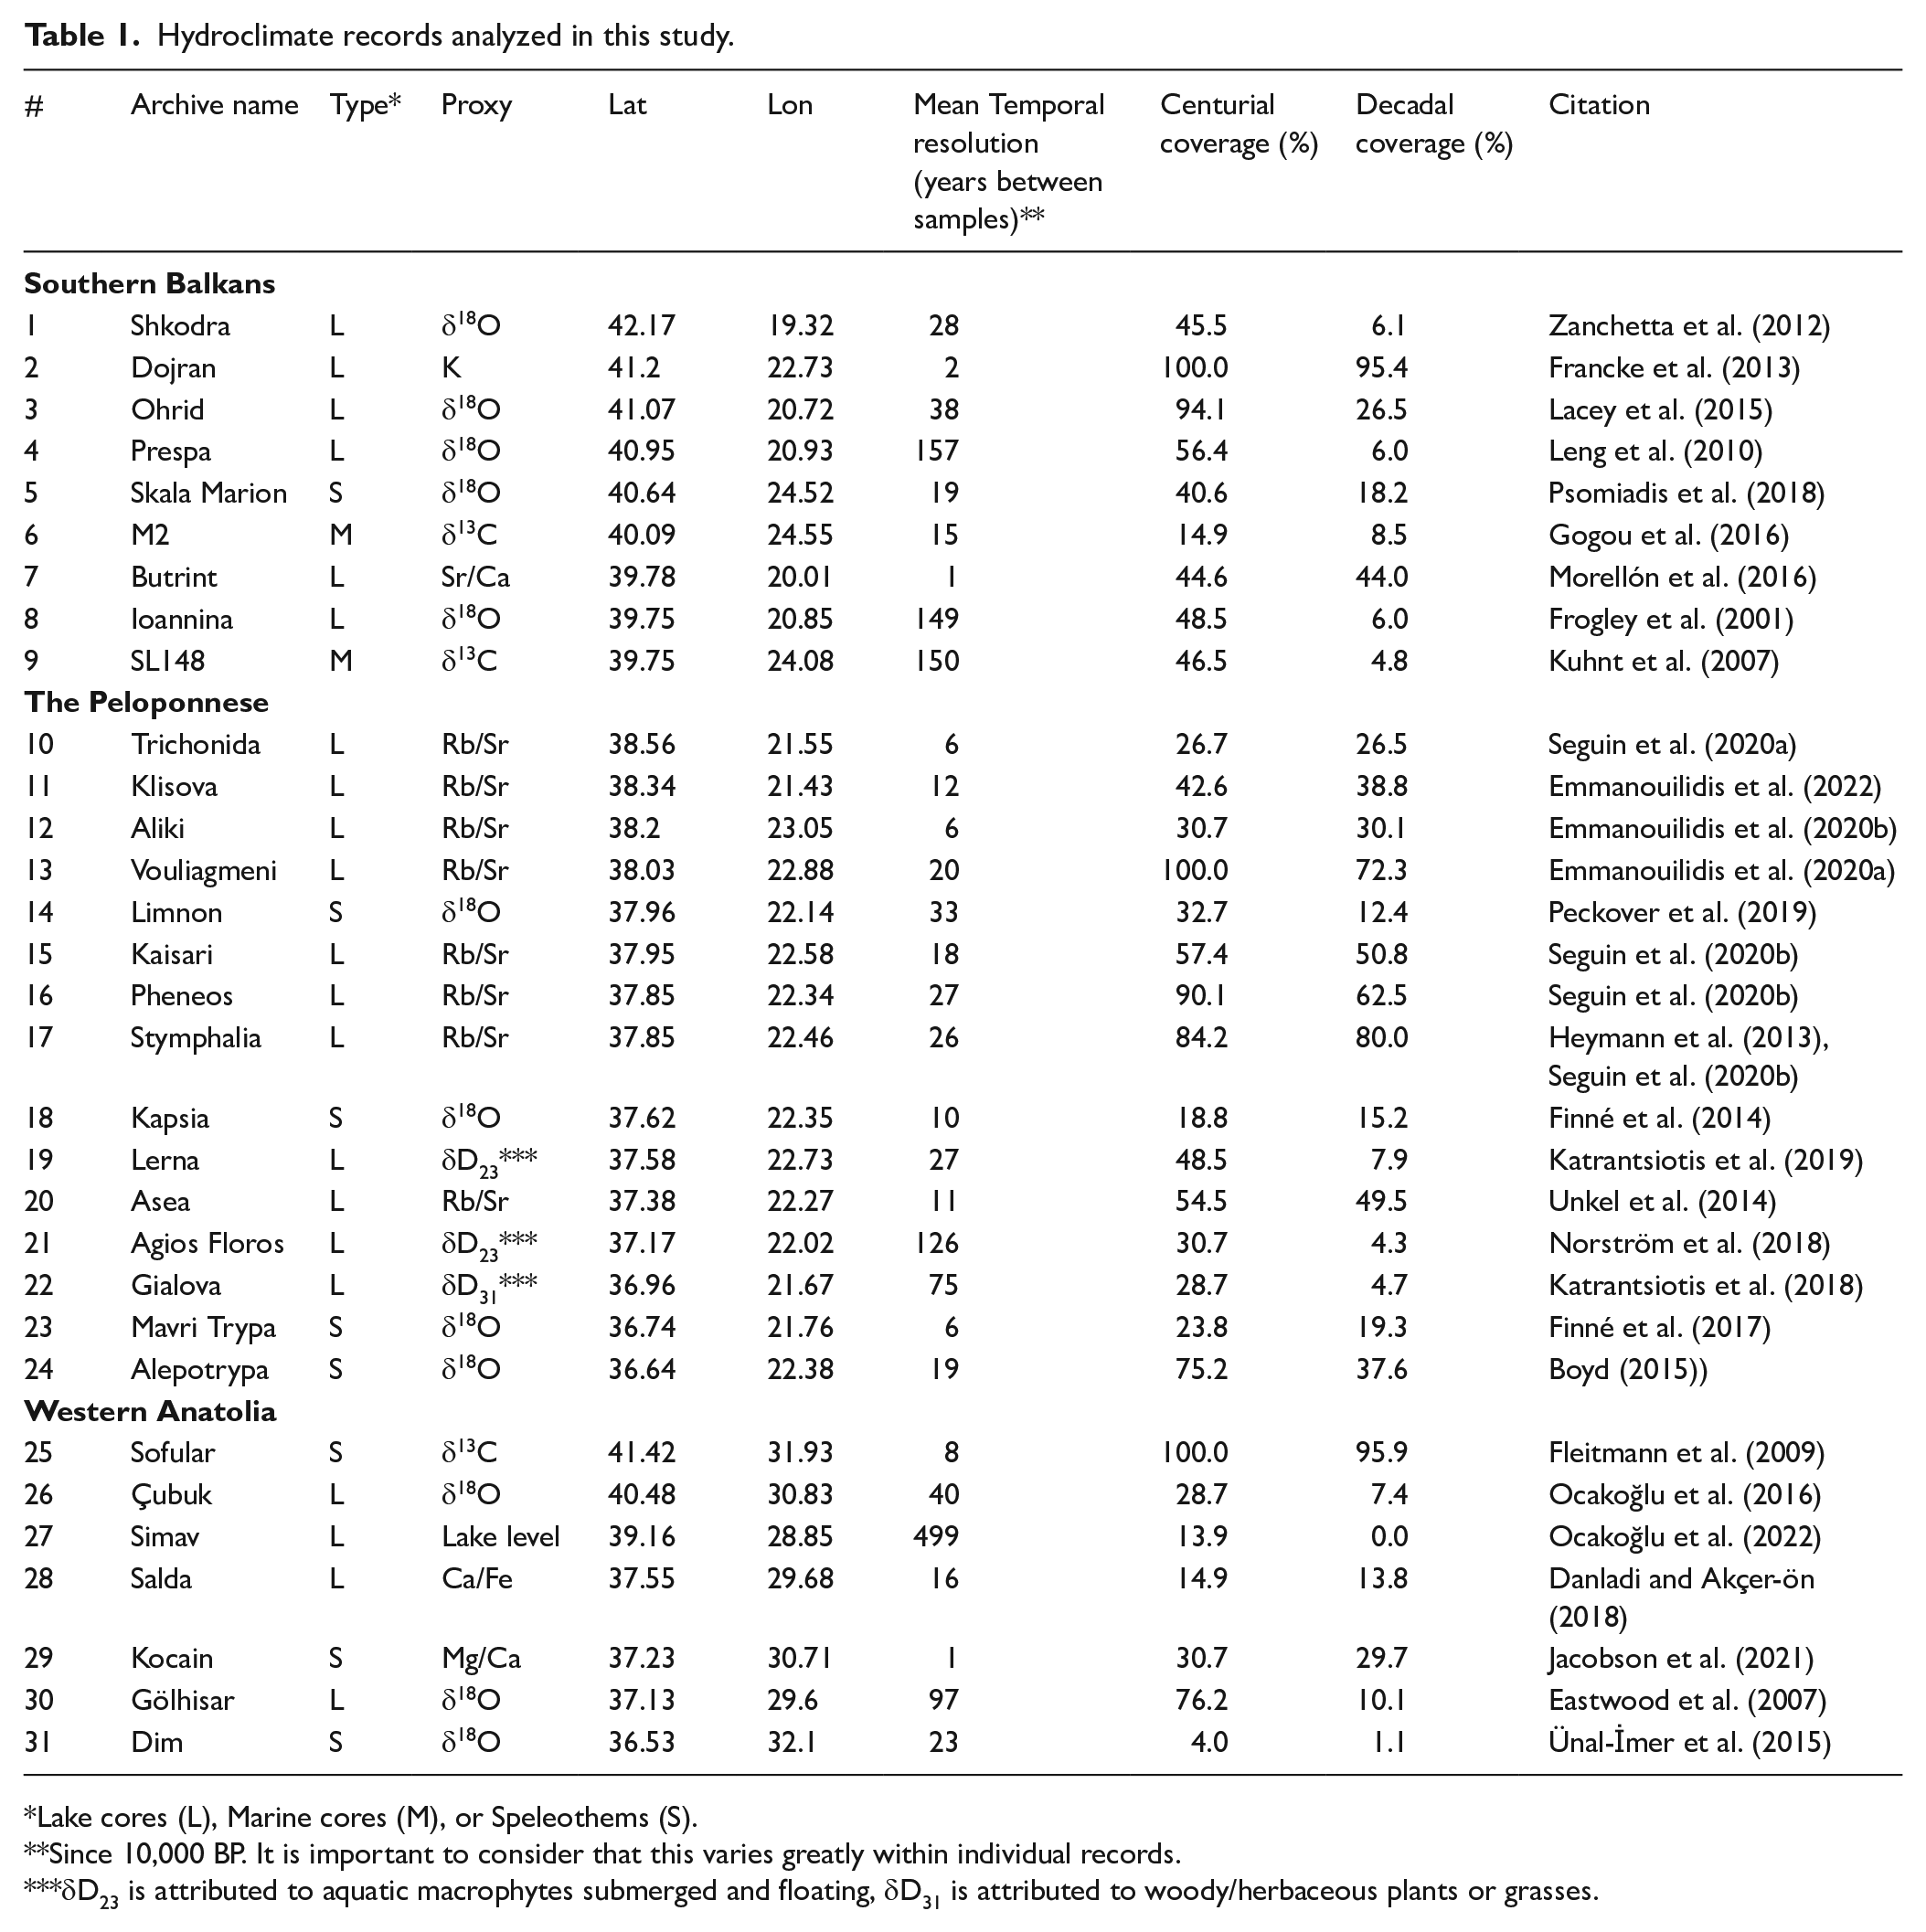
Lake cores (L), Marine cores (M), or Speleothems (S).
Since 10,000 BP. It is important to consider that this varies greatly within individual records.
δD23 is attributed to aquatic macrophytes submerged and floating, δD31 is attributed to woody/herbaceous plants or grasses.
To allow for direct comparisons between different proxy types coming from different natural archives, we standardized records using the z-score method, where the record mean is subtracted from each data point, which is then divided by the standard deviation of the record:

To enable statistical comparison between records with varied temporal resolutions (i.e. years between samples), we subsequently rescaled the records to equal time intervals, meaning bins of centurial and decadal resolution. For each bin, all proxy values included in that interval were averaged, yielding one single representative value per century and decade. Subsequently, we aligned all records so that positive z-scores are interpreted as indicating wetter conditions and negative z-scores are associated with drier conditions. In Figure 2, we have visualized the data coverage of each record with their centurial z-scores using the “superheat” package in R (Barter and Yu, 2017). This numerical treatment creates time series that do not utilize the full extent of records with resolutions higher than centurial or decadal; however, it allows us to make quantitative and statistical comparisons that would not have been possible based upon the original, heterogeneous sampling resolutions.
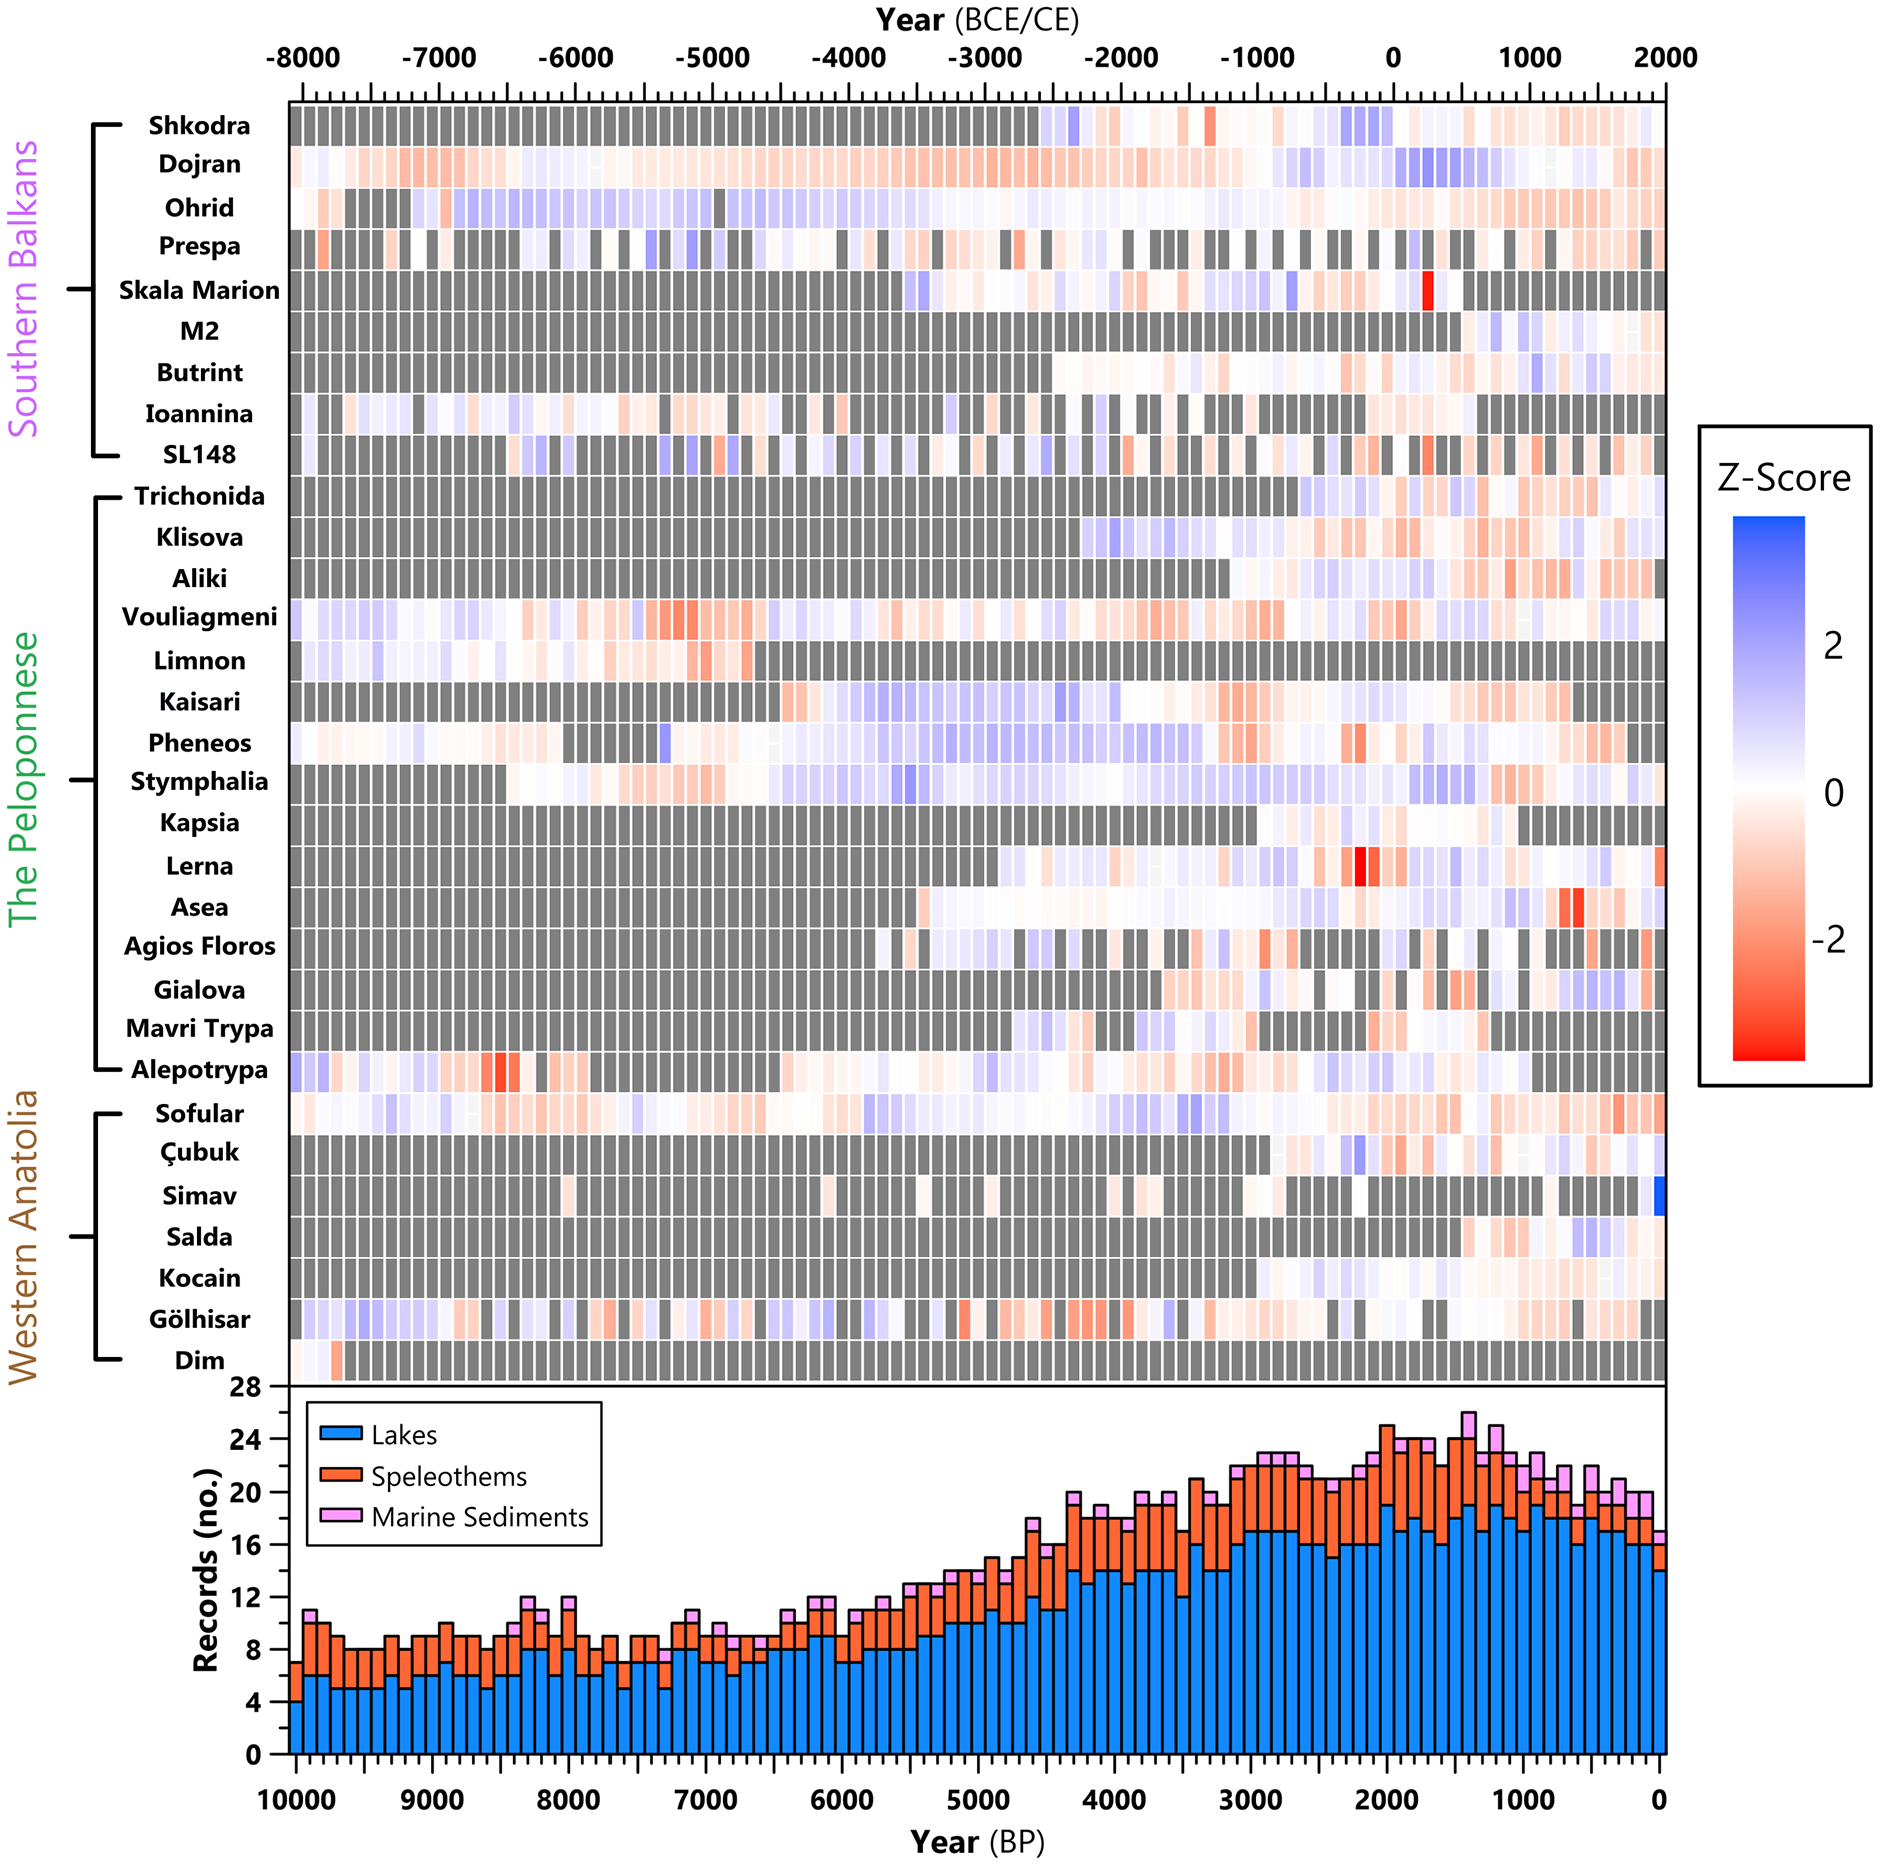
Data coverage of records, displayed via their centurial z-scores using the “superheat” package in R (Barter and Yu, 2017). Positive (blue) and negative (red) z-scores indicate centuries with wetter or drier than average conditions, respectively. Gray boxes indicate there is no data within that century. Bar chart below shows the number of different archives yielding data in each century.
In order to apply multivariate statistical analysis tools, we required all included datasets to have complete data on the same temporal scale. For this reason, we limited part of our analysis to the last 3500 years where there is dense centurial data available (Figure 2) and imputed missing values in order to obtain a complete dataset with continuous sequences. As the temporal resolution of each record, and the proportion of missing data points, has an influence on the quality of statistical inferences (Dong and Peng, 2013) and the subsequent climatic interpretation, we only utilized records for subsequent analyses with at least 70% data coverage per time interval (i.e. in each century, if a record has data in 7+ decades, it is included). We utilize this rule to exclude lower-resolution records, where one data point would be the average of climatic conditions over a much longer period than one individual century or decade.
We decided to use a more advanced imputation method with multiple runs over the more commonly used mean imputation or linear interpolation methods, which would cause a bias in the dataset toward zero (Dong and Peng, 2013). After a diagnostic testing and comparing of different procedures (Unconditional mean imputation, Bayesian linear regression, Predictive mean matching, and Classification and regression trees), we chose the robust classification and regression trees (CART) method as it yielded results similar to the trends and deviations of the original records. We filled in the blanks in the rescaled datasets using this CART method (multiple imputations m = 5) from the “mice” package in R (version 4.2.2) (R Core Team, 2023; Van Buuren, 2018). For an example of the results this interpolation method yielded, see Figure 3d. Based upon the completed centurial dataset, we conducted a principal component analysis (PCA) for the last 3500 years using the “stats” and the “factoextra” (Kassambra and Mundt, 2020) packages in R with the aim to detect spatial patterns of sites with similar climatic fluctuations. Again, we only included archives complying to the 70%-rule, meaning they needed >70% original data coverage in the last 3500 years (n = 19). Of these, a total of 9 required imputation due to gaps or the length of the record (highlighted in Figure 3). It is very important to note that we do not utilize imputed data to interpret past climatic conditions and only use them to perform comparative statistical analyzes between records, which requires continuous datasets. Correlation matrices (Figure 3b) were realized using the “corrplot” package (Wei and Simko, 2021).
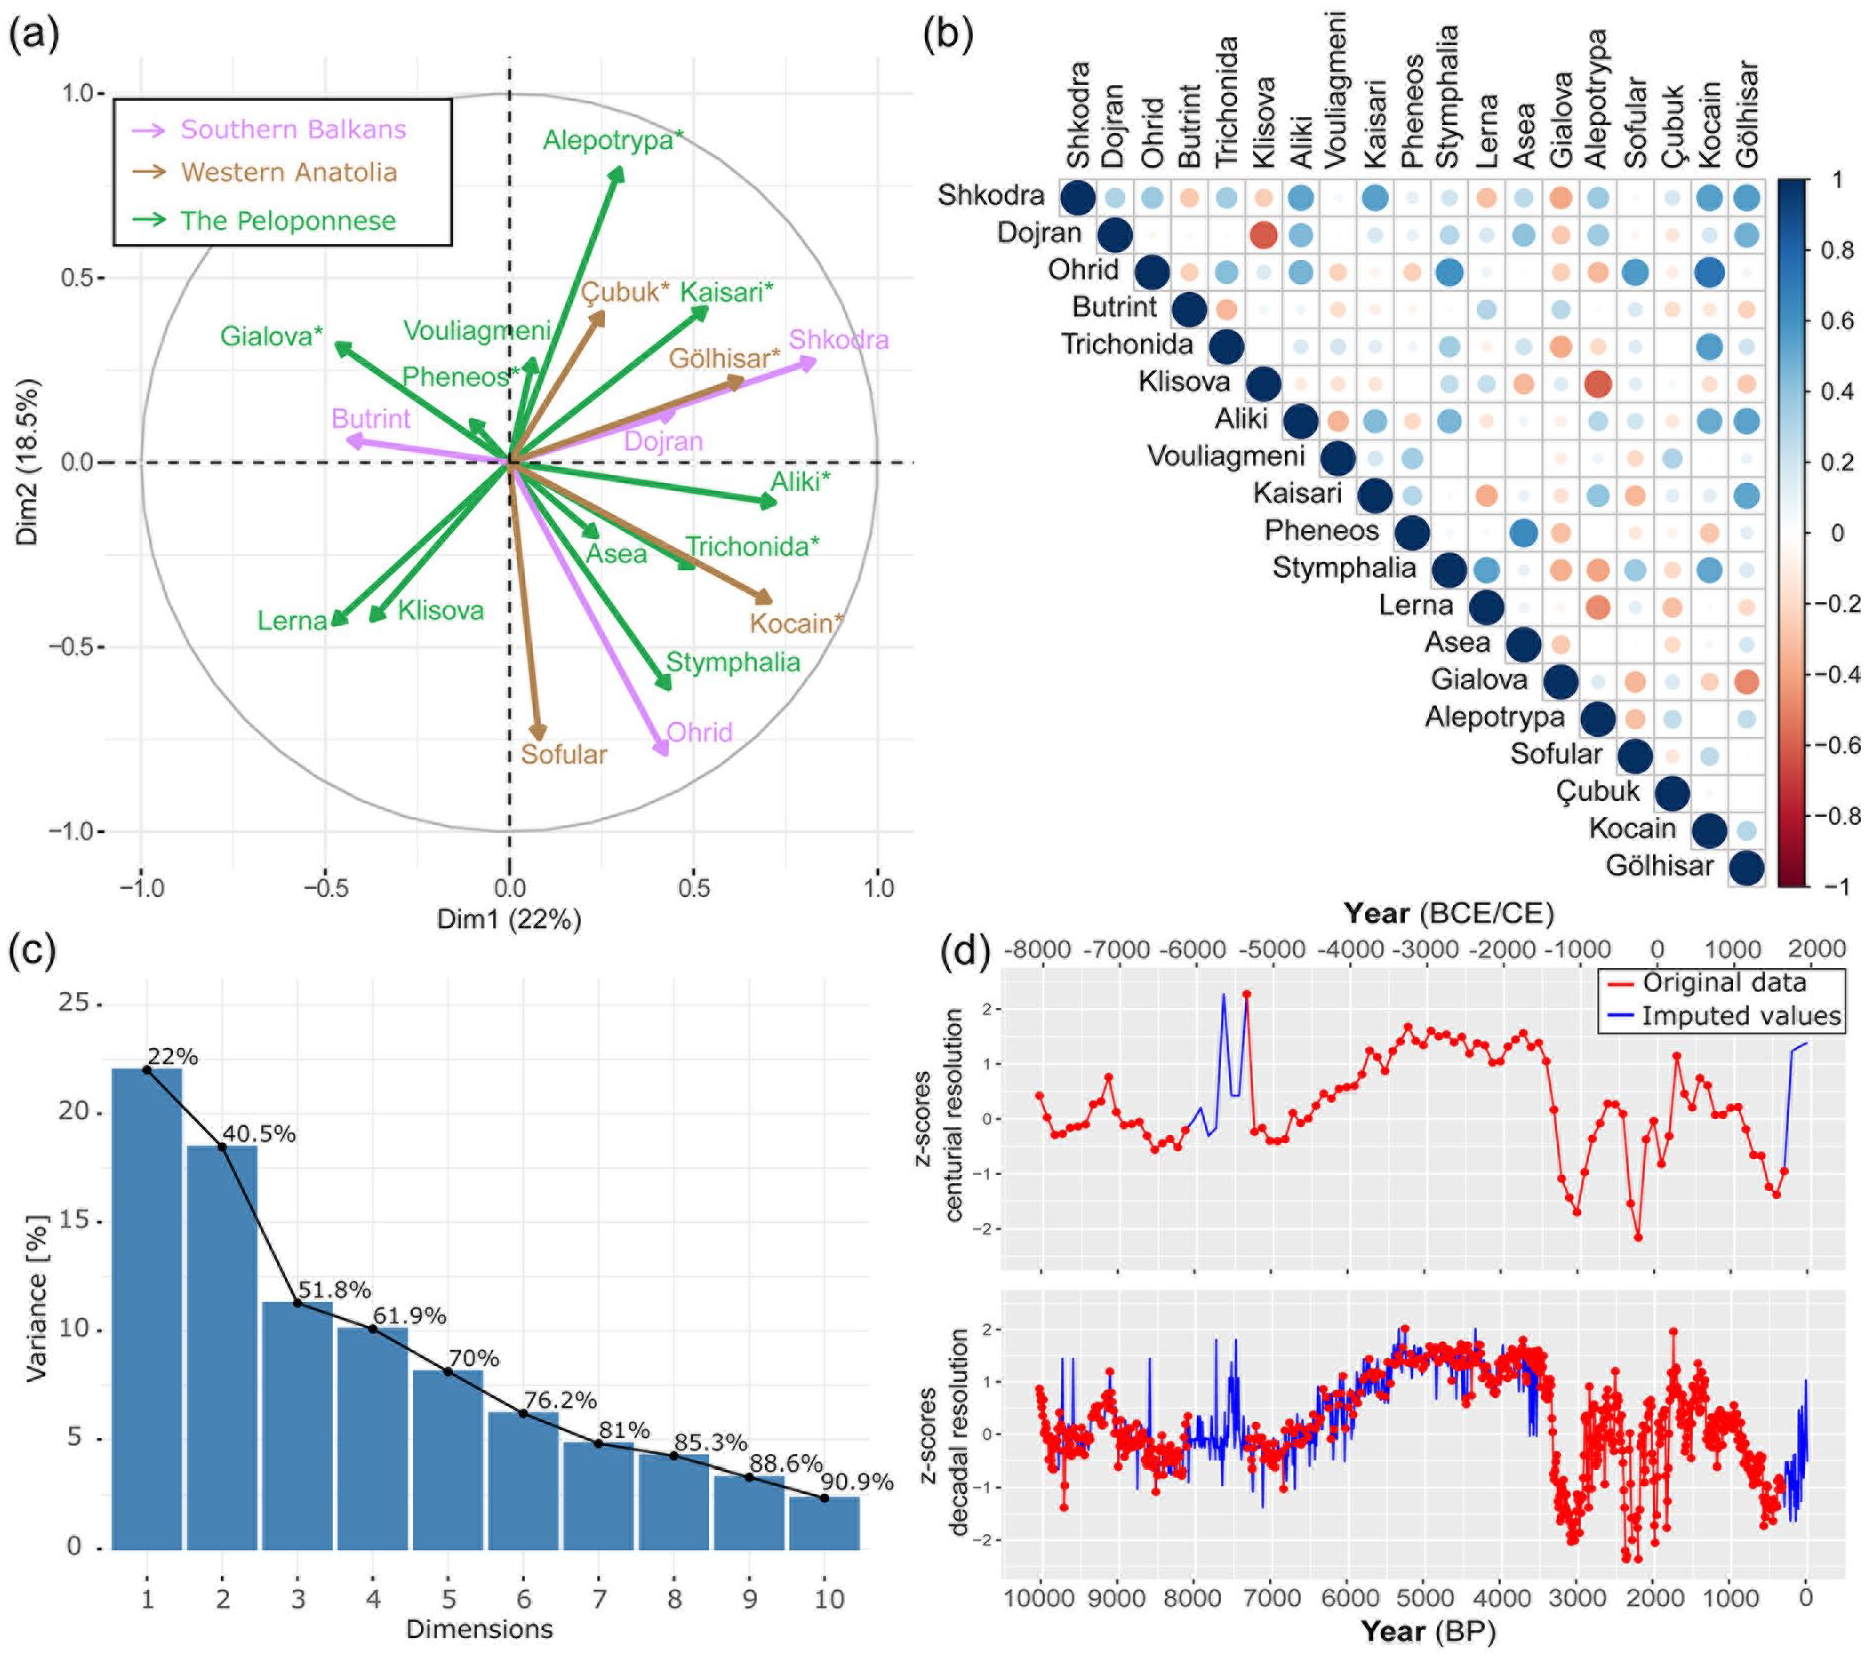
Statistical analysis of centurial datasets covering the last 3500 years. (a) Record response to dimensions 1 and 2 (Dim1/2) from PCA, those with imputed data are indicated by an asterisk. Records in the same quadrants should exhibit similar changes. (b) Correlation matrix of records (Wei and Simko, 2021). (c) Dimension variance from the PCA, percentage values are cumulative. (d) Example of imputation for centurial (above) and decadal (below) values using the Pheneos record (Van Buuren, 2018).
Results and discussion
We identified a total of 31 records that fit our selection criteria in the wider Aegean region (Table 1), converted their data to z-scores, and rescaled these to centurial and decadal resolutions. Hydroclimate archives from the terrestrial realm, that is, from lake and wetland sediments (n = 21) and speleothems (n = 8), are most common among these records (Figure 2). Only two marine sediment records from the Aegean were included as others did not have a single unambiguous hydrological proxy (most reflect sea surface temperatures or salinity).
The most commonly utilized hydroclimate proxy is δ18O (n = 12). In both lakes and speleothems from the Mediterranean, δ18O is influenced by a wide range of other factors, including for example, temperature, seasonality, air mass trajectory, and evaporation, that influence each record to a varying degree (Lachniet, 2009; Roberts et al., 2008). For lakes the amount of evaporation is the major influence on δ18O values whereas in speleothems the “amount effect,” where increased precipitation results in more negative δ18O values, is the principal factor. Geochemical proxies from lake sediments were also common, especially Rb/Sr (n = 8) with others (Sr/Ca, Ca/Fe, and K) appearing once, which reflect erosion and runoff (i.e. material being washed into the lake) and the resulting concentrations of trace elements in the water. δ13C (n = 3) was the more robust hydroclimatic proxy from Sofular Cave, interpreted to reflect the response of biological activity above the cave to effective moisture (Fleitmann et al., 2009), and was utilized from the two marine sediment records, here reflecting riverine input (Gogou et al., 2016; Kuhnt et al., 2007). Stable hydrogen isotope signatures (δD; n = 3) measured from leaf wax n-alkanes in lake sediments is interpreted to reflect the isotopic composition of precipitation, again influenced by the “amount effect” (e.g. Katrantsiotis et al., 2019). Due to the many different controls on δ18O at Kocain Cave, Mg/Ca was used instead, providing information about the residence time of groundwater linked to effective moisture (Jacobson et al., 2021). Finally, a lake level reconstruction was used from Simav Graben, identified via periods of high- and low-stands leaving their marks in the lithostratigraphy of sediments retrieved from within or adjacent to a lake (Ocakoğlu et al., 2022).
Selected records are distributed in and around the Aegean Sea (Figure 1). There is a noticeable lack of data from the east coast of mainland Greece, the west coast of Türkiye and the Aegean islands. We have divided the Aegean archives into three sub-regions: the Southern Balkans, the Peloponnese, and Western Anatolia (Figure 1). For regional averages and maps displaying the z-scores for each century, see Supplemental Table S1 and Data Availability. The southern Greek mainland, primarily made up of the Peloponnese Peninsula, has the highest density of records, whilst the Southern Balkans and Western Anatolia regions are comparatively less dense. Of the assembled records, there are nine that cover the full study period, though only three (Dojran, Sofular, and Vouliagmeni) have 100% centurial coverage (Table 1). The remaining records only cover parts of the last 10,000 years (Figure 2). Records vary greatly regarding their temporal resolution, ranging from annual to 499 years (Table 1).
The temporal distribution of the centurial z-score records (Figure 2), shows that the number of records is lower in the early Holocene, until approximately 6000 BP (3950 BCE). From this point, the number of records increases to reach a maximum in the first millenium CE. At 1450 BP (500 CE), the highest number of records in any century is observed (n = 26). Subsequently, the number of records decreases, reaching 17 in the most recent time slice. There is data from each sub-region in each century. In 13 centuries between 8600 and 3500 BP, only the Sofular Cave record, located on the Black Sea coast, represents Western Anatolia. If we limit our set of records to a decadal resolution, the spatio-temporal coverage is reduced further. No records have 100% decadal coverage, with the highest at 95.9% and an average of 28.6%. The last 3500 years have the best coverage of centuries and decades across time and space and is thus investigated further using statistical analysis.
Statistical analysis of the last 3500 years
A total of 19 records cover the last 3500 years. Missing data in these records was imputed and they were statistically analyzed to (1) detect spatial patterns between the archives and (2) identify more useful/dominant records that could potentially be representative for the region. However, the analysis instead underlined the high complexity and heterogeneity of climatic conditions and paleoclimate records in the Aegean. When transformed in this way, the three sub-region centurial averages have weak and/or insignificant positive correlations to one-another: Southern Balkans and the Peloponnese (r = 0.367, p = 0.03); Southern Balkans and Western Anatolia (r = 0.381, p = 0.024); the Peloponnese and Western Anatolia (r = 0.232, p = 0.18). At a decadal resolution, the Peloponnese has a significant but weak positive correlation with both the Southern Balkans (r = 0.45, p < 0.0001) and Western Anatolia (r = 0.278, p < 0.0001). However, these two regions do not correlate (r = 0.086, p = 0.108).
A PCA was performed to reduce the high dimensionality in the dataset (i.e. the large number of factors causing variations in the data) to a limited number of meaningful and uncorrelated variables, so called components, that explain most of the variance in the dataset (Filzmoser et al., 2009). However, the PCA of the centurial z-scores shows no distinct spatial patterning (Figure 3a). Records similar in the PCA, located in the same quadrant and eigenvectors pointing in the same direction (e.g. Dojran, Gölhisar, and Shkodra) are from different sub-regions. Inversely, records in close proximity contribute with highly variable loadings to Dimension 1 and Dimension 2 (e.g. Pheneos, Kaisari and Stymphalia). A correlogram, based on Spearman correlations (p > 0.05, Figure 3b), also demonstrates a lack of obvious spatial patterning. Further highlighting the complexity, PCA Dimension 1 and Dimension 2 only account for 22% and 18.5% of the total variability respectively, totaling 40.5% (Figure 3c). To capture 75% of the cumulative variance, which is a common choice for the target percent of total variance, one would need to use six principal components. This large number of dimensions prohibits intuitive, logical interpretations and PCA seems thus to have not been beneficial for understanding the underlying climatic fluctuations or spatial connections of the Aegean.
Long-term trends and patterns
Mean centurial z-scores for the Aegean show a generally wetter climate in the period 10,000–9000 BP (Figure 4). Conditions were generally wetter in the Early Holocene Eastern Mediterranean, especially in comparison to the preceding Younger Dryas interval (Cruz-Silva et al., 2023; Roberts et al., 2008). These wetter conditions are linked to increased winter precipitation (Tzedakis, 2007), and modeling results suggest that during winter insolation minima, such as at 10,000 BP, there is an increase in Mediterranean winter storm track precipitation (Kutzbach et al., 2014). From 10,300 to 9300 BP, winter temperatures increased rapidly in the Eastern Mediterranean whereas summer temperatures remained cooler despite higher summer insolation at this time, possibly in response to remnants of the Fennoscandian and Laurentide ice sheets (Cruz-Silva et al., 2023).
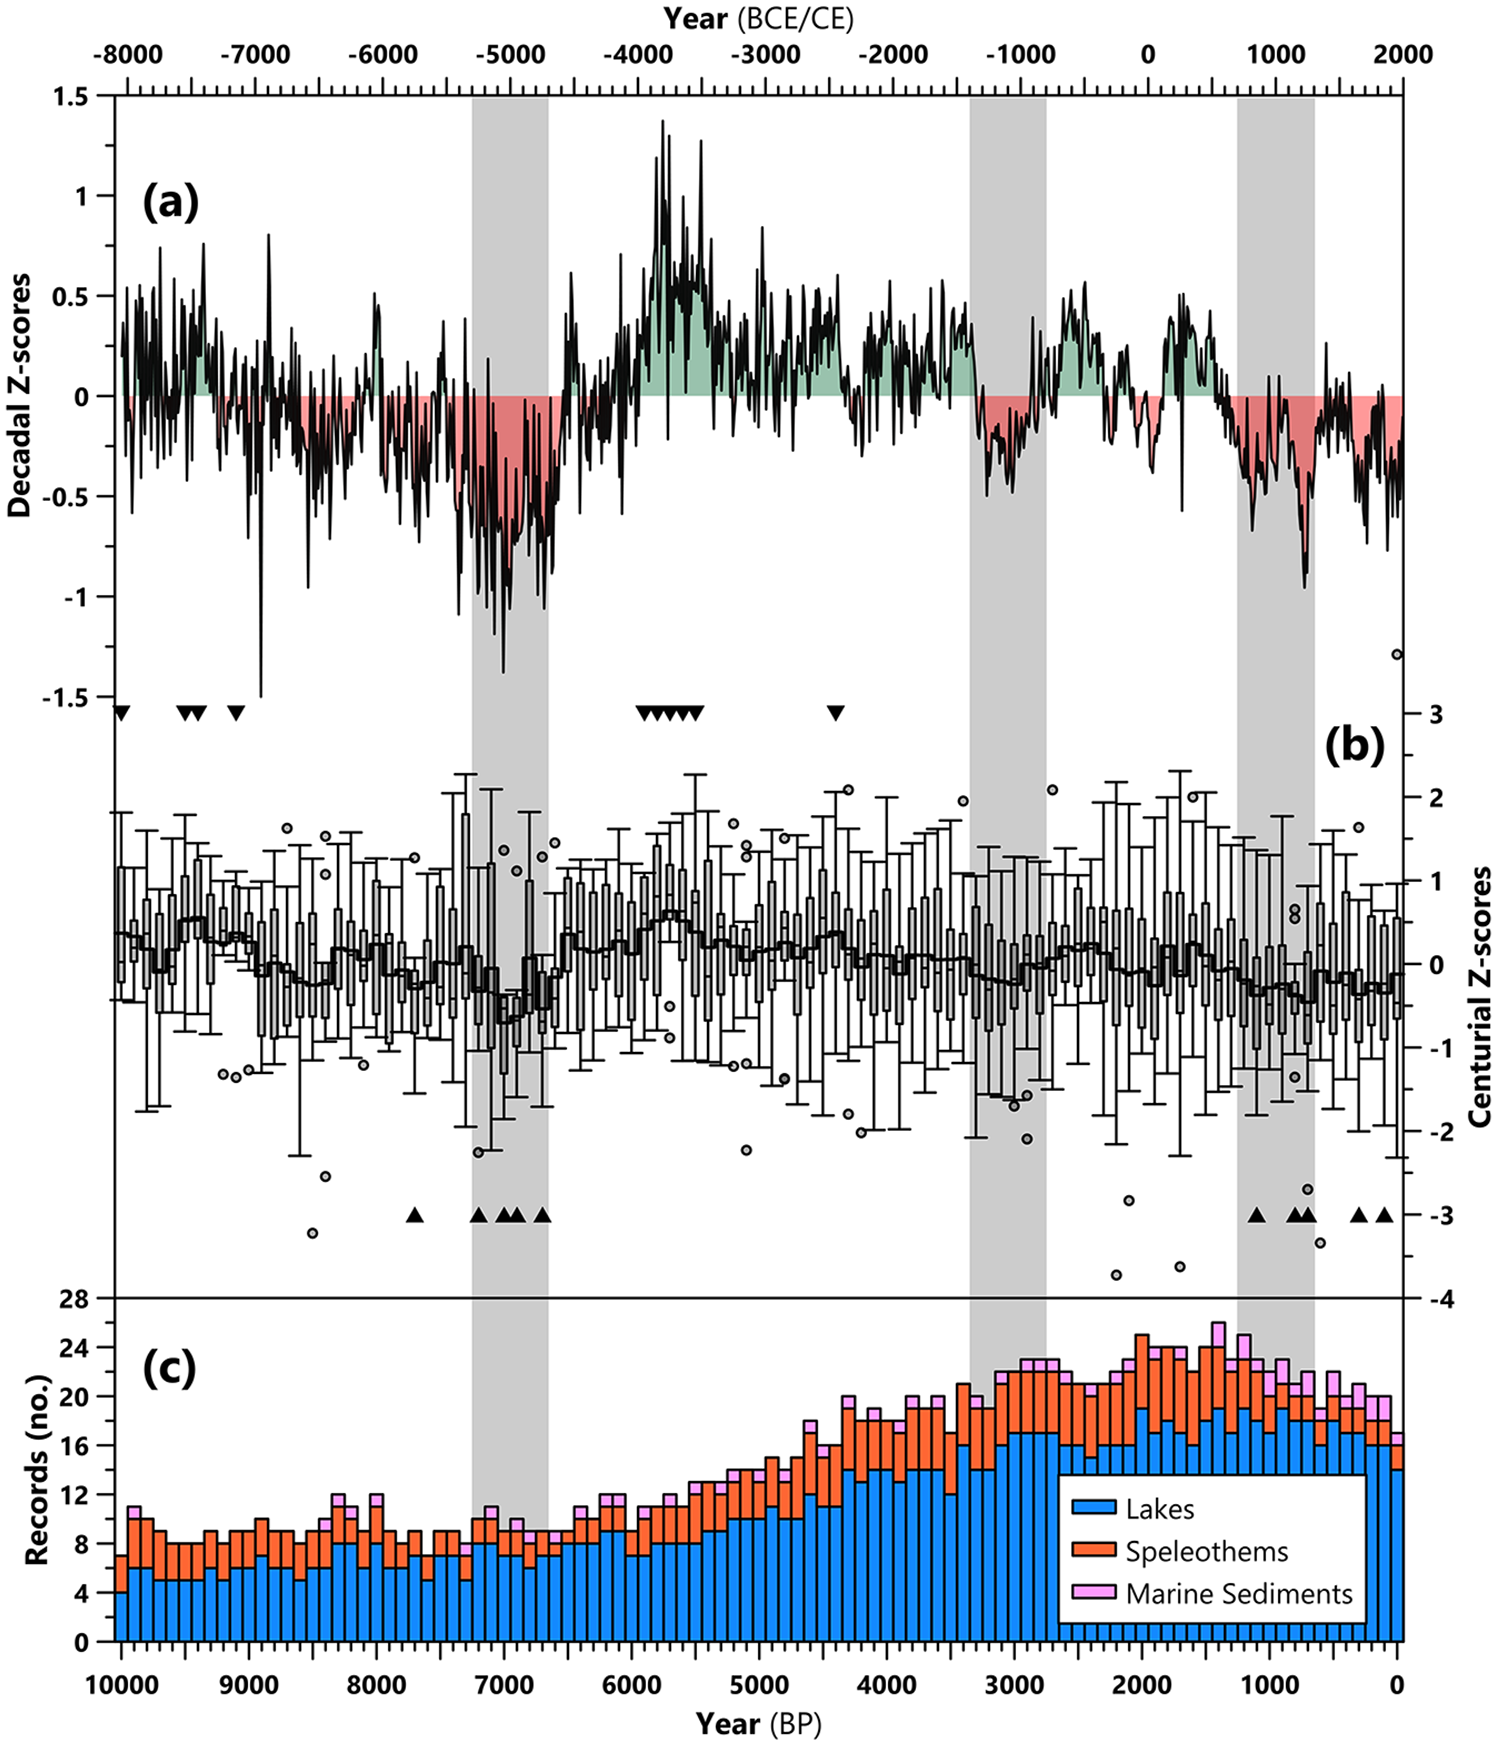
Aegean hydroclimate z-scores (values plotted to the top generally indicate wetter conditions). Focus Periods (see Section “Three focus periods”) are highlighted in gray. (a) displays mean decadal values, with above (wet) and below (dry) average decades highlighted in green and red, respectively. (b) is a boxplot of all centurial values, overlain with the mean in black. Triangles represent the 10 wettest (above) and 10 driest (below) centuries based on the Aegean mean.
We expected a continuation of wetter climate conditions going into the period when the Marine Sapropel 1 formed between 9500 and 6500 BP in the Aegean Sea and the Eastern Mediterranean Sea (Ariztegui et al., 2000; Casford et al., 2002; Kotthoff et al., 2008; Rohling, 1994). The formation of the sapropel was driven by increased freshwater input from the Nile as well as from the northern borderlands of the Aegean, but our data suggest a shift in the overall climate z-scores to drier conditions at 9000 BP (Figure 4). Generally, drier conditions dominated in the Aegean until 6600 BP but with intermittent periods of wetter conditions. In this overall dry time interval, a more pronounced period of drier conditions is evident between 7200 and 6600 BP (Section “Data uncertainties and considerations”). This period contains four of the driest centuries in close sequence and the lowest z-score value of the whole series indicating it was one of the driest periods in the Aegean during the Holocene.
From 6600 BP, there is a clear trend toward wetter conditions. This culminates with the five wettest centuries (all in a row) between 5900 and 5400 BP. Wetter conditions remain for over 2000 years until ~3400 BP but there is an overall trend toward drier conditions. This period of wetter conditions, as well as the gradual shift toward a drier climate, is attested in many records from the Eastern Mediterranean (see these compilations for examples: Cruz-Silva et al., 2023; Finné et al., 2011; Roberts et al., 2008). The presence of ice sheets, or their remnants, likely affected the position and the strength of Mediterranean storm tracks until around 6500 BP when the effect of the Laurentide ice sheet on the Atlantic Meridional Overturning Circulation diminished and a strengthening of the North Atlantic storm track occurred (Carlson et al., 2008; Desprat et al., 2013). Modeling results and proxy evidence from Romania suggest a southward shift of the Atlantic storm track, which in turn may have strengthened the Mediterranean storm track from 10,000 until approx. 4700 BP (Brayshaw et al., 2011; Perşoiu et al., 2017). A gradual northward shift of the Atlantic storm track in response to increased winter insolation in the mid-latitudes may have gradually made the Mediterranean drier (Orme et al., 2017; Perşoiu et al., 2017). Dry conditions prevail from 3300 BP until 2700 BP (Section “Three focus periods”). From 2700 BP, there are alternating periods of wetter and drier conditions and from 1400 BP conditions are consistently drier. It is, however, obvious from the spread of the records that comprise the Aegean mean z-score that there are different trajectories of hydroclimate change within the region (Figures 4 and 5).
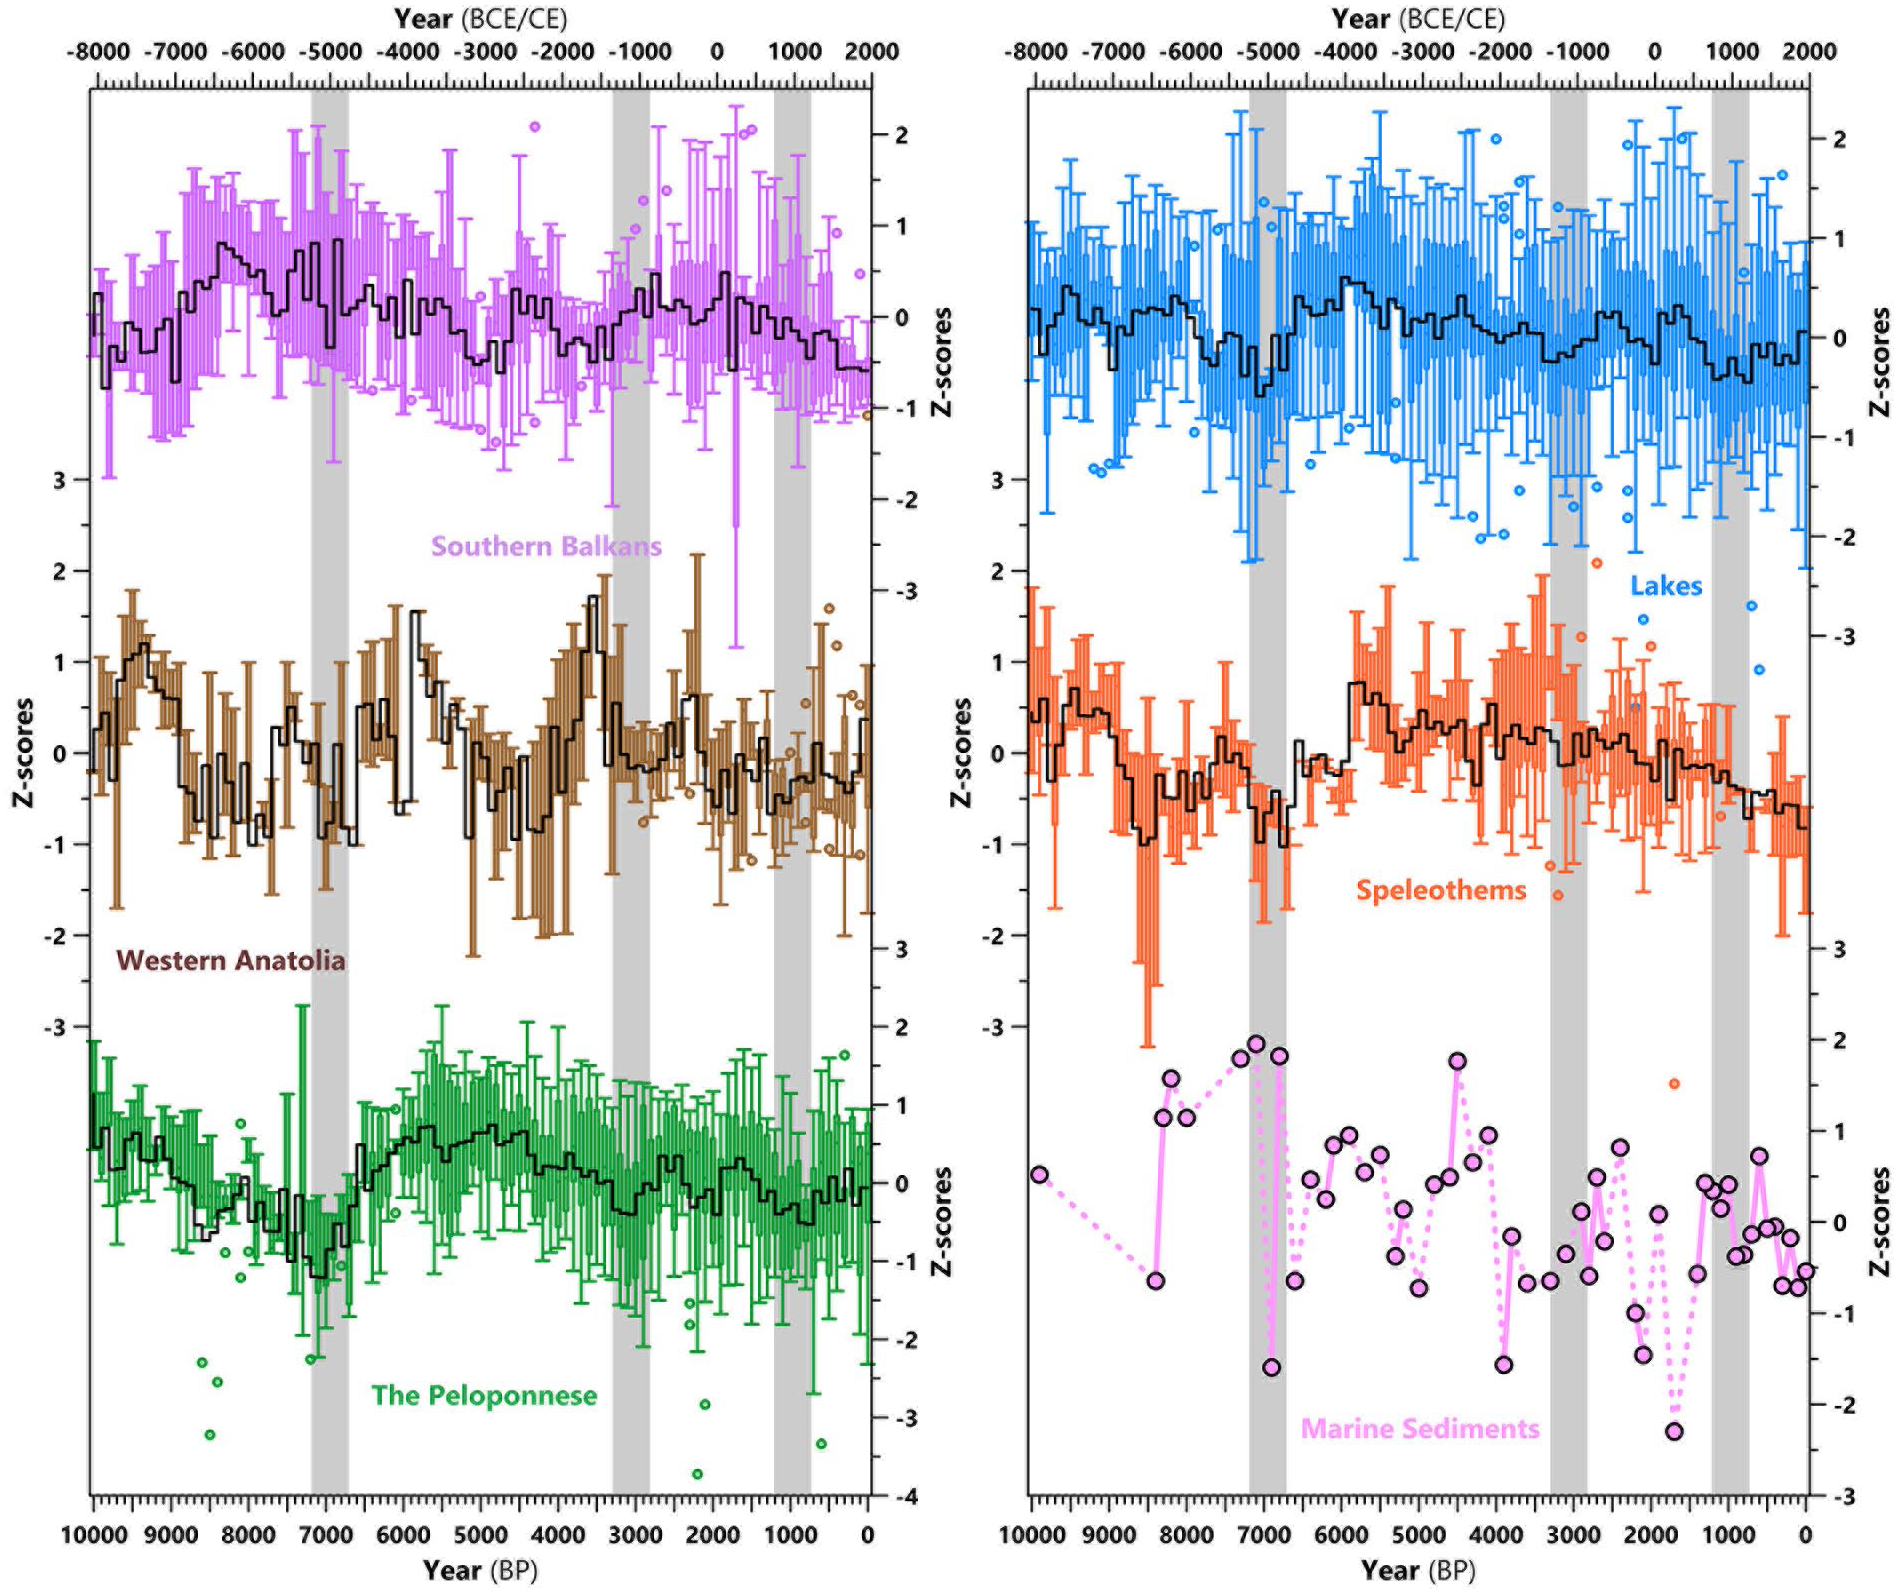
Centurial box and whisker plot for z-scores, separated by sub-region (left) and archive type (right), aligned so that positive values correspond to wetter conditions. Only mean values are displayed for marine sediment cores due to the low number of records (n = 2) – dashed lines indicate non-consecutive centuries. Focus Periods (see Section “Three focus periods”) are highlighted in gray. For the regional and archival averages, see Supplemental Table S1.
Spatial heterogeneity in the hydroclimate of the Mediterranean is well-documented, both in the present and the past (Brayshaw et al., 2011; Finné et al., 2011, 2019; Jacobson et al., 2021). This occurs both in large scales across the Mediterranean and within smaller regions. For example, the early Holocene is characterized by drier conditions in the western and central parts but wetter conditions in the Levant and eastern Anatolia (Finné et al., 2019; Roberts et al., 2008). Interestingly, in the full dataset, correlations are different to those of the imputed last 3500 years. At a centurial resolution, the Southern Balkans has a weak negative Spearman correlation with the Peloponnese (r = −0.31, p = 0.002) and no significant correlation with Western Anatolia (r = −0.166, p = 0.097). The Peloponnese and Western Anatolia are weakly correlated (r = 0.271, p = 0.006). In the full decadal dataset, where there is additional data and thus more significant correlations, the results are similar. The Southern Balkans has very weak negative Spearman’s correlations with the Peloponnese (r = −0.287, p < 0.0001) and Western Anatolia (r = −0.227, p < 0.0001), which are weakly correlated to one-another (r = 0.265, p < 0.0001). Correlations between individual records are even more varied. One way to address the spatial and temporal complexity of the data set is to zoom in. The centurial z-score means for the three sub-regions (Southern Balkans, The Peloponnese and Western Anatolia) show similarities and differences throughout the Holocene (Figure 4). The Peloponnese and Western Anatolia share similar long-term trends whereas the Southern Balkans sub-region has a more unique long-term trend, as indicated by our correlation analysis (see Results above).
The negative correlation between the Southern Balkans and the other two sub-regions can clearly be seen between 10,000 and 7700 BP when this sub-region shows an opposite dry-wet pattern compared to the other two (Figure 4). A similar opposing pattern between the Southern Balkans and Western Anatolia can be seen in the iLOVECLIM climate model at 9000 BP – please note that this downscaled version of the model does not cover the Peloponnese – suggesting this pattern can be linked to varying sub-regional responses to forcings encompassed by the model (Arthur et al., 2023). These differences demonstrate that the sub-regions have climatic trajectories that do correlate with one-another, and other regions of the Mediterranean, but not consistently over the Holocene.
The opposing pattern between the sub-regions adds important detail to, for example, the evolution of wetter conditions in the early Holocene and the contribution of rainfall in the northern borderlands for the development of Sapropel 1. The onset of wetter conditions in the southern Balkans around 9000 BP concur with the disappearance of the Fennoscandian ice sheet and the rapid increase of winter temperatures inferred from pollen from the Southern Balkans and the Carpathian Mountains (Cruz-Silva et al., 2023). At the same time, Western Anatolia and the Peloponnese became drier, indicating a reorganization of the circulation patterns in the Aegean area. Around 2500 years of drier conditions are then evident in these two sub-regions until a gradual return to wetter conditions occurs, starting around 6500 BP. The beginning of this dry period encompasses a sequence of multi-centurial drops in winter sea surface temperatures in the Aegean Sea from 8700 to 8000 (Marino et al., 2009; Rohling and Pälike, 2005; Rohling et al., 2002). These low winter sea surface temperatures in the Aegean Sea have previously been attributed to cold NE winds in the region linked to an intensification of the Siberian high-pressure system. It seems as if the Southern Balkans was relatively unaffected by this intensification, as wetter conditions remained in the Southern Balkans until 5400 BP, when the first consecutive centuries of drier conditions occur. From 6000 to 5300 BP, all three sub-regions show wetter conditions. Again, a pattern that is repeated in the downscaled iLOVECLIM model output (see Figure 4 in Arthur et al., 2023). Between 5300 and 3800 BP, the Peloponnese and Western Anatolia diverge showing nearly opposite signals. Within this time span, Western Anatolia and the Southern Balkans show strong similarities between 5200 and 4500 BP. From around 3000 BP, all three sub-regions show similar trends (Figure 4). Importantly, alongside the statistical results (Section “Statistical analysis of the last 3,500 years”), these findings confirm there is no simple ubiquitous spatial pattern observed between regions of the Aegean, such as a North-South or East-West see-saw. However, such patterns do appear in phases, e.g. a SW-NE divide within the Peloponnese that reoccurs sporadically throughout the Study Period (see maps in the Supplemental Materials), suggesting the influence of numerous atmospheric modes or circulation patterns in the Aegean.
There is also a heterogeneity in the hydroclimate data when divided by archive type (Figure 4). The small number of marine sediment records pertaining to hydroclimate prevents interpretation of this archive in detail. The two remaining archive types (lake sediments and speleothems) overall have a very weak correlation (significant at 95%, Spearman’s, r = 0.383, p < 0.05, n = 101). However, they have periods with similar and divergent trends over the Holocene. There is a greater range of values in the lake sediment records. Presumably, this results from (1) the fact there are more of them when compared to speleothems, (2) because there are more diverse proxy types, and (3) these records are more susceptible to impacts from human activity within their catchment, which will also vary over time.
Disagreement between regions, archives and proxy types highlights climatic heterogeneity and complexity, and stresses consideration when discussing regions with a lack of coverage. It is also influenced by a variety of uncertainties and interpretative challenges (see Section “Implications for studies of climate-society interactions”). However, an important consideration is that when there is agreement on a particular event between records with varied interpretations and across a large region, this suggests the event was more significant.
Three focus periods
To avoid in-depth discussion of the entire 10,000-year study period and highlight the complexity of past changes, we selected three focus periods to investigate at a higher resolution (Figure 6). We selected these periods due to their distinct and diverse characteristics, allowing us to investigate the more specific spatio-temporal variability within periods that, at a lower resolution, appear dry. For each of these focus periods, we have selected six centuries to examine but it is important to note that they are not six-century long dry phases:
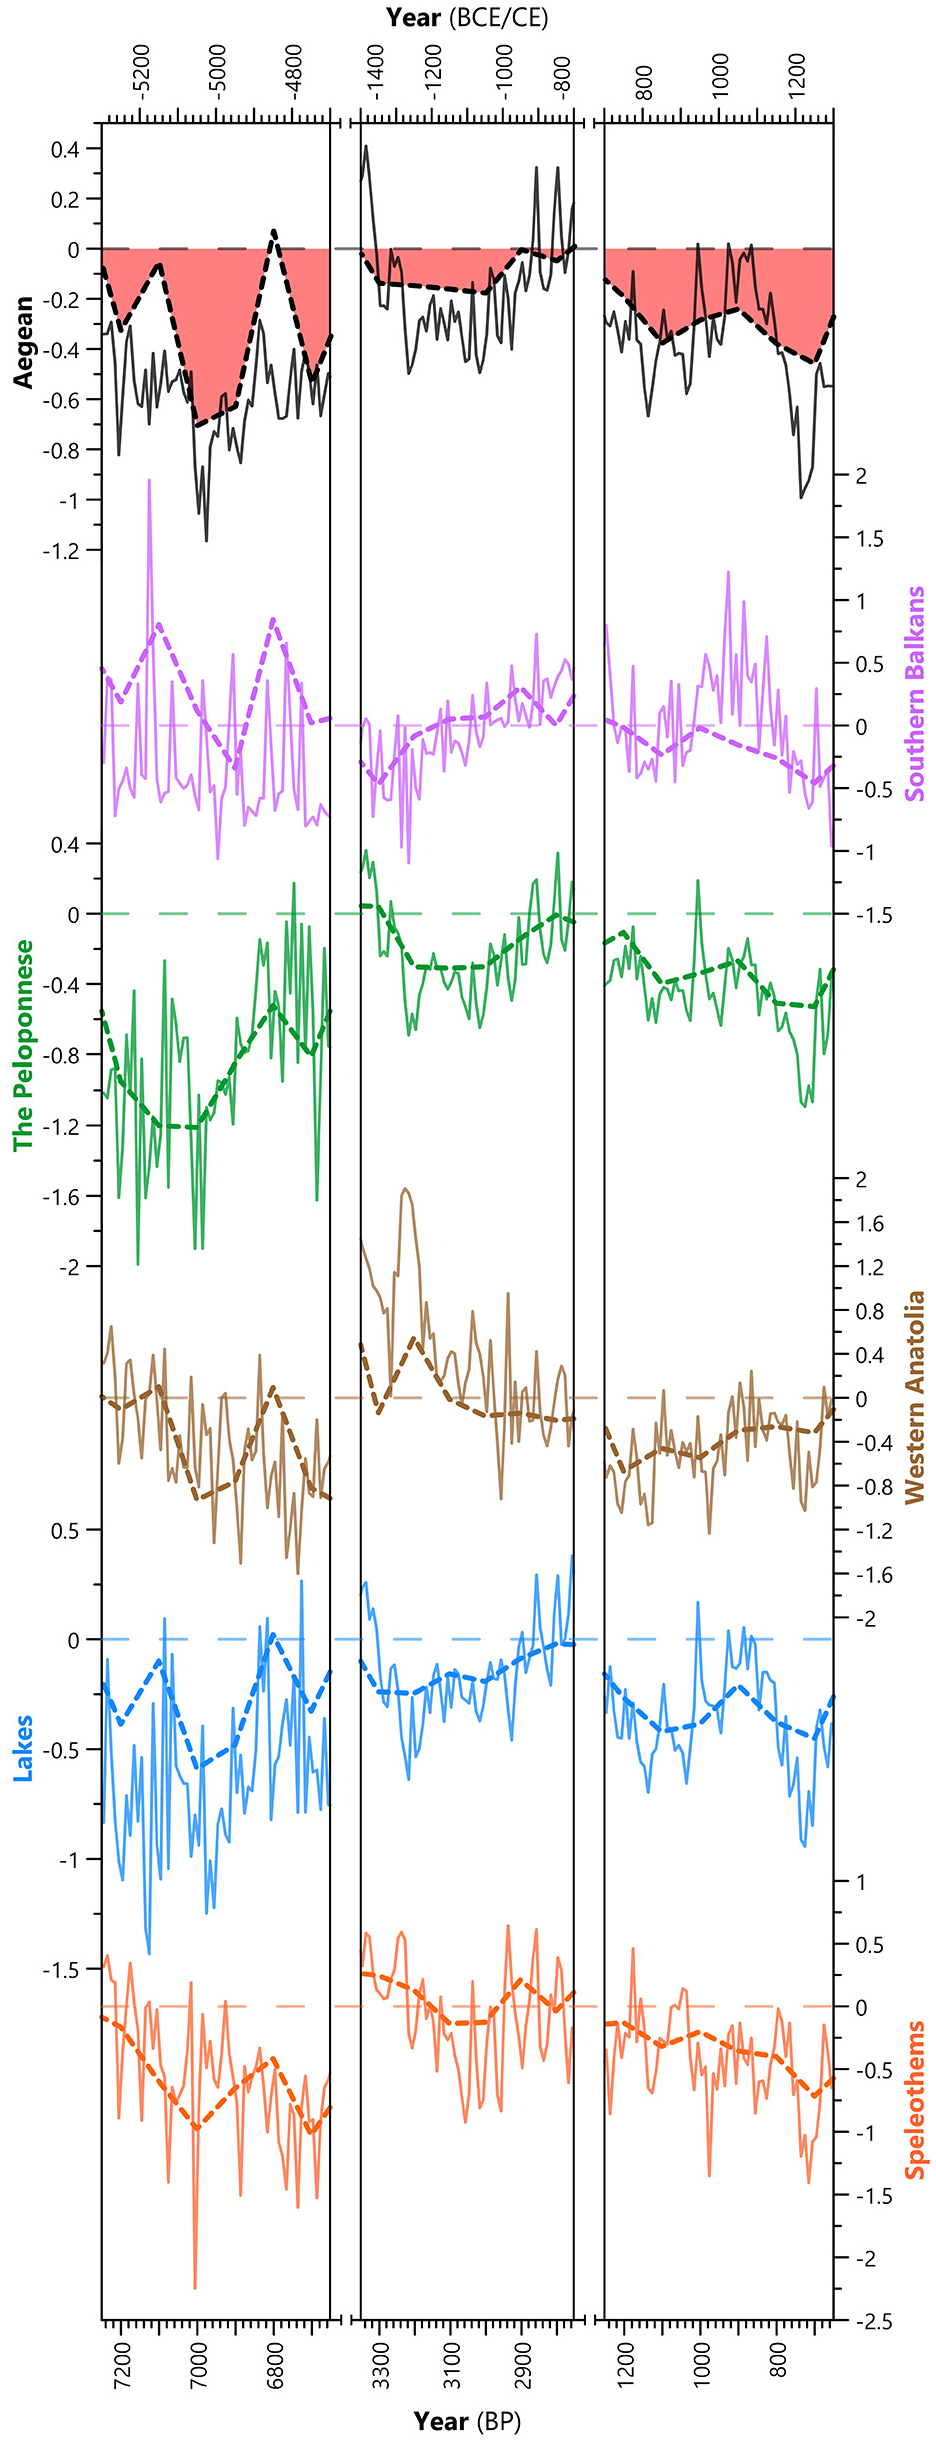
The Focus Periods. Mean decadal (full lines) and centurial (dashed lines) z-score values for the Aegean, and separated by region and archive type. Horizontal lines indicate average for the entire study period (i.e. a z-score of 0).
When examining these periods at a higher spatial and temporal resolution, their differences are highlighted. To demonstrate this, we display the centurial and decadal z-score means divided by sub-region and archive type in Figure 6.
In Focus Period 1, the three sub-regions show a similar centurial pattern, with the driest phase (7100–6900 BP) surrounded by wetter conditions, but with a discrepancy between the absolute values. The Peloponnese is very dry, Western Anatolia is dry, and the Southern Balkans is wetter than average (in all centuries except for 6900 BP). This is different to Focus Period 2, when each sub-region is dry in separate phases – the Southern Balkans at 3300 BP, the Peloponnese at 3200–3000 BP, and Western Anatolia at 3000–2800 BP. Again, Focus Period 3 has different regional variation, with an overall drying trend in the Southern Balkans and the Peloponnese, but an increasingly humid trend in Western Anatolia. Whilst the centurial and decadal mean z-scores are frequently in agreement with one-another (Figure 6), this is not always the case. The duration of events and the impact of short-lived changes on lower-resolution datasets are thus important to consider.
When looking at individual archives during the focus periods (see Figures 7–9), it is clear that these regional differences also occur across much shorter distances. For example, in the Southern Balkans during Focus Period 1 there is consistent disagreement between wet conditions at Ohrid/Prespa in the northwest and drier conditions at Dojran in the east (Figure 7). Additionally, at least one record in the Peloponnese disagrees with the general trend in almost every century of Focus Period 2 and 3 (Figures 8 and 9).
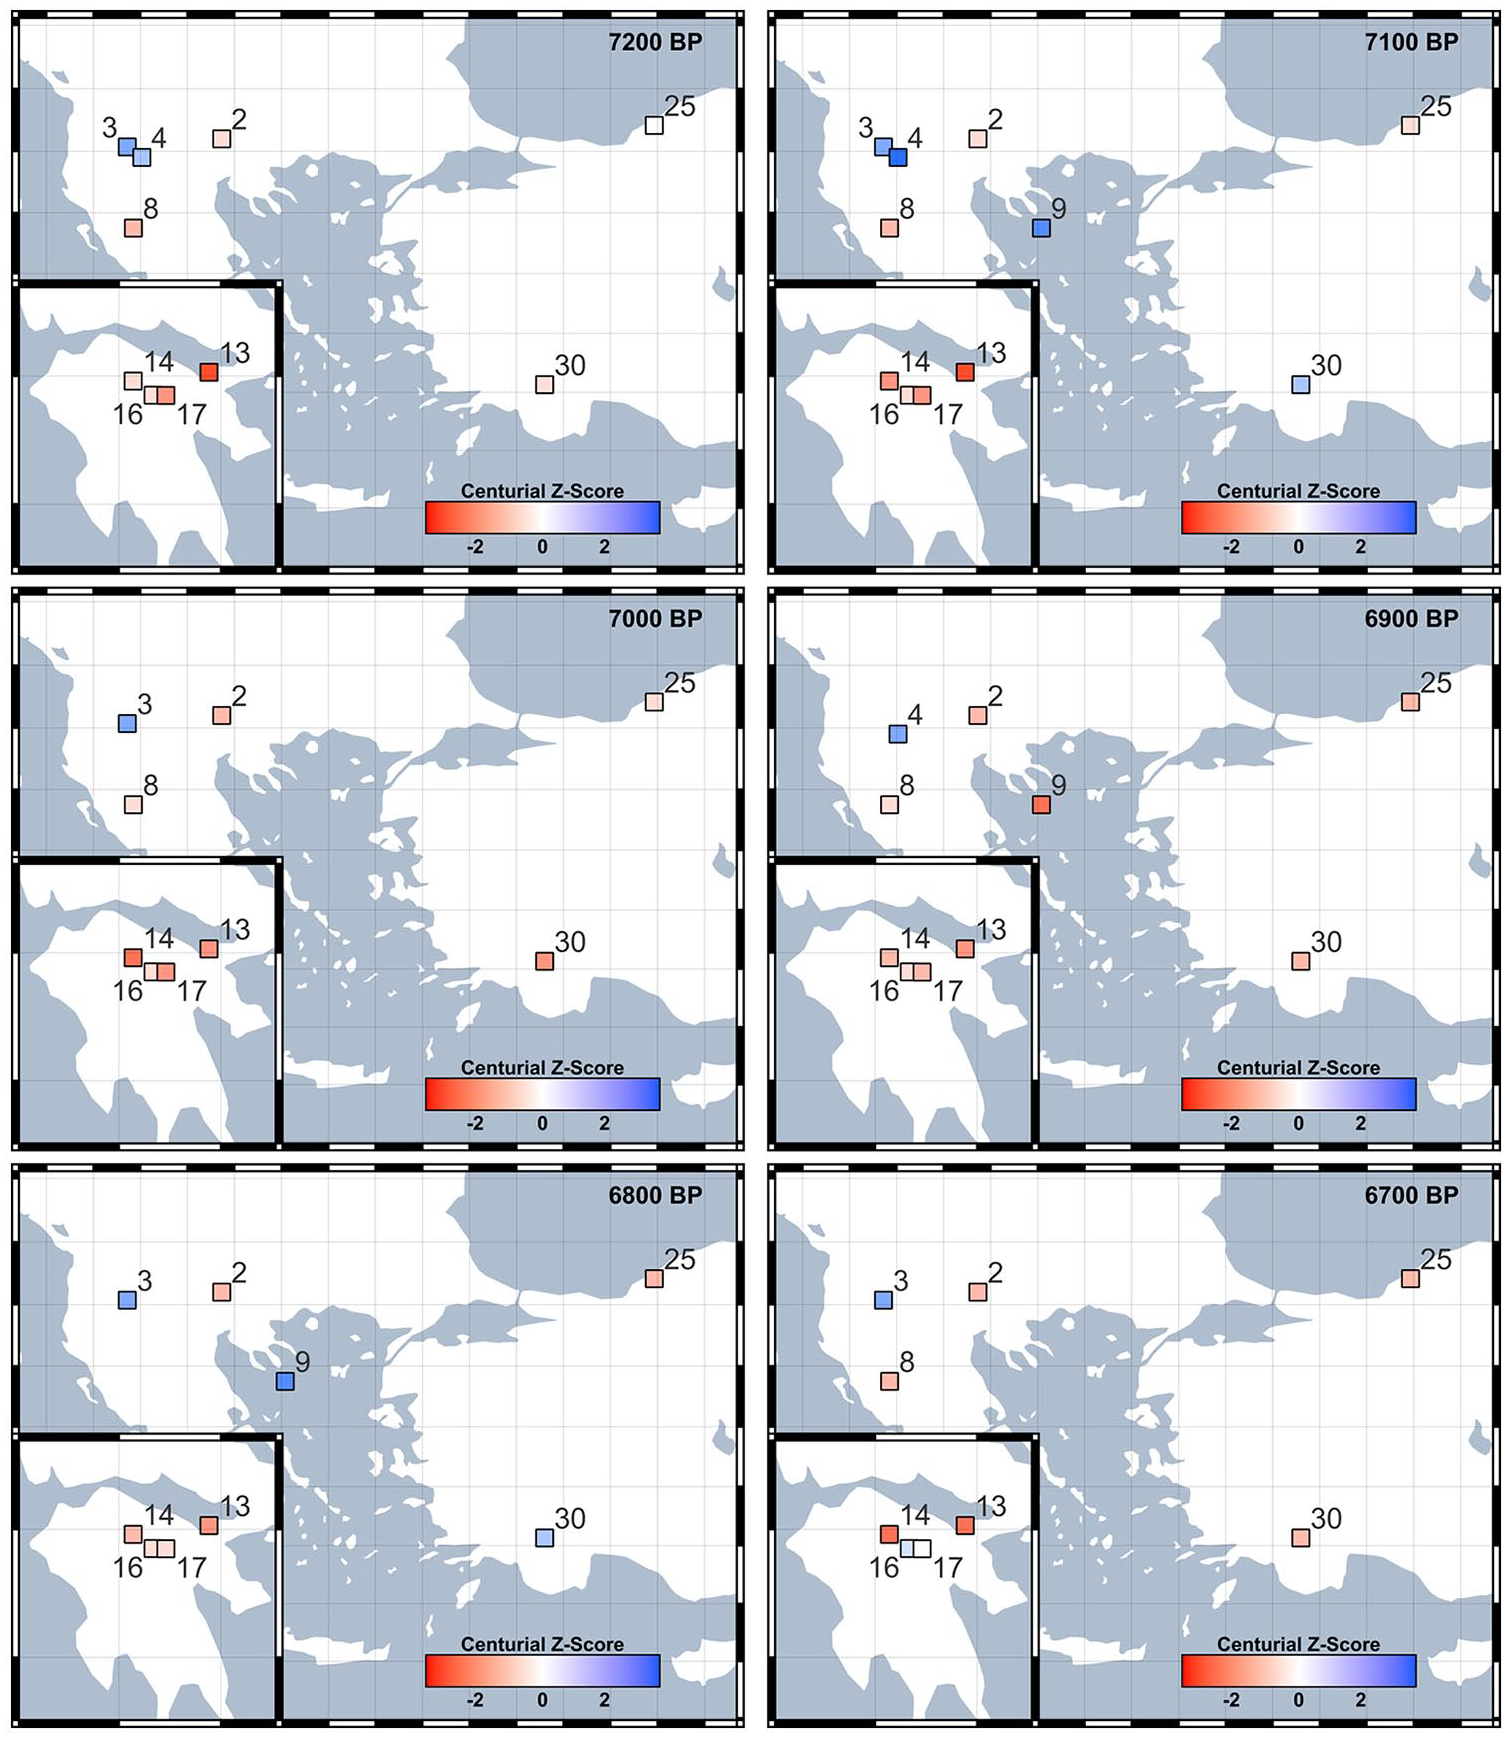
Centurial z-score maps for Focus Period 1. The color of squares indicates the z-score in that century, reflecting wetter (blue) or drier (red) conditions than the Holocene average (white squares indicate a z-score between −0.1 and 0.1). Records are numbered in Table 1.
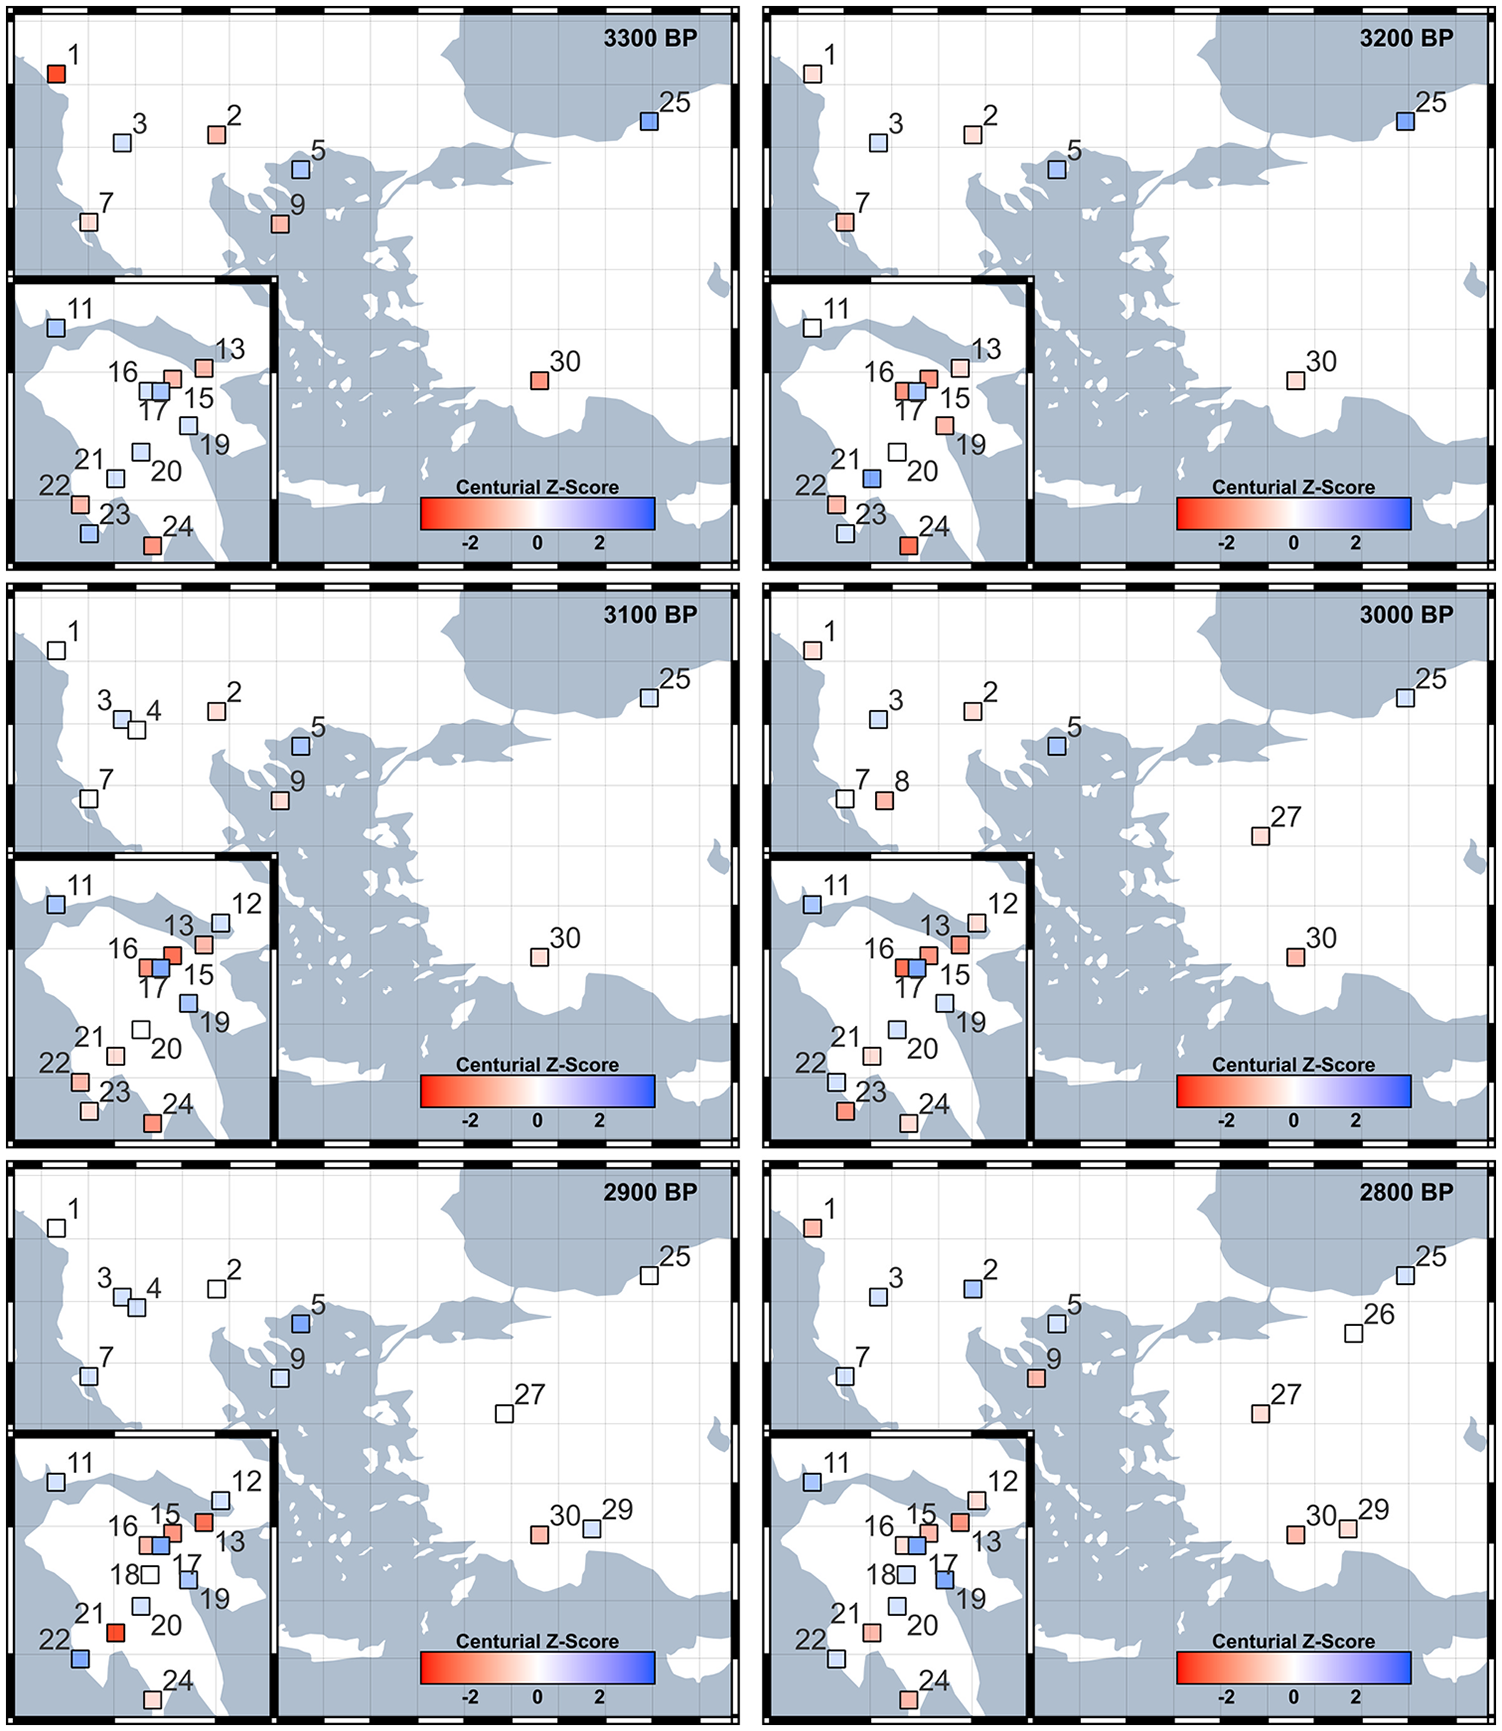
Centurial z-score maps for Focus Period 2. The color of squares indicates the z-score in that century, reflecting wetter (blue) or drier (red) conditions than the Holocene average (white squares indicate a z-score between −0.1 and 0.1). Records are numbered in Table 1.
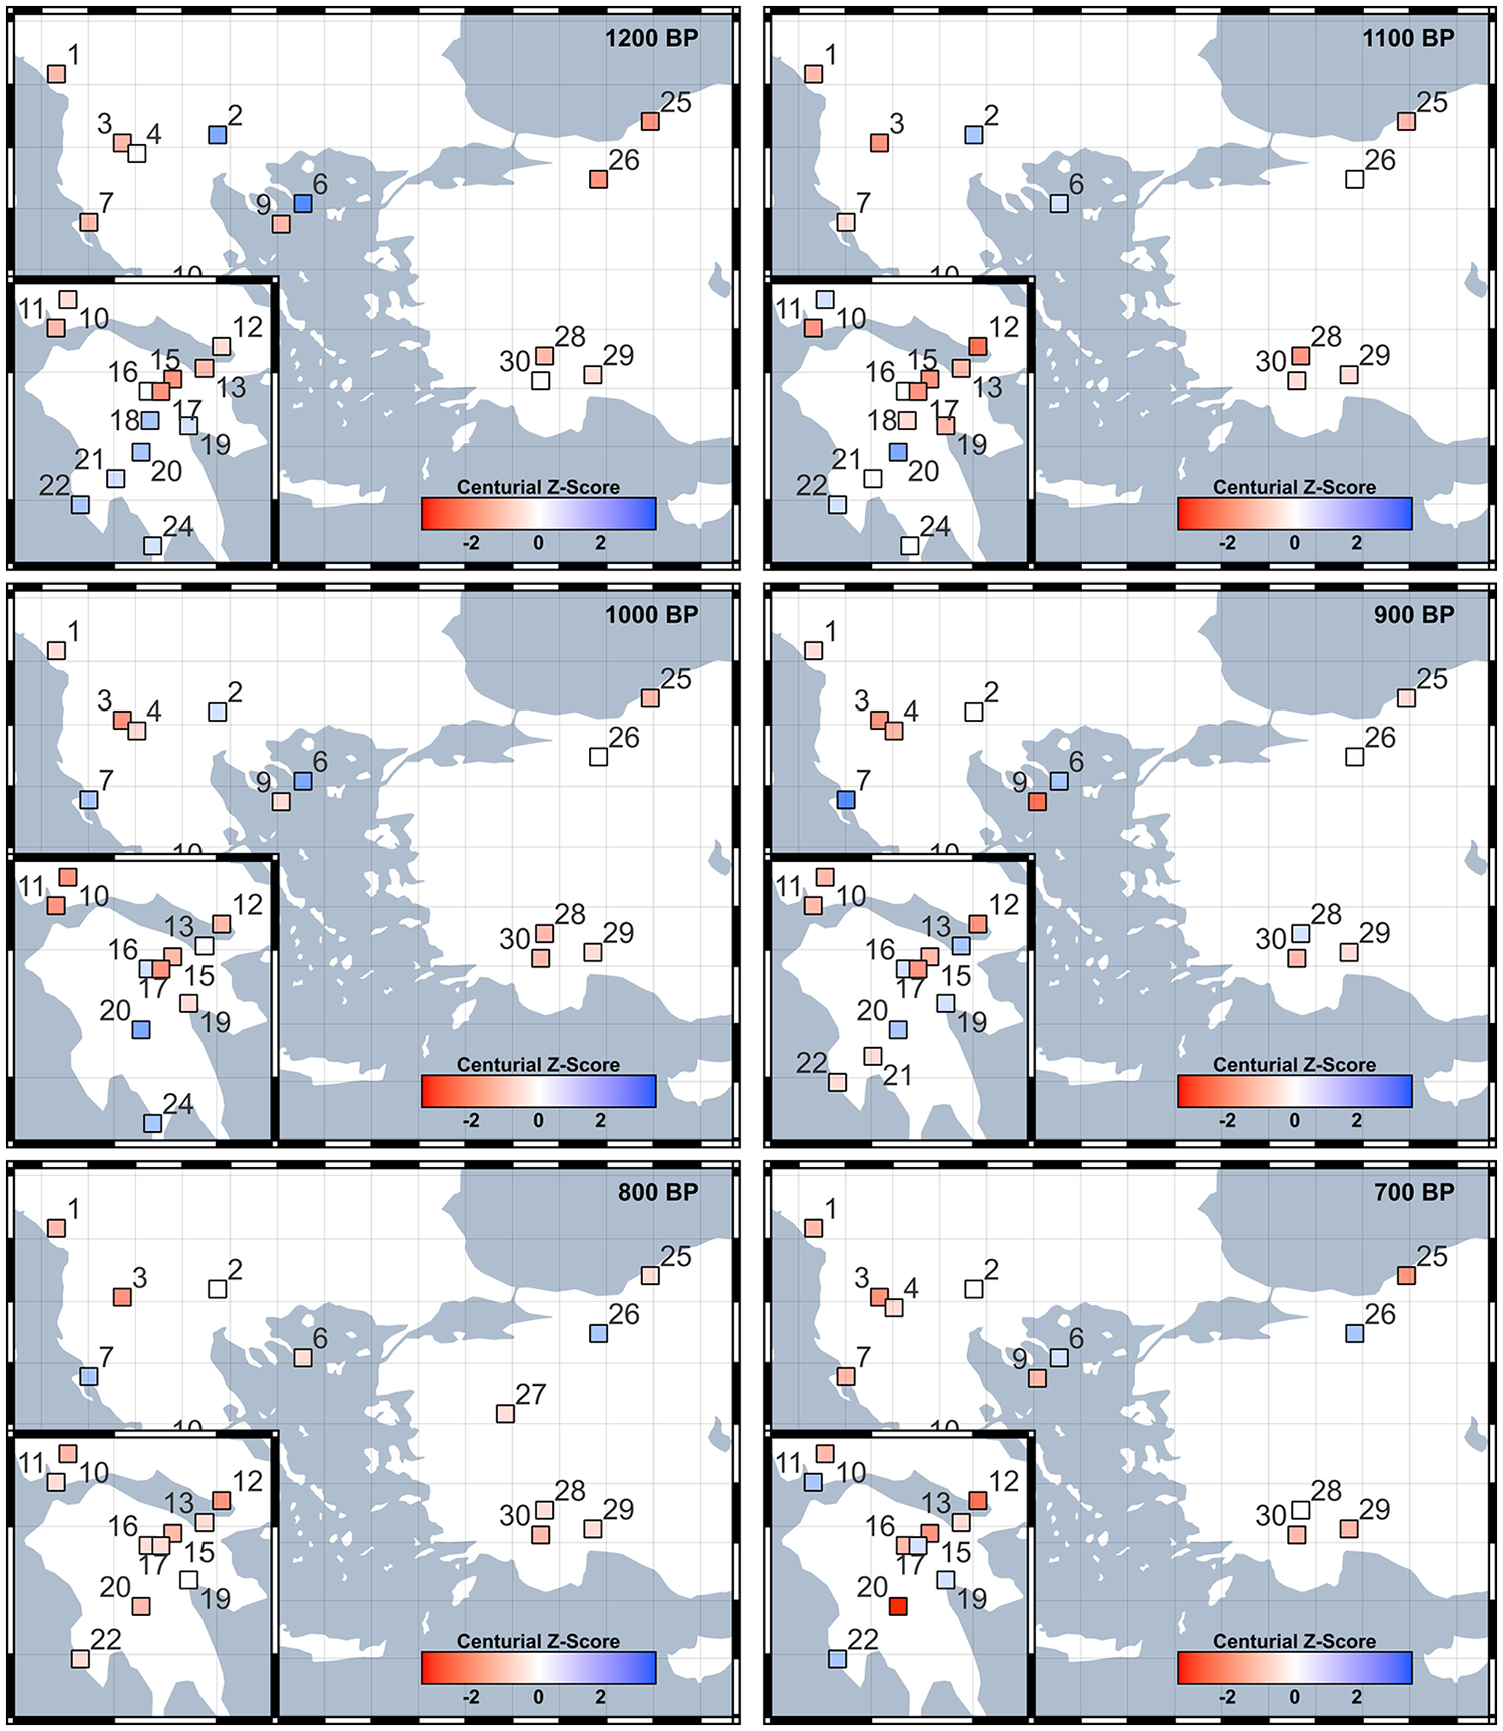
Centurial z-score maps for Focus Period 3. The color of squares indicates the z-score in that century, reflecting wetter (blue) or drier (red) conditions than the Holocene average (white squares indicate a z-score between −0.1 and 0.1). Records are numbered in Table 1.
The pattern of dry sites and sub-regions during these periods is likely to result from the cause and extent of drier conditions as well as varying proxy sensitivity and dating accuracy. Sensitivity of the different proxies is also related to the sensitivity of the different archives and a distinction can be observed between the lake and speleothem records in the focus periods. It is clear that proxies from lakes and speleothems sometimes respond differently (Figures 5 and 6), as has been recognized elsewhere (e.g. Morellón et al., 2018; Regattieri et al., 2019). This is more pronounced in the decadal data, and a clear example is provided in Focus Period 1, where the lakes and speleothems differ, especially between 7000 and 6900 BP.
Regardless, however, all focus periods contain consecutive dry centuries and decades in numerous records which demonstrates these periods are not the result of one or two anomalous measurements. Considering the different configurations of the hydroclimate conditions during the different focus periods it is likely that they are driven by different atmospheric patterns and processes. To date, there is no clear agreement on the climatic causes in any of the focus periods, and it is beyond the scope of this paper to propose and verify hypotheses behind these changes. It can be noted, however, that although there is little evidence from the Mediterranean of hydroclimate change during Focus Period 1. It occurs in close correspondence to the termination of Marine Sapropel 1 at 6500 BP (Casford et al., 2002). The second Focus Period occurs in close correspondence to the so-called “3.2 ka event” which has been implicated for its role in the demise of Late Bronze Age societies across the Eastern Mediterranean, including the Aegean (see Section “Implications for studies of climate-society interactions”; Cline, 2014; Kaniewski and Van Campo, 2017). In the case of the Aegean, it has been proposed that a strong Siberian High between approximately 3100 and 2900 BP led to northerly outbreaks of polar air (Rohling et al., 2002, 2019). This large-scale synoptic setting could have led to lower temperatures and snowfall in some areas and reduced precipitation in other areas similar to what can be seen presently under the different influence of the East Atlantic/Western Russia pattern (EAWR) in winter (Corte-Real et al., 1995; Kutiel and Benaroch, 2002; Rohling et al., 2019). Focus Period 3 overlaps the so-called Medieval Climate Anomaly (MCA), which has varying start and end dates (e.g. 900–1350 CE (Graham et al., 2011) and 1000–1200 CE (Luning et al., 2019)). The influence of different atmospheric circulation modes such as the North Atlantic Oscillation (NAO) and EAWR have been investigated and suggested to influence the hydroclimate during this period in the eastern and western regions of the Mediterranean. Drier conditions in the Aegean link this region more to the hydroclimate patterns seen in northern Italy and northern Iberia (see e.g. Labuhn et al., 2016; Roberts et al., 2012).
The distinctions discussed in this section are important and cannot be observed when simply looking at low-resolution large-region averages that generalize the changes of a period. Such variability should be considered in any region and period, even when discussing “established” changes such as the 8.2 and 4.2 ka events, which interestingly were not as apparent in the Aegean hydroclimate as our three focus periods.
Data uncertainties and considerations
Whilst compiling datasets using an upscaled z-score average method increases comparability between records and enables statistical analysis, it also brings with it significant weaknesses and highlights other gaps in knowledge. We believe it is important to be transparent about this, so that the results of our analyses can be utilized appropriately. We divide these weaknesses into two main categories: (1) the loss or obscuring of data due to upscaling and averaging and (2) uncertainties in the original hydroclimate records that are left unresolved in the analysis.
Most of the records have higher resolutions than centurial (n = 26), and some are sub-decadal (n = 6); therefore, shorter-duration hydroclimate fluctuations may have been obscured by our method. When utilizing individual records and when statistical analysis is not required, we recommend using the datasets at their original resolution (these full datasets can be found as Supplemental Files of the publications or in repositories, see Supplemental Table S1). Similarly, climate fluctuations on a smaller spatial scale may also be concealed when averaging by region – a problem exaggerated by the heterogeneous nature of climate in the region. This is well demonstrated by examining the two centuries with a mean z-score closest to 0, which are 2,900 BP and 7,400 BP. The first sees regional mean centurial z-scores relatively close to 0: 0.31 in the Southern Balkans and −0.14 in both the Peloponnese and Western Anatolia. However, at 7400 BP, the Peloponnese mean centurial z-score is −1 and the other regions have a mean centurial z-score of 0.5. Despite their utility, mean z-scores can obscure potentially interesting and viable spatial patterns. This is even clearer when you inspect records at a smaller spatial scale; for an example, see the high variability between relatively close records in the Peloponnese and consistency amongst records in Western Anatolia at 2900 BP (Figure 8). However, viewed from a more positive perspective, combining numerous records will reduce the noise from local (and potentially non-climatic) events, thus giving a more realistic overview of climatic conditions. Events that remain despite a compilation of diverse records are therefore more impactful and/or more widespread. Averaging of numerous records also produces a “study bias” wherein regions with more data, in this case the Peloponnese, have a disproportional strength on the overall z-score average. As an example, the period 5100-4700 BP is dry in the Southern Balkans (−0.61 to −0.27, M = −0.47) and Western Anatolia (−0.93 to 0.11, M = −0.38) but averages out as slightly wet (0.05–0.25, M = 0.16) due to wetter conditions in the Peloponnese (0.61–0.84, M = 0.69). An additional challenge is presented by the varied length of records. A “z-score temporal skew” can appear in longer records, where earlier or later conditions also impact the z-score of a period. This is why we chose to exclude data covering the large climatic shifts at the transition into the Holocene, which would have obscured the relatively smaller variability in the Mid- to Late-Holocene. One potential example of this in our results is the difference between the marine sediment cores M2 and SL148 in Focus Period 3. The M2 record is relatively short and thus does not cover the wet mid-Holocene to compare with this period in the z-scores; however, SL148 appears dry in Focus Period 3, perhaps due to a contrast with the positive z-scores during the wet Mid-Holocene.
Comparing the Aegean mean z-score, from this study, with the mean z-score for the Balkan region used by Finné et al. (2019) reveals how the addition of new data points highlights the complexity of the hydroclimate in the region. The major difference between the two syntheses is that ours includes records from the Peloponnese that have since been published and records from Western Anatolia, previously organized into a separate region (Anatolia). The addition of these southern and western records shifts the mean z-score primarily in the earlier parts of the Holocene, the main difference is between 8800 and 6600 BP.
Hydroclimate records themselves come with a varied set of uncertainties that are not rectified by our method and will likely contribute to some of the disagreement between records. First, the absolute dating methods (radiocarbon and uranium-series dating) used to establish the chronologies of the hydroclimate records have age uncertainties that vary from ±a few years to ±several millennia. Related to this, the standard errors used when displaying such dates are not uniform: radiocarbon dates commonly use 1σ (sigma) whereas 2σ is the standard in uranium-series dating, which account for 68.3% and 95.4% confidence, respectively. Another chronological issue pertains to various lags in the hydrological system; whilst soil moisture responds rapidly to changes in precipitation, archives will exhibit a delayed response which is not quantified. Therefore, a climatically dry period may appear at a later date in the hydroclimate proxy data (see Jones et al., 2019). Additionally, it is not often stated and therefore unclear whether single data points (e.g. 200 CE and 210 CE in a decadal-resolution record) represent the average between the preceding and succeeding data points (195–205 CE and 205–215 CE), or “snapshots” of a specific year. We recommend that the above uncertainties are clearly indicated in the methodology and/or results of future publications so that they are transparent for other researchers.
Uncertainties also result from difficulties in interpreting proxy data. For instance, all records in this synthesis detail aspects of the hydrological system, yet these aspects are not identical. Lake records commonly record Lake Water Balance (LWB: water into vs water out of the lake system); speleothems are often interpreted to respond to the amount of water entering the karstic aquifer above the cave (roughly equates to effective moisture: precipitation minus evapotranspiration); and marine sediment δ13C records detail riverine input to the ocean. These are all primarily related to precipitation amount at the general time of archive formation, but will have additional influences from other atmospheric conditions, vegetation, soil types and conditions, and geology. Therefore, in our analyses, and projects using similar approaches, the proportion of each archive type and proxy included will influence the regional average. Interpreting the spatial representability of each record is another significant and, in most cases, unresolvable challenge further complicated by the variability of this representability over time. The size of each lake area and catchment, aquifer catchment (for speleothems), or river catchment (for marine sediment cores) will vary significantly (Jones et al., 2019; Seguin et al., 2019), as will the local response to external factors, for instance climatic and environmental change at various spatial scales or human influence. When analyzing specific records in the three focus period maps (Figures 7–9), differences between those in close proximity to one-another suggests both high heterogeneity of climate and the small spatial extent represented by some records (i.e. the signal recorded in some proxy data is very local). Ultimately, the variability between records results from both these uncertainties and actual climate change, distinguishing the proportion of each is challenging.
Implications for studies of climate-society interactions
When comparing these records to archeological and historical evidence, the above-mentioned uncertainties must be considered, as well as additional challenges which we outline below (Degroot et al., 2021; Izdebski et al., 2016; Knapp and Manning, 2016). It is beyond the scope of this paper to fully explore societal changes and their potential links to climate change in the Aegean summarized by our analyses. However, here we examine the three focus periods to emphasize the challenges in doing so. We refrain from drawing any simplistic causal relationships between climate and societal developments and strongly recommend other researchers avoid the trap of mono-causal explanations linking climate “deterioration” or “amelioration” to societal “collapse” or “prosperity.” This type of argumentation is especially weak when construed from a single environmental archive, which can be avoided with paleoclimate synthesis. Our three focus periods all occur contemporaneously to periods of significant societal developments. Firstly, in Focus Period 1, dry conditions correspond chronologically to a period of apparent changes in settlement patterns and agricultural strategies that followed the transition from the middle to late Neolithic (Lespez et al., 2016; Weiberg et al., 2019). If interpreted deterministically, one could argue that these changes were adaptations in response to dry conditions. However, this hypothetical example is scientifically non-robust, disregards variations between sub-regions, and serves to show many interpretations are simple to propose, but hard to prove. Interestingly, and despite not being selected for this reason, the other focus periods have both been extensively studied in terms of climate-society interactions. Focus Period 2 corresponds to the so-called Late Bronze Age (LBA) “collapse” across the Eastern Mediterranean (including the Aegean), an event that has both climatic and non-climatic hypothesized drivers (e.g. Kaniewski and Van Campo, 2017; Knapp and Manning, 2016; Middleton, 2017). Evidence for a dry period at this time is growing, our data shows a long stretch of dry conditions most pronounced in the Peloponnese and later in Western Anatolia (Figure 4). However, both the dynamics and extent of the climatic conditions, as well as the evidence for a societal impact, are vehemently contested (Kemp and Cline, 2022; Knapp and Manning, 2016). An important consideration here is that, whilst the z-score values are not as negative in this period when compared to Focus Periods 1 and 3 (Figure 6), the amplitude and speed of drying is more severe, which is potentially more impactful (Figure 4). Focus Period 3 covers the Medieval Climate Anomaly (MCA), during which dry conditions have been theorized to cause migration driven by famines and resulting conflicts in the Eastern Mediterranean (Ellenblum, 2012), whilst on a smaller spatio-temporal scale, it has been argued that economic expansion continued in spite of less-favorable climatic conditions (Preiser-Kapeller, 2022; Xoplaki et al., 2018).
Using proxy data to reconstruct climatic conditions, the environment, or a society, that can no longer be directly observed will always contain significant ambiguity (Degroot et al., 2021). Linking hydroclimate change to perceived societal change is therefore impossible to do with utmost certainty. However, to make assertions as confidently as possible, several criteria must be reached. First, the hydroclimate change should be demonstrated to have occurred in an area relevant to the community being studied. This would ideally be evidenced by multiple independently-dated and proximate hydroclimate records. Second, evidence for a mechanism that could feasibly link the identified climatic and societal change should be established, for instance data showing a reduction in crop productivity or damage from climate-driven natural disasters. Third, other factors should be ruled out, such that the likelihood they caused the societal change without the influence of climate change is null. An important consideration is that societal and climatic changes occur frequently throughout history, so correlation does not necessarily mean causation and their coincidence may simply be random. Thus, you could also test statistically the likelihood that a specific climate shift and societal event would occur simultaneously under random conditions (e.g. as in Kintigh and Ingram, 2018). In most archeological cases, reaching the above criteria is impossible given the available evidence. We do not mean to completely disregard climatic factors from the conversation but rather stress that their uncertainties be understood and that further work is still required to unlock the full potential of climate-society interaction case studies. Additionally, this degree of rigor is rarely given to other explanations of societal change; for example, Roman technological innovation is frequently assumed to cause settlement/population growth via enhanced agricultural productivity without ruling out all other factors and performing statistical chronological tests. The complexity of societal change means it is rarely mono-causal; countless examples now suggest the convalescence of multiple factors is more important for large-scale societal change (Jacobson, 2022; Weiberg and Finné, 2022).
Conclusion
In this paper, we have standardized and synthesized data from 31 hydroclimate records from the wider Aegean region, covering the last 10,000 years. Correlations and principal component analysis revealed no simple spatial patterning of archives across the Aegean. As has been noted elsewhere (e.g. Rohling et al., 2019), covariation between events should not be expected across a wide region (even a “small” region such as the Aegean). This is especially true in the Eastern Mediterranean, where hydroclimatic conditions are heterogeneous across short distances both in the past and present. Dissimilarities between records is therefore expected; however, this is further complicated by differences in the uncertainties and interpretations of archives. Despite this, there are still some observable patterns and the general discrepancy between archives indicates that when there are patterns, they are more impactful.
It is difficult to determine a shared long-term trend for all of the Aegean region. Rather it seems the three sub-regions have individual long-term trends that periodically converge and diverge. From the start of our study period until approximately 7000 BP there are near opposite patterns in the Southern Balkans compared to Western Anatolia and the Peloponnese. However, following this period a longer term trend is revealed by our analysis that suggests a peak in humid conditions from 5900 to 5400 BP followed by a trend toward drier conditions culminating around 3000 BP. Following a return to wetter conditions peaking at slightly different times in the sub-regions, there is again a shared trend toward drier hydroclimate conditions going toward the present. Consecutive dry centuries occurring between 7200 and 6700 BP; 3300 and 2800 BP; and 1200 and 700 BP mark some of the driest periods in the Aegean. However when scrutinizing these so-called “Focus Periods,” we find they are characterized by variability between and within the sub-regions, and between archive types. We highlight both existing uncertainties in hydroclimate records (dating precision and accuracy, response times, interpretation, and spatial extent) and challenges resulting from the upscaled z-score method (loss in spatial and temporal resolution, study bias, and the “z-score temporal skew”).
Despite the high number of records within a relatively small region, there are still clear spatio-temporal gaps: Crete and other Aegean islands, the eastern Balkans, and the western coast of Türkiye. There is also a clear lack of higher-resolution archives from the early Holocene. From an archive and proxy perspective, it is clear that there are differences between records from lake and wetland sediments and from speleothems. Our analysis suggests that lake and wetland sediment records and speleothems share long-term trends but that shorter term variability is more pronounced in the latter. More lake records are available from different parts of the Aegean and therefore together they provide better spatial coverage than speleothem records. On the other hand, speleothems can provide records with stronger chronological control and potentially less influence from human activities.
We advocate for careful consideration when utilizing paleoclimate records in studies of climate-society interactions, including transparency regarding the relevance of a record to a respective study site and of the uncertainties of records. We have produced a simplified dataset that can be used by those interested in studying the region, as well as maps displaying the z-scores for each century. These are freely available and are designed as an accessible resource that we encourage archeologists and ancient historians researching the Aegean to utilize without restriction (see Data Availability).
Supplemental Material
sj-xlsx-1-hol-10.1177_09596836241275028 – Supplemental material for Holocene hydroclimate synthesis of the Aegean: Diverging patterns, dry periods and implications for climate-society interactions
Supplemental material, sj-xlsx-1-hol-10.1177_09596836241275028 for Holocene hydroclimate synthesis of the Aegean: Diverging patterns, dry periods and implications for climate-society interactions by Matthew J Jacobson, Joana Seguin and Martin Finné in The Holocene
Footnotes
Acknowledgements
Researchers sharing their paleoclimate datasets in online repositories, as supplementary files to the original publications, or with us privately is greatly appreciated. We would also like to thank our colleagues Karin Holmgren and Erika Weiberg for their helpful feedback and discussions on this article, as well as the reviewers and editor for helping us to improve the manuscript.
Author contributions
Funding
The author(s) disclosed receipt of the following financial support for the research, authorship, and/or publication of this article: M. Finné is grateful to the Swedish Research Council for funding the project “Climate and ancient societies in the Bronze Age Peloponnese (Greece)” (2020-2024) awarded to PI Erika Weiberg (2019-02868).
Data availability
Aegean records included in our synthesis were all previously published and obtained either from the supplementary materials of original articles, the NOAA Paleoclimatology Database (https://www.ncei.noaa.gov/products/paleoclimatology), the PANGEA database (https://www.pangea.de/), or by contacting the primary authors. Links to accessible datasets, as well as our centurial and decadal averages of regions and archives are available in Supplemental Table S1. The average z-scores and maps displaying the record z-scores for each century are available in a Zenodo Database: Holocene hydroclimate synthesis of the Aegean (https://zenodo.org/records/11670013). These are available under the terms of the Creative Commons by License “Attribution” data waiver (CC BY 4.0: ![]() ) and we encourage other researchers to use them freely in their research and publications.
) and we encourage other researchers to use them freely in their research and publications.
Supplemental material
Supplemental material for this article is available online.
References
Supplementary Material
Please find the following supplemental material available below.
For Open Access articles published under a Creative Commons License, all supplemental material carries the same license as the article it is associated with.
For non-Open Access articles published, all supplemental material carries a non-exclusive license, and permission requests for re-use of supplemental material or any part of supplemental material shall be sent directly to the copyright owner as specified in the copyright notice associated with the article.