
Abstract
Identifying continuity and discontinuity in Holocene hunter-gatherer burial sites is often challenging. Roonka, is the largest excavated burial area in Australia. Despite preliminary analysis in the 1970–1980s chronology was challenging given the complex record of dune formation, intrusive burials, erosion and exposure. As part of collaboration with the River Murray and Mallee Aboriginal Corporation, we have re-analysed the legacy data. We have combined three tools: 3D reconstruction and spatial analysis of the site; Bayesian analysis of the radiocarbon sequence, and archaeothanatology to gain a deeper understanding of the relationships between burials and dune formation and hence the connection between changes in burial practices and environmental change. Analysis confirms that the site was used as a burial place over the last 8000 years, but the burial record has been significantly impacted by erosion. The most likely cause of erosion is ENSO-driven climatic change. Other changes that are not coincident with climatic change but alter the intensity of site use were identified by tracing the number of burials over time. Analysis indicates a shift from occasional and specialised use to increasing use in the mid to Late-Holocene. We argue that burial practices became more diverse and demographically inclusive over time. In summary, our analysis clearly demonstrates that it was not a place for everybody all the time. The selection of ‘who’ and ‘when’ demonstrates access to and maintenance of a broader set of persistent burial places in the Murray Valley region during the Holocene.
Keywords
Introduction
As found elsewhere, particularly in South Africa (Dewar, 2010; Hall, 2000; Loftus and Pfeiffer, 2023), the mortuary record in Australia is not the result of long-term excavation of burial sites. Instead, it reflects a systematic survey of areas in response to erosion and the accidental finds of burials. There have been relatively few scientific excavations of burial sites and arguably one of the most significant of these was the excavation of Roonka. Roonka is an open site situated on a dune adjacent to the Murray River and, like many other burial locations, has a complex record of dune formation, intrusive burials, erosion and exposure. The site was excavated during the 1960s and 1970s, yielding >200 burials (Pretty, 1988a).
In contrast to the comparatively dispersed record of burials in the early Pleistocene (Pardoe, 1988), Aboriginal burials in the late Pleistocene and Holocene are often organised and repeatedly occur in select locales. This pattern is evident along the well-watered corridor of the Murray River Valley in south-eastern Australia. The shift in mortuary practices has been interpreted in various ways, such as increasing territoriality due to population increase (Pardoe, 1988), intensification of social networks as part of a broader process of economic and social change in the later Holocene (Lourandos, 1997), or as a marker of increasing social hierarchy, stressors and inequality (Pate, 2006; Webb, 1984). Problematically, the burial sites these hypotheses are based upon have long chronologies (e.g. Kow Swamp; Stone and Cupper, 2003) or are undated. Furthermore, these sites offer relatively few events where intensity of site use can be analysed, particularly given limited excavation and reliance upon records of surface exposure (Clark and Hope, 1985; Littleton, 2000; Pardoe, 1993). Instead, Littleton and Allen (2007) argue that these sites are places of repeat and very specific activity and meaning (i.e. persistent places). Importantly, they reflect schemas of landform and purpose, specific responses to visible markers, and specific memories of particular events. It is these traits that hold the potential to indicate continuity and discontinuity on multiple planes. This complexity takes the interpretative context away from the limitations of a single meaning, pattern of usage, or association with particular people. What is noteworthy about Roonka is the extent of research that was undertaken by Pretty and colleagues to which new approaches can be applied. The challenge is in truly understanding site formation and chronology at Roonka.
In this paper, we use multistranded analysis combining 3D imaging of the site, Bayesian analysis of existing radiocarbon dates, and archaeothantology to reconstruct site chronology. These tools have enabled a complex understanding of continuity and change over time. A significant outcome of this approach is our demonstration of the value of legacy data when analysed with more recent methods. This work is undertaken in collaboration with and under permission from the River Murray and Mallee Aboriginal Corporation (Littleton et al., 2017).
Background
Roonka
Roonka is located on the west bank of the Murray River in Southern Australia (Figure 1). Most of the burials were recovered in an eroding sand dune lying between a seasonally flooded lagoon in the river channel to the east and an old flood basin to the west (Figure 1). The dune itself is interpreted as a lunette-like feature built by wind-deposited lacustrine deposits (Rogers and Gatehouse, 1990).
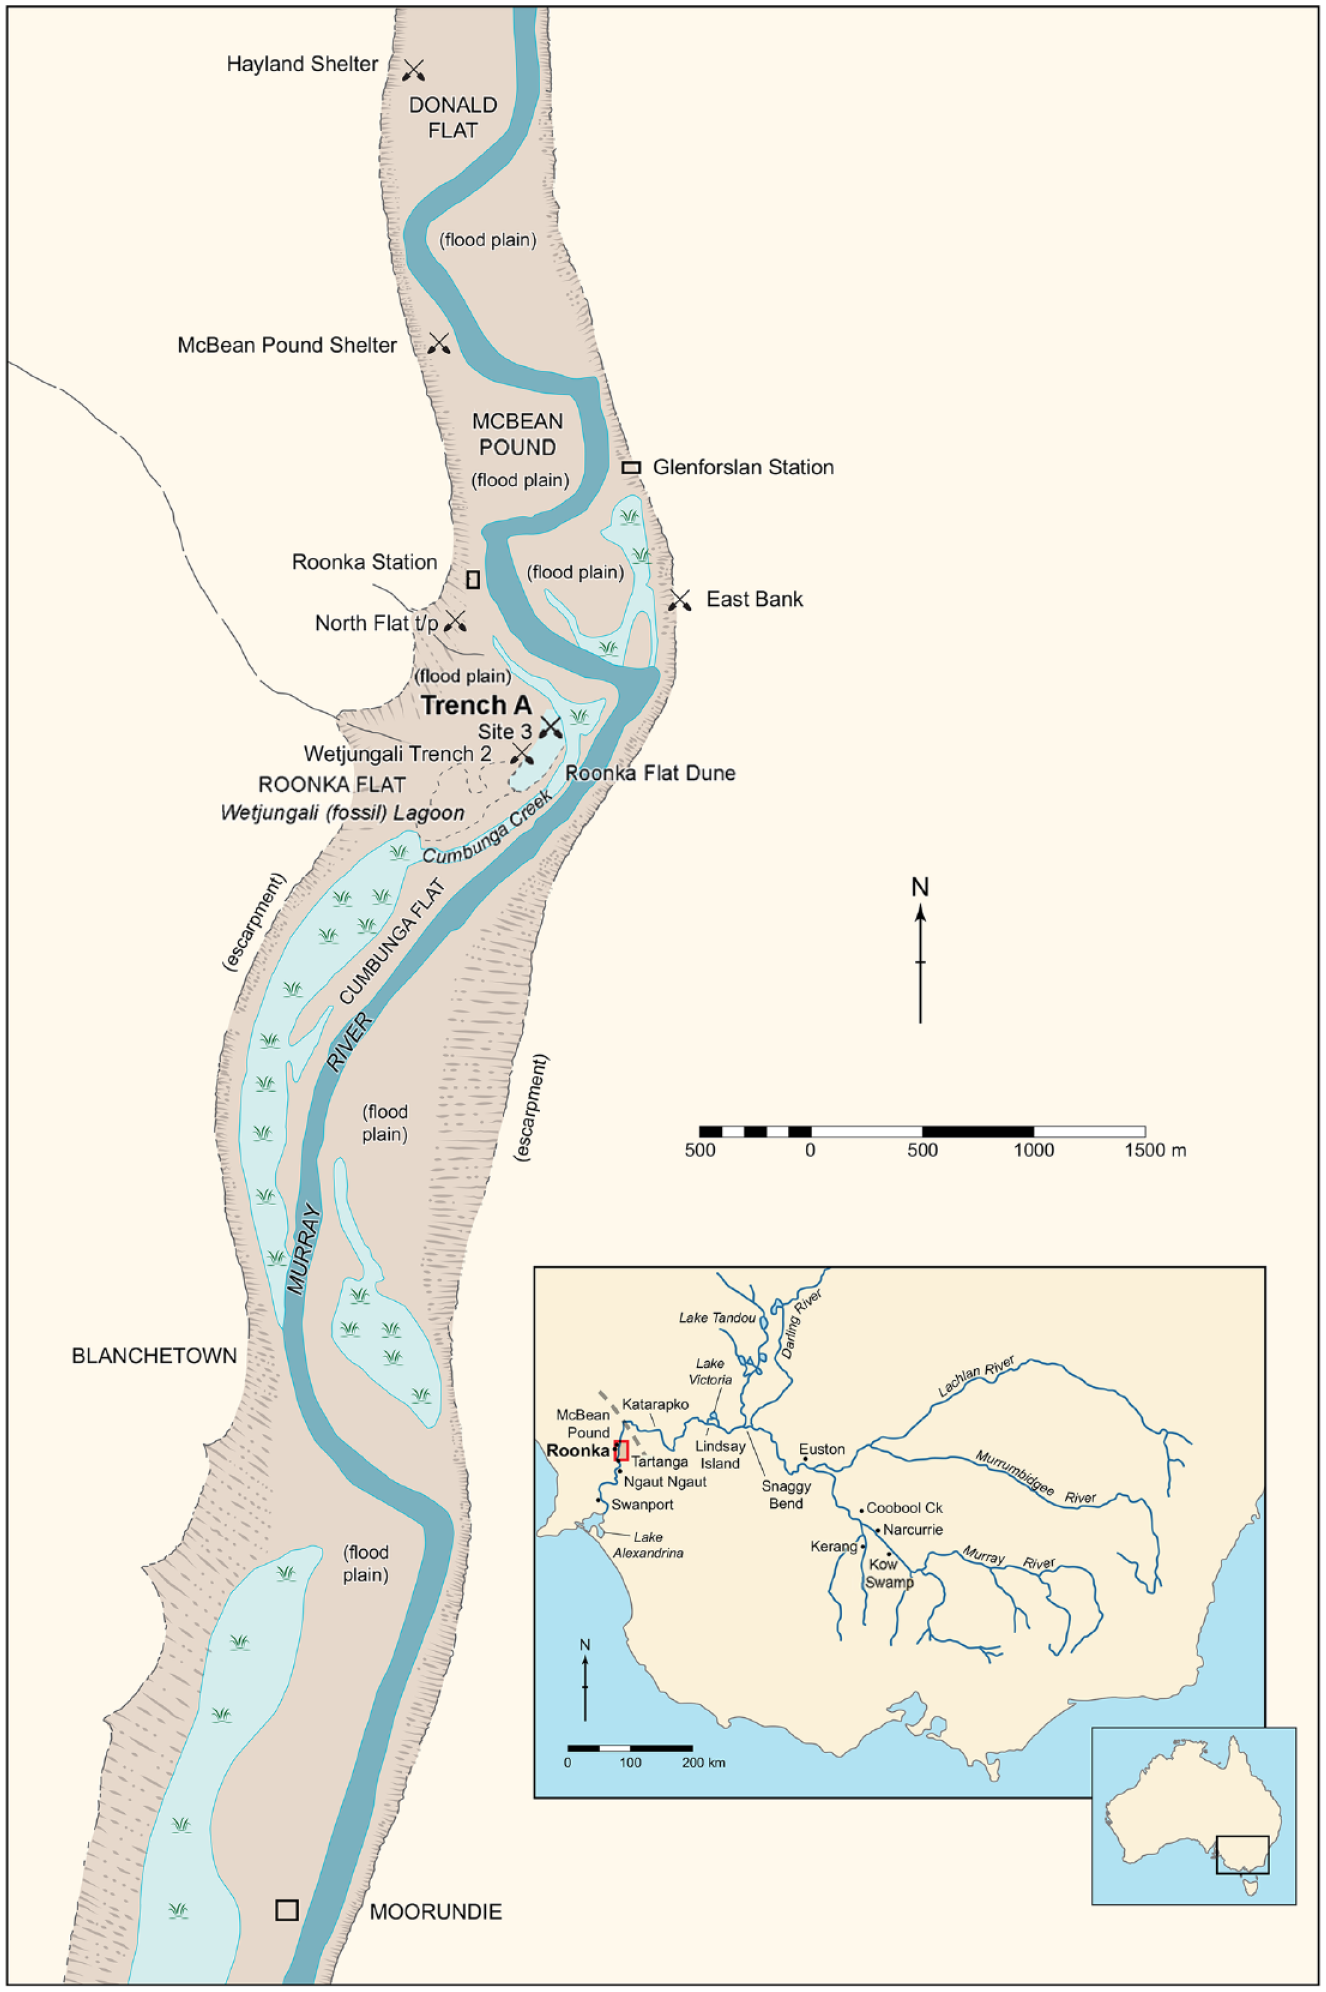
The location of Roonka including Trench A (adapted from Pretty, 1988a).
The dune has been subject to occasional flooding, such as in 1956, when most of the dune was covered in water, with only the crest visible (Pretty, 1988a). Records indicate a previous high flood event in 1870. However, the greatest damage has been due to wind erosion resulting from European agricultural activities such as land clearance, overstocking and ploughing after approximately 1860. In the 1960s, the damage at the site was recorded in South Australian newspapers with photos of a dense eroded scatter of human remains on the dune’s surface (Walshe, 2009). Consequently, Graeme Pretty of the South Australian Museum undertook a planned rescue excavation in 1968, which grew to be a long-term excavation and survey of the area from 1968 to 1977 (Pretty, 1988a).
Excavation was focussed in the area of greatest burial concentration, Trench A, 10 mm × 15 m, with some excavation of neighbouring areas. The excavators removed 3.05 cm spits 1 with great attention paid to stratigraphy (Walshe, 2009). In total, an estimated 216 individuals were recovered, with at least 180 of these from Trench A.
Geomorphology of Roonka Dune
The site of Roonka is situated on the west bank of the lower Murray Gorge (Figure 1). During the lower sea levels of the Pleistocene, the Gorge formed as the river cut through limestones (Twidale et al., 1978). Rapid sea level rise following the Last Glacial Maximum (21–19 kya, Lewis et al., 2013) led to the Murray River aggrading with coarse-grained quartz sands (known as the Monoman Formation, the lowest flood plain unit). Modern mean sea level was reached ca.800–7500 cal. BP (Belperio et al., 2002; Lewis et al., 2013). There is considerable debate about the status of the Lower Murray River through the Holocene (Bourman et al., 2022; De Deckker and Murray-Wallace, 2021; Helfensdorfer et al., 2020; Hubble et al., 2021; Tibby et al., 2021). However, the archaeological evidence suggests the river remained fresh to brackish below Blanchetown (c 10 km south of Roonka) and fresh above it. From ca. 7 to 3 kya, the river deposited fluvial clays and fine-grained sands (the Coonambidgal Formation: the shallowest flood plain unit) and incised its flood plain to its current level with the river confined to a single major channel (Hubble et al., 2021; Twidale et al., 1978). The river at Roonka now flows within a valley 3–4 km. wide, bordered on the eastern edge by a limestone cliff.
The Roonka excavation was located on a low dune of sand on the west, fronted by a narrow strip of floodplain and the Cumbunga Creek (Figure 1; Rogers and Gatehouse, 1990). Behind the dune, the ground falls away shallowly to the west, broken by remnants of the former cliff line. In this lower area lay the Wetjungali (fossil Lagoon). Generally, the sand dune has stood above flood waters, although, as the, 2022/23 flood showed, high water can encroach into the Wetjungali basin, encircling the dune on the east, south and west sides.
The base of the dune (Layer 4) is a red paleosol, possibly reworked by fluviatile action to become a terrace deposit (Figure 2). A radiocarbon sample from a possible hearth on the surface of this layer is dated to 23,320 cal. BP (recalibrated from Pretty, 1988a). This layer is surmounted by an aeolian deposit of pinkish-yellowish sand (Layer 3) interpreted as a lunette formed by erosion and mobilisation of sand deposits from the Wetjungali lagoon and forming during the late Pleistocene to mid-Holocene (Rogers and Gatehouse, 1990; Sutcliffe, 1982). Across most of the excavation the upper part of this deposit was missing, although the cross-sectional profile of a dune was still visible in parts. Sutcliffe (1982) interpreted the dune as stable for a period but ultimately subject to wind erosion. Layer 2 appears at its lower level as a silver-grey deposit, with evidence of water sorting suggesting a major flood (Thomson, 1983). Most of the lower level is grey-brown sand with further evidence of water deposition in the form of clay lenses. Layer 2 is present as a disconformity with Layer 3 and immediately follows the period of net erosion since there is no sign of an upper surface to Layer 3. Sutcliffe (1982) suggests that the ex situ cultural material found in this lower part of Layer 2 is lag from Layer 3.
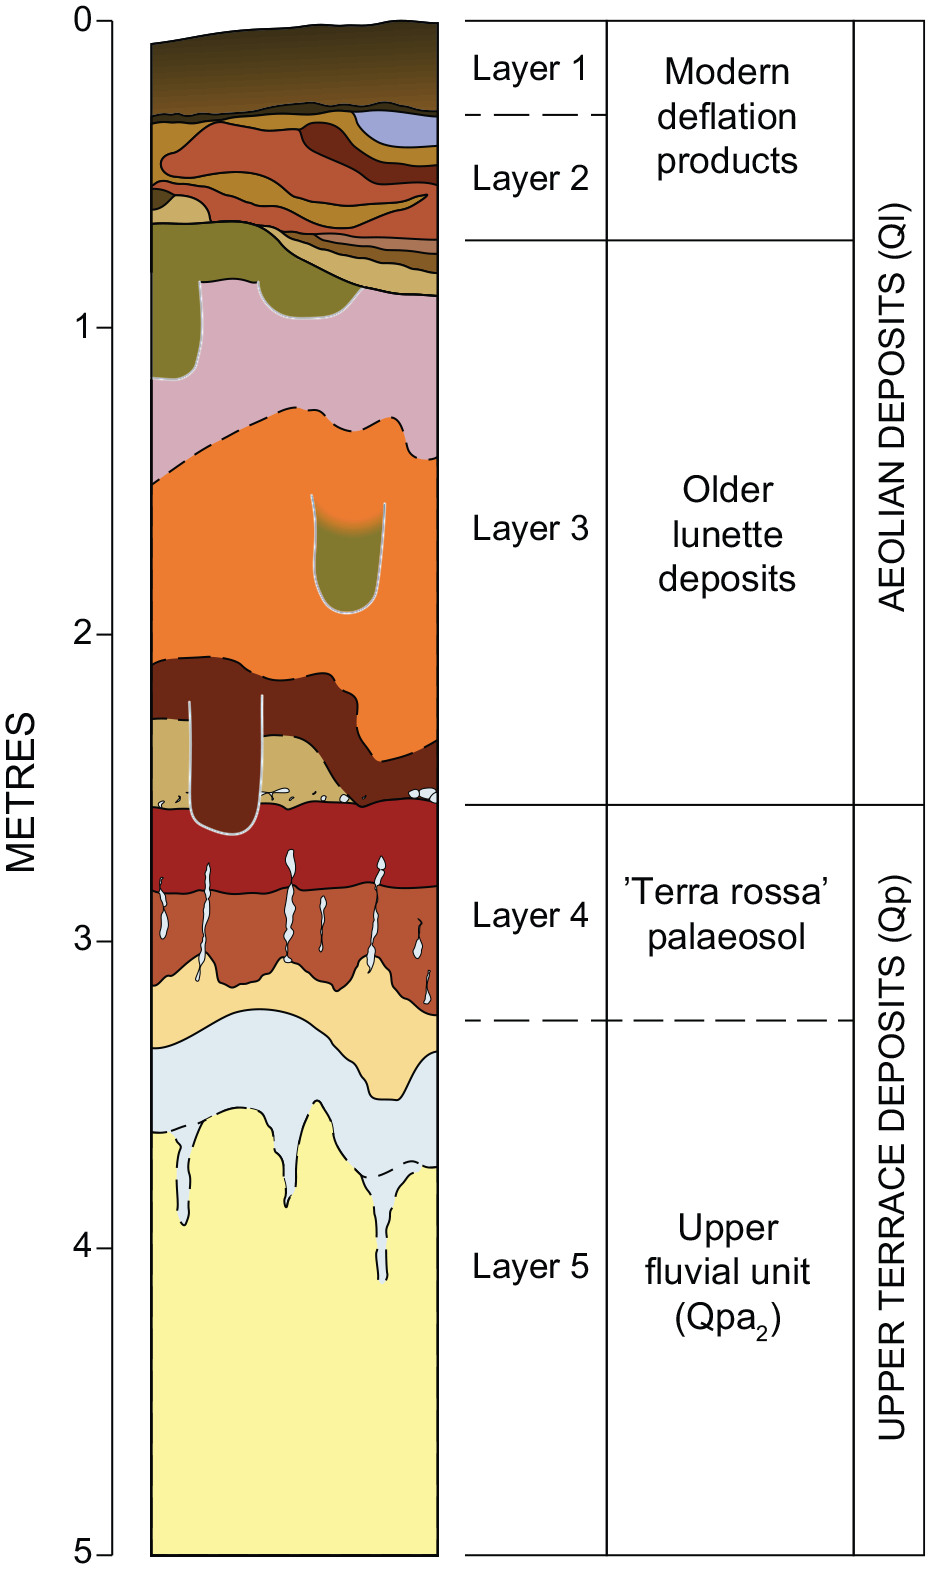
The stratigraphy of Trench A (adapted from Pretty, 1988a). Burial pits (outlined in white) show distinction between a pit within Layer 3 and with Layer 3 fill, compared to a pit originating in Layer 2 with Layer 2 fill, and a partial pit where the base of the pit is in Layer 3 but the fill comes from Layer 2.
The upper part of Layer 2 is an accumulation of drift sand with no evidence of water deposition. It is a mixture of sand types extensively reworked by wind, animal, and human activity, including extensive post-European erosion. The whole is surmounted by recent wind-deposited sand (Pretty, 1988a; Rogers and Gatehouse, 1990; Sutcliffe, 1982).
Late Pleistocene and Holocene Climate Change
The dune formation and reworking occur across a sequence of late Pleistocene and Holocene climatic and hypothesised population change reconstructed using a range of proxies (De Deckker, 2022) including radiocarbon dates (Smith et al., 2008; Williams et al., 2015). The early Holocene from ca. 11.7 to 8.2 kya is interpreted as a period of recovery from the LGM (Last Glacial Maximum) with warmer temperatures, increased precipitation and westerly winds (Shulmeister et al., 2016). It is succeeded by a mid-Holocene climatic optimum estimated in some records to last from ca. 8.2 to ca. 4.2 kya with greater rainfall and higher temperatures (Barr et al., 2014; De Deckker, 2022; Kemp et al., 2012; Quigley et al., 2010). From ca. 5 kya, the El Niño Southern Oscillation is established in southern Australia and is associated with reduced rainfall and enhanced variability, including droughts (Donders et al., 2007; Marx et al., 2011; Quigley et al., 2010). Roberts et al. (1999) trace a signal of aridity from 4050 to 3080 cal. BP in the zooarchaeological deposits of Ngaut Ngaut downstream and Mulvaney et al. (1964) noted deposits associated with a major flood dated to around 3000 cal. BP at Tungawa 6. The Late-Holocene records point to greater El Niño frequency and extended droughts alternating with wet La Niña events comparable to today’s pattern (Reeves et al., 2013). Timing and severity, however, are regionally variable (De Deckker, 2022). Cores from the Southern Ocean indicate increased millennial scale ENSO variability (Perner et al., 2018) interpreted as phases of predominant El Niño-like state from ca. 3.5 to 2.3 kya, from 1.6 to 1.2 kya and the last millennium alternating in time from 2 to 1.7 kya and 1.4 to 1.1 kya with La Niña like phases. Other records from western and southwestern Victoria suggest increased winter rainfall in the last 1500 years (Buckman et al., 2009; Marx et al., 2011), also pointing to variability. In the Murray Valley River, flows depend on distal conditions as opposed to local rainfall, which means extrapolation from these climatic records is difficult (De Deckker, 2022). However, conditions comparable to recent history seem likely.
While some have argued for continental-wide changes in climate correlated to human population (Williams et al., 2015) and activity, there is evidence of regionally specific sequences (Dortch et al., 2012; Holdaway et al., 2008; Westell et al., 2020; Wilson et al., 2022) tied not just to the availability of resources but also the taphonomic impact of these changes.
Original field methodology
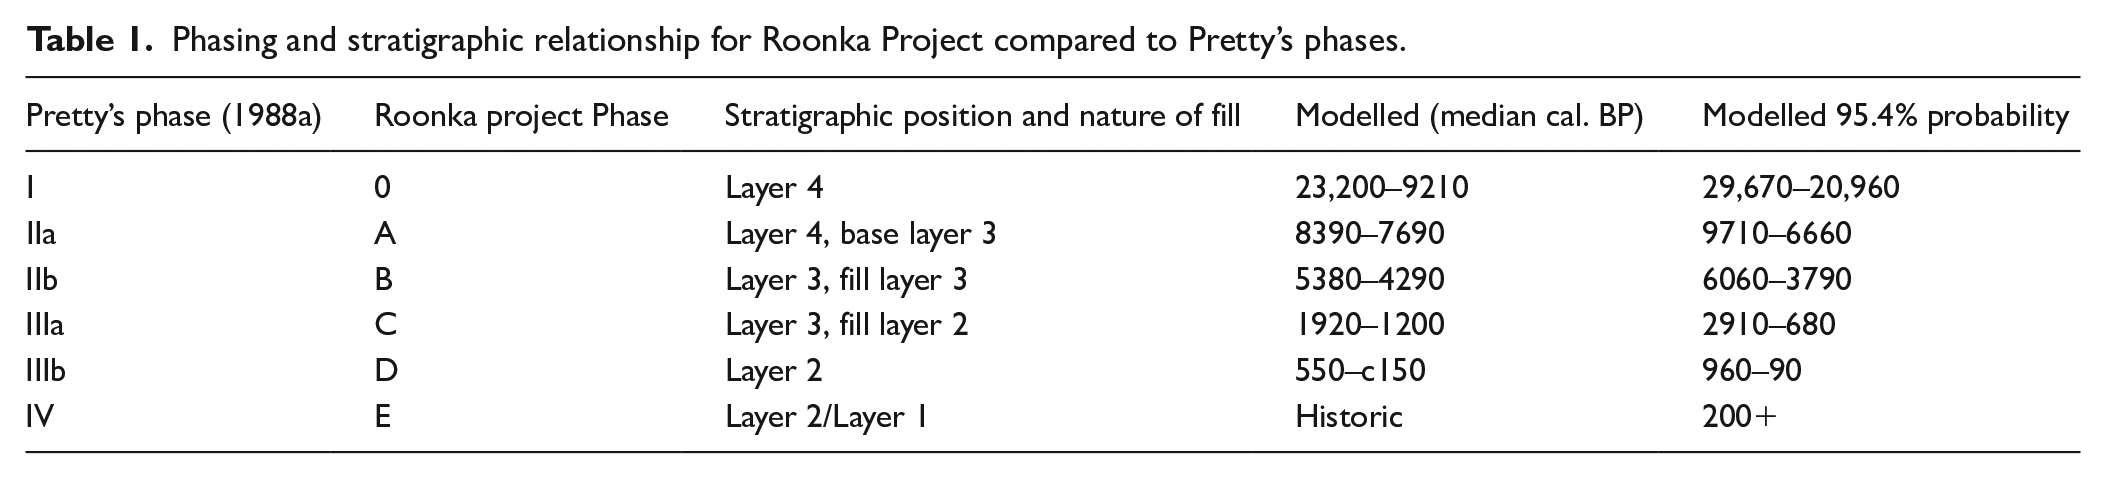
The extensively reworked stratigraphy of the Roonka Trench A, the intrusive nature of burials, and their unknown association with markers of occupation mean that before any continental or regional comparisons are drawn, it is necessary to disentangle site formation. Trench A (30 m × 15 m) at Roonka was excavated and recorded in 3.05 cm spits established by theodolite across the grid. Each artefact was provenanced to its respective spit and square (Pretty, 1988a). The location of a burial, skeleton, and non-burial feature was associated with a particular spit or spits. Following Pretty (1988a), we have distinguished between the stratigraphic layers, which are geologically drawn and sequenced at ground level from site phases that reflect human activity. Pretty labelled his phases with Roman numerals with I at the base (Table 1). We have used letters starting with A as the earliest to distinguish our phases from his. Layers and Phases are not interchangeable: while phases are drawn taking into account stratigraphy, ‘a layer will ignore cultural change whilst a phase ignores stratigraphic change’ (Walshe, 2009: 270).
Phasing and stratigraphic relationship for Roonka Project compared to Pretty’s phases.
Analysis
3D reconstruction of the site
Four major layers were identified in this trench, as described above (Figure 3). Pretty (1988a) excavated a test pit into Layer 4, which contained a small number of artefacts in the upper levels. Excavation of Trench A required some stabilisation of the southern, eastern, and northern baulks included in the 3 D reconstruction. (Figure 3a).
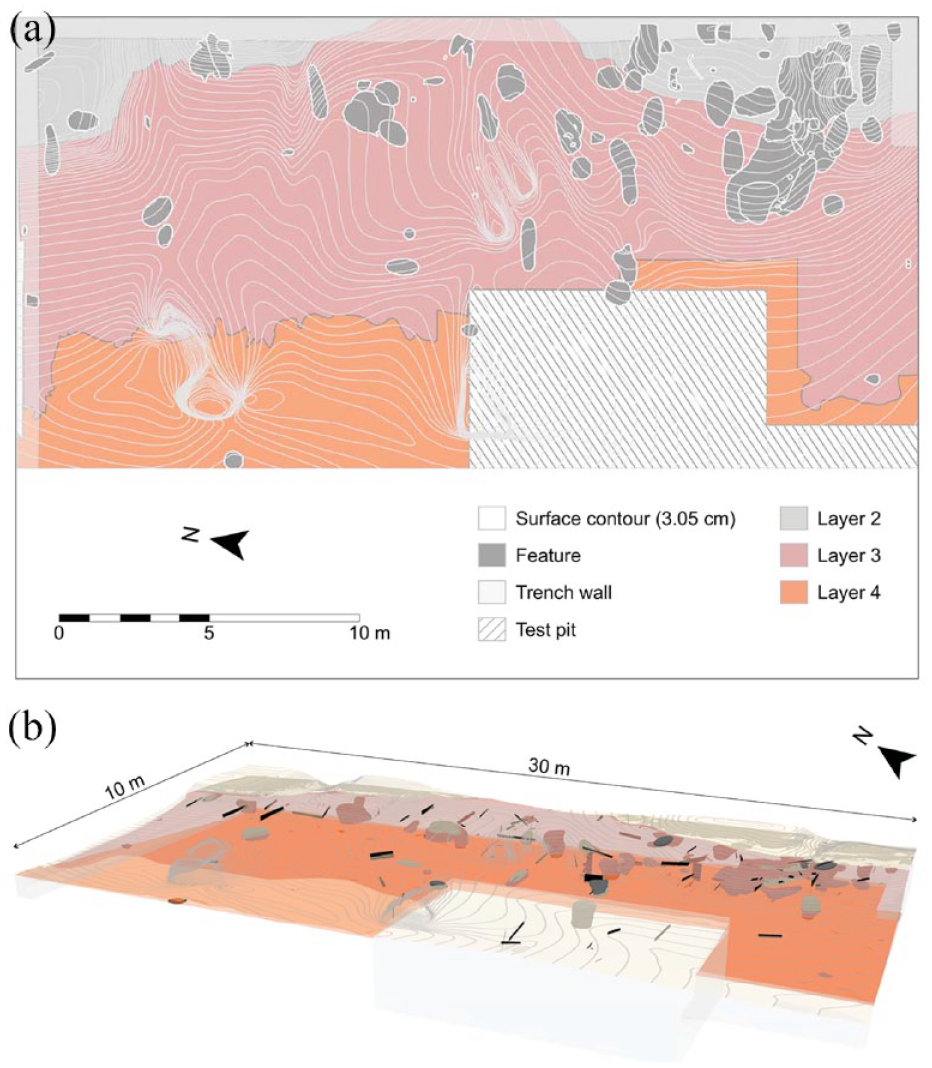
(a) 3D representation of Trench A from digitised plans. Trench A measures 30 m × 15 m. (b) Plan of Trench A with the extent of the layers excavated and features. The surface contour is representative of Layer 1.
The excavation record for Trench A consists of 67 plan maps illustrating 115 (3.05 cm) spits. Each plan map was scanned and digitised to create 2D and 3D models, as discussed by Emmitt et al. (2019). These 2D and 3D views included layers and features isolated between spits. Here, the model for Trench A has been further revised from that presented by Emmitt et al. (2019). The new model (Figure 3a) considers the relationship between layers, particularly the extent of the trench walls not included in the earlier model.
Digital imaging of the site has enabled a re-examination of the relationship between burials, pit fill and the site layers. It has confirmed the disconformity between Layers 2 and 3, as observed by Pretty and his team (Pretty, 1988a, 1988b; Sutcliffe, 1982; Thomson, 1983). Since burials are intrusive, an important observation is whether burials within Layer 3 were created prior to or after this disconformity. The distinction between the two is primarily evident in the burial pit and fill. As the digitisation confirms, the pits are not necessarily complete for their entire depth since the site has been severely impacted by erosion. Furthermore, areas of extensive cross-cutting, as found in the southeastern corner of the site, reveal that some burial pit margins are largely untraceable (Figure 3b). By linking the site plans by spit, it was possible to track pits and pit fill by depth. This, in turn, clarified the precise locations of burials relative to other burials (important for the archaeothanatological analysis). Although the field notes were detailed, time lags of weeks or months from the first identification of a pit and the final excavation of a burial complicated the interpretation and development of the plans. Additionally, mobile sand was a continuous problem for the excavators, who found it hard to differentiate windblown sand from the original fill. By linking the spits in the 3D image, windblown sand was more discernible, explaining some of the confusion in the 1970s recording of burials where there were inconsistencies in the identification of pit layers during excavation. As a result, the association between a burial and a layer (particularly Layer 3) became more visible, as well as the identification of fill from either Layer 3 or Layer 2. Importantly, this has clarified which burials pre-dated (those in layer 3 or 4 with layer 3 fill) and which postdated the disconformity (layer 3 or 2 with fill from layer 2), despite their similar depth in the deposit.
Bayesian analysis of the existing radiocarbon dates
Bayesian analysis has been used to tie the individual dates to site formation at Roonka. The two main building blocks in the Bayesian model are Sequence, which mirrors the stratigraphy of the site, and Phase, where the burials and associated materials belong to the same event, but the order is unknown. These are separated by Boundaries that define when the activity starts and ends (Bronk Ramsey, 2009a, 2009b). The dates were grouped into multiple phases and ordered based on relative burial sequence with either contiguous or sequential boundaries depending on the age difference and taphonomic evidence for hiatus and truncation events between superimposed layers. Where cross-cutting relationships between burials were identified, these were placed within sequences indicating order. Outlier analysis was used to test whether the radiocarbon data agreed with the prior information. This methodology provides a probabilistic measure and then calculates an offset relative to the context within which each sample is found and downweighs the influence of those ages on the model (Ramsey et al., 2010), enabling the inclusion of samples composed of old-growth wood and samples of insecure context (Bronk Ramsey, 2009b). A General t-type Outlier Model was assigned to all bone collagen dates with a prior outlier probability of 0.05, while the Charcoal Outlier Model was used for dates on wood or charcoal samples with a prior outlier probability of 1. This code indicates to the model that the dates on these samples can be 0–1000 years too old. The subsequent radiocarbon phases associated with burials are designated A to E.
Firescoops were found scattered across the site and a single date of ca. 23320 cal. BP obtained. No associated cultural material was found, leaving the significance of this early date unclear (Figure 4). The earliest evidence for the site being used as a burial ground starts ca. 9700 cal. BP (Phase A, upper Layer 4 and lower Layer 3; fill from Burials 108, 107, 89, and an artefact in Burial 91). Phase B (still in Layer 3) commences somewhat later, at around 5460 cal. BP (this includes Burial 90 truncated by Burial, 20C and associated with Burials 108A, 48, 23, 4). The interrelationship of these early features is unclear but may include sequential events of natural erosion and deposition that have truncated the burials, as shown in the 3D reconstruction.
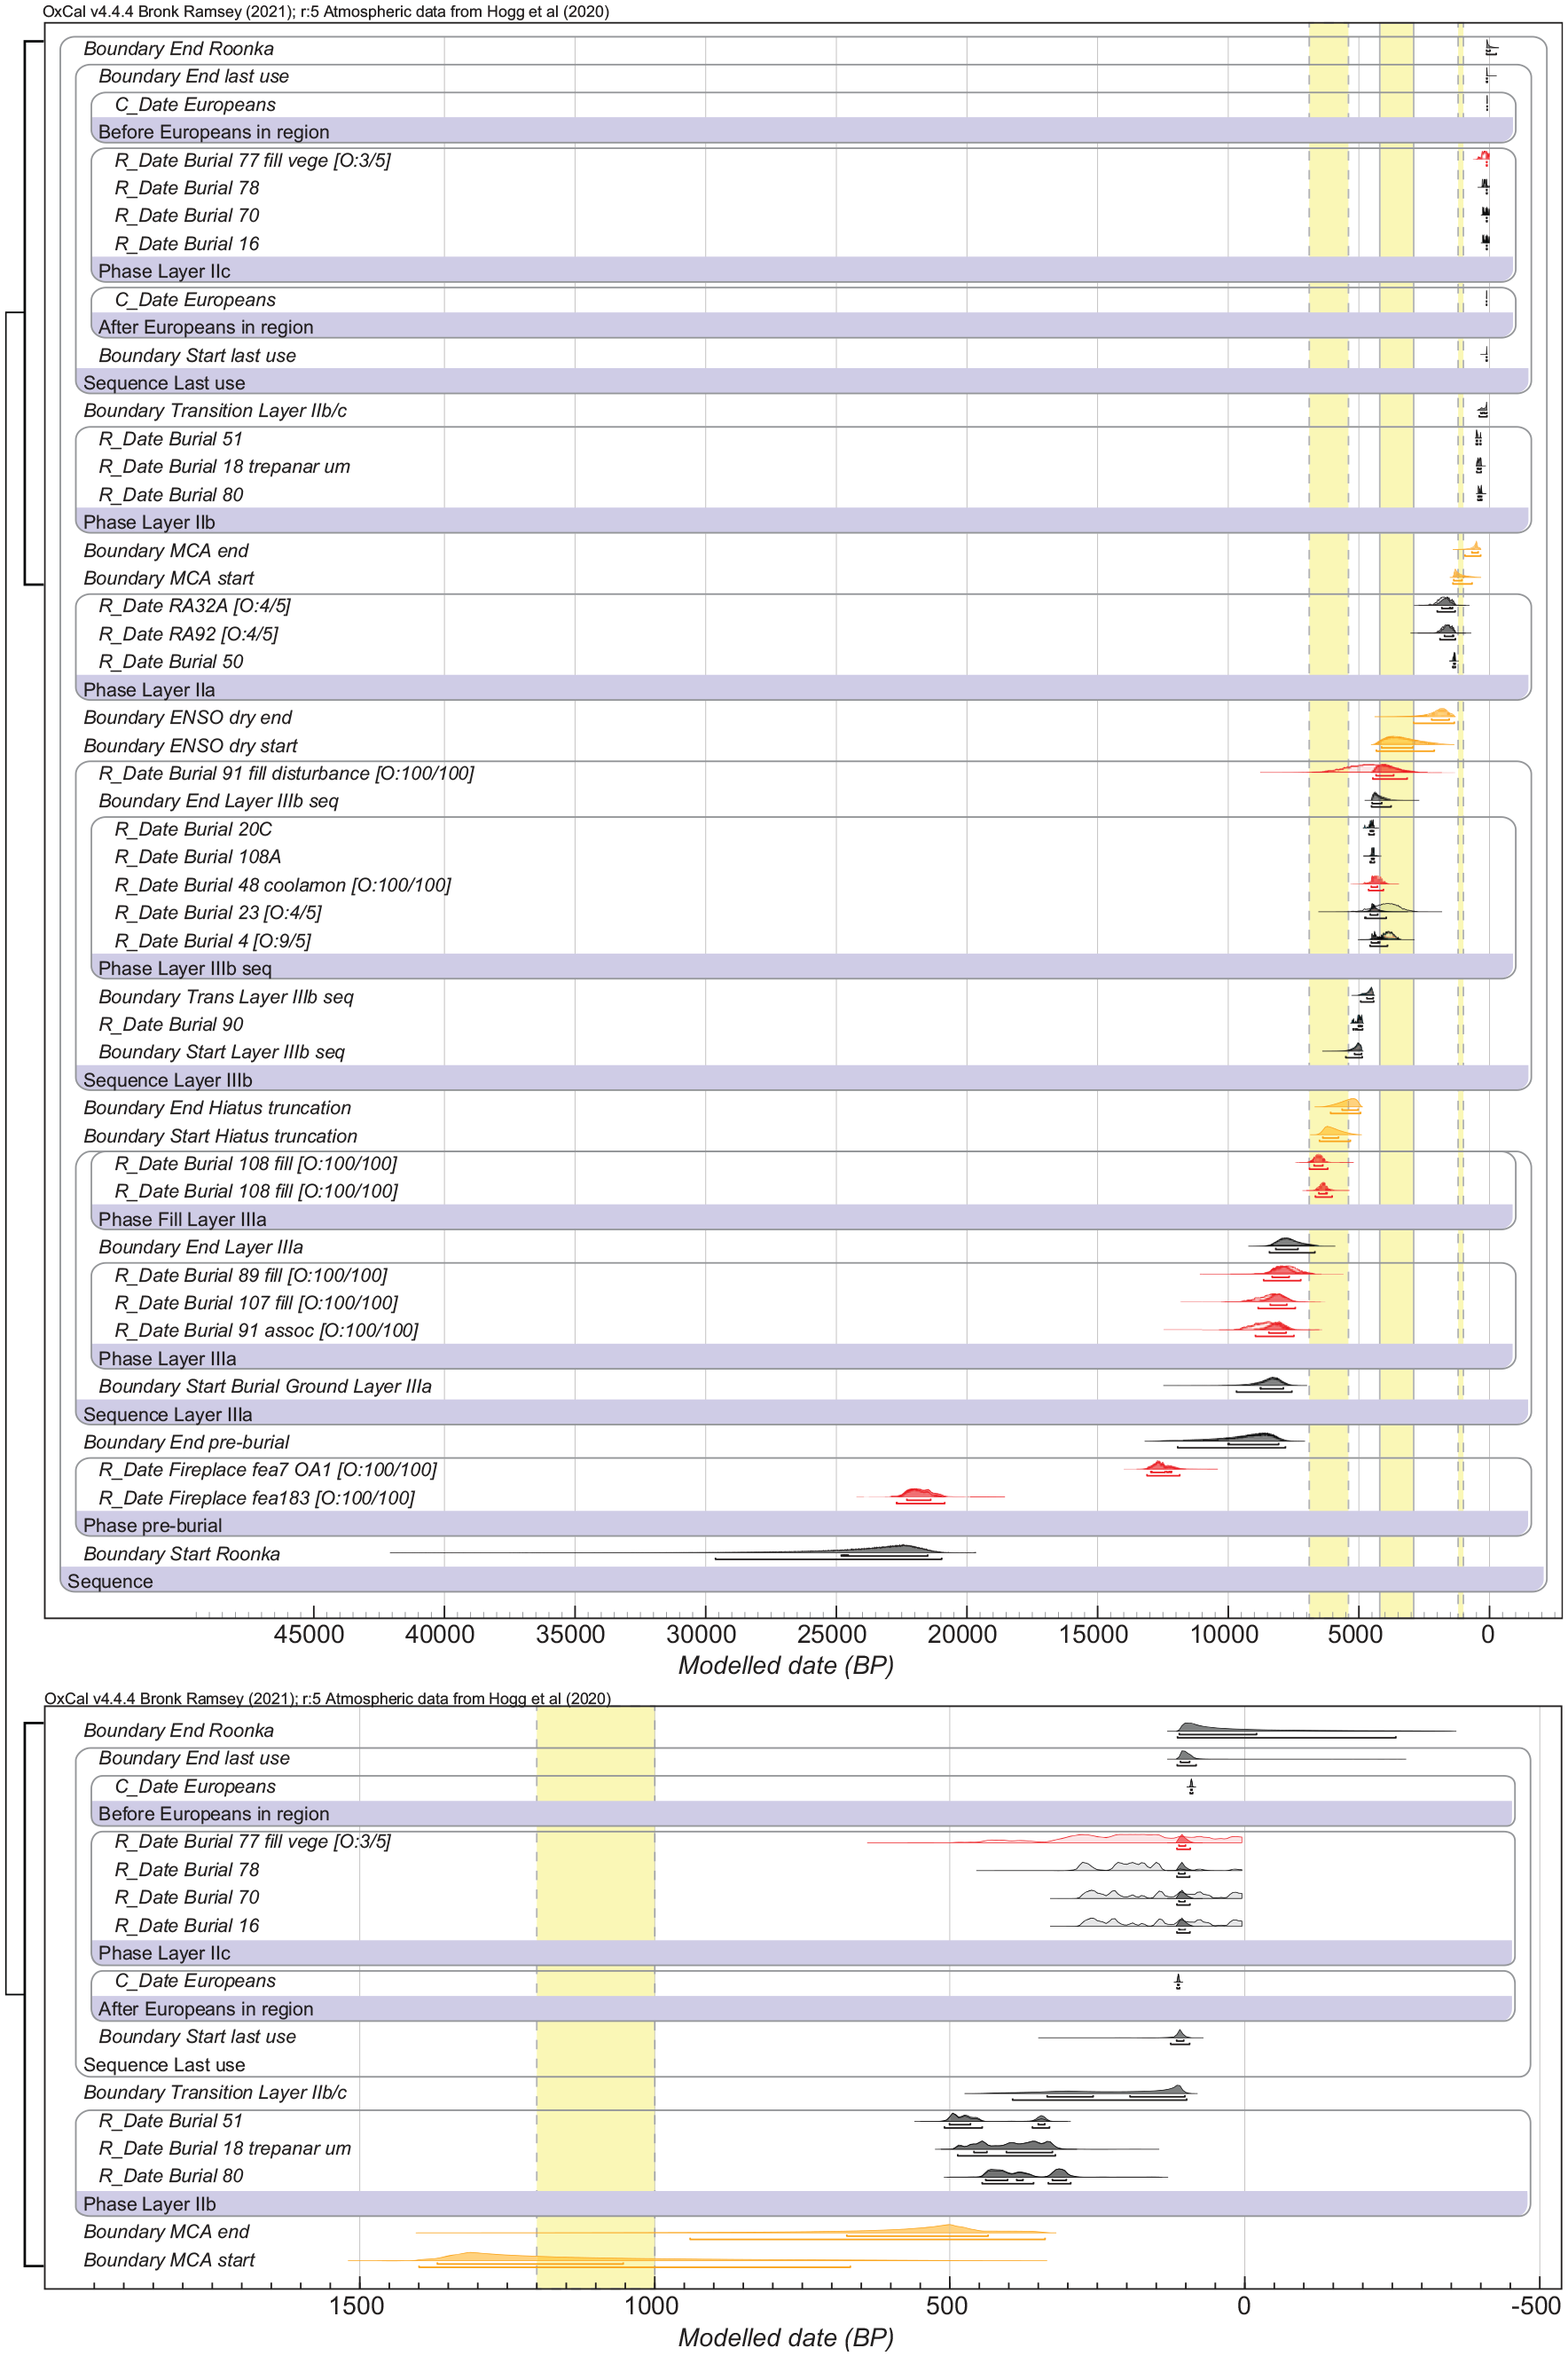
OxCal plots showing calibrated radiocarbon dates from. Red distributions: charcoal dates. Green distributions: bone (‘collagen’) dates. Orange distributions: boundary ages defining gaps within the sequence also clarified as bars across the distribution. Lower part of figure is extract of the latest time frame (1500 BP and later). Here, the dates have been further constrained by evidence of European influence, which started around 1838 CE and the estimated date of last use of the burial ground in 1860 CE).
A major gap in the chronology starts ca. 4350 cal. BP, which corresponds to the Layer 3/2 disconformity (Figure 4, Table 2), and may correlate with the onset of more severe ENSO-related dry conditions, as previously identified for the Murray River Valley between 3700 and 2000 cal. BP (Holdaway et al., 2008; Smith et al., 2008). Burial 91 reflects disturbance, probably due to erosion, and the date for this burial fills within the discontinuity.
OxCal model boundary ages and interval dates (in years) for major gaps (shaded rows) in the sequence. Boundary ages and gaps are modelled from Roonka dates only.
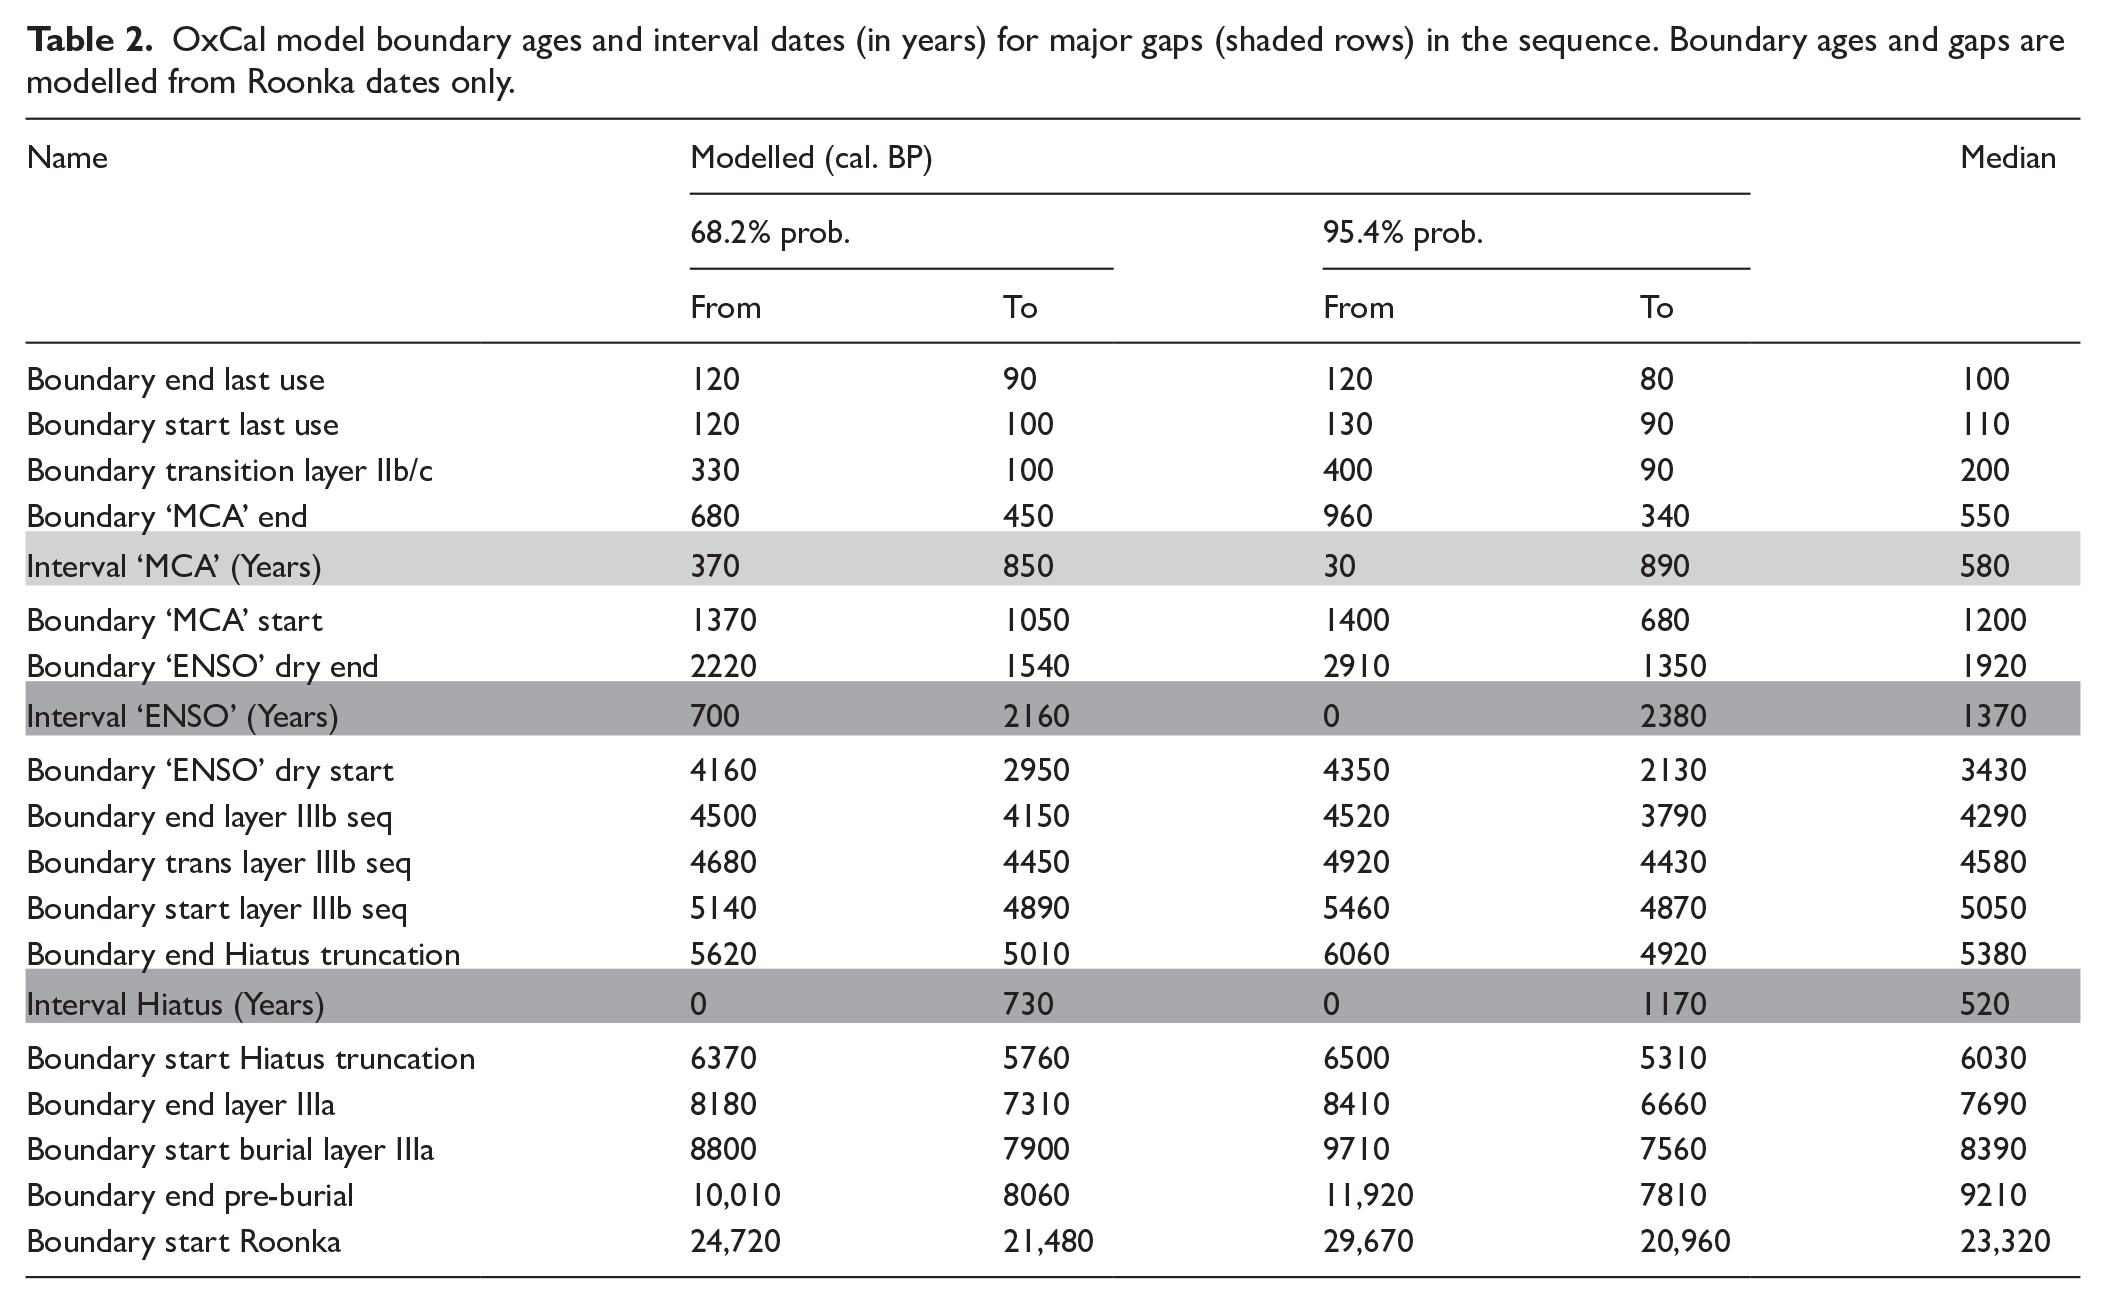
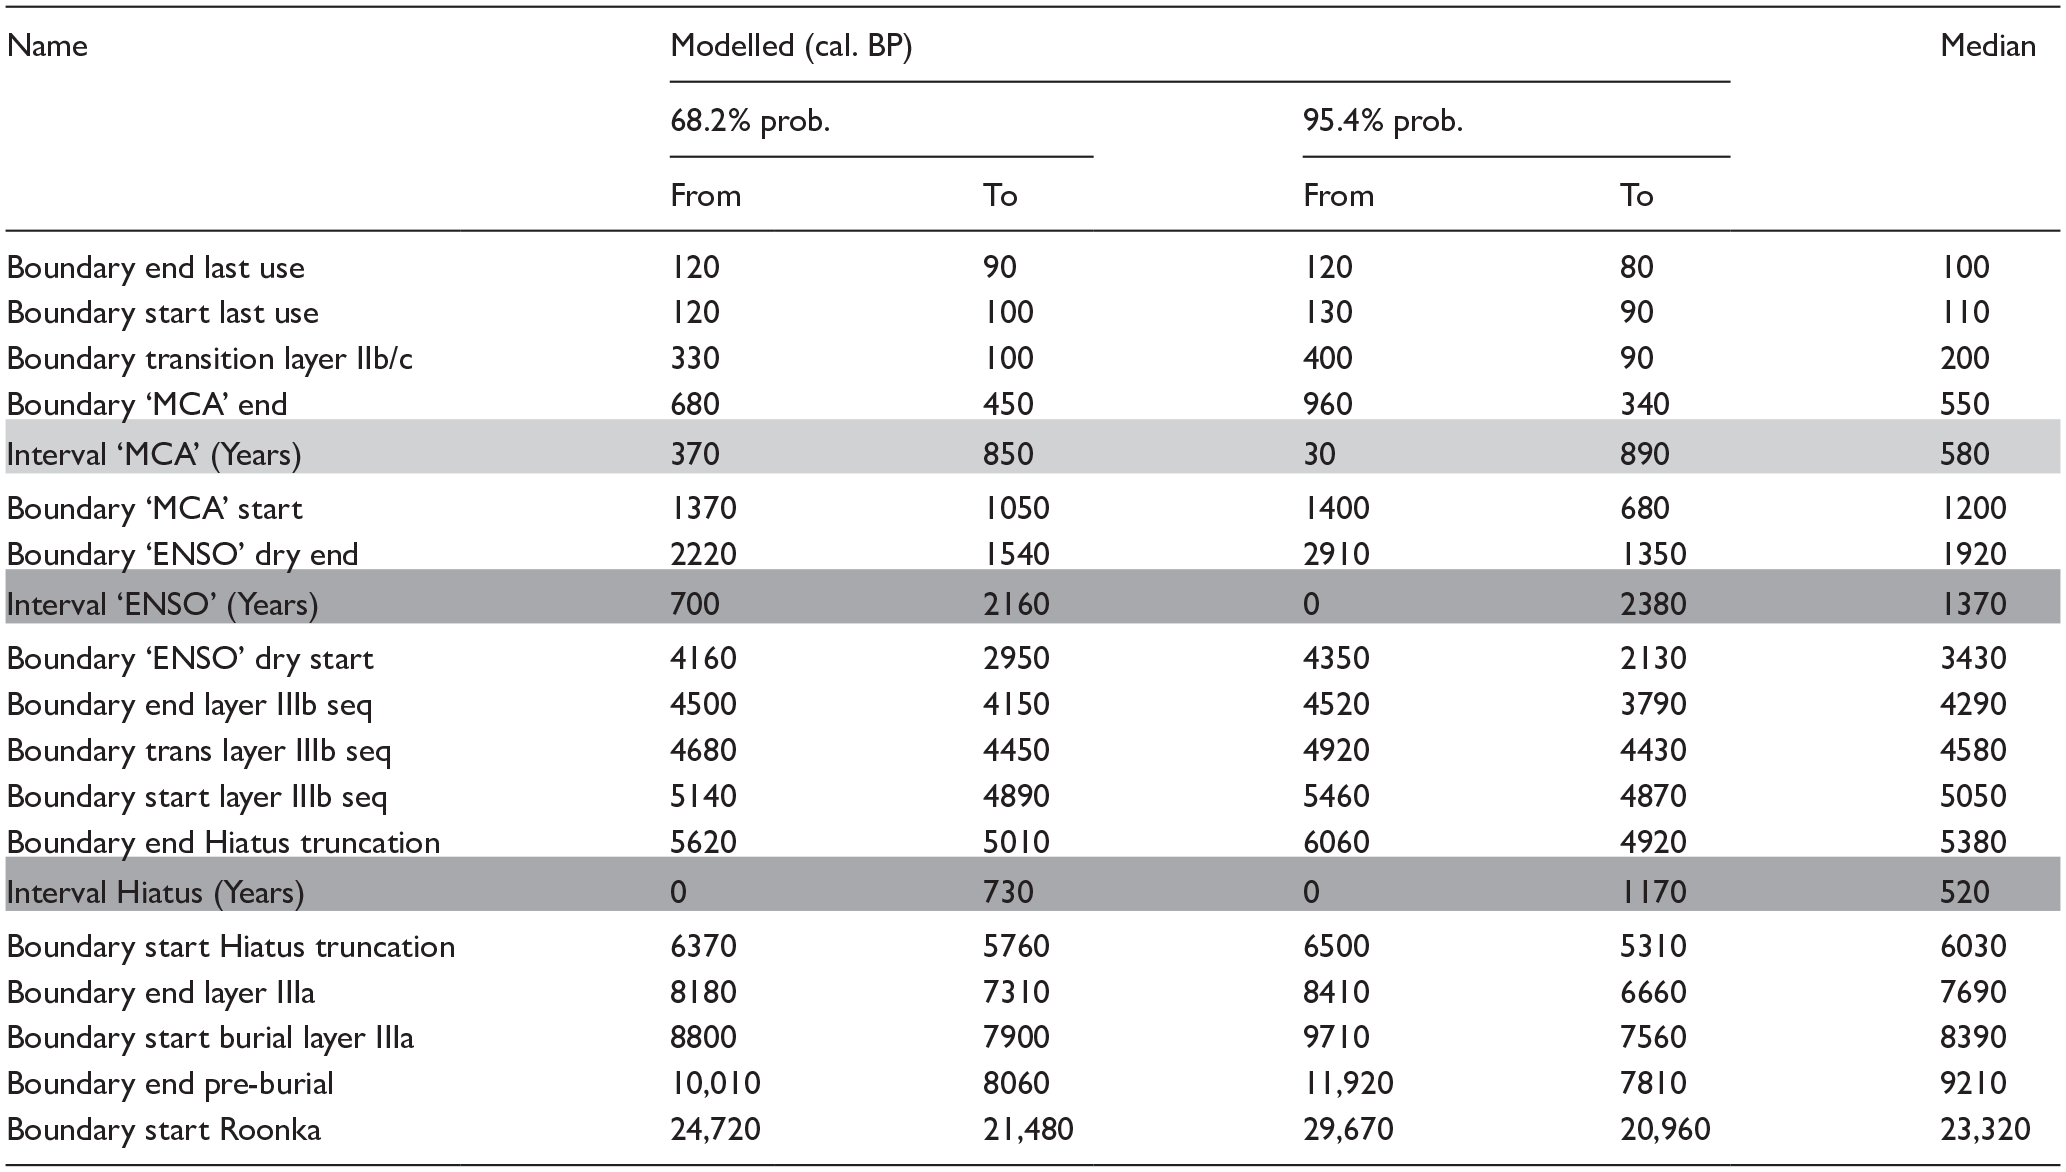
Following this gap, more burials are interred (Phase C: Burials 50, 32A, 92) and dug into Layer 3 but with (as discussed above) fill from Layer 2. A second gap in the dating occurs from ca. 1400−340 cal. BP, which possibly corresponds to, but extends beyond, the Mediaeval Climate Anomaly (MCA; 1200−800 cal. BP), when wetter conditions occurred. This sequence is followed by the deposition of further burials (Phase D) into Layer 2, although radiocarbon dates do not cover this entire phase. This phase transitions into historic burials of Layer 2 (Phase E). These burials contain evidence of European contact before and soon after an occupation licence was granted to Alexander McBean in 1845 CE (Pretty, 1988a).
We share with Pretty (1988a, 1988b) a division of site use into five phases, which are primarily concordant with the site stratigraphy (Table 1), but based on our reanalysis, we diverge from Pretty’s chronology. For example, while our Phase C corresponds stratigraphically to Pretty’s Phase IIIa, it does not equate in terms of either dating or which individual burials are assigned to that phase (Supplemental Data 1). Pretty did not assign any time to a discontinuity, having assumed that the burials were continuous. This had major repercussions for his interpretation of the different phases.
Archaeothanatology and uncertain chronologies
The reconstruction clarifies the stratigraphic sequence and the position of individual graves, while the available radiocarbon dates serve as temporal anchors for some burials (Supplemental Data 1). The detailed field notes, drawings and photographs during excavation allowed for a post hoc analysis of the deposition sequence using archaeothanatological and stratigraphic analysis. Archaeothanatology focuses on the reconstruction of the original placement of a body and subsequent movement due to decomposition of the body. Particular attention is paid to stable and labile joints, the anatomical position of the remains and the extent to which decomposition occurs within or outside the boundaries of the body (Blaizot, 2022; Duday et al., 2009).
Roonka is well suited for these principles to be applied given the clustered areas where graves were superimposed on or cut through earlier graves. Here, simultaneous interments (though not necessarily deaths) and successive interments can be readily reconstructed through patterns of internal collapse (e.g. interlinked burials of adult and children where the only disruption has been the child collapsing into the rib cage of the adult) and disturbance (e.g. where the lower body has been cut through by the subsequent interment). Such sequences allowed burials to be associated with each other and connected to stratigraphic location or an absolute date within a particular period.
The resultant chronology of burials has four degrees of certainty (Table 3):
Graves with an absolute date (radiocarbon or evidence of post-contact period) or graves that are part of a multiple interment where one burial has an absolute date.
Graves with association—graves that are part of a clear sequence evident in patterns of disturbance or are clearly defined by stratigraphic position plus grave fill.
Graves attributed by stratigraphic layer. These can be attributed to Phase A or B (burials before the disconformity) or Phase C or D (post-disconformity).
Graves that could not be fixed in time. These include remains that have been completely eroded and have lagged onto lower surfaces. (Labelled as U for unknown).
Distribution of individual interments by phase and means of attribution. Attribution to ‘A or B’ or ‘C or D’ is for those burials where it was not possible to be more precise.
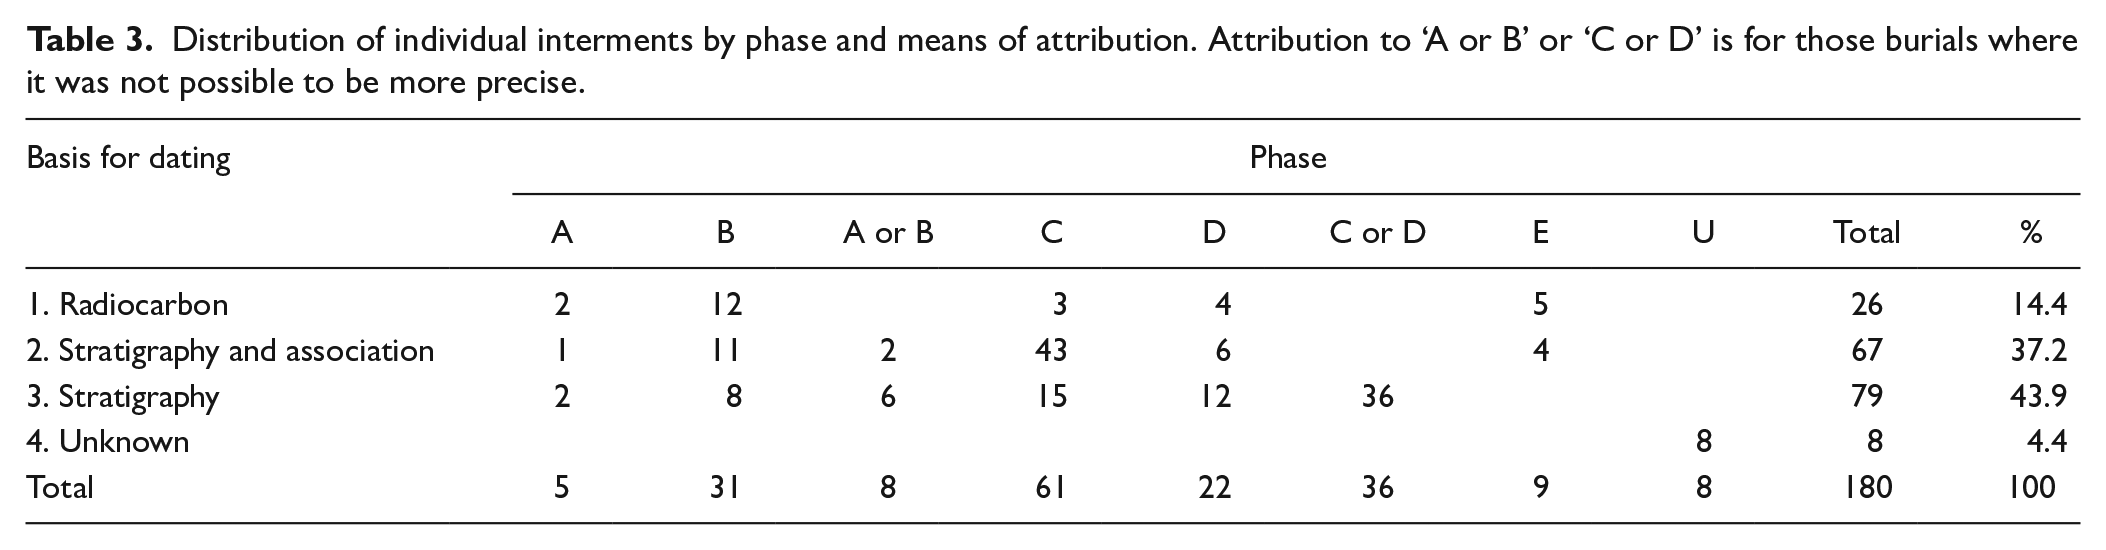
Of the 19 graves for which there was an absolute date, a further seven could be associated as part of a simultaneous multiple interment. There were 18 identified sequences of superimposition or cross-cutting. Most of these came from the southeast area of the trench, which Pretty termed in field notes ‘the mass grave’ because of the density of burials. Most sequences (15/18) only involved two or three successive events, but because of multiple interments, the number of individuals is significant (n = 67). The largest number of graves could be assigned on the basis of stratigraphy only (n = 79), and 44 could only be assigned to a broad phase (A or B = 8, C or D = 36) because the identification of the precise location and fill was equivocal. Finally, eight individuals could not be assigned a time period because they were lag deposits, the result of fragmentation and erosion of the sediment.
Comparing the revised distribution of individuals by time period to Pretty’s original assignments indicates that for most graves, the assignments agree (81/180) or agree to within the combined phases, A and B, C and D) (Supplemental Data 2). A significantly greater number of Pretty’s assignments were unknown (59 compared to 8), reflecting both the undercounting of individuals in the field and the reliance on burial position for assignment. Assignment disagrees in 15% of assignations (28/180). The majority of these are burials assigned in this work to Phase B but by Pretty to Phase IIIB. Two of these burials are assigned to Phase B by stratigraphy only, two are assigned by a radiocarbon date and seven by sequence plus stratigraphy. The disagreement seems to be the result of Pretty’s reliance upon the field descriptions of the burial fill. This inconsistency is most evident among the last graves excavated when Pretty was less frequently in the field and had less opportunity to compare field notes with his observations.
Discussion
Regional comparison
The dates from Roonka are compared with other radiocarbon dates (excluding shell and apatite dates) from burials along the Murray River and sites within the Murray River Gorge (Figure 5). Dates from the site of Swanport burials (Pate et al., 2003) all postdate 3000 cal. BP, while burials from other places along the Murray are very sparsely dated. Katarapko, for instance, has only two dates, which are ca. 3000 years apart despite the burials being adjacent and mimicking each other (Dowling, 1989; Littleton, 2007). The dates do not suggest any consistent gap in the record but reflect the overall sparsity of radiocarbon dates.
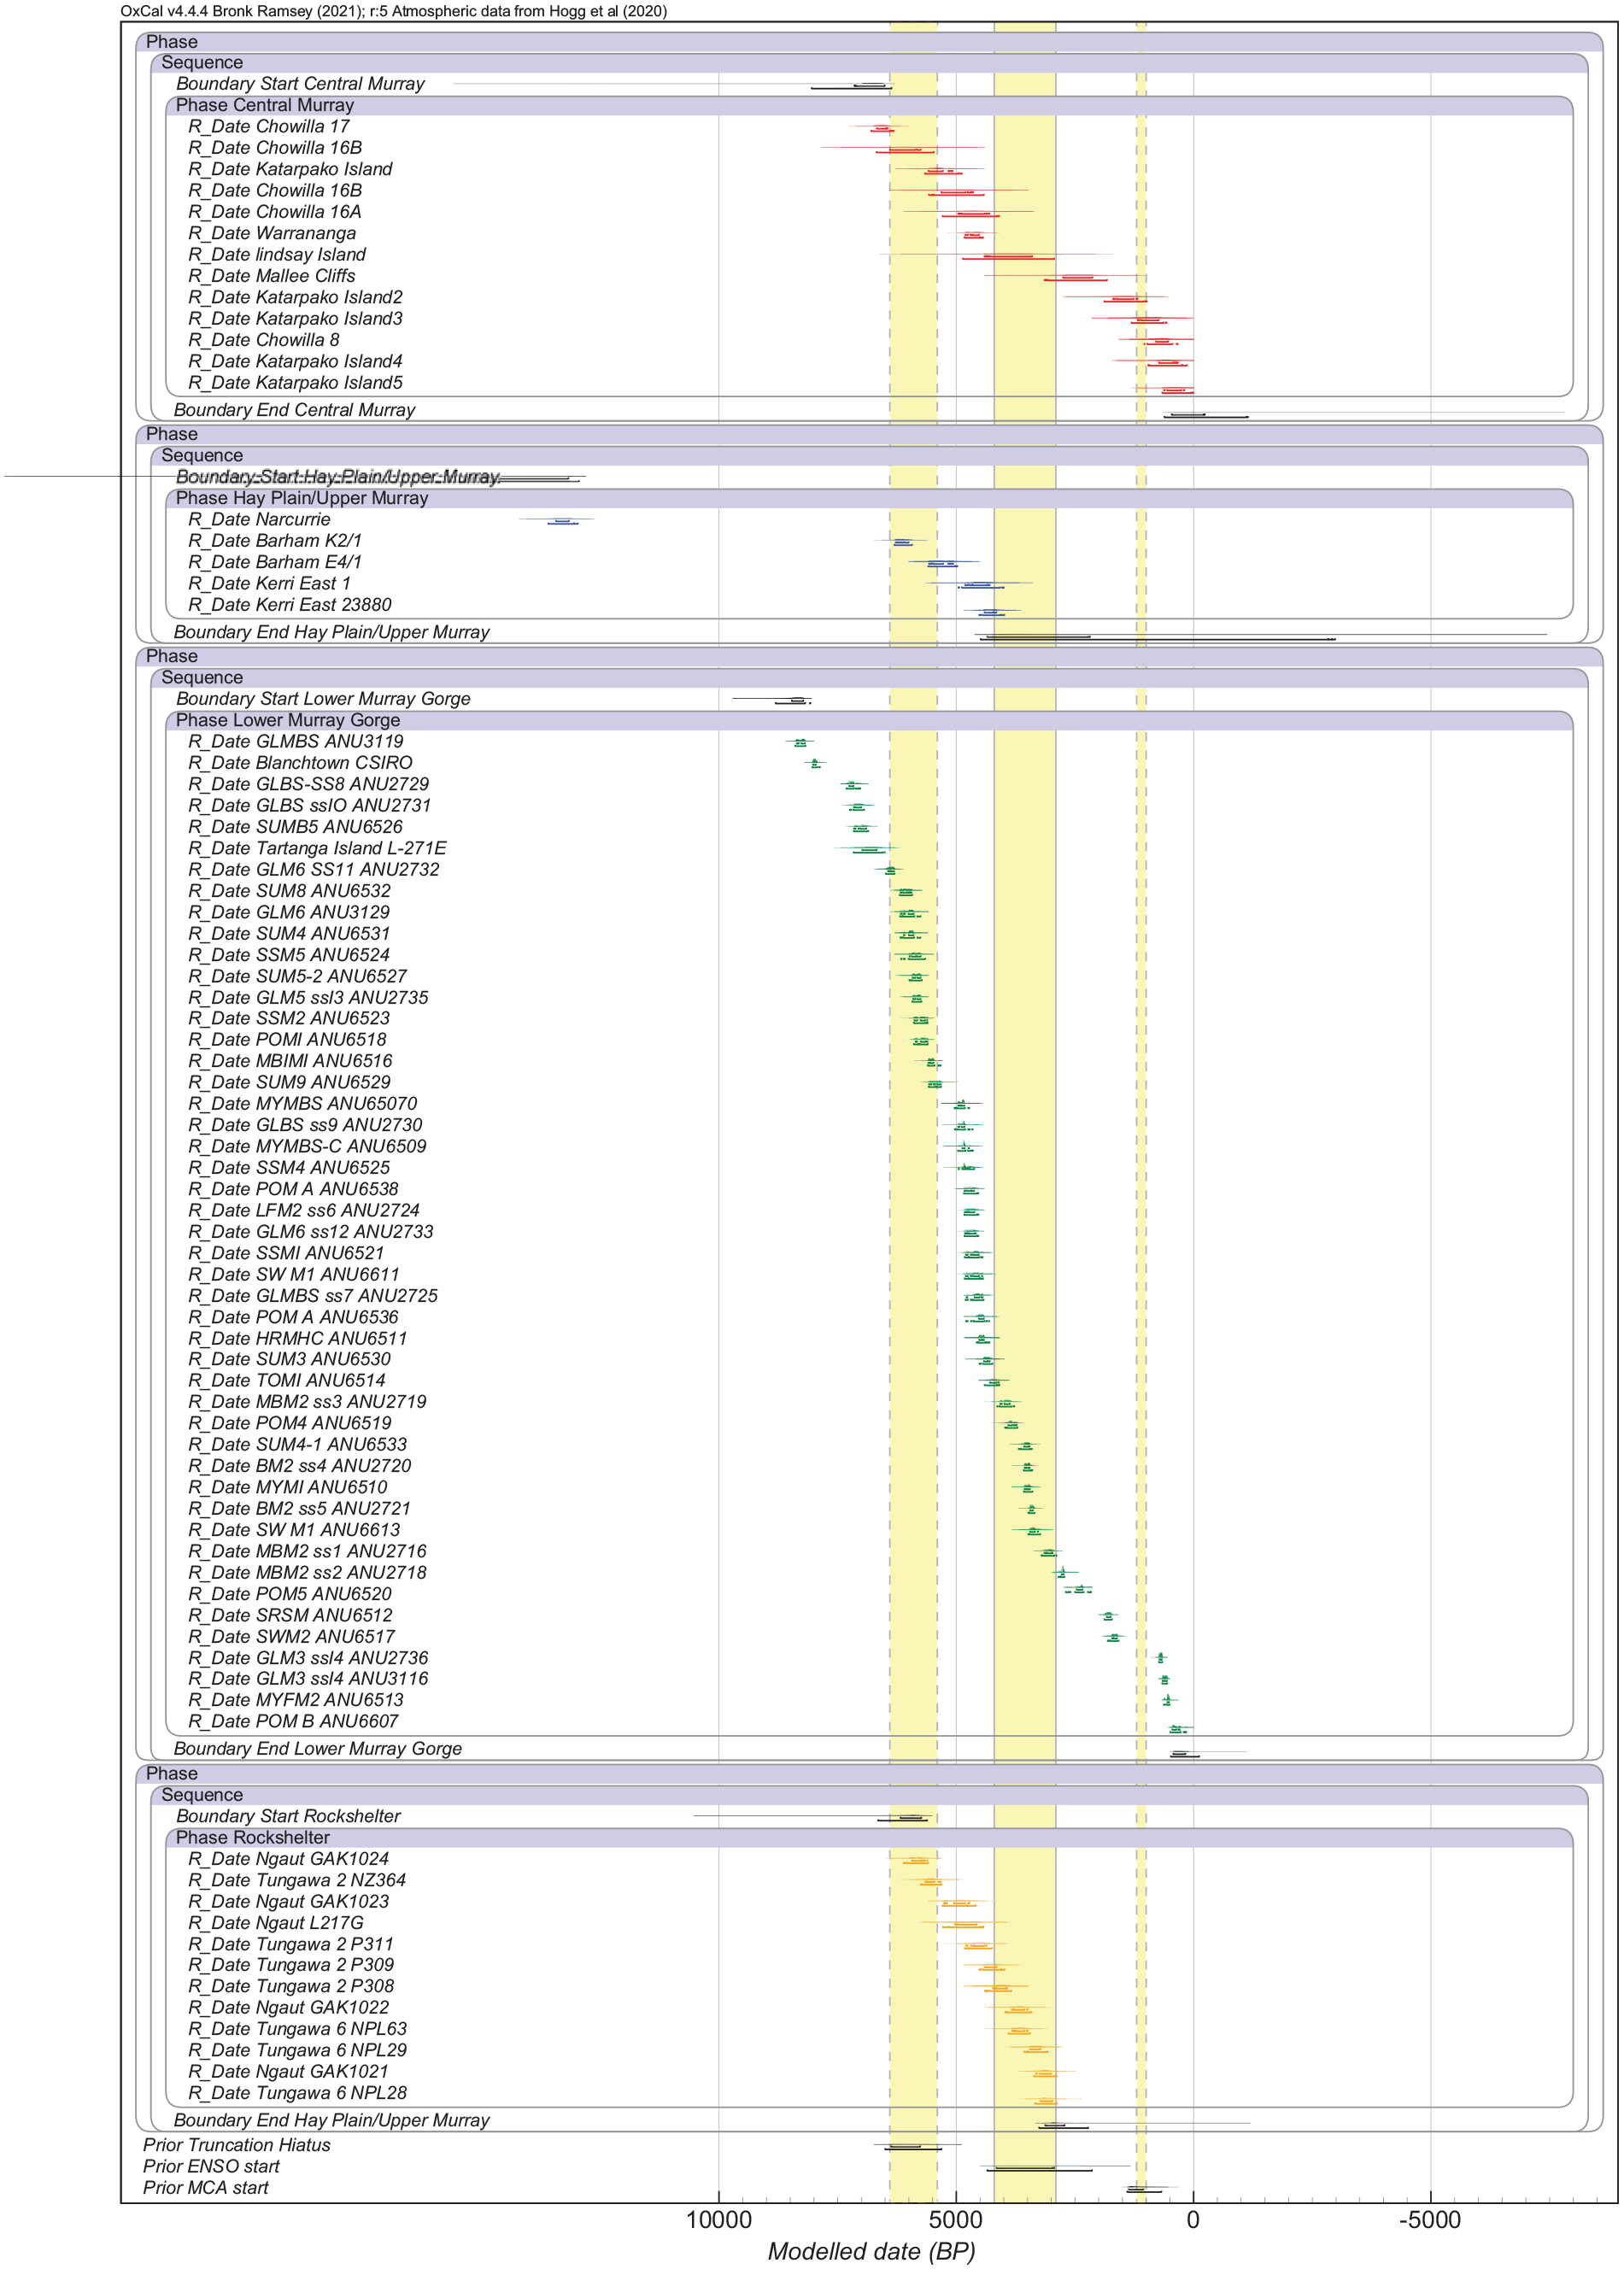
Comparison of regional radiocarbon dates (charcoal and collagen only) from 15,000 cal. BP on. Red distributions: Burials in Central Murray; Blue distributions: Hay Plain Burials (Littleton and Allen, 2007); Green distributions: Lower Murray sites (Broecker et al., 1956; Pate et al., 2011; Wilson et al., 2012); Yellow distributions: Lower Murray rockshelters (Mulvaney, 1960; Mulvaney et al., 1964; Smith, 1982). Modelled hiatuses at Roonka indicated (yellow bars).
The dates from the lower Murray sites are from charcoal rather than mixed materials, and while their distribution does not reflect the gaps observed for Roonka, neither do they demonstrate the full record of events, for example, the upper levels of Ngaut Ngaut and Tungawa 2 and 6 remain undated (Allen et al., 2023). Overall, the radiocarbon distribution suggests that there is no regional pattern of discontinuity but that Roonka needs to be analysed in light of its particular site formation and placement on the Murray River.
The chronology of site use
The resultant burial chronology demonstrates that the greatest number of graves are associated with the middle period of site use (Phase C onwards). However, to comprehensively interpret the data, it is necessary to consider preservation over the entire sequence. By averaging the number of burials over the number of years represented within each phase (Figure 6, Supplemental Data 3), it becomes apparent that initial use of the site for graves is very intermittent, and it is not until Phase B that more regular use commences (average one burial every 19.7 years). Usage based on excavated numbers is higher in Phases C and D, averaging between one burial every 9 and 10 years. Alternatively, if the two phases are combined and less secure graves are included, one burial occurs every 7.7 years. Post-contact burials are smaller in number and were found in different locations across the dune, suggesting that they do not represent a single event. Collectively, these burials took place in a relatively short period of time (Pretty, 1988a) and average one burial every 2.2 years. It is difficult to interpret these given that patterns of movement and mortality were severely disrupted at this time. Causes of death cannot be established from the historic burials and Eyre’s records from the region make it clear people were still camping along the river in 1842 (Eyre, 2010[1845]).
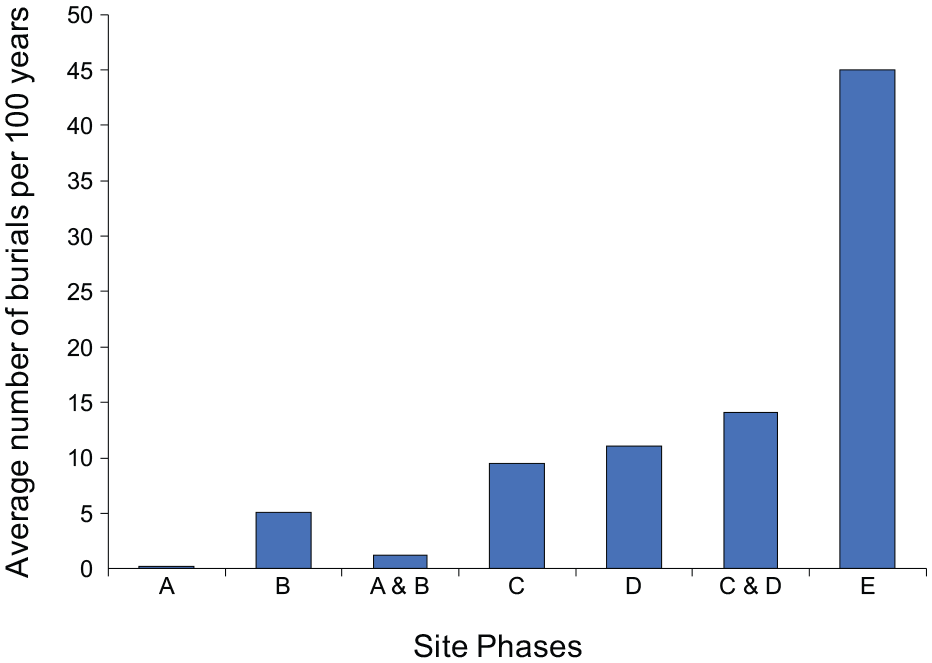
Computed average number of burials per 100 years by phase. Calculated data available in Supplemental Data 3.
Typically, recent burials are better represented since they have been subject to less accumulated fragmentation and dissolution (Bello and Andrews, 2006). To what extent are these differences in site usage the result of poorer preservation of burials? There is a significant difference in the rate of deposition between the post-contact period and that immediately prior, but without any marked geomorphological change. If the difference in the rate of deposition was due to loss, then it can be readily predicted that only 30% of graves have survived from 340 to 150 cal. BP and all graves post 150−130 cal. BP. This difference is extreme and lacks evidential support. Instead, it is more likely that the post-contact burials reflect very different burial circumstances and site use.
There is little difference between burials in phases D and C, with an estimated 14% loss of burials in the earlier period. This degree of loss is reasonable given the time difference and reinforces the similarity in pattern of usage between these two periods.
Phase C to Phase B provides interpretative challenges. The difference in burial numbers could be due entirely to differential preservation, but if so, then 53% of burials in Phase B were lost (along with any that were deposited between 4870−2000 cal. BP (95% probability). This figure is not beyond the realms of possibility given data from elsewhere in Australia (Littleton, 2000) and taphonomic bias and loss in other assemblages (Barrietnos et al., 2007; Surovell and Brantingham, 2007). The difference (ignoring the probability of taphonomic loss) in the level of site usage between Phase B and Phase C would suggest Roonka being used two times more frequently in the later period.
The difference between Phases A and B remains the highest and most complex. If the pattern of usage were the same, this would result in only 4% of Phase A burials being preserved relative to Phase B. This hypothesis would require a much greater level of taphonomic loss which is not supported by the geomorphology or the pattern of preservation.
The analysis indicates, therefore, that the major difference in site usage occurs between Phase A (isolated usage) and Phase B where burials are more regular. It is also postulated that a minor increase in use occurred around 2000 cal. BP, and a change in burial frequency and distribution post-European contact.
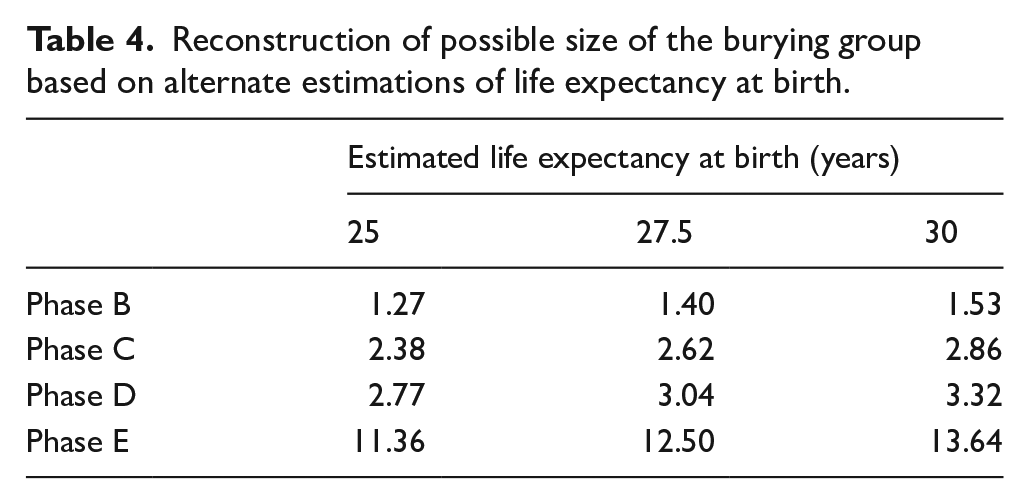
These changes are not simply a reflection of population increase. Drawing from estimates of time per burial and generation length, it is possible to calculate the size of the contributing population. The estimated number of graves, the length of time (per phase here), and estimates of the life expectancy of the burying population:

where P is the average size of the population, D is the total number of dead, e00 is life expectancy at birth (estimated) (Acsádi and Nemeskéri, 1970; Ubelaker, 1989).
The calculations shown in Table 4 emphasise that the burials are more representative of irregular or intermittent use by a small group rather than a single population over a long period of time. Roonka can only have been one of the numerous burial places available to one cohort and was not the single burial place for that cohort.
Reconstruction of possible size of the burying group based on alternate estimations of life expectancy at birth.
Continuity and discontinuity at Roonka
This analysis confirms gaps in the sequence of Roonka (Littleton et al., 2017), contrary to Pretty’s initial chronology proposing a continuous record (Pretty, 1988a, 1988b). The earliest possible gap between Phase A and B is much more likely to be the result of the sparsity of usage rather than a distinct gap in usage. First usage of the site is so sparse it is inevitable that there is an apparent gap in the archaeological remains.
The major discontinuity is the break from ca. 4290−1920 cal. BP (median ages). Palaeoclimatically, this overlaps with the onset of ENSO, which would have resulted in a significantly variable and more arid climate (De Deckker, 2022). Because this gap is taphonomic at Roonka, it is quite possible that there may have been lower-level usage of the site at this time, but there is no evidence to confirm or to reject this possibility because the sediments have been stripped from the dune (Sutcliffe, 1982; Thomson, 1983). Given the lack of any comparable gap in the regional record of lower Murray Valley sites (Wilson et al., 2022), this cannot be taken as evidence for abandonment.
The second gap could be argued to correspond to the Mediaeval Climatic Anomaly, but the evidence is much less clear. This gap is potentially statistical given the small number of dates and burials and/or a loss of sediment. One reason for suspecting the latter is a lag deposit of cultural material (heat retainer, stone artefacts, etc.) within Layer 2. This lag is subsurface, indicating that it is the result of an earlier episode of erosion rather than extensive post-contact erosion. It is also much more likely that repeat cycles of erosion and deposition took place, leading to observable gaps in the record.
These taphonomic disjunctures do not coincide with major changes in the use of the site. They are a function of depositional processes rather than mirroring major cultural or economic change. Recognising these gaps is critical for determining how the site should be analysed. Instead of assuming a direct comparison of earlier versus later phases to a pre-and post-ENSO phase (e.g. Hill et al., 2019), it is vital to realise that the late phase is 2000 years from the onset of major climatic change. Disjunctures are a product of site formation processes, however, this does not imply that the site has been unchanging and monolithic in character.
Persistence and place making
There is very sparse early evidence of site use. Apart from the early possible hearth (23320 cal. BP) and a hearth dating to ca. 10 kya, the first period of site use is for a series of dispersed widely spaced burials (Pretty, 1988a). As argued above, this usage for burial is low density but specialised. The burials represent multistage interments and are a subset of the population, primarily males and children. During this stage of dune building, the river would have been a favourable spot for camping, but there is a distinct lack of association between occupation debris and the burials. This low-level but consistent use implies a form of persistence cemented not by continuous action but by visible signs of burial and knowledge of prior use.
It is during the early to mid-Holocene that usage for burial significantly increases. More people are buried on the site and there is increased inclusivity – women appear, as do individuals of all ages. Burial is more regular, with greater emphasis on placing people together. Given that most burials are primary, this suggests a potential increase in the size of the burying group. It is, however, not a place for everyone all the time. This increasing regularity of use corresponds to more favourable climatic conditions and a stable dune.
The mid-Holocene gap in sediment is potentially associated with longer dry periods and loss of ground cover, but there is no definitive evidence of discontinuity of use at the site. As sediments accumulated again, the burials occurred at a similar or marginally higher rate, there was no difference in the demographic profile, and the spatial distribution of burials remained the same.
The probability of burials does increase in the Late-Holocene, but the magnitude of the difference is not as great as in the early Holocene. Nevertheless, memory and persistence of the site is based on very specific knowledge given the discrete and regular spacing of graves using the same conventions and deliberate massing of graves in particular areas. Specific memories rather than conventions seem to consolidate the site. There is evidence of camping debris, but whether this is due to regular occupation (clear in other parts of the site as scattered middens and ovens) or mourning camps is unclear. Certainly, these remains are not dispersed between graves but sit at a consistent level (a lag deposit on the dune).
The greatest disjunction is with the post-contact burials, which are both more frequent when averaged over time and dispersed along the top of the dune rather than following the clustered and patterned distribution of lower burials.
Throughout this sequence, Roonka is persistent as a place for burial, but persistence should not be construed as necessarily continuous use or sedentism. We argue that early use at Roonka is consistent with a growing sense of this dune as a place for a particular purpose and subset of the local population. The sparsity of use argues for a shared notion of place but also knowledge of the sort of burials and people to be interred there. The increased use and inclusivity through the Holocene mean that persistence could be increasingly predicated upon personal experience, memory, and action (Littleton and Allen, 2007). The rupture of the post-contact period is evident. So, despite Roonka not being used by everyone and not all the time, it was and is a persistent place, but the basis for that persistence changed over time.
Conclusion
This work demonstrates how newer methods can be combined to reanalyse legacy data and challenge reconstructions of Aboriginal burials. It has allowed us to assign burials to identified phases and, in some places, to particular sequences of burial with degrees of certainty (equivalent to analyses of Harris matrices in burials, Penny-Mason, 2017). It has confirmed our initial suspicion that the original site chronology based upon sequential changes in burial practices is only partly accurate. More importantly, we can use this detailed analysis to estimate the minimum and maximum number of individuals buried at the site (Littleton and Middleton, 2019). Roonka is only one of a number of burial places used at one time by Aboriginal people, and while it was used continuously, such use only involved a subset of individuals.
Reconstructions of Aboriginal burials are far more than simple reflections of past population size or distribution. They simply incorporate far too few burials to serve that purpose. However, the persistence of these sites and their associated practices point to how they are simultaneously indicative of the continuity of place and underlying changing traditions and ideas. The result demonstrates a complex and shifting relationship between climate change, site formation and human activity at the site.
Supplemental Material
sj-xlsx-1-hol-10.1177_09596836241254491 – Supplemental material for Continuity and discontinuity at the burial site of Roonka, Murray Gorge, South Australia
Supplemental material, sj-xlsx-1-hol-10.1177_09596836241254491 for Continuity and discontinuity at the burial site of Roonka, Murray Gorge, South Australia by Judith Littleton, Joshua Emmitt, Fiona Petchey, Harry Allen, Keryn Walshe and Sarah Karstens in The Holocene
Footnotes
Acknowledgements
The authors acknowledge the Ngaiwang, the Traditional Owners of Roonka, and the Ngaiwait, Nganguruku, Ngingtait, Erawirung, Ngaralte and Ngarkat. This work is undertaken in collaboration with and the permission of the River Peoples of the Murray and Mallee Aboriginal Corporation.
Author contributions
Funding
The author(s) disclosed receipt of the following financial support for the research, authorship, and/or publication of this article: It is funded by the Royal Society of New Zealand Marsden Fund (14-UOA-19) and the Faculty of Arts Research Fund, University of Auckland. It is undertaken with clearance from the UAHPEC committee, University of Auckland (010311). The authors wish to thank Seline McNamee for her preparation of figures for this paper, and the reviewers for their productive suggestions in revising this manuscript and extending this work.
Supplemental material
Supplemental material for this article is available online.
Notes
References
Supplementary Material
Please find the following supplemental material available below.
For Open Access articles published under a Creative Commons License, all supplemental material carries the same license as the article it is associated with.
For non-Open Access articles published, all supplemental material carries a non-exclusive license, and permission requests for re-use of supplemental material or any part of supplemental material shall be sent directly to the copyright owner as specified in the copyright notice associated with the article.