
Abstract
Changing climatic conditions is a perpetual circumstance for mankind. In this study, we investigate local environmental and climatic changes near Kangerlussuaq, west Greenland. Our reconstruction is based on a lake sediment core and methods include chemical proxies and a palynological analysis. The investigated site is located 15 km from the Aasivissuit Inuit summer hunting ground, which has been in use for caribou hunting for more than 2000 years. The presented climatic reconstruction covers the time from c. 560 CE to present time. We identify three distinct periods of climate regimes: From c. 560–1100 CE conditions were stable, warm and humid, and summer temperatures were 1.5–2°C warmer than today. 1100–1600 was a period of cooler and very arid conditions with more sea ice, corresponding to the Neoglacial cooling. In this period, we detect two wildfire events and subsequent temporary caribou abandonment of the area. From 1600 to present we find increasingly warmer conditions with more precipitation and less extensive sea ice cover, gradually approaching today’s climate regime in Kangerlussuaq. We review the existing literature regarding the Aasivissuit summer hunting ground, which was first used concurrently with the detected cooling. Despite climatic deterioration, the hunting ground was regularly in use throughout the Neoglacial and onwards, with peak hunting intensity in the early 1700s. The detected wildfires and reindeer abandonment are interpreted to be localized events at the coring site and did not affect the hunting ground. Our findings highlight the resilience of the Inuit hunters to climatic changes as well as the advantages and limitations of local environmental reconstructions.
Keywords
Introduction
Ever changing climatic and environmental conditions have set the scene for human activity throughout the history of mankind. In the Arctic, even subtle changes can have a profound impact on patterns of foraging and migration. A good example are the Inuit people of the Dorset and Thule cultures in Greenland, whose environmentally determined annual cycle is highly vulnerable to external influences and forcing. Both cultures were nomadic hunter-gatherers, living in coastal areas and hunting on the sea-ice during winters, while they migrated inland for game hunting in the summer. The Aasivissuit summer camp (Figure 1) of the Inuit Dorset and Thule cultures is a seasonally used caribou hunting ground, with its earliest record dating as far back as 200 BCE. Following a hiatus from 100 BCE to 1200 CE, the place has been in use almost continuously up to the beginning of the 20th century (Grønnow et al., 1983). The larger area of Kangerlussuaq, in which the archaeological site is embedded, has been studied thoroughly and is well-described in terms of ice sheet fluctuations, lake chemistry, environmental, and climatic changes (Anderson and Leng, 2004; Bennike et al., 2010; D’Andrea et al., 2011; Eisner et al., 1995; Forman et al., 2007; Kopec et al., 2014; Law et al., 2015; Lesnek et al., 2020; Levy et al., 2012; Olsen et al., 2013). Most of these studies have timescales encompassing the entire Holocene or focus on contemporary observations. Hence, there are currently no studies concerned with climatic and environmental changes in Kangerlussuaq that concentrate on the last two millennia – the time of archaeologically proven human activity in the area. The previous work forms a profound understanding of the local environment, limnological dynamics and interplay with larger-scale climate fluctuations, which is fundamental for providing a high-resolution reconstruction of paleoclimate and paleoenvironment covering the time of human activity in Kangerlussuaq area. In this study, we reconstruct past climatic and environmental changes based on multiproxy data from a lake sediment core and further relate changes to the evidence of human activity in the area. Our methods include geochemical proxies, pollen, non-pollen palynomorphs, and charcoal. Our investigations are based on sediment from a lake located approximately 15 km from the Aasivissuit summer camp to avoid direct contamination from human activity. As the geographical setting and vegetation are comparable between Aasivissuit and the investigated lake, the recorded climatic and environmental changes are assumed to be representative of both areas.
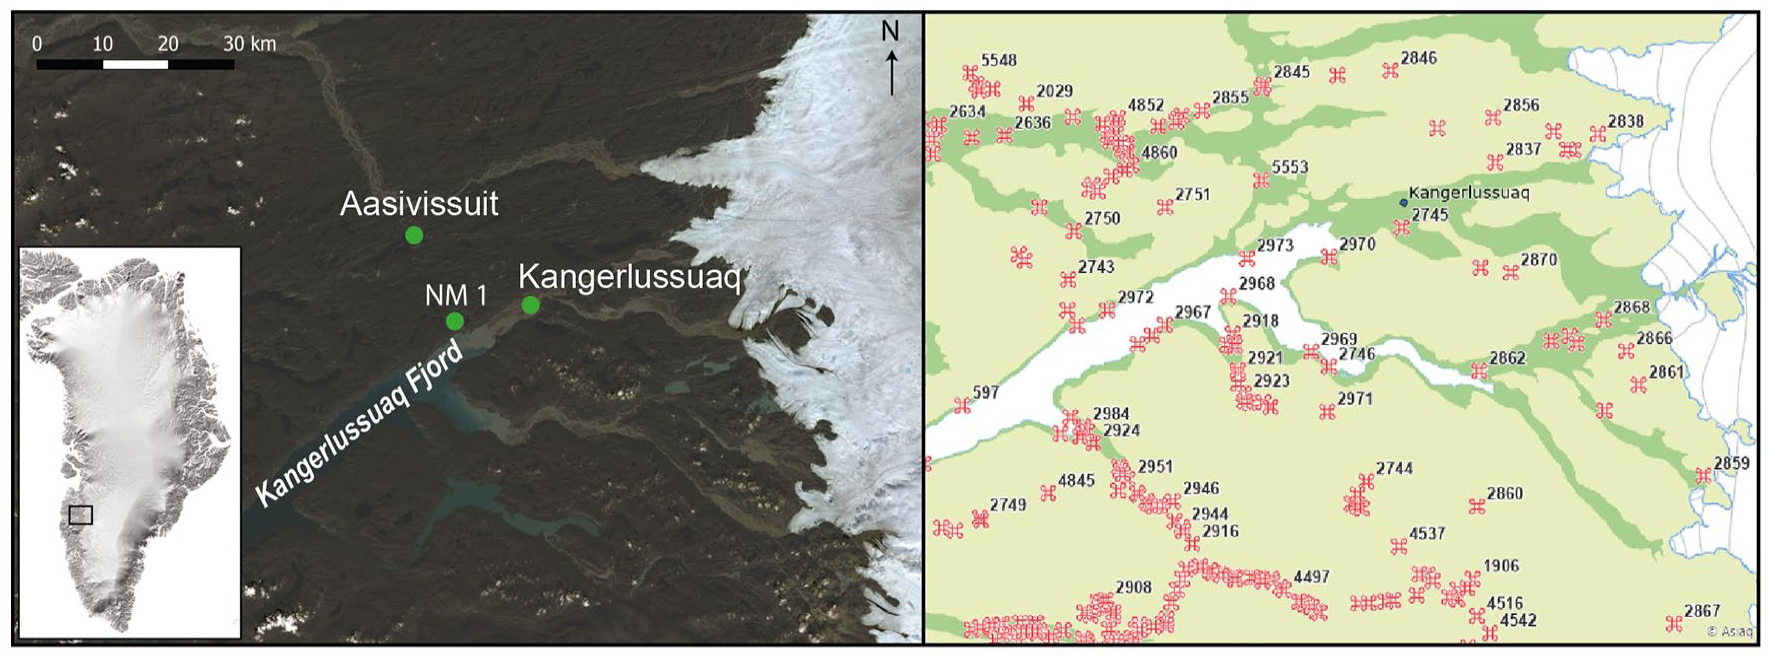
(a) Locations of lake NM1 and the Aasivissuit hunting ground at the head of Kangerlussuaq Fjord in west Greenland. Landsat-9 image courtesy of the U.S. Geological Survey. (b) Map showing the abundance of archaeological findings around Kangerlussuaq. Cultures shown here include Greenlandic Dorset, Paleo Eskimo, Late Paleo Eskimo, Saqqaq, Thule, Colonial, and recent. Numbers refer to identification codes which can be found at https://da.nka.gl/. Map courtesy of Asiaq.
Geographical setting
Kangerlussuaq Fjord is located in southwest Greenland and stretches 180 km from its mouth in the Davis Strait to its head 25 km west of the margin of the Greenland Ice Sheet (Figure 1). The stretch of the fjord represents a strong climate gradient from wet, windy, and cool maritime climate conditions at the coast, to a dry and stable, subarctic continental climate at the fjord head. Temperatures in Kangerlussuaq at the fjord head range between −10 and −20°C in winter months and 5–18°C during the summer (30-year average, 1991–2020, (DMI, 2023)). Mean annual precipitation is 158.5 mm a−1 (1949–2003) and annual evapotranspiration has been calculated to 300 mm a−1, primarily occurring during the summer months (Hasholt and Søgaard, 1978) (Figure 2). Sea ice currently covers the fjord from mid-November through May (Lund-Hansen et al., 2018). The Greenland Ice Sheet retreated from Kangerlussuaq at 5.3 ka BCE (Van Tatenhove et al., 1996). Since the ice margin retreat, the area has been subject to glacial isostatic uplift of 100 m, approaching the present sea level at c. 4000 BP (Lecavalier et al., 2014). The landscape consists of numerous lakes dispersed between rounded and ice scoured hills with scattered Late Quaternary deposits of glacial, marine, fluvial, and aeolian origin. Bedrock consists of Archean gneisses (Henriksen, 2005). The vegetation is very homogenous, dominated by different Poaceae (grasses) and minor patches of Salix glauca (greyleaf willow) and Betula nana (dwarf birch), reflecting arctic tundra vegetation patterns of the wider region. The edges of the littoral zone are presently colonized by different species of Potamogeton (pondweed) and the shoreline features a narrow belt of Menyanthes trifoliata (bog bean). As the growth position of these plants are depth-dependent their distribution can reveal seasonal lake level lowering.
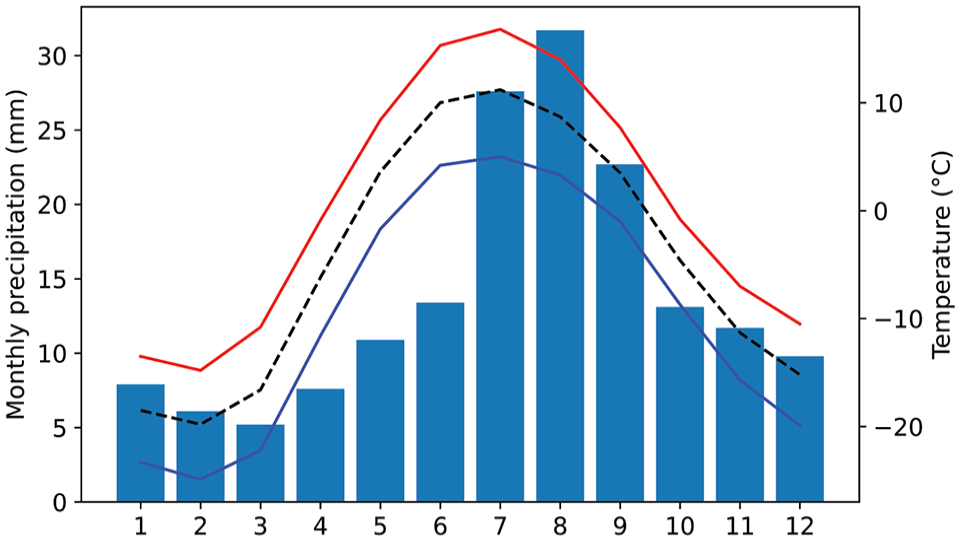
Precipitation (left) and temperatures (right) showing the monthly climatological normal for Kangerlussuaq 1991–2020 (DMI, 2023). Stippled line shows the monthly average temperature while blue and red lines are the averages of the monthly minimum and maximum temperatures, respectively. Bars show the average sum of monthly precipitation.
Human activity through millennia
The large ice-free tracts in central west Greenland are the most prominent areas of traditional caribou hunting in Greenland. In older times many families left their coastal winter settlements and ventured inland to hunt caribou for several months during the warm season. Caribou is the principal resource of the interior, and in periods with numerous caribou, Inuit gathered in large communal hunting camps, where hunting drive systems, shooting blinds other stone-built infrastructure was set up to enhance the hunt. Kayaks were carried to the lakes as a means of transport but also to be used to hunt swimming caribou where topographical bottlenecks forced the migrating caribou into lakes (Grønnow et al., 1983).
The Aasivissuit camp is a such a large communal hunting camp. The surplus caribou meat was dried and transported back to the coast for winter storage or it could be stored in cashes for later retrieval by dog sledge. The caribou furthermore supplied raw materials such as antler and bone for the manufacture of tools and household utensils as well as skins for clothing. These products entered the traditional Inuit bartering system as goods exchanged for desired products from other regions such as soap stone from the south and in exchange for European goods when whalers and traders began frequenting the coasts in the 17th century.
The interior region is accordingly dotted with smaller and some larger human settlements, way finder cairns, graves, rock shelters, fox traps, cashes, and other traces of human presence throughout millennia (Pasda, 2004).
The Aasivissuit site north of Kangerlussuaq stands out as a well investigated and spectacular settlement, showing reoccurring seasonal use throughout millennia. Relatively few other nearby settlements have been investigated although several are known. The earliest absolute dating of human use of the interior area in focus of this study is 1280–1340 BCE from a Saqqaq hearth, but centuries older settlements can be anticipated since Greenland’s oldest anthropogenic dating of 1970–2150 BCE, have been made on charcoal from a Saqqaq settlement on the coast a few kilometers to the south of westernmost Aasivissuit-Nipisat (Kramer, 1996).
The caribou hunting site of Aasivissuit is spectacular for its many dwelling remains, large hunting systems and well-preserved stratified midden dating back more than 2000 years. The well-preserved refuse layers form an up to 1 m thick stratified midden with dense bone beds alternating between layers with silt and sparser faunal remains. The deepest midden deposits with lithic artefacts of Dorset origin have been radiocarbon dated to 205 ± 75 BCE (Grønnow et al., 1983).
The overlying layers of Thule origin have been dated to 1220 ± 70 CE (Grønnow et al., 1983) and an additional dating of this stratum from 2022 has dated the early Thule presence at Aasivissuit to 1125 ± 30 CE (Jensen et al., 2022) which is relatively early when considering that Norse farmers still lived in Nuuk Fjord 300 km beeline further south. From this point in time and onwards the Aasivissuit site was in regular seasonal use as a focal point for hunting caribou. Variations in the deposition of caribou bone and antler demonstrate heavy variations in intensity of site use. The excavated section shows that periods with the accumulation of dense bone beds alternated with periods of vegetation regrowth and deposition of silt with only a few deposited bones, indicating less human activity at the site. The early 18th century and mid 19th century CE are characterized as periods of especially intensive site use, seen from dense accumulation of bones. These layers most likely result from large scale communal hunts during periods of maximum caribou population, whereas strata with more scattered faunal materials stem from visits by smaller hunting parties. The archaeological dating of the dense bone heaps overlaps with periods of peak caribou populations deduced from hunting statistics and historical records (Grønnow et al., 1983; Meldgaard, 1986), showing that the early 18th century and mid-19th century were periods of peak caribou populations inviting for mass hunts.
The continuous seasonal use of Aasivissuit and the surrounding interior all the way to the ice sheet is documented in historical accounts (Müller, 1906) and in contemporary oral tradition. However, beyond detailed recordings of the stratigraphy at Aasivissuit and the oscillations recorded in hunting statistics and trade lists, there is little evidence for chronological and geographical variations in the use of the interior.
Previous work
Holocene-scale climate changes in Kangerlussuaq have been investigated in previous studies using lake sediments (Aebly and Fritz, 2009; Anderson and Leng, 2004; Bennike et al., 2010; D’Andrea et al., 2011; Law et al., 2015; Olsen et al., 2012, 2013). However, the existing data covering the last 2000 years is sparse. The Kanger Stack (D’Andrea et al., 2011) is a local paleo-temperature curve from Kangerlussuaq, based on alkenones in lake sediment, which encompasses the Holocene and includes the common era. The Kanger Stack reflects lake temperature and shows an abrupt cooling event at c. 0 CE, where average summer lake water temperatures decreased 2–3°C simultaneously with a large Neoglacial advance in the area (Forman et al., 2007). The temperature rose slowly from 650 CE and peaked at 1100 CE, demonstrating that the Medieval Warm Period (MWP) was affecting the area (D’Andrea et al., 2011). A sudden temperature decline occurred after 1100 CE and temperatures remained cool until the end of the record in the 19th century (D’Andrea et al., 2011). Aebly and Fritz (2009) provide a reconstruction of summer temperature and precipitation in Kangerlussuaq, which is modeled based on measurements of paleo-shoreline terraces and constrained with the GRIP borehole temperature curve (Dahl-Jensen et al., 1998). Aebly and Fritz (2009) find that the period from c. 500 BCE to 1250 CE was characterized by monthly summer temperatures 1°C warmer than today and a mean annual rainfall of +40 mm a−1 relative to today, while the summer was estimated to be 5 days longer. The period from c. 1250 CE to the present is described as the windiest and driest time in the Kangerlussaq record, with mean annual precipitation 20 mm a−1 lower than today and temperatures similar to present (Aebly and Fritz, 2009; Willemse, 2002). The temperature fluctuations recorded by the Kanger Stack is in general concordance with the GRIP and Dye3 temperature records (Dahl-Jensen et al., 1998). However, the local record is able to capture larger amplitude in fluctuations, which is most likely due to the geographical location of Kangerlussuaq, where changes in ocean temperatures and wind patterns have a strong effect on the local temperature gradient. These local variations are not captured by ice core temperature reconstructions, which primarily reflect super-regional changes in the northern hemisphere (Dahl-Jensen et al., 1998).
Lakes as climate archives
Lakes are excellent local archives of changes in local climate and environment, as the deposited sediment records changes in the catchment that are ultimately governed by climate, such as types and abundance of surrounding vegetation, local hydrology, characteristics of erosional input, in-lake chemistry, primary productivity, and atmospheric changes (Anderson and Leng, 2004; Lasher et al., 2017, 2020; Olsen et al., 2012a; Thomas et al., 2020). The abundance of specific elements and elemental ratios are commonly used as proxies for environmental alterations in the catchment, which can be climate-driven. Typically applied environmental proxies in arctic lakes are elemental counts and ratios of Ti, Si, S, Ca, and Cl (Bjørk et al., 2018; Larsen et al., 2017; Olsen et al., 2012). Ti and Si are mainly derived from clastic erosional products, and changes in Ti and Si content therefore reflects changes in catchment erosion and/or aeolian transport (Davies et al., 2015). S is a primary constituent of organic matter and is delivered to the lake through catchment erosion of terrestrial vegetation, autochthonous aquatic vegetation, and from soil organic matter via soil leaching (Olsen et al., 2013). Variations in S/Ti ratio thus indicates excess or restricted S which is not due to erosion, but because of changes in either vegetation or groundwater movement. The ratio of Ca/Ti reflects an increase or decrease in carbonates derived from sources other than catchment erosion, which in this environment is autochthonous primary production (Olsen et al., 2013) – which is in turn controlled by climate and nutrient supply. Abundancy of Cl in ice cores has previously been used to reflect sea ice cover, as Cl is mobilized as an aerosol via sea spray, but the mobilization is hindered when fjords or coastal waters are frozen for an extended time of the year (Abram et al., 2013; Mayewski et al., 1994).
Methods
Site description and sample collection
We extracted a sediment core (NM1-BH2) from lake NM1 (66.98347 N, 50.975903 W; 230 m a.s.l.), which is a small, roughly circular lake with a diameter of c. 60 m. The lake has a maximum depth of 4.2 m. The lake receives water from surface runoff and is drained by a small creek. During sampling in August 2019, we observed subaerial exposed aquatic plants indicating a recent water level fall due to excess evaporation (Figure 3). The extracted sediment core is 33.5 cm long and consists of dark brown, organic-rich gyttja. We measured the lake bathymetry prior to coring with a Chirp © Sonar and proceeded to collect sediment cores in the deepest part of the lake. Cores were extracted from a floating coring platform using a gravity corer (Renberg, 1991). Immediately after extraction, cores were sub-sampled into slices of 0.5 cm (uppermost 10 cm) and 0.25 cm (10 cm to bottom) that were stored in air-tight sample bags. Samples were stored frozen prior to analysis with the exception of samples submitted for 14C dating.
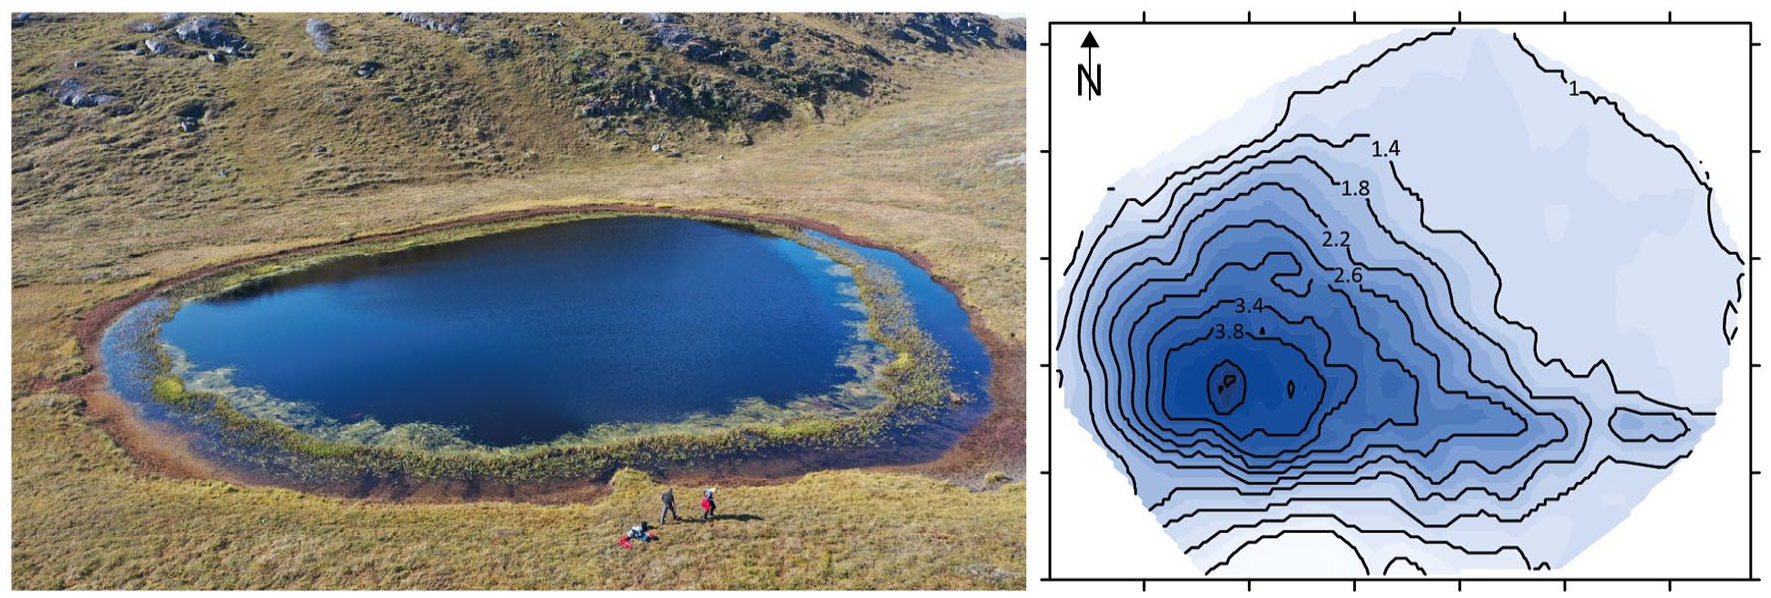
Aerial view of the lake with visibly lowered lake level and shallow-water plants growing along the edge (looking west, persons for scale). The photograph was taken in August 2019. Bathymetry map of the lake with depth in m. The sediment core was extracted from the deepest spot in the lake.
Radiocarbon dating
We searched the core for terrestrial plant macrofossils that were picked out, species determined, and rinsed with deionized (DI) water before being dried at 40°C. Samples were then pretreated with an acid-base-acid pretreatment, following the procedure of Brock et al. (2010), and subsequently graphitized and measured. Sample pretreatment and dating of all samples was carried out at Aarhus AMS Centre (AARAMS), Aarhus University (Olsen et al., 2017). Results are calibrated using OxCal v4.4.4 with the IntCal20 calibration curve (Reimer et al., 2020) and the calculation of a depositional sequence (Ramsey, 2008; Ramsey and Lee, 2013).
210Pb dating
The samples were analyzed for the activity of 210Pb, 226Ra, and 137Cs via gamma spectrometry at the Gamma Dating Center, Institute of Geography, University of Copenhagen. The measurements were carried out on a Canberra ultralow-background Ge well-detector. 210Pb was measured via its gamma-peak at 46.5 keV, 226Ra via the granddaughter 214Pb (peaks at 295 and 352 keV) and 137Cs via its peak at 661 keV.
Pollen analysis
Pollen sample preparation was conducted according to standard techniques including the addition of Lycopodium spore tablets (Erdman, 1960; Stockmarr, 1971) to enable the calculation of microfossil concentrations and influx values/pollen and particle accumulation rates. Pollen identification and nomenclature follows (Beug, 1961) while also regularly occurring non-pollen palynomorphs (NPPs) were recorded following (Van Geel, 1978; Van Geel et al., 1984). Charcoal identification was made based on morphological characteristics such as sharp breaking edges (including a halo effect at phase contrast setting around these), angular, opaque usually planar and often asymmetric shape and a deep black color (Krüger, 2020; Krüger et al., 2017; Patterson et al., 1987; Tipping, 1996). Charcoal particles have individually been subject to control with a neodymium magnet during the counting process following Krüger et al. (2023) to exclude the possibility of falsely recording detrital biotite. For the recording of palynomorphs and visualization of the results we used the CountPol software by I. Feeser (Kiel University).
Sedimentological analyses
We analyzed the sedimentological variation and elemental composition with x-ray fluorescence (XRF) scan and loss-on-ignition (LOI) measurement. The XRF scan was performed on discrete samples of 4 g (wet sediment mass) that were freeze-dried and gently pulverized prior to analysis. Measurements were carried out with a Bruker S2 PUMA XRF analyzer at Globe Institute, Copenhagen University at ranges of 20, 40, and 50 kV, with currents of 1000, 1250, and 2000 µA, and for measurement times of 200, 100, and 10 s, respectively. The LOI was determined at 550 and 950°C using a thermo-gravimetric analyzer (ELTRA TGA Thermostep) at the Palynological laboratory, Institute for Pre- and Protohistoric Archaeology at Kiel University. Samples of 1 g of sediment were proceeded following Heiri et al. (2001). In addition, further sediment samples were examined for larger pieces of charcoal (>350 μm). Here, samples of 2–3 g sediment were taken in intervals of 0.5 cm across the sequence. The sediment was filtered through a 350 μm sieve using H2O. The extracted material was treated with 39% H2O2 (hydrogen peroxide) for 24 h to bleach organic materials, following Rhodes (1998).
Results and interpretation
Age model
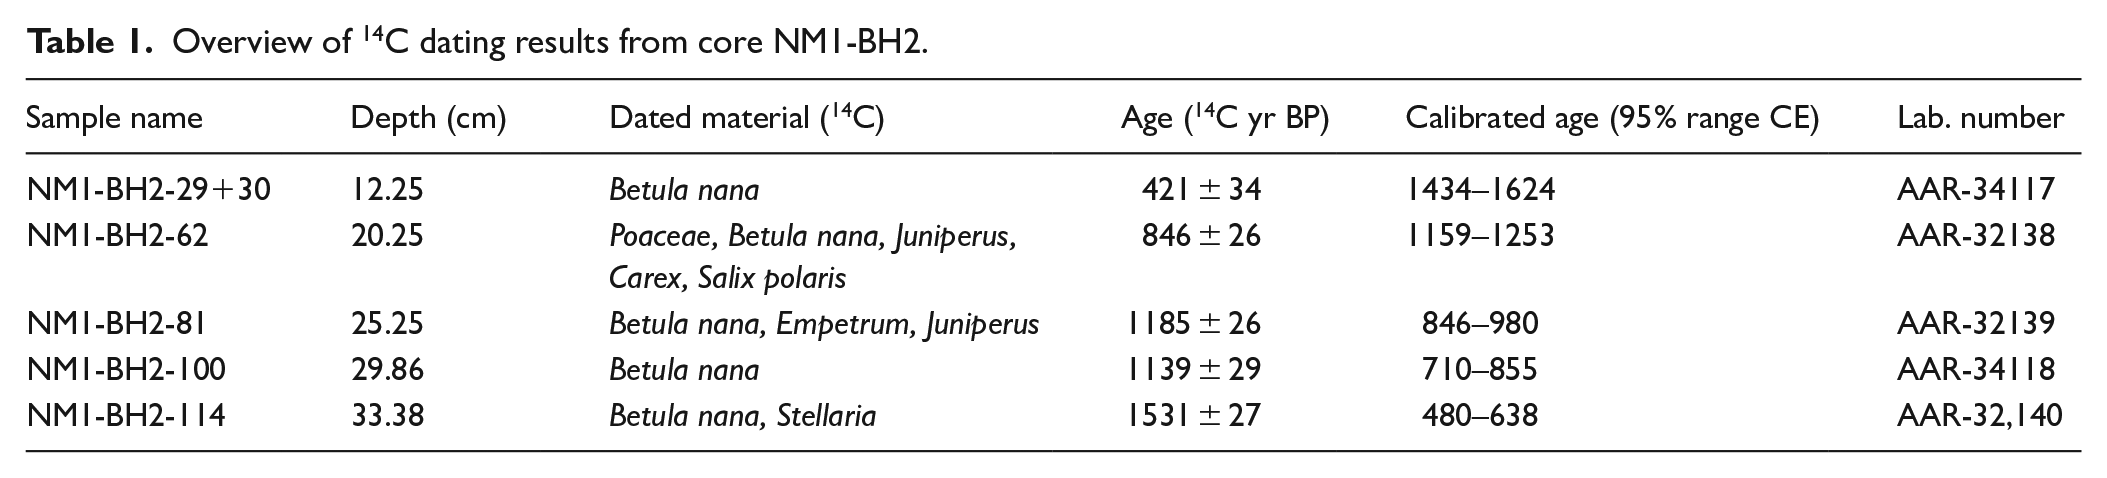
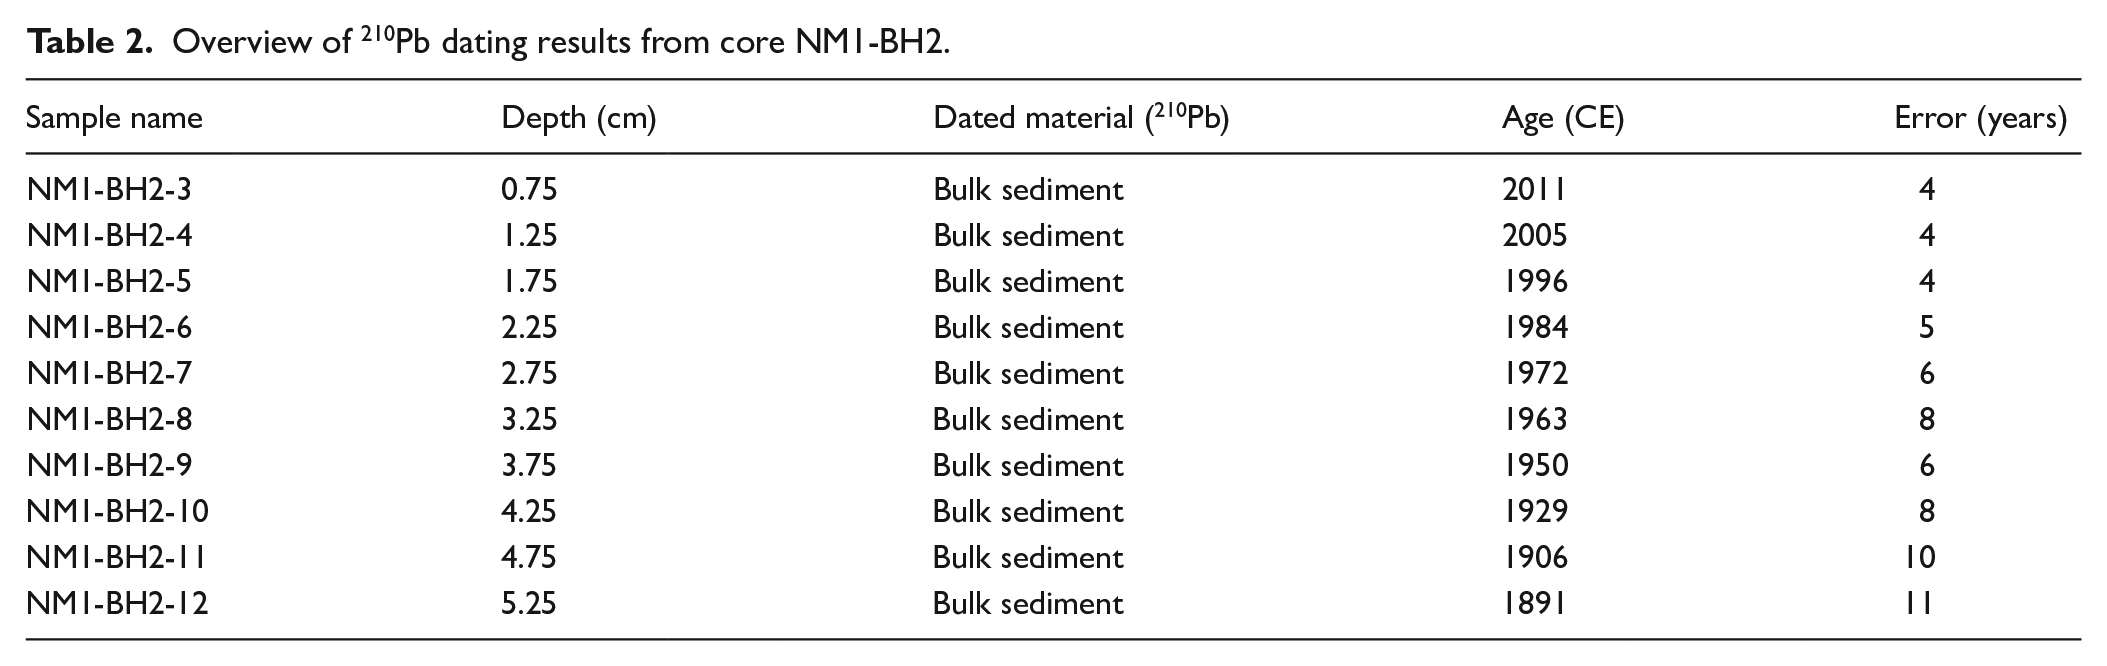
We established an age-depth model (Figure 4) of core NM1-BH2 based on five radiocarbon dates (Table 1) together with a series of 210Pb measurements of the top 5 cm (Table 2). All 14C-dated material were subfossil terrestrial plant remains (species are declared in Table 1). The sediment core showed surface contents of unsupported 210Pb of around 280 Bq kg−1 with a clear tendency for exponential decrease with depth (Supplemental Figure S1). The calculated flux of unsupported 210Pb is only 35 Bq m-2year−1 which is only about half the expected flux (based on data shown in Appleby, 2001). This may be caused by low rainfall in the region. The content of the isotopes 137Cs and 241Am showed a distinct peak at a depth of 3.25 cm. CRS-modelling has been applied on the profile using a modified method (Andersen, 2017; Appleby, 2001) where the activity below 7 cm is calculated on the basis of the regression shown in Supplemental Figure S2. This initial chronology places the peak in 137Cs and 241Am in 1954 which is reasonably close to the expected year of 1963. An adjusted chronology has therefore been calculated in which the depth 3.25 cm was set to 1963, following the procedure described in Appleby (2001). The exponential decline in unsupported 210Pb and the distinct peak in 137Cs and 241Am gives confidence in the chronology and it is therefore considered to be reliable.
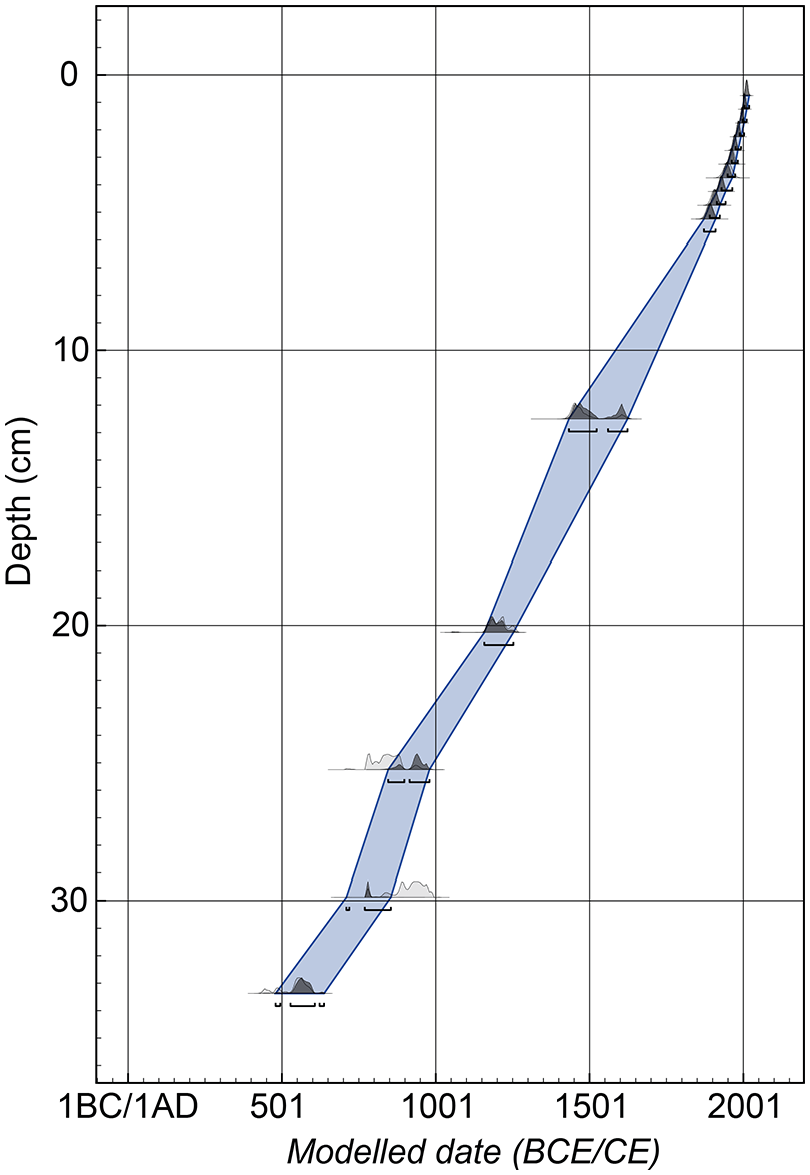
Age-depth model based on five 14C dates and the 210Pb series (uppermost 5.25 cm).
Overview of 14C dating results from core NM1-BH2.
Overview of 210Pb dating results from core NM1-BH2.
Pollen analysis
Pollen data from the NM1 core was arranged in seven pollen assemblage zones (PAZ) after constrained cluster analysis in R (version 4.2.2, package: rioja, vegan). The resulting pollen diagram is plotted on age and is found in Figure 5.
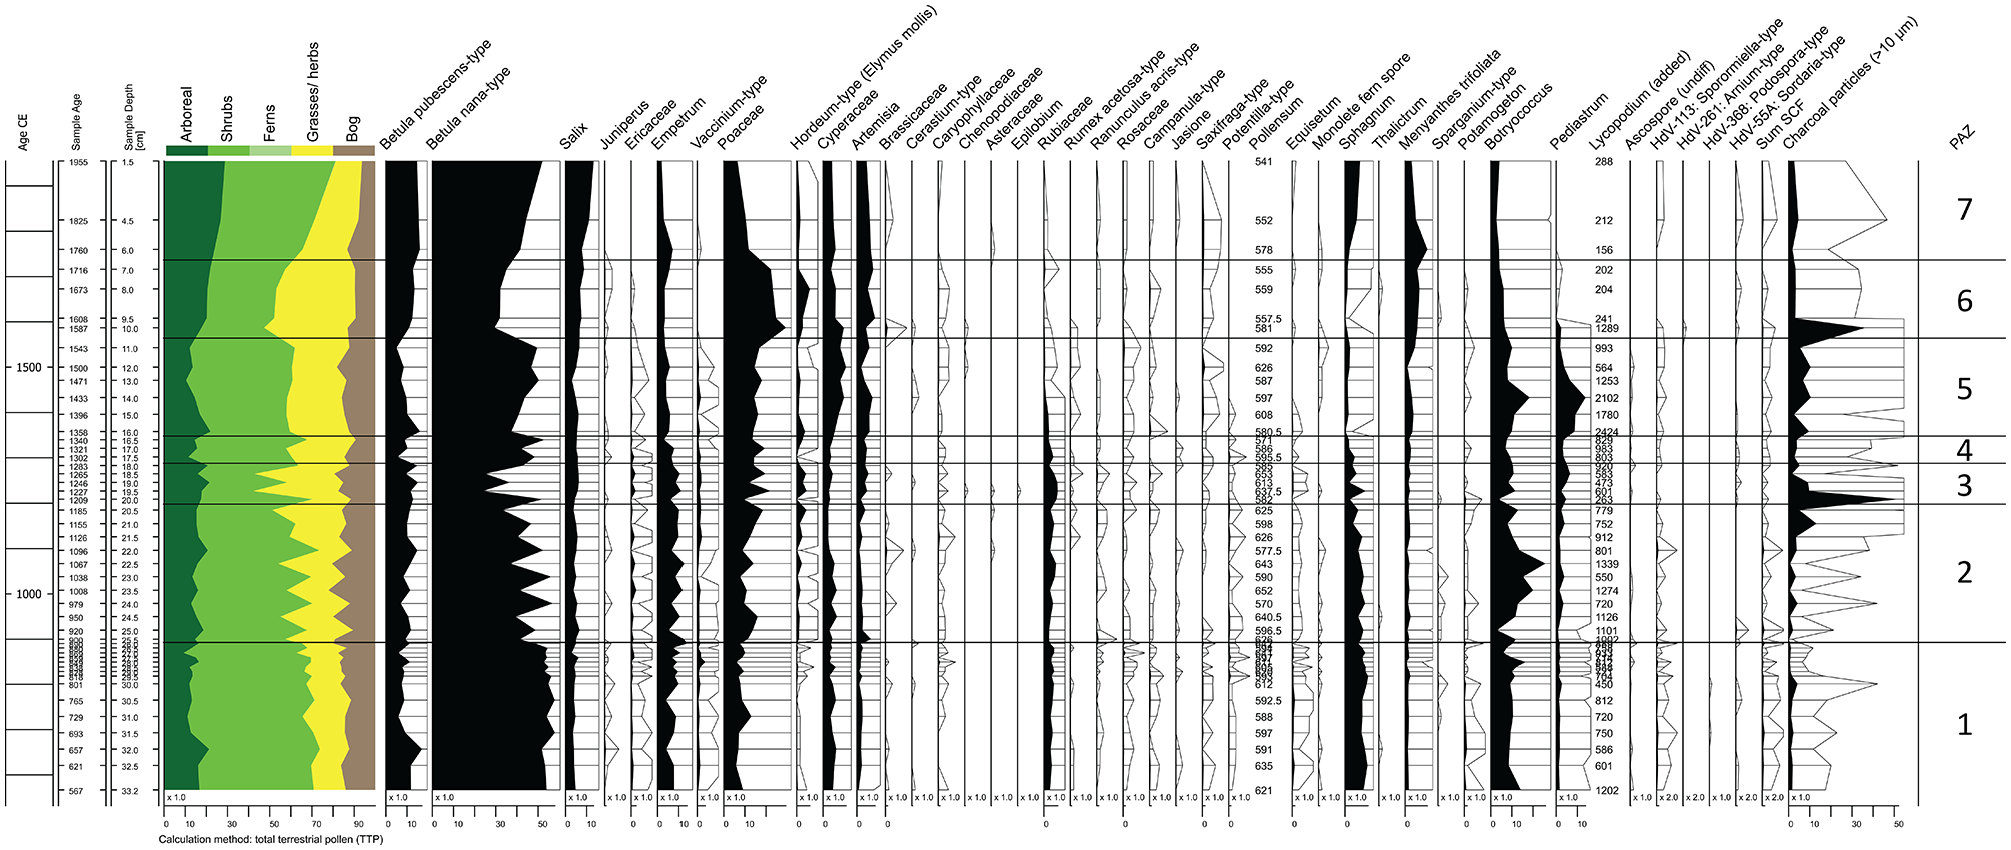
Pollen diagram. Simplified pollen diagram calculated on TTP displaying the most indicative pollen types. The colored composite column to the left shows changes in relative abundance of different plant categories.
PAZ 1
(567–893 CE)
Betula nana-type (dwarf birch) pollen dominate the overall spectrum of this zone with >50% of the total terrestrial pollen, but also Betula pubescens-type (downy birch) pollen, Salix (willow), Empetrum (crowberry), Artemisia (mugwort) and Poaceae (grasses) are important pollen contributors. The spectrum of this zone comprises a closed curve of Juniperus (juniper) and further also a low variety of herbs, including Campanulaceae (cf C. rotundifolia/ harebell). This composition indicates a sporadic distribution of the vegetation including open areas for very low-growing heliophilous species, and furthermore reflects a nutrient poor tundra community. The wetland vegetation around the lake featured Cyperaceae (sedges) and Sphagnum mosses in higher quantities while Menyanthes trifoliata (bog bean) and Sparganium (bur-reed) flourished in the shallow waters of the lake shore, suggesting that summer temperatures were slightly (1.5–2° ) warmer than today’s, with a mean July temperature of 12°C (Bos, 1998). Continuous values of spores of coprophilous fungi (SCF; especially HdV-113/Sporormiella) reflect the presence of large herbivores, most probably caribou (Davies et al., 2022; Raper and Bush, 2009; Räsänen et al., 2007). It is noteworthy that pollen values of the individual types are characterized by consistency throughout the zone. This alludes to very stable environmental conditions.
PAZ 2
(893–1198 CE)
Betula nana-type pollen concentration strongly and suddenly decline. In the pollen percentage diagram this results in a calculated increase in mainly Poaceae and only slowly decreasing but strongly fluctuating values of Betula nana-type pollen. Synchronously, Artemisia – a very drought tolerant genus – increases. A plausible explanation is that dryness suppresses the pollen production of Betula nana, and at the same time causes a propagation of drought-resistant species like Artemisia and some Poaceae. This is further supported by the continuous increase in Hordeum-type pollen in this zone. This pollen type comprises many large pollen grains with characteristic surface pattern including the locally growing Elymus mollis (Lyme grass) (Beug, 1961; Edwards et al., 2008; Fredskild, 1988), that certainly is the only producer of Hordeum-type pollen in the area of investigation.
The decline of Equisetum (horsetail), Sphagnum, Cyperaceae and Betula nana-type pollen, as well the termination of a continuous Juniperus curve indicate a change in hydroclimate. A change towards dryer conditions is in line with higher levels of Artemisia and Hordeum-type pollen and a constant increase in charcoal particles, or the charcoal-particle–background-component, respectively.
PAZ 3
(1198–1288 CE)
At around 1209 CE charcoal particle concentrations and influx values are 10× and 41× higher than the background component of charcoal in this zone. In the same time, the meso-charcoal fraction displays a distinct peak at this depth followed by a smooth tail-off pattern. This data reflects a large scale tundra fire that effected mainly stands of Betula nana and especially the highly flammable individuals of Juniperus, that vanish from the pollen record of this zone. While also grasses and herbs must have been burned only the positive effect on these plants with high-repetitive cycles are recorded because this sample comprises the total pollen precipitation of approximately 20 years. Especially Poaceae, Artemisia and Ellymus mollis (Hordeum-type pollen) where benefiting from the opening of shrub-tundra vegetation. Also the record of Epilobium (cf. angustifolium/fireweed) is a subsequent effect of the fire. The concentration of herbs and grasses is highest in the “fire-sample” (1209 CE) which further highlights the effect on pollen productivity in succession of the burning.
The vegetation needed approximately 80 years to restore a state equal to pre-fire conditions and it is striking that for this timespan spores of HdV-113/Sporormiella are absent from the record before it is recorded continuously again. It is highly likely that large herbivores like caribou would have avoided burned areas. Firstly for the scent and their tendency towards avoiding clear cuts caused by fire but, secondly, especially because the fire changed the forage availability of the very food-selective angulate (Klein, 1982; Scherjon et al., 2015).
During PAZ 3 the curve of Potamogeton (pondweed) stops to be closed while the last pollen of Sparganium are recorded in the overall record. This decline in thermophilous aquatic species underlines lowered summer temperatures (Bos, 1998).
PAZ 4
(1288–1348 CE)
While Betula nana-type pollen reached values comparable to before the fire event, the overall pollen flora has changed in relation to pre-fire conditions. The decreasing record of Empetrum, Vaccinium-type pollen (bluberry/cranberry), Sphagnum and Equisetum allude to a continuous drying trend to which Artemisia and Poaceae positively responded.
PAZ 5
(1348–1564 CE)
This zone featured the lowest pollen concentration of the overall record which is also reflected in more than doubled amounts of recorded Lycopodium markers. It is the result of a very bad pollen preservation of this depth. The previously recorded drying trend continues and is manifested in an increase Poaceae, Artemisia and the charcoal background component, as well as declines of Sphagnum, Empetrum, Vaccinium-type pollen. Contrasting increases in Cyperaceae might be a result of available wet stands in former bank areas following a lake-level lowering. This interpretation would be in line with an increase of Menyanthes trifoliata. As the lake level lowered, it would create new shallow water areas that would rapidly be colonized by Menyanthes trifoliata. An increase in Saxifraga-type pollen (rockfoils) – a very cold-tolerant genus – could be discussed as being a result of decreasing temperatures.
PAZ 6
(1564–1738 CE)
At around 1587 charcoal particle concentrations and influx values are 7× to 10× higher than the background component of charcoal of the previous zone. This reflects a second recorded fire event in the immediate vicinity of the lake. Here, too, the landscape-dominating Betula nana fell victim to the fire the most. The burnt areas were immediately overgrown by many grasses and herbs of, for example, the Brassicaceae family. Once again, Elymus mollis benefited from this clearing of larger areas. But also the low-growing Juniperus spread to the end of the zone due to the heavily suppressed/burnt light competition from Betula nana. Why the Salix curve remains completely unaffected by the fire is unclear. The increase in the Betula pubescens curve suggests increased long-distance flight. Subsequent to the fire, it takes more than two centuries and beyond the PAZ boundary for the vegetation to recover to a state that is equivalent to before the fire event. A further similarity to the first recorded fire event recorded in PAZ 6 is the immediate long-term absence of Sporormiella (HdV-113) after the burning. Again, this alludes to a long-term avoidance of this area by large herbivores/caribou.
PAZ 7
(1738–1955 CE)
PAZ 7 is characterized by a continued strong increase in Betula nana, which exceeds the 50% mark towards the end of the zone. Salix likewise records a significant increase. Simultaneously, there is a sharp decrease in Poaceae as well as a decrease in the variety of herb pollen types represented.
The marked increase in Sphagnum possibly indicates changes in hydrological conditions. The increases in B. nana, Salix and the short-termed initial increase in Empetrum could be explained by higher precipitation. However, a lake level lowering – due to lowered precipitation or higher evaporation – is indicated especially by the aquatic species. Lower water levels would again create larger shallow water areas for Menyanthes trifoliata to spread. These plants would shade-out Potamogeton while no deeper waters remain at which the latter could outcompete Menyanthes trifoliata. The former bank areas provide space for the propagation of Sphagnum mosses. The lowered diversity of pollen types and the large input of B. nana and Salix pollen would be resulting from a severely shrunken pollen catchment area due to the reduction of the size of the water surface.
Elemental analyses
From the XRF measurement, we selected specific elements and element ratios that reflect environmental changes in the catchment. Counts of Ti and Si follow each other closely (Figure 6). From the core bottom at c. 560–1600 CE, values scatter at low levels with no general trend. From 1600 to 1700 CE there is a steep increase to a stable level of high values. The data indicates stable catchment conditions until 1600 CE, where increasing Ti and Si counts indicate increased influx of detrital erosion products, which could be caused by catchment destabilization or increased runoff. From 1700 to present the catchment is again stable, however with a higher input of clastic material, suggesting that the sudden increase was not a singular event, but rather an environmental shift towards increased runoff, which could be an indicator of increased precipitation. The Ca/Ti ratio (Figure 6) is stable from the core bottom at c. 560 CE to 1140 where a sudden decrease occurs, followed by a continuous decreasing trend until 1450 CE. From 1450 to present the ratio remains stable and low. We interpret this signal to reflect a trend of decreasing primary production in the lake, beginning at 1140 CE. The S/Ti ratio (Figure 6) shows a brief drop in the core bottom, but then stable and high values from 700 to 860 CE. A decrease occurs from 860 to 1450 CE, and broken by a brief increase, the ratio remains low and stable from 1450 to the present. We interpret that the supply of excess S was initially high and stable due to abundant terrestrial vegetation delivered to the lake through erosion. Declining S/Ti values reflect a decrease in available vegetative matter as the erosion remains constant in the same interval. The rate of annual organic production and, hence, available plant material by the surrounding vegetation then stabilizes and appears to remain low. Counts of Cl (Figure 6) show a large degree of scatter between values of 0 and 500 ppm, with a general trend of decrease from c. 560 to 1600 CE, indicating a transition towards temperature conditions favoring prolonged sea ice cover, yielding less sea spray. Cl values then increase from 1600 to present from values close to 0 ppm to above 500 ppm, reaching approximately 1500 ppm in the top sample (out of scale), indicating decreased sea ice cover and more sea spray in the ice-free period.
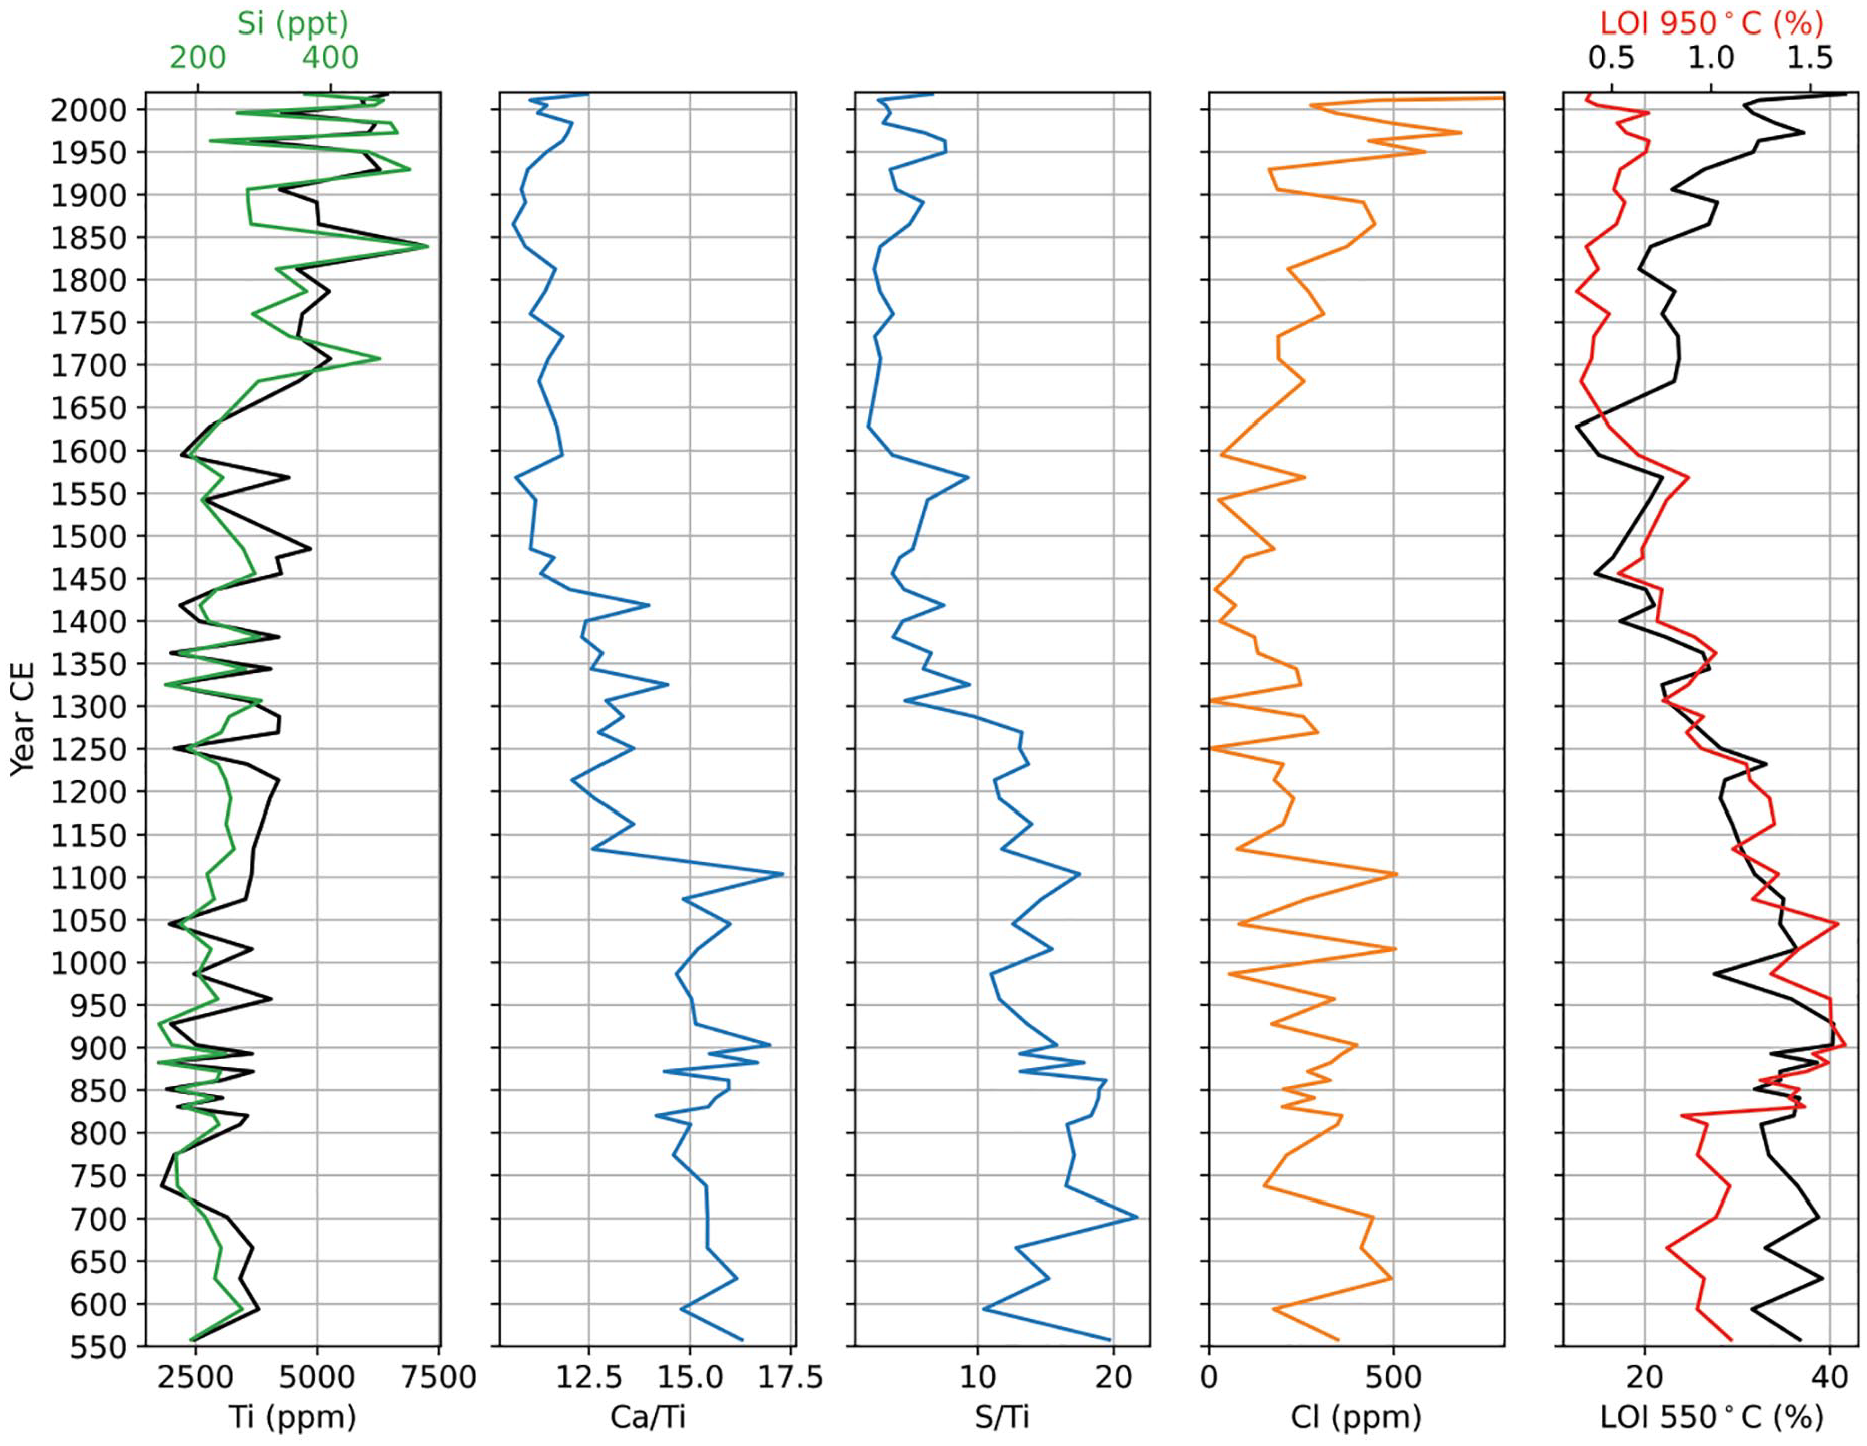
Results of measurements of XRF and LOI. From left to right: Ti and Si which are indicators of catchment stability and erosion. Ratio of Ca/Ti which is an indicator of excess Ca derived from autochthonous primary production. Ratio of S/Ti which indicates general biogenic production. Cl which indicates sea spray from open fjord waters. LOI at 550°C and 950°C which indicates the abundancy of plant organic material and carbonates, respectively (references are to be found in main text).
LOI(550°C) (Figure 6) yields initially high and stable values, reflecting an abundancy of organic production, until a decrease from 980 to 1630 CE. The values increase again from 1630-present. The measurement of LOI (950°C), which reflects carbonates from primary production as there is no carbonate-bearing bedrock in the catchment, shows initially low values that increase at 825 CE to remain stable and high, before a general decrease from 1050 to present (Figure 6). Organic matter abundancy is highly governed by climatic control, such as temperature and precipitation. The initial high LOI-values are interpreted to reflect an environment with sufficient summer temperatures and precipitation for a relatively lush subarctic vegetation. The decreasing trend reflects gradual cooling and/or less precipitation.
Discussion
Our multiproxy analyses can be sorted into three main groups that reflect: i) organic productivity (LOI, Ca/Ti, and S/Ti), ii) catchment stability (Ti, Si, pollen types and charcoal particles), and iii) temperature/precipitation (Cl, pollen types, NPPs and charcoal). During the investigated time period from c. 600 CE to present, we identify three intervals that are distinct based on XRF and LOI (Figure 7) as well as from the stable pollen spectra. In the first interval, from c. 560 to 1100 CE, the organic productivity is at a high and stable level, while climate proxies are at a high level with a gradual decline, and synchronously erosion is low. This reflects a stable environment with high organic production and relatively high summer temperatures and open water for an extended time of the year, as seen from the increased Cl flux. The very stable and warm environment is also evident from the pollen record, which suggests that summer temperatures were on average approximately 1°C higher than today in this period (compared to climatic normal 1991–2020, where the average temperature in July was 11.2°C (DMI, 2023)) and that caribou were abundant in the area, as inferred from SCF (Figure 5). Our results show that the elevated temperatures characterizing the MWP last from 590 to 1100 CE in Kangerlussuaq, which is in agreement with local lake temperatures recorded in the Kanger Stack (D’Andrea et al., 2011). Similarly, Aebly and Fritz (2009) found that the summers in the area were 5 days longer and 1°C warmer than today in this time interval and until 1250 CE. Furthermore, Aebly and Fritz (2009) estimate that the precipitation rate was 40 mm year−1 higher than today in Kangerlussuaq, which is in agreement with our findings of a relatively lush vegetation (cf. Sphagnum, Empetrum, Equisetum, etc.). The timing of the MWP in our record is concordant with temperature reconstructions based on gas fractionation in GISP2 (Kobashi et al., 2017) and two centuries earlier than the MWP recorded in GRIP and Dye3 (Dahl-Jensen et al., 1998). This discrepancy is likely explained by the high, decadal resolution of the gas fractionation temperature reconstruction (Kobashi et al., 2017), whereas the borehole-reconstruction (Dahl-Jensen et al., 1998) is unable to capture rapid temperature fluctuations because of heat diffusion in the ice sheet (Vinther et al., 2010). After this warm period, we observe a gradual transition away from the warm, stable environment. We first detect the transition by the end of the ninth century as extended seasons of sea-ice cover. We observe a decrease in all proxies of organic productivity from c. 1100 CE, which marks the beginning of a new period characterized by a change to cool and arid conditions, coinciding with the Little Ice Age (as defined by (Kjær et al., 2022). The development towards a cooler and drier climate is seen in the lowered organic production, more extensive sea ice conditions, and weakened stratification of the lake water. Our pollen record similarly indicates a change in hydrological regime towards cooler, more arid conditions and we detect a decrease in the relative abundance of caribou and lake level lowering from c. 1350 CE. The extremely dry conditions are likely to have promoted the risk of wildfires. This led to a severe local fire event that we observe at c. 1200 CE. The wildfire potentially caused the caribou to withdraw completely from the area for about 80 years until pre-wildfire vegetation conditions were reestablished. However, although the evidence for the renewed occurrence of this megafauna is continuous, it is clearly on a reduced scale. This attests to the presence of caribou either for a shorter annual residence period, or of a relatively reduced quantity of animals. Both are attributable to the altered forage availability. Caribou are very selective, preferring food of quality over quantity (Grønnow et al., 1983; Klein, 1982; Lent and Klein, 1988; Spiess, 1979). As the preferred lush mosses, but for instance also Equisetum, are now much less abundant due to the increasing dryness, this climatic alteration ultimately affects animal behavior. People of the Thule culture began using the nearby caribou hunting site at Aasivissuit around 1200 CE (Grønnow et al., 1983), most likely after the wildfire, however the sequence of these events cannot be resolved as they occur within the few years of inaccuracy provided by calibrated radiocarbon ages. A second wildfire occurred at c. 1580 CE, after which the reestablishment of preceding vegetation conditions took more than 200 years, likely because low precipitation rates slowed down regrowth significantly.
The detected wildfires may not have affected the seasonal migration of caribou around Aasivissuit as adversely as suggested by the NM 1 lake core record, where the caribou appear to have disappeared. At least the early Thule dates of caribou bone from Aasivissuit demonstrate, that the Inuit hunted caribou in the area during the 13th and late 16th centuries when the terrain around NM1 was scorched by wildfires. There are no traces of wildfires in the sections recorded at Aasivissuit, but importantly, the midden accumulated in boggy terrain which assumingly would have remained moist even during dry summers.
Our findings of dry and cold conditions from 1100 to 1600 correspond well to observations of Aebly and Fritz (2009) who found the period from 1250 to present to be the windiest and driest time recorded in Kangerlussuaq throughout the Holocene. Similarly, the Kanger Stack displays a sudden temperature drop at c. 1150 CE, followed by low values until c. 1600, where temperatures rise (D’Andrea et al., 2011). In the ice core temperature reconstruction by Kobashi et al. (2017), the cooling trend starts at c. 1100 CE, fluctuates highly and continues until 1700 CE, whereas the GRIP and Dye-3 reconstruction by Dahl-Jensen et al. (1998) shows a cooling trend from c. 950 CE, which culminates c. 1550 CE. This discrepancy highlights the importance of locally based climate reconstructions. We find that the cool and arid conditions in Kangerlussuaq prevailed until c. 1600 CE, where we see an increase in typical products of surface erosion due to increased runoff (Si and Ti) as well as a slow rise in organic productivity and moss growth, which similarly indicates more precipitation. We find that the latest period from c. 1600 to present is characterized by increasingly moister conditions, with temperatures approaching levels similar to todays. Furthermore, from 1600 onwards we see a decrease of sea-ice cover in the fjord, based on increased influx of Cl. Lake levels remain low in this period, as reflected by the pollen record, indicating that evaporation surpassed precipitation, as it does today. However, from 1800 to present, precipitation increased sufficiently to allow for more widespread growth of shrubs, which are visible in the modern landscape.
In summary, there is broad agreement between the multiple proxies used in this study to reconstruct climatic and environmental changes in Kangerlussuaq, which emphasizes the robustness of this approach. Furthermore, there are no observable lags between catchment changes observed from geochemical proxies and corresponding changes in the pollen record (Figure 7).
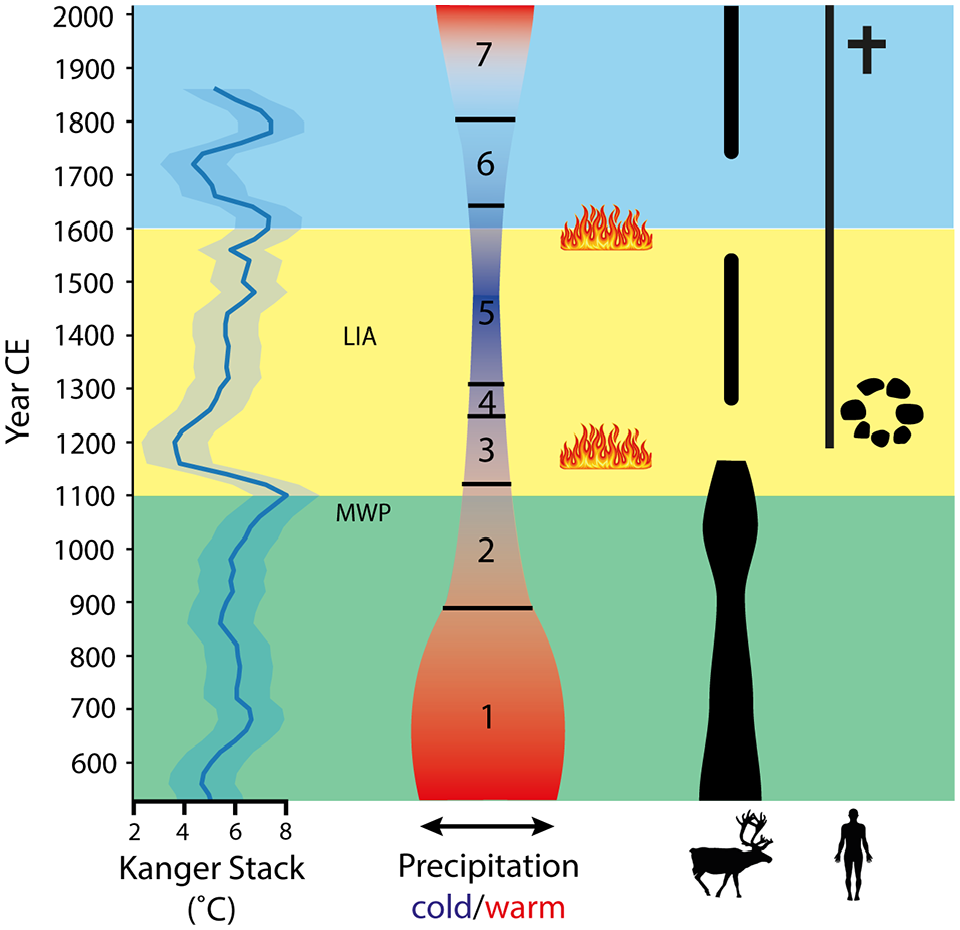
Timeline of climatic and environmental changes in Kangerlussuaq. From left: Kanger Stack lake water temperature reconstruction in nearby lake (D’Andrea et al., 2011). Relative cooling and warming (color grade) and precipitation amount (width) as reconstructed from multiproxy analyses and pollen (this study). Wildfires and caribou abundancy (this study). Human presence at nearby Aasivissiut hunting ground (Inuit and European) (Grønnow et al., 1983).
Conclusion
In this study, we make a reconstruction of climatic and environmental changes in close vicinity to the Aasivissuit summer hunting ground based on pollen and fungal spores, charcoal, and geochemical proxies from a lake core, covering the period from 560 CE to present. Our different proxies are in agreement regarding the observed environmental and climatological changes, and are also in agreement with other local climate reconstructions from the area. We see some disagreement when comparing to ice core-based temperature reconstructions, which highlights the importance and limitations of local reconstructions. We identify three distinct environmental regimes during the investigated period:
• c. 560 CE (base of record) to c. 1100 CE was characterized by stable climatic conditions that were relatively warm and humid (in sub-arctic context). Summer average temperature was 1.7°C warmer than today. Caribou were abundant in the area, however in smaller numbers from c. 830–930 CE.
• After a gradual change, 1100–1600 CE was a period of cooler and very arid conditions with more sea ice and we detect two wildfires. The wildfires cleared existing vegetation and forced away caribou for up to 200 years until reestablishment of vegetation.
• From 1600 CE to present we find increasingly warmer conditions with more precipitation and less extensive sea ice cover, gradually approaching the modern climate regime in Kangerlussuaq.
The changing climatic and environmental conditions have most likely been comparable at the investigated site and at the Aasivissuit summer hunting ground, 15 km away. However, we find no correlation between climatic changes and hunting intensity, indicating that the subsistence strategies and hunting types have been resilient to climatic variation. The first Inuit established the summer hunting ground simultaneously with initiation of Neoglacial cooling, and used the hunting ground regularly throughout the Neoglacial, with peak intensity close to the end of the Neoglacial detected at the coring site. Furthermore, the wildfires and resulting caribou abandonment observed at the coring site are very local events that had no impact on the summer hunting ground usage.
Supplemental Material
sj-docx-1-hol-10.1177_09596836241247301 – Supplemental material for Two millennia of climate change, wildfires, and caribou hunting in west Greenland
Supplemental material, sj-docx-1-hol-10.1177_09596836241247301 for Two millennia of climate change, wildfires, and caribou hunting in west Greenland by Astrid Strunk, Sascha Krüger, Jens Fog Jensen, Jesper Olsen and Catherine Jessen in The Holocene
Footnotes
Acknowledgements
We thank the Government of Greenland for permission to carry out fieldwork. We also thank David Gregory and Peter Steen Henriksen for tireless fieldwork assistance, and we thank N. John Anderson for inspiring discussions. We also thank Kiel University for providing LOI measurements. The work presented here is part of the interdisciplinary project “Activating Arctic Heritage: Exploring UNESCO World Heritage in Greenland” which aims to increase our understanding of subsistence strategies in an extreme climate and illuminate the interplay between climate change and cultural changes.
Funding
The author(s) disclosed receipt of the following financial support for the research, authorship, and/or publication of this article: This work was supported by the Carlsberg Foundation, grant number CF18-1106.
Supplemental material
Supplemental material for this article is available online.
References
Supplementary Material
Please find the following supplemental material available below.
For Open Access articles published under a Creative Commons License, all supplemental material carries the same license as the article it is associated with.
For non-Open Access articles published, all supplemental material carries a non-exclusive license, and permission requests for re-use of supplemental material or any part of supplemental material shall be sent directly to the copyright owner as specified in the copyright notice associated with the article.