
Abstract
Characterizing disturbance regimes over long time scales is paramount for describing and identifying their variability. The most important biotic disturbance in the eastern Canadian boreal forest is the defoliation caused by the eastern spruce budworm, a moth of the insect order Lepidoptera. Lepidopteran scales have recently been used to reconstruct spruce budworm population fluctuations throughout the Holocene. However, this novel proxy has yet to be compared to an independent proxy. This study aimed to determine whether lepidopteran scales found in the surface sediments of boreal lakes tracked large spruce budworm populations, that is, outbreaks, using yearly aerial surveys (1967–present) of spruce budworm defoliation as an independent proxy. Scales were extracted (1 cm resolution) from the top 20 cm of 210Pb-dated sediment cores recovered from nine lakes. To identify significant abundance peaks of scales in the time series, we removed background noise using a modified version of CharAnalysis. A 100-year smoothing window width combined with a 60th percentile threshold yielded the highest true positive and true negative occurrences, and the lowest false positive and false negative occurrences, with values of 0.69 and 0.70 for Cohen’s Kappa and Matthews correlation coefficient, respectively. Our findings demonstrate that lepidopteran scales are a suitable proxy for identifying spruce budworm outbreaks in the sediment record enabling the reconstruction of budworm and other lepidopteran species outbreak dynamics at millennial timescales.
Keywords
Introduction
The ability to quantify forest disturbance regimes over long periods is essential for accurately identifying and describing their natural variability. A long-term perspective is particularly useful for capturing the evolution of a disturbance regime in response to changing climate and/or vegetation (Ali et al., 2009, 2012; Blarquez et al., 2015; Power et al., 2008). Moreover, looking into the past may hint at how current and future disturbance regimes may behave in a changing climate. Past observed long-term variability could serve as a useful framework for developing and applying sustainable forest management approaches (Hennebelle et al., 2018). For example, a long-term perspective obtained using sedimentary charcoal has allowed elucidating how fire frequencies and the amount of biomass burned have evolved in relation to various climate phases of the Holocene (Ali et al., 2009, 2012; Blarquez et al., 2015; Long et al., 1998). An accurate characterization of both abiotic and biotic disturbances over centennial and millennial temporal scales improves our understanding of ecosystem functioning and favors the application of sensible forest management approaches (Keane et al., 2009; Landres et al., 1999; Swetnam et al., 1999).
Biotic disturbances, such as insect outbreaks, are key ecosystem processes affecting forest structure and composition (Barbosa et al., 2012; Cooke et al., 2007) and nutrient cycling (Lovett et al., 2002; Mattson and Addy, 1975). One of the most important disturbances in the eastern Canadian boreal forest is the eastern spruce budworm [Choristoneura fumiferana Clemens]. This native lepidopteran defoliator exhibits a univoltine lifecycle and cyclic population outbreaks (Jardon et al., 2003; Royama, 1984; Royama et al., 2005, 2017). The spruce budworm lifecycle consists of six larval stages, a pupal stage, and finally, an adult moth stage in which the insect disperses and reproduces (Nealis, 2016). In the larval stage, spruce budworm feeds preferentially on the current year’s needles, buds, and cones of mature balsam fir [Abies balsamea (L.) Mill]; however, this insect will also consume older needles and, to a lesser extent, feed on the needles of white spruce [Picea glauca (Moench) Voss] and black spruce [Picea mariana (Mill.) Britton, Sterns & Poggenburg] (Hennigar et al., 2008). Tree mortality in mature balsam fir typically occurs after 3–4 years of severe defoliation, and pure old stands tend to undergo greater defoliation than mixed stands (Campbell et al., 2008; MacLean, 1980, 1984; Su et al., 1996). Over the course of the 20th century, spruce budworm outbreaks in the boreal forest have tended to occur every 30–40 years at the landscape scale (Blais, 1983; Boulanger and Arseneault, 2004). These outbreaks have typically lasted 9–12 years (Nealis, 2016), although outbreak length can vary regionally (Gray et al., 2000). During an outbreak, spruce budworm populations increase rapidly to produce a massive number of adult moths (Cooke et al., 2007; Nealis, 2016).
Lepidopteran scales found in lake sediments have recently been used as a proxy to reconstruct spruce budworm population sizes over multi-millennial timescales (e.g. Navarro et al., 2018b). This new paleo-proxy is particularly promising because the scales’ chitinous structure is well preserved in anaerobic environments, such as lake sediments, and because scales are an abundant structure found on adult moths, produced in enormous quantities during outbreaks (Ghiradella, 1998; Navarro et al., 2018a; Tremblay, 2022). Combined, the abundance of this microfossil and its durability has permitted the reconstruction of spruce budworm population fluctuations throughout the Holocene (Navarro et al., 2018b). However, as a novel paleo-indicator, its use has not yet been compared to an independent measure of outbreaks, although outbreaks over the past 8000 years detected by the lepidopteran scales have been in agreement with other paleo-remains from the spruce budworm, such as cephalic head capsules, and feces (see Simard et al., 2002, 2006 for macrofossil reconstructions; Navarro et al., 2018b).
This study aims to determine whether lepidopteran scales could reliably identify local-scale periods of high spruce budworm populations, that is, outbreaks, in the mixed boreal forests of Québec (Canada). We compare recent and known outbreak periods (1967–present) documented by aerial surveys to the accumulation of lepidopteran scales found in lake sediments. If lepidopteran scales provide an accurate proxy of spruce budworm population size, then large accumulations should coincide with known spruce budworm outbreak periods identified by aerial surveys, as both indicate the presence or the absence of the defoliator.
Methods
Study area
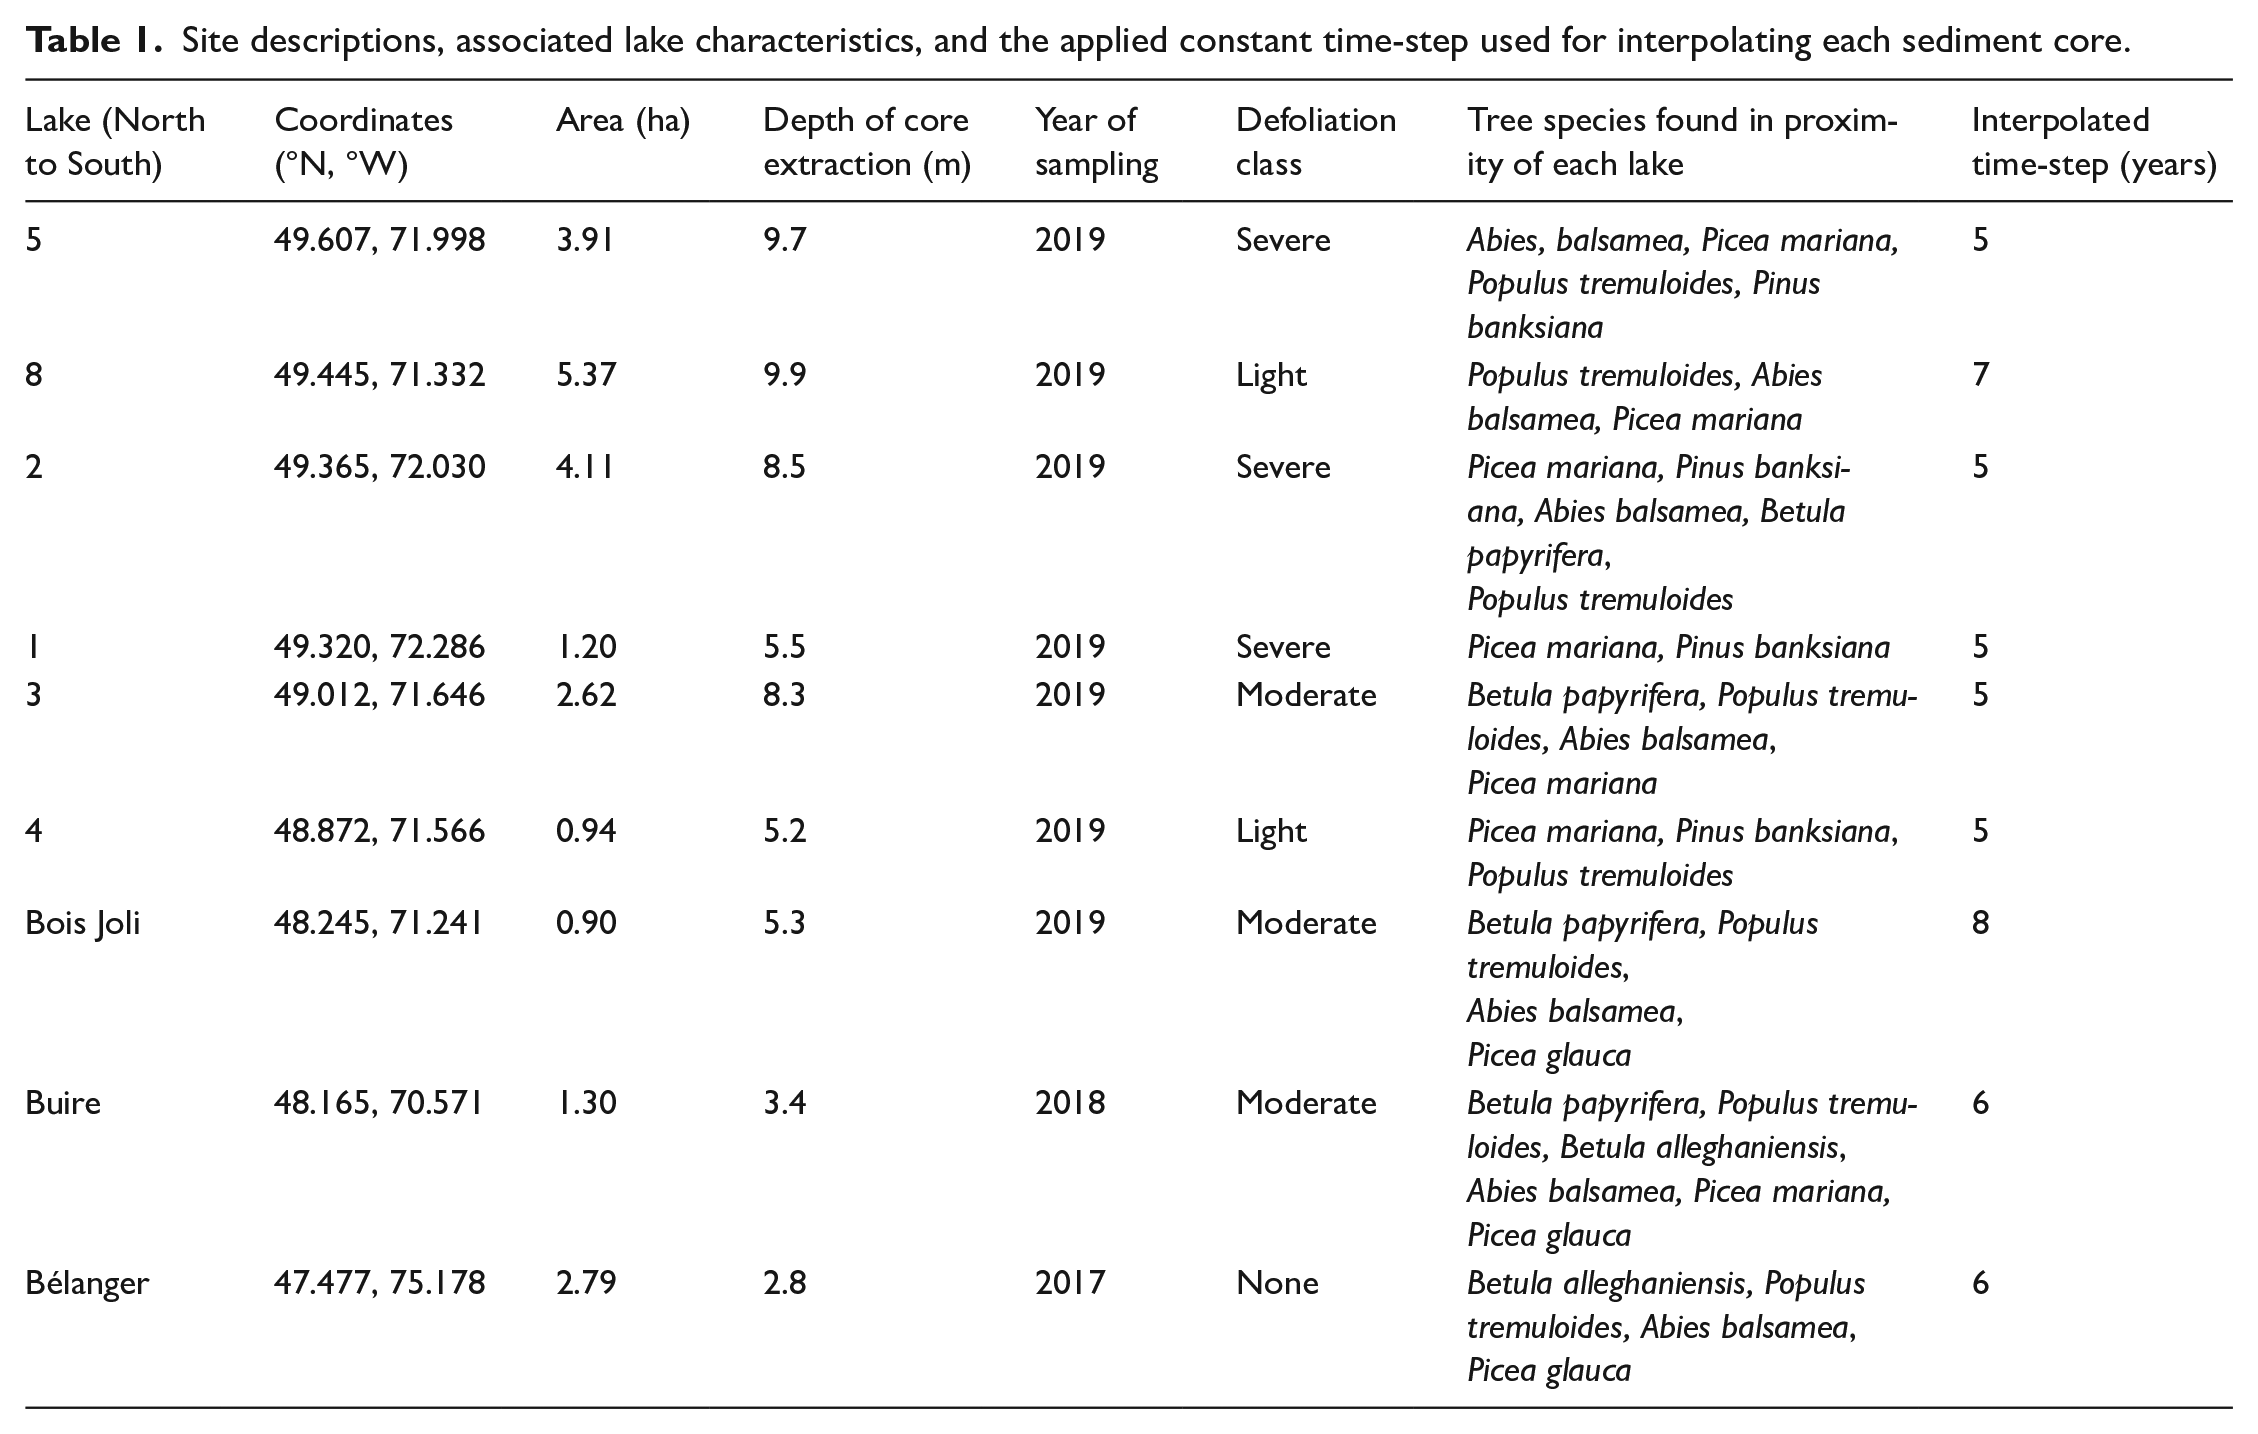
Our sites were located between 47°and 50°N in the Abies balsamea–Betula papyrifera (Balsam fir–paper birch) and Abies balsamea–Betula alleghaniensis (Balsam fir–yellow birch) bioclimatic zones (Rowe, 1972; Saucier et al., 2009; Figure 1), and in areas having experienced varying levels of defoliation, as assessed on the ground in the sampling year (Table 1). All lakes were found at ⩽ca. 300 m asl and surrounded by flat or gently rolling terrain. The relative abundance of arboreal species varied across the region, although tree species composition remained similar, with stands typically comprising balsam fir, white spruce, black spruce, trembling aspen [Populus tremuloides Michx.], paper birch [Betula papyrifera Marshall], and yellow birch [Betula alleghaniensis Britt.], and jack pine [Pinus banksiana Lamb.] (Table 1).
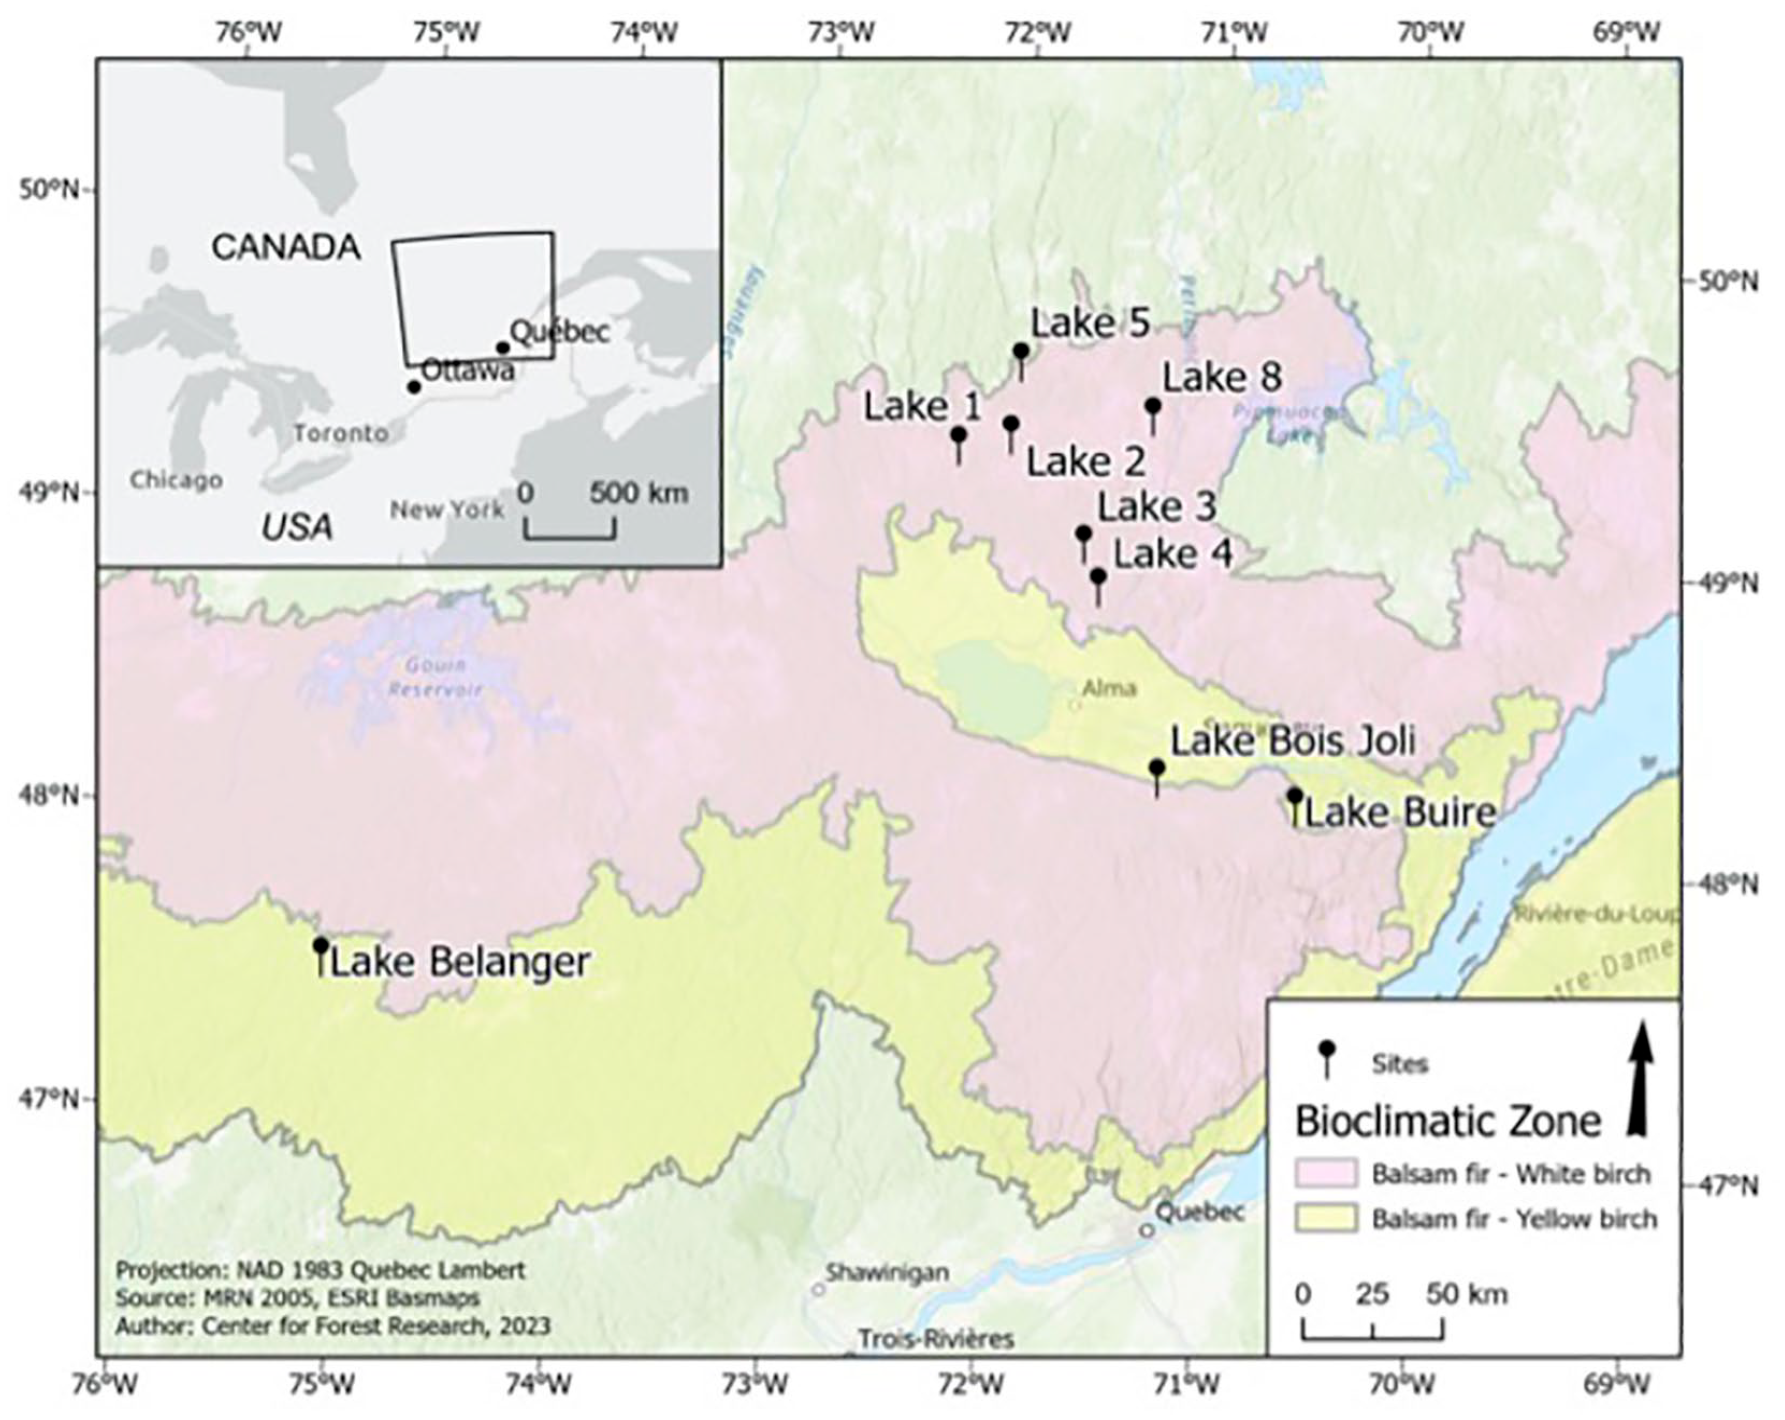
Location of the sampled lakes in central Québec, Canada.
Site descriptions, associated lake characteristics, and the applied constant time-step used for interpolating each sediment core.
Lake sediment paleo-proxy: Lepidopteran scales
Field sampling and subsample preparation
We selected nine small (roughly ⩽5 ha), deep lakes having little or no inflow or outflow (e.g. Ali et al., 2008; Millspaugh and Whitlock, 1995). The lake–sediment interface and upper portion of the sediment record were collected using a gravity corer (Renberg, 1991; Renberg and Hansson, 2008). We subsampled the cores at a 1 cm resolution and removed 1 cm3 from each subsample for use in lepidopteran scale analysis. Six subsamples from the upper portion of each core – 0–1, 2–3, 5–6, 9–10, 14–15, and 24–25 cm except for Lake 4 which required an extra sampling depth at 18–19 cm – were sent to Flett Research Ltd (Winnepeg, MB, Canada) to obtain measurements of 210Pb activity. To convert 210Pb activity into calendar years, we applied a constant rate of supply (CRS) model (Appleby and Oldfieldz, 1983; Binford, 1990; Supplemental Material S1).
Lepidopteran scales were extracted from the top 20 cm of each sediment core, corresponding to approximately the last 150 years, following a modified protocol initially developed by Navarro et al. (2018a). Briefly, each 1 cm3 wet sediment subsample was deflocculated in 20% KOH at 17 psi and 121°C for 30 min in a steam sterilizer (Amsco unit by Steris). The sediment was then wet-sieved at 53 µm, and the retained sediment was put into 50 mL centrifugation tubes. Twenty milliliters of sucrose solution (relative density = 1.24) was added to the tubes, which were then centrifuged at 4500 rpm for 20 min at 21°C. The supernatant from each tube was removed, and 25 µL of 1% lactophenol cotton blue stain was added to the pellet to facilitate scale identification. The pellets were mounted on microscope slides and scales were identified and counted at 10x objective magnification (Tremblay, 2022).
Analysis
We identified peaks of lepidopteran scale abundance using a modified version of CharAnalysis, a procedure typically used to reconstruct paleo-fires from charcoal particles recovered from lake sediments (Higuera, 2009; Higuera et al., 2010; Supplemental material S2). The short temporal scale (<200 years) and relatively small sample size of the scale series, however, precluded the use of the CharAnalysis program in its original design (Higuera, 2009; Higuera et al., 2010). Therefore, we developed a simplified version of CharAnalysis in the R environment (R Core Team, 2021). For clarity, we use the same terminology as for the original program.
Raw sediment accumulation rates can vary downcore because of sediment compaction; thus, 1 cm thick samples in the upper portion represent a shorter time interval than those recovered at the bottom of the core. The subsequent analyses required a constant time-step; therefore, we interpolated the raw accumulation rates to a constant time-step (Cint). From this, we could determine the background accumulation rate (Cback). Interpolation was performed by applying the best-fitting time step to the raw accumulations rates within each core with the “pretreatment” function in the “paleofire” R package (Blarquez et al., 2014; Table 1; Supplemental Material S2). We obtained background accumulation rates (Cback) using LOWESS, from the “locfit” package (Loader, 2020), running a smoothing window of 100 or 120 years corresponding to approximately three times the known spruce budworm outbreak return interval (30–40 years) in recent history (Blais, 1983; Boulanger et al., 2012; Boulanger and Arseneault, 2004; Morin, 1994). We selected this approach as an analogous procedure as for determining Cback for wildfires, which relies on a smoothing window approximately three times the mean fire return interval (Blarquez et al., 2010; Carcaillet et al., 2009). Peak scale accumulations (Cpeak) were determined by subtracting Cback from the interpolated values to which a threshold t was applied to identify large spruce budworm populations, that is, outbreaks (Cfire), and differentiate them from Cnoise. The thresholds used to identify outbreaks were at the 40th, 50th, 60th, 70th, 80th, 90th, 95th, and 99th percentiles of Cpeak and were applied globally, as each core had fewer than 30 samples (Higuera, 2009; Higuera et al., 2010).
We identified outbreak events as clusters of scale accumulations by applying a 20-year window (10 years pre-outbreak to 10 years post-outbreak) around the highest accumulation rate of a potential outbreak (Cpeak) to reduce identifying false outbreaks. Any point falling within this window was considered to be part of the same outbreak event cluster. We selected this window length to encompass the 5- to 15-year period of severe defoliation when budworm populations are high (Blais, 1985) and to encompass the variability in outbreak duration observed over the 20th century (Gray et al., 2000).
Aerial surveys
Based on Tremblay’s (2022) finding that annual lepidopteran scale accumulations in lake sediment traps are strongly correlated to the annual defoliation around a small lake (approximately 200 m radius) representing the local spruce budworm population, we estimated defoliation within a 200 m buffer around each lake as an initial attempt in determining the lepidopteran scale catchment basin size. We performed this projection in ArcMap 10.4.1 (ESRI, 2015) using shapefiles of aerial surveys conducted from 1967 to present (Ministère des forêts, de la faune et des parcs (MFFP), 2021; Supplemental Material S3). We defined outbreak periods at each site as the first year of observed defoliation to the last year of observed defoliation within the buffer zone, even if within this period there were up to five consecutive years of no observed defoliation, a phenomenon that can sometimes occur locally (Gray, 2008). Furthermore, within the defined outbreak periods, at least 1 year of observed moderate or severe defoliation had to be recorded, as sedimentary lepidopteran scale accumulations do not detect light defoliation events (Tremblay, 2022). If only light defoliation was observed in the outbreak period, this was not counted as an outbreak.
Outbreak period definition and detection
From the above criteria, we assessed outbreak detection (presence/absence) for the various smoothing windows and scale percentile thresholds using a confusion matrix, Cohen’s Kappa, and Matthews correlation coefficient. We applied the CharAnalysis procedure over the entire time period covered by the sediment core (top 20 cm) to retain the variability in scale accumulations over the 20th century to most accurately identify large scale accumulations. However, the outbreak detection analysis was restrained to the latter portion of the 20th century, that is, 1967–present, a period for which information was available for both proxies. During this period, two major outbreaks occurred in the province of Québec. Although they lasted 15–20 years at the regional scale (1967–1986 and 2010–present), defoliation rarely exceeded 10–15 years locally and showed variable temporal patterns (Gray et al., 2000). Therefore, we used site-scale defoliation patterns to determine the exact years of outbreak versus non-outbreak periods for the confusion matrix. We defined the outbreak periods through aerial surveys by using the first and last year of detected defoliation across all sites within the study area spanning the years: 1971–1985 (O1; using the nomenclature in Boulanger et al., 2012; Jardon et al., 2003), and 2010–present (OP; “present outbreak,” building off the previous nomenclature). Similarly, a non-outbreak period spanned from 1986 to 2009.
A 2 × 2 confusion matrix counted the number of occurrences – 3 periods, that is, 2 outbreaks and 1 non-outbreak × 9 lakes for a total of 27 observations – that both proxies agreed or disagreed (Table 2). The matrix consisted of four cells: true positive (TP) where both proxies identified an outbreak; true negative (TN) where neither proxy detected an outbreak; false positive (FP), and false negative (FN; e.g. Chicco et al., 2021a, 2021b, 2021c) where proxies disagreed as one proxy identified an outbreak and the other did not.
The generic confusion matrix used to assess the agreement between the lepidopteran scale accumulations and the aerial surveys.
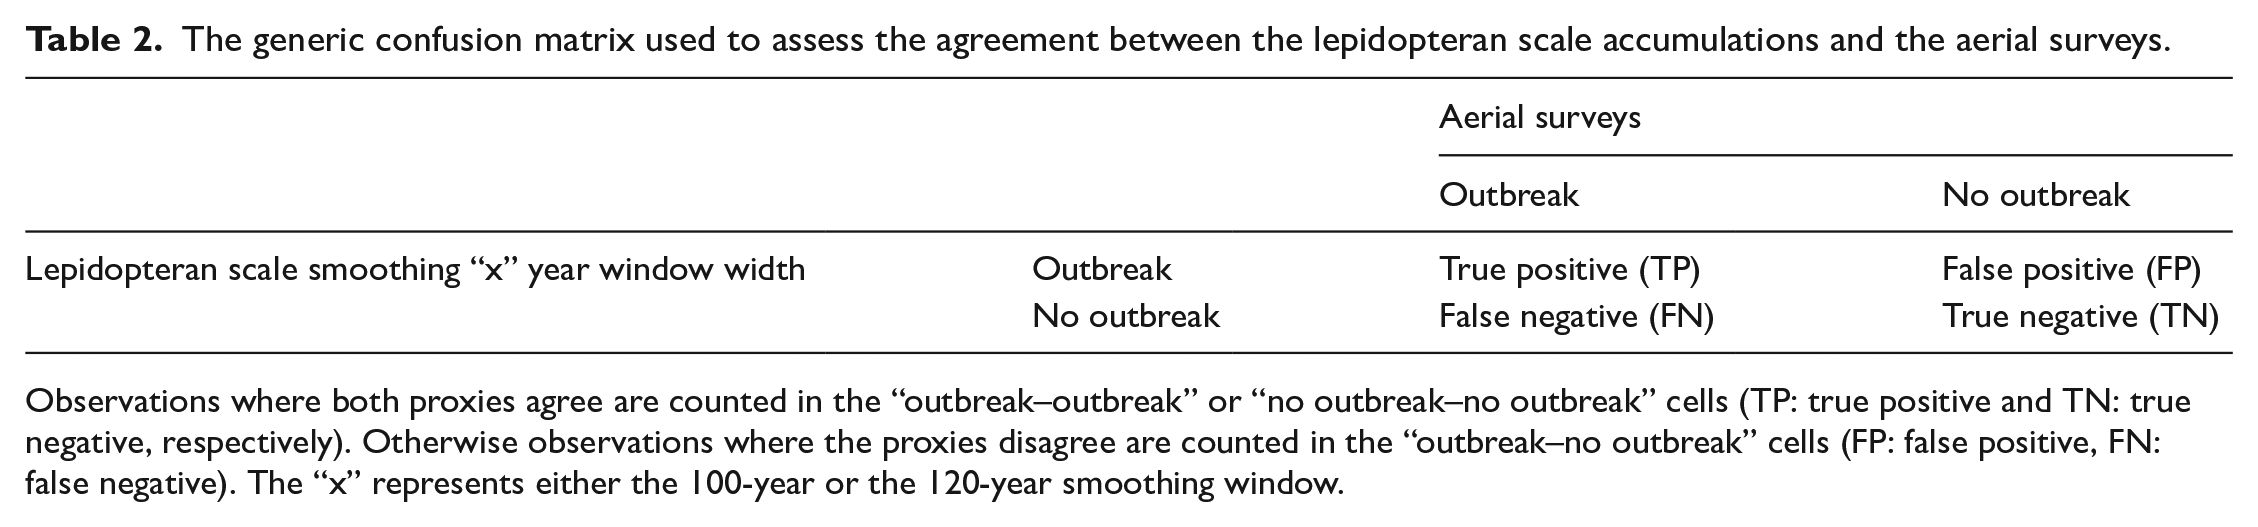
Observations where both proxies agree are counted in the “outbreak–outbreak” or “no outbreak–no outbreak” cells (TP: true positive and TN: true negative, respectively). Otherwise observations where the proxies disagree are counted in the “outbreak–no outbreak” cells (FP: false positive, FN: false negative). The “x” represents either the 100-year or the 120-year smoothing window.
We assigned peak lepidopteran scale accumulations that surpassed the defined percentile threshold (Cfire), were assigned to the closest aerial survey-defined outbreak period (1971–1985; 2010–present) within 15 years. This window accounted for the variability resulting from 210Pb measurements and subsequent age–depth estimates and was inspired by a similar method applied to assign sediment charcoal peaks based on fire scars (see Higuera et al., 2005). Cohen’s Kappa, based on the 2 × 2 confusion matrix, served to quantify the agreement in outbreak detection between the two proxies (Chicco et al., 2021c; Cohen, 1960; Warrens, 2008, 2010). Cohen’s Kappa typically ranges from 0 to 1, where values closer to 1 indicate agreement between the proxies, and values closer to 0 indicate that the agreement between the proxies occurs because of chance (Chicco et al., 2021c; Cohen, 1960; Warrens, 2014, 2015). Values closer to –1 indicate a disagreement between the proxy records (Chicco et al., 2021c).
In addition to Cohen’s Kappa, we used the Matthews correlation coefficient (MCC) to quantify the agreement between the proxies as it may be more reliable and informative than Cohen’s Kappa (Chicco et al., 2021a, 2021b, 2021c). The MCC is a performance metric that assesses the association between variables (Matthews, 1975) and is analogous to the
Results
Outbreak detection using the lepidopteran scales strongly agreed with the aerial surveys (23 true positive or negative vs 4 false positive or negative; Table 3) producing a kappa of 0.69, and an MCC (Matthews correlation coefficient) of 0.70 (Table 4). Successful detection generally increased when we lowered the percentile threshold, and we found greater accuracy when we applied a 100-year window width. The 100-year smoothing window generally had more true positive and fewer false negative detections relative to those of the 120-year window (Table 3). Maximum outbreak detection by the scales occurred at the 60th percentile threshold and was lowest at the 95th and 99th percentile thresholds regardless of the smoothing window size (Table 3). Generally, the number of false negatives increased with increasing percentile threshold (Table 3). A false positive for lake Bélanger (ca. 2005) occurred regardless of the threshold or smoothing window size, as the scale record had detected an outbreak, whereas none had been detected by aerial surveys (Table 3; Figure 2; Supplemental Material S3, S4). Finally, an additional false positive occurred at the 40th or 50th percentile when applying the 100- and 120-year smoothing window, respectively (Table 3).
Summary of the confusion matrix occurrences for the 100- and 120-year smoothing windows and percentile thresholds applied to the lepidopteran scale records from sediment cores collected from nine lakes.
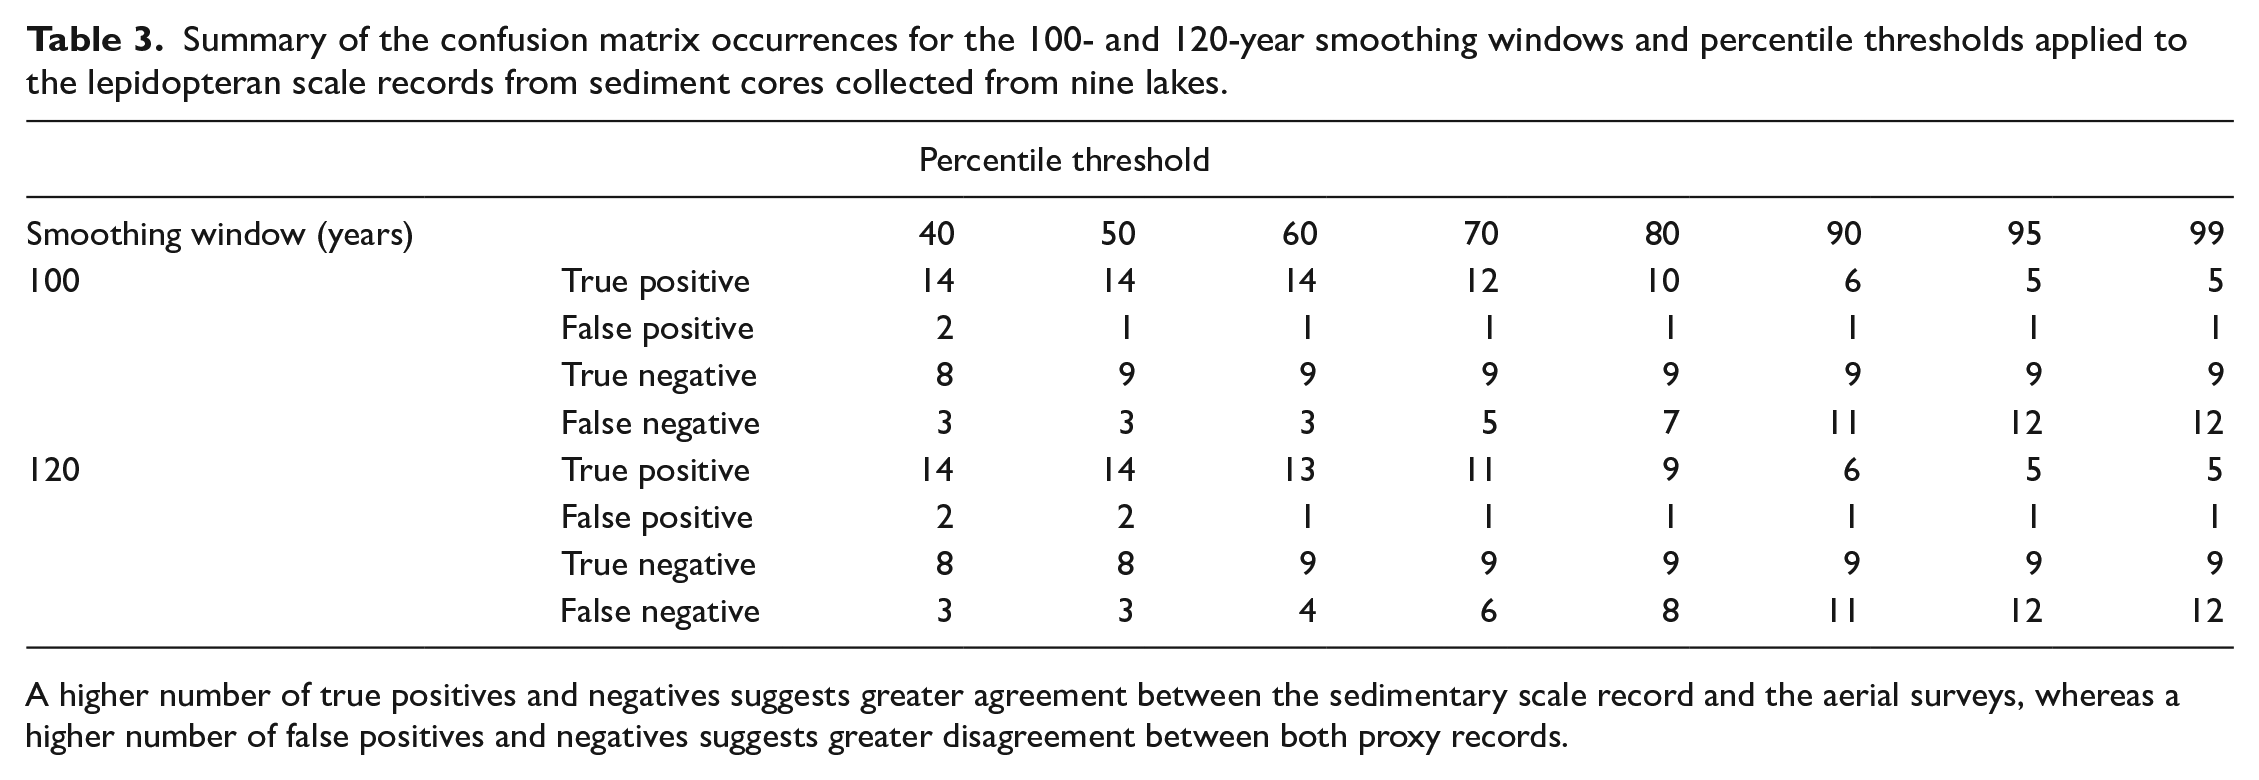
A higher number of true positives and negatives suggests greater agreement between the sedimentary scale record and the aerial surveys, whereas a higher number of false positives and negatives suggests greater disagreement between both proxy records.
The agreement in spruce budworm outbreak detection, expressed as Cohen’s Kappa and Matthews correlation coefficient between lepidopteran scale accumulations and aerial surveys over the late 20th century (1967–present) using different window widths and percentile thresholds.
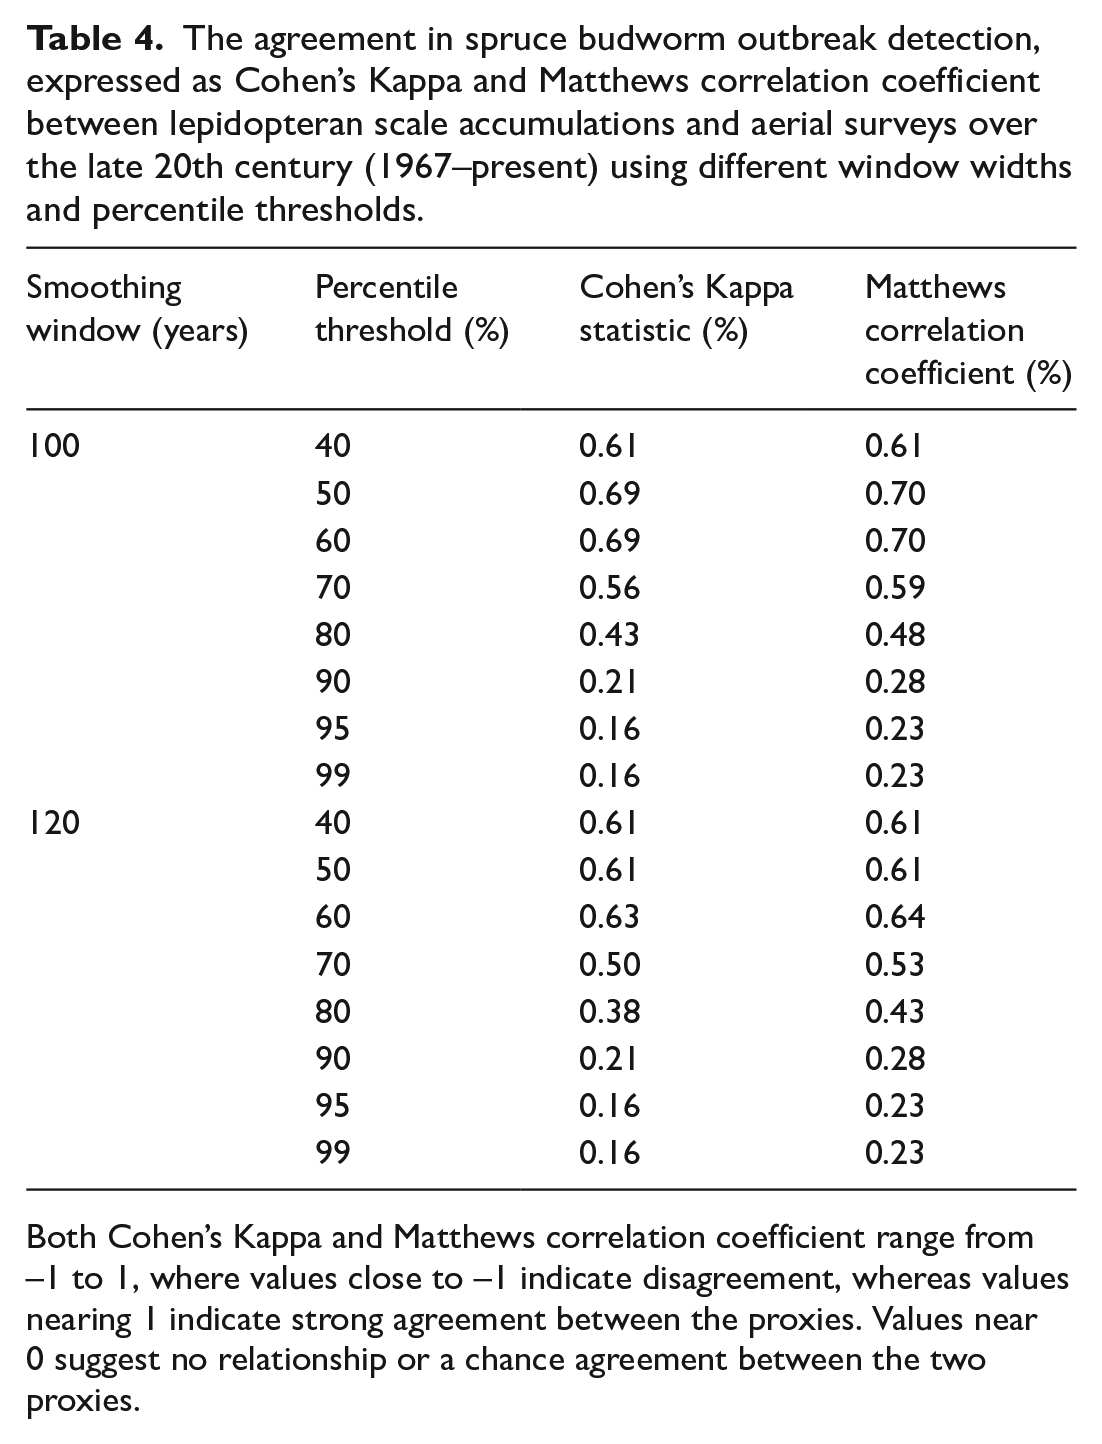
Both Cohen’s Kappa and Matthews correlation coefficient range from –1 to 1, where values close to –1 indicate disagreement, whereas values nearing 1 indicate strong agreement between the proxies. Values near 0 suggest no relationship or a chance agreement between the two proxies.
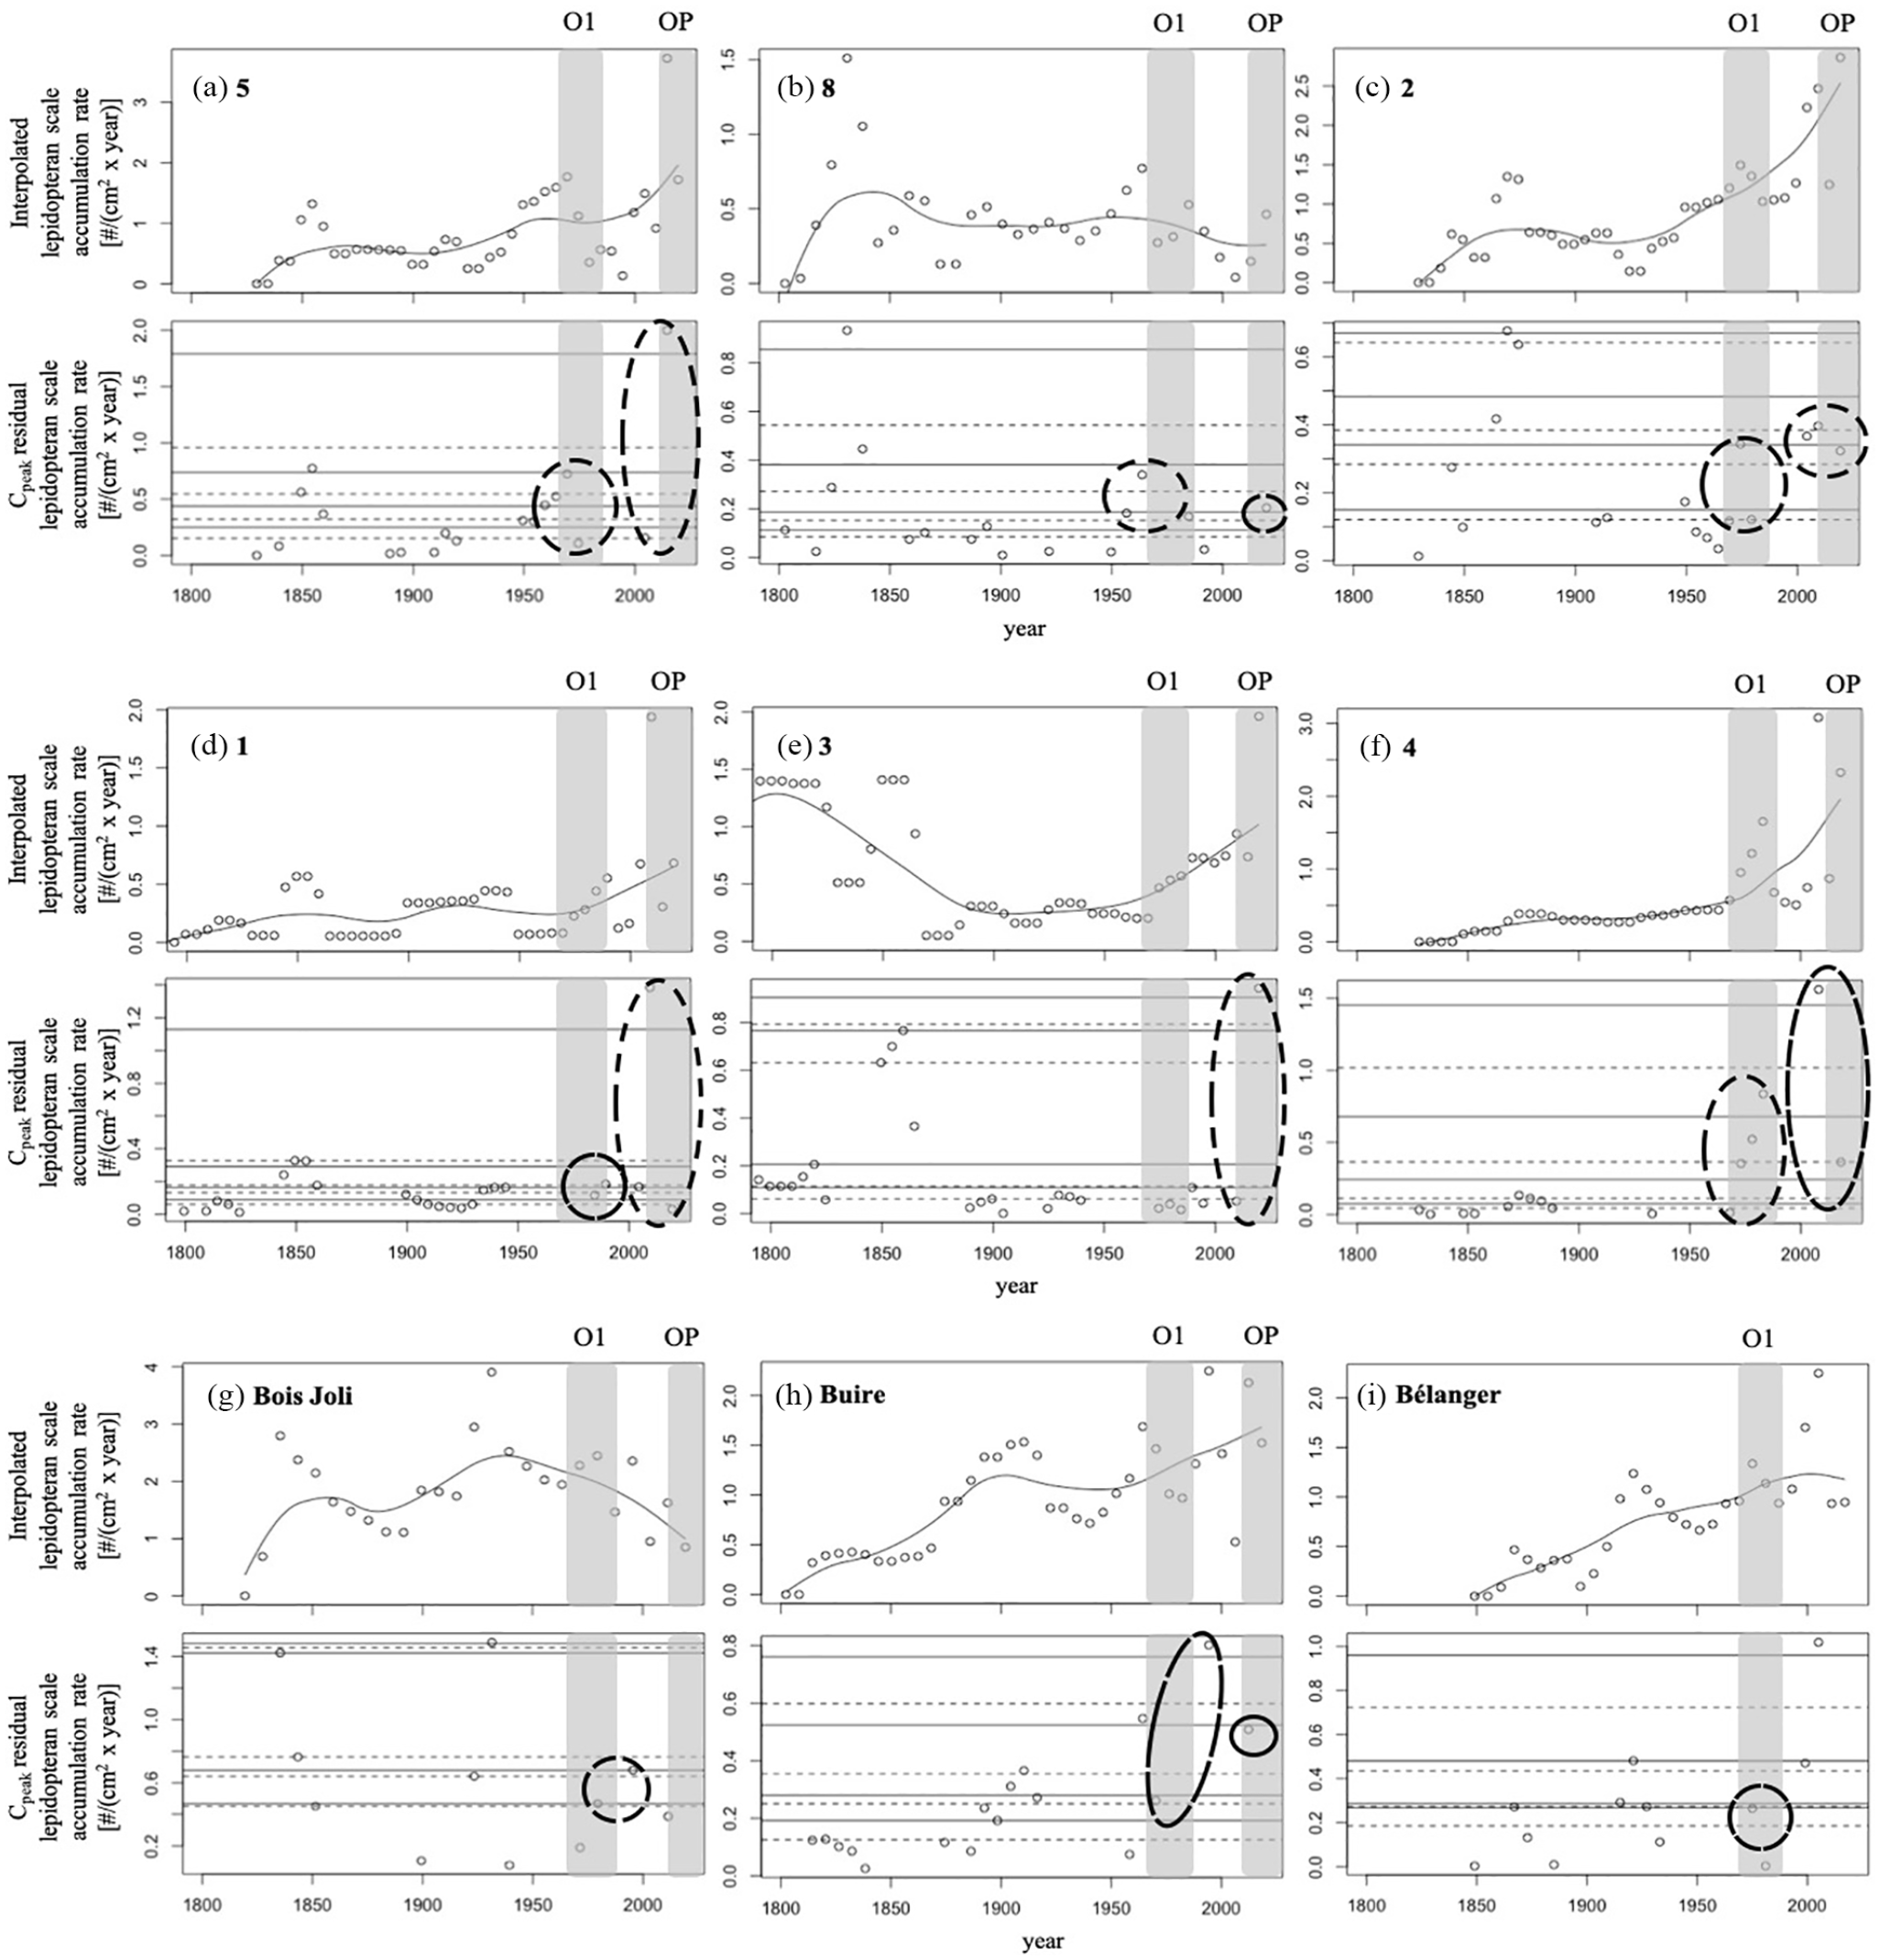
Interpolated lepidopteran scale accumulations and Cpeak accumulations using the lepidopteran scale paleo-proxy for lakes (a) 5, (b) 8, (c) 2, (d) 1, (e) 3, (f) 4, (g) Bois Joli, (h) Buire, (i) Bélanger. The gray boxes represent the detected and defined outbreak periods by the aerial surveys and are identified as O1 (1971–1985; 1980s outbreak), and OP (2010–present; current outbreak) using the nomenclature in Jardon et al. (2003), and Boulanger et al. (2012). The circles identify lepidopteran scale accumulation clusters representing potential outbreak events from 1967–present. Top panel: The solid smooth line represents the LOWESS with a 100-year smoothing window width used to determine the background accumulation rates (Cback), where everything above is considered a potential outbreak (Cpeak). Bottom panel: The Cpeak accumulations calculated as residuals along with the different percentile thresholds used. Dashed horizontal lines represent the 40th, 60th, 80th, and 95th percentile thresholds respectively, and the solid horizontal lines represent the 50th, 70th, 90th, and 99th percentile thresholds respectively above which the “true” outbreak events (Cfire) were identified.
The threshold-smoothing combinations yielding the highest Cohen’s Kappa (0.69) and MCC (0.70) were the 50th or 60th percentile thresholds applied using the 100-year smoothing window (Table 4). When using the 120-year smoothing window, we found the best agreement with the 60th percentile threshold, although this threshold yielded lower values for both statistics (0.06 less). For both smoothing window sizes, the poorest agreement was obtained with the 95th and 99th percentile thresholds (Table 4).
Discussion
Lepidopteran scales accurately identified outbreak periods. We observed a robust agreement in identifying outbreaks using both the sedimentary scale record and aerial surveys. The rate of agreement was slightly better when using a 100-year smoothing window to determine background accumulations than using a 120-year window. The 100-year window may be closer to three times the return interval typically used to estimate background accumulations (e.g. Blarquez et al., 2010) given the 30- to 40-year return interval of spruce budworm outbreaks over the 20th century (Blais, 1983; Boulanger et al., 2012; Boulanger and Arseneault, 2004; Morin, 1994). The larger 120-year window is at the upper end of the documented spruce budworm outbreak return interval and may be smoothing out too much variance (Supplemental Material S4); in certain cases, this causes some events to be categorized as background accumulations.
Additionally, the highest agreement between both proxies, applying the 100-year smoothing window, was achieved using the 50th or 60th percentile thresholds. After removing background accumulations, Cback, the 50th and 60th percentiles appear to be optimal, as they are sufficiently high thresholds to distinguish Cfire from Cnoise, but sufficiently low to retain scale accumulations that may represent smaller populations, that is, potentially less severe outbreaks.
Although lepidopteran scales and aerial surveys are both indicators of the spruce budworm presence around a lake, they represent different measures of the local presence of this defoliator. Lepidopteran scales are a direct measure of the local insect biomass and physical presence of adult spruce budworm moths within a stand, whereas aerial surveys are an indirect measure of spruce budworm presence, as they document the impact of the defoliator via stand-level defoliation. Generally, agreement between proxies would be expected to be high because a large adult moth population requires the occurrence of intense defoliation by a large well-fed larval population. Thus, by focusing on outbreak detection, as we have done in this study, the observed strong agreement between the proxy records was likely. However, focusing on outbreak severity could yield a different result, particularly at relatively fine spatial scales, such as for this study, because defoliated areas delineated by aerial surveys tend to be quite large, yet defoliation within these areas can be heterogeneous (Harris and Dawson, 1979; Kettela, 1982; MacLean and MacKinnon, 1996). Furthermore, the proportion of host trees in a given area becomes crucial as their abundance determines the area’s defoliation class. For example, two areas may both be considered severely defoliated; however, the proportion of host trees in one area may only comprise 10% of the basal area whereas in the other area, host trees may occupy >75%. At small spatial scales, it is therefore possible that the defoliation class does not necessarily correspond to the adult moth population found around a lake. Hence, this explains why we opted to compare outbreak detection between the two proxies in the form of presence/absence rather than focusing on outbreak severity.
A possible explanation as to why outbreaks are recorded by lepidopteran scales at certain sites and not at others may be related to lake-level taphonomical processes and the size of the catchment basin. Lepidopteran scales are a fairly reliable indicator of annual moderate and severe spruce budworm defoliation in the forest surrounding a lake, as scales are deposited and incorporated relatively rapidly into the lake sediment (Tremblay, 2022). Nonetheless, sediment deposition and mixing are highly site-dependent (e.g. Bennett and Buck, 2016; Conedera et al., 2009) and may influence the vertical and horizontal distribution of the scales in the sediment column, thereby affecting analyses. An altered distribution of scales in the sedimentary record may result in an outbreak being spread over a greater downcore depth, creating a signal similar to background accumulation. Conversely, background accumulations can be concentrated within a relatively small depth to create a false outbreak signal as demonstrated potentially by the one observed false positive in our study. Such processes may be dictated by lake basin shape subsequently affecting sediment accumulation (Bennett and Buck, 2016). In this study, we attempted to control for such processes statistically through the use of the CharAnalysis procedure that utilizes interpolation, differentiating between background accumulations (Cback) and potential outbreak events (Cpeak), and by applying a global threshold to further discriminate between potential outbreak and true outbreak events (Cfire), in addition to the use of outbreak clusters (see methods).
In addition to taphonomical processes, the dating of sediment is also associated with errors (e.g. Higuera et al., 2005), and age–depth models used to determine large lepidopteran scale accumulations may not be as precise as the aerial surveys which have an annual resolution (Supplemental material S1, S2). Finally, the size of the catchment basin for lepidopteran scale input may influence outbreak detection. Tremblay (2022) found a strong correlation between the current year’s lepidopteran scale accumulation and defoliation within a 200-m buffer around sampled lakes; however, scale catchment basins may be larger or smaller than initially thought potentially explaining possible outbreak identification mismatches between the proxies. Moreover, characterization and inclusion of surrounding topography along with further investigation using varying buffer radii around each lake (e.g. Smith et al., 2010), has the potential to elucidate lake-level lepidopteran scale catchment basin size and subsequent use of an appropriate buffer radius with the goal of maximizing “true” outbreak identification.
We demonstrated that lepidopteran scales are a reliable proxy for identifying spruce budworm outbreaks, as their abundance peaks in the sediment match observations via aerial surveys. More broadly, although outside the scope of this study but worth noting, lepidopteran scale accumulations of some of the sampled lakes appear to have also recorded the outbreaks of the early 20th century (1912–1929: lakes 1, Bois Joli, Buire, Bélanger; and 1946–1959: lakes 1, 2, 5, and Buire) detected by regional tree-ring chronologies (Boulanger et al., 2012; Boulanger and Arseneault, 2004; see Figure 2) with the caveat that local lake records may not always match regional trends due to changing and variable local conditions that influence defoliation and lepidopteran scale inputs that is, host-tree availability. In spite of this caveat, using this novel microfossil to reconstruct large spruce budworm population events over longer time scales is warranted (e.g. Navarro et al., 2018b). We note that peaks found at greater sediment depths are likely to represent more than one outbreak period because of a loss of temporal precision with increasing sediment depth. These comparisons using recent historical and known events help calibrate the sediment proxy record, emphasizing the importance of a multi-proxy approach. Moreover, this calibration of proxies ensures more accurate results and improved interpretations at millennial and multi-millennial scales.
Supplemental Material
sj-docx-9-hol-10.1177_09596836241236326 – Supplemental material for Lepidopteran scales in lake sediments as a reliable proxy for spruce budworm outbreak events in the boreal forest of Eastern Canada
Supplemental material, sj-docx-9-hol-10.1177_09596836241236326 for Lepidopteran scales in lake sediments as a reliable proxy for spruce budworm outbreak events in the boreal forest of Eastern Canada by Marc-Antoine Leclerc, Martin Simard, Olivier Blarquez and Hubert Morin in The Holocene
Supplemental Material
sj-jpg-1-hol-10.1177_09596836241236326 – Supplemental material for Lepidopteran scales in lake sediments as a reliable proxy for spruce budworm outbreak events in the boreal forest of Eastern Canada
Supplemental material, sj-jpg-1-hol-10.1177_09596836241236326 for Lepidopteran scales in lake sediments as a reliable proxy for spruce budworm outbreak events in the boreal forest of Eastern Canada by Marc-Antoine Leclerc, Martin Simard, Olivier Blarquez and Hubert Morin in The Holocene
Supplemental Material
sj-jpg-2-hol-10.1177_09596836241236326 – Supplemental material for Lepidopteran scales in lake sediments as a reliable proxy for spruce budworm outbreak events in the boreal forest of Eastern Canada
Supplemental material, sj-jpg-2-hol-10.1177_09596836241236326 for Lepidopteran scales in lake sediments as a reliable proxy for spruce budworm outbreak events in the boreal forest of Eastern Canada by Marc-Antoine Leclerc, Martin Simard, Olivier Blarquez and Hubert Morin in The Holocene
Supplemental Material
sj-jpg-3-hol-10.1177_09596836241236326 – Supplemental material for Lepidopteran scales in lake sediments as a reliable proxy for spruce budworm outbreak events in the boreal forest of Eastern Canada
Supplemental material, sj-jpg-3-hol-10.1177_09596836241236326 for Lepidopteran scales in lake sediments as a reliable proxy for spruce budworm outbreak events in the boreal forest of Eastern Canada by Marc-Antoine Leclerc, Martin Simard, Olivier Blarquez and Hubert Morin in The Holocene
Supplemental Material
sj-jpg-4-hol-10.1177_09596836241236326 – Supplemental material for Lepidopteran scales in lake sediments as a reliable proxy for spruce budworm outbreak events in the boreal forest of Eastern Canada
Supplemental material, sj-jpg-4-hol-10.1177_09596836241236326 for Lepidopteran scales in lake sediments as a reliable proxy for spruce budworm outbreak events in the boreal forest of Eastern Canada by Marc-Antoine Leclerc, Martin Simard, Olivier Blarquez and Hubert Morin in The Holocene
Supplemental Material
sj-jpg-5-hol-10.1177_09596836241236326 – Supplemental material for Lepidopteran scales in lake sediments as a reliable proxy for spruce budworm outbreak events in the boreal forest of Eastern Canada
Supplemental material, sj-jpg-5-hol-10.1177_09596836241236326 for Lepidopteran scales in lake sediments as a reliable proxy for spruce budworm outbreak events in the boreal forest of Eastern Canada by Marc-Antoine Leclerc, Martin Simard, Olivier Blarquez and Hubert Morin in The Holocene
Supplemental Material
sj-jpg-6-hol-10.1177_09596836241236326 – Supplemental material for Lepidopteran scales in lake sediments as a reliable proxy for spruce budworm outbreak events in the boreal forest of Eastern Canada
Supplemental material, sj-jpg-6-hol-10.1177_09596836241236326 for Lepidopteran scales in lake sediments as a reliable proxy for spruce budworm outbreak events in the boreal forest of Eastern Canada by Marc-Antoine Leclerc, Martin Simard, Olivier Blarquez and Hubert Morin in The Holocene
Supplemental Material
sj-jpg-7-hol-10.1177_09596836241236326 – Supplemental material for Lepidopteran scales in lake sediments as a reliable proxy for spruce budworm outbreak events in the boreal forest of Eastern Canada
Supplemental material, sj-jpg-7-hol-10.1177_09596836241236326 for Lepidopteran scales in lake sediments as a reliable proxy for spruce budworm outbreak events in the boreal forest of Eastern Canada by Marc-Antoine Leclerc, Martin Simard, Olivier Blarquez and Hubert Morin in The Holocene
Supplemental Material
sj-jpg-8-hol-10.1177_09596836241236326 – Supplemental material for Lepidopteran scales in lake sediments as a reliable proxy for spruce budworm outbreak events in the boreal forest of Eastern Canada
Supplemental material, sj-jpg-8-hol-10.1177_09596836241236326 for Lepidopteran scales in lake sediments as a reliable proxy for spruce budworm outbreak events in the boreal forest of Eastern Canada by Marc-Antoine Leclerc, Martin Simard, Olivier Blarquez and Hubert Morin in The Holocene
Footnotes
Acknowledgements
We thank the two anonymous reviewers, Dr. Allan Carroll, and Dr. Murray Hay for constructive feedback on earlier versions of the manuscript, François Gionest for help in the field, and Marika Tremblay and Guillaume Vigneault for help in the laboratory.
Funding
The author(s) disclosed receipt of the following financial support for the research, authorship, and/or publication of this article: The author(s) received funding from the “NSERC Industrial Research Chair on black spruce growth and the effect of the spruce budworm on landscape heterogeneity in the boreal forest.”
Supplemental material
Supplemental material for this article is available online.
References
Supplementary Material
Please find the following supplemental material available below.
For Open Access articles published under a Creative Commons License, all supplemental material carries the same license as the article it is associated with.
For non-Open Access articles published, all supplemental material carries a non-exclusive license, and permission requests for re-use of supplemental material or any part of supplemental material shall be sent directly to the copyright owner as specified in the copyright notice associated with the article.