
Abstract
This study reconstructs Mid- to Late-Holocene aeolian activity based on lacustrine sediments from a small pond, Nøkktjønna, situated ~1.5 km northeast from the coast, and stratigraphical investigations of coastal dunes at Fjærvoll, Langøya in Vesterålen, northern Norway. Several methods have been used to reconstruct catchment processes from the lacustrine record, including analyses of lithostratigraphy, organic content, magnetic susceptibility, and grain size, combined with high-resolution X-ray fluorescence (XRF) and Computed Tomography (CT) scanning. The content of coarse mineral grains (>125 μm) has been quantified throughout the lacustrine core by manual wet sieving and by conducting threshold analysis from the high-resolution CT-scans. Considering the setting of the drainage basin of Nøkktjønna, the mineral grains (>125 μm) in the sediment core are suggested to have been deposited by aeolian transportation from the nearby aeolian dunes and beach sand during storm events. Five periods of intensified aeolian influx (defined here as influx values above the 90th percentile) are identified. These periods occurred around ~6950, ~6500, ~6100–6000, 5800–5750 and ~350–20 cal. yr BP cal. yr BP, with the last period being the most intense. The increased influx in aeolian sand to Nøkktjønna is suggested to be associated with a combination of changes in the storm track pattern, sea-level fluctuations, conditions of snow cover/frozen surface and increased anthropogenic influence. The highest influx rates are recorded between CE 1600 and 1930, corresponding to the ‘Little Ice Age’ (LIA), which is a well-known period of high storminess in the North Atlantic region.
Introduction
Northern Norway is situated on the north-eastern fringe of the North Atlantic storm track pattern, which is a system strongly influencing the weather and climate in northern Europe (e.g. Rogers, 1997). Storms in the North Atlantic are most intense during wintertime, causing enhanced poleward energy transport. Moreover, warm northeast-moving ocean-currents are contributing to the mild maritime climate at this latitude (68°N) of the Norwegian coast. Jointly, the atmospheric circulation patterns and the warm ocean currents produce a unique and highly sensitive climatic setting, making it a key area for investigating and reconstructing past variability.
Extreme weather can be defined in different ways, but can in general be described as low probability or ‘rare’ meteorological events (e.g. Hegerl et al., 2011). In the last decades, several devastating cyclones have struck the Norwegian coastline, causing severe damage in the Nordic region (e.g. Kjølle et al., 2013). Meteorological observations in Norway cover the last ~150 years and form the main basis of our understanding of present and future atmospheric circulation (e.g. Førland et al., 2016). However, to fully capture the natural variability of storms and to detect changes in the frequency and intensity of storms over centennial timescales (storminess), we need longer time-series providing a context to present and future climate variability (Goslin and Clemmensen, 2017). It is therefore essential to obtain information showing both past climate variability and storm events over centennial to millennial timescales to better understand patterns of storminess, and to design effective adaptation strategies for a changing climate.
Understanding past environmental change relies on investigations of natural archives that incorporate a climate-dependent signal (proxy-records). Aeolian processes can transport sand-sized particles for long distances during periods of high wind conditions or storm events, and these particles have the potential to be deposited and preserved in nearby lakes and bogs (DeVries-Zimmerman et al., 2014). Promising approaches to infer past storminess include the quantification of aeolian sand influx from sand beaches and dune fields into small ponds, lakes and bogs (e.g. Björckl and Clemmensen, 2004; De Jong et al., 2006; Goslin et al., 2018, 2019; Kylander et al., 2020, 2023; Nielsen et al., 2016b, 2016c; Orme et al., 2016a; Sjögren, 2009) and compiled records of sand mobilization events from aeolian dune stratigraphies (e.g. Clarke and Rendell, 2009; Clemmensen et al., 2009; Wilson et al., 2004). A major advantage of using sand influx, is that it can produce continuous and undisturbed data representing the storminess, providing insight into aspects of palaeoclimatic extremes that is not readily available from other climate proxies. A recent paper by Kylander et al. (2023) introduces ‘storm stacks’ to produce regional comparisons of sand influx data in order to account for site-specific responses between the archives and climate. Kylander et al. (2023) propose using changepoint modelling to build the storm stacks. This implies that there are several comparable and well dated studies/datasets from the region that could be included in the modelling, which is not the case yet for northern Norway and northern Sweden. However, this tool will be valuable when studying and understanding the regional patterns of past atmospheric circulation.
In this study we present three sediment records from Fjærvoll on Langøya in Vesterålen, northern Norway, which is exposed to south-westerly storms. The main objectives are to identify and determine the sand influx to lake Nøkktjønna and the coastal dunes and discuss the link between the variation in sand influx, aeolian activity, human influence and storminess in the study area.
Study area
Fjærvoll is a small village located on the southwestern coast of Langøya (68.65°N, 14.44°E) (Figure 1), which is part of the Lofoten–Vesterålen archipelago in northern Norway. The coastal area at Fjærvoll is dominated by a 700-m-long sandy beach called Fjærvollsanden with vegetated aeolian foredunes (Figure 2). Precambrian magmatic and metamorphosed gneiss dominates the bedrock lithology at Fjærvoll, being among the oldest rocks in Norway (Tveten, 1978).
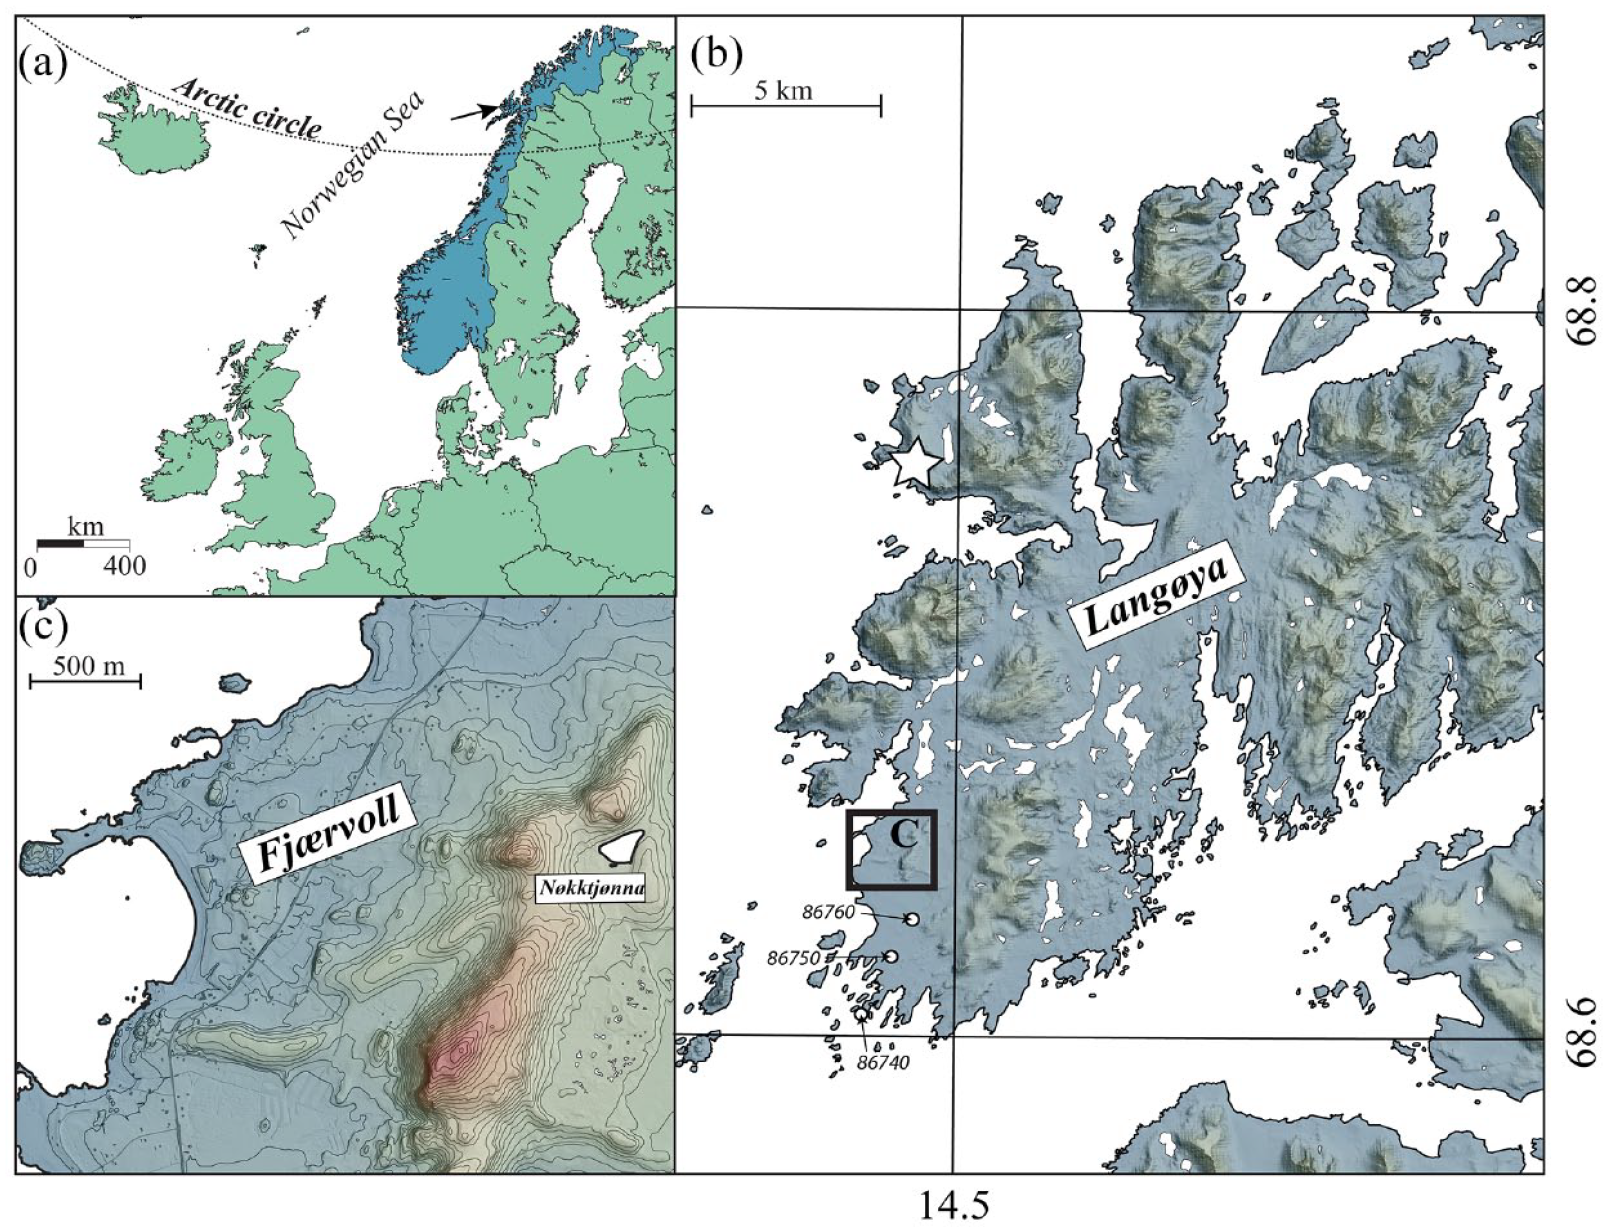
Overview maps of the study area in northern Norway. (a) shows the location of the study area in northern Europe (black arrow). (b) Shows a close-up of western part of Langøya with the study area (Fjærvoll) marked by a black square. The star-symbol in B marks the study area of Nielsen et al. (2016c) and open circles shows the locations of the three meteorological stations used for calculating drift potential (see Figure 3). (c) Map showing the study area at Fjærvoll.
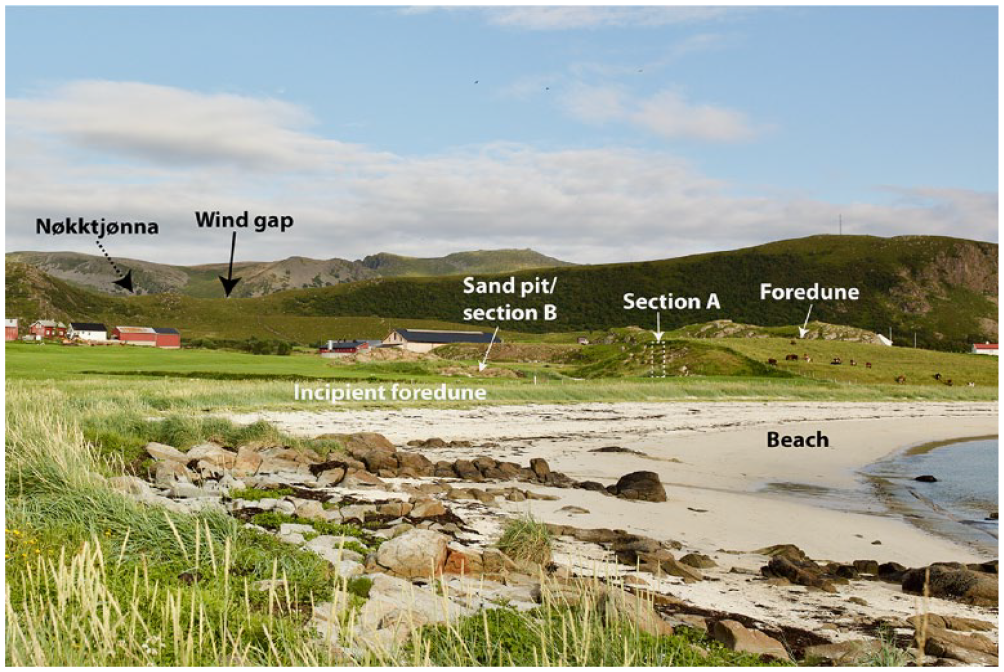
The present beach and foredune (with cows as scale) at Fjærvoll. Picture taken towards the southeast (Fjærvollfjellet and Fjærvollen moraine in the background).
Nøkktjønna is a small pond (12,400 m2) with a maximum depth of 4 m situated ~1.5 km north-east of the beach at Fjærvoll in a small cirque-like depression at 61 meter above present sea level (m a.s.l.) (Figure 1c). Nøkktjønna has a total drainage area of 0.11 km2 and the outlet drains towards northeast. No streams are entering the lake. There are signs of former peat harvesting by humans in the southern and southwestern (highest) part of a bog located south of the lake (see discussion). Three mountains/hills are sheltering Nøkktjønna, Fjærvollfjellet (160 m a.s.l.) to the south, Svartknausen (120 m a.s.l.) to the west and Nøkkhammaren (106 m a.s.l.) to the north. A large terminal moraine (Røssåsen) from the deglaciation is damming the eastern side of the lake, thus the lake is of glacial origin. A gap between Fjærvollfjellet and Svartknausen at 90 m a.s.l. leads down towards the sea at Fjærvoll (Figure 2).
The deglaciation and sea level history of the region has been investigated and discussed for over a century (e.g. Ahlmann, 1919; Alsos et al., 2020; Balascio et al., 2011; Marthinussen, 1962; Möller and Sollid, 1972; Møller, 1986; Møller, 1982; Rasmussen, 1984; Vorren et al., 1988, 2015; Vorren and Moe, 1986). The northwestern part of Andøya, north of the study area, was ice free during the Late Weichselian (MIS 2) and is one of the key areas for understanding the last glacial maximum in northern Europe. The deglaciation of Langøya is discussed in Möller and Sollid (1972) and Rasmussen (1984). An approximately 1.5 km long terminal moraine is situated at Fjærvoll, with an age estimated between ~13400– and 17500 cal. yr BP (Möller and Sollid, 1972; Rasmussen, 1984). The deglaciation of the study area is suggested to correspond to the local Langøy or Skogvoll events (Vorren et al., 2015), demonstrating the potential for recovering long climate records in the region.
Several raised beach-ridges are observed up to 14 m a.s.l. in the area. Rasmussen (1984) interprets the marine limit (ML) at Fjærvoll to be ~10m a.s.l. based on the observation of shore deposits at the base of the Fjærvoll terminal moraine. During the early Holocene, the relative sea level (RSL) was probably below present until the Early to Mid-Holocene (Tapes) transgression, which reached a maximum level of 5–8 m above present sea level at ~6800cal. yr BP based on a simulated geometric model (Møller, 1989; Møller and Holmeslet, 1998). A distinct beach ridge at ~9 m a.s.l. at Fjærvoll is interpreted to be from this period. It is assumed that there has been a gently falling sea level at the study site following the Tapes transgression (Møller, 1989). The present tidal range at Fjærvoll is 258 cm based on predicted tides from Andenes with time difference −5 min and range factor of 1.01 (Tidevannstabeller, 2020). The highest measured storm surge at Andenes was 333 cm during an extreme event in November CE 2011. The lowest measured tide level is −26 cm in April CE 1993 (Tidevannstabeller, 2020).
Wind climate
Due to the large-scale pattern of North-Atlantic atmospheric circulation and transportation of warm waters by the Norwegian Atlantic current, the climate at Fjærvoll is maritime with temperatures well above the latitudinal average. The meteorological data used in this study is collected from three stations (sta. no. 86750, 86760, 86740), which has been moved slightly through time due to changing observers (from manual to automatic measurements) (see Figure 1). The mean (CE 1961–1990) summer temperature (Jun–Aug) at Bø (Sta. no. 86760), approximately 5.6 km south of the study area, is 11.2°C and the mean winter temperature (Dec–Feb) is −1.2°C. Annual precipitation is ~1000 mm (DNMI, 2021). Average wind speed at Bø was 4.5 m/s for the period 1961–2019, although there are some seasonal variations with 5.1m/s for wintertime (Oct–Mar) and 3.9 m/s for summertime (Apr–Sept). Storms, here defined as average winds >11 m/s (e.g. Clemmensen et al., 2014), usually blow from the sector SSW–NNW, although winds from the S, N and E are most common during the measured period (Figure 3b and c). During an extreme event in February 2015, an average wind speed (10-min measurements) of 30.6 m/s was recorded, with gusts reaching 39.5 m/s. Average wind speeds >20 m/s was recorded over a period of 10 h during this storm. Over a year, wind gusts exceeding 11, 15 and 20 m/s occur 13.1, 4.0 and 0.56 % of the time, respectively (DNMI, 2021).
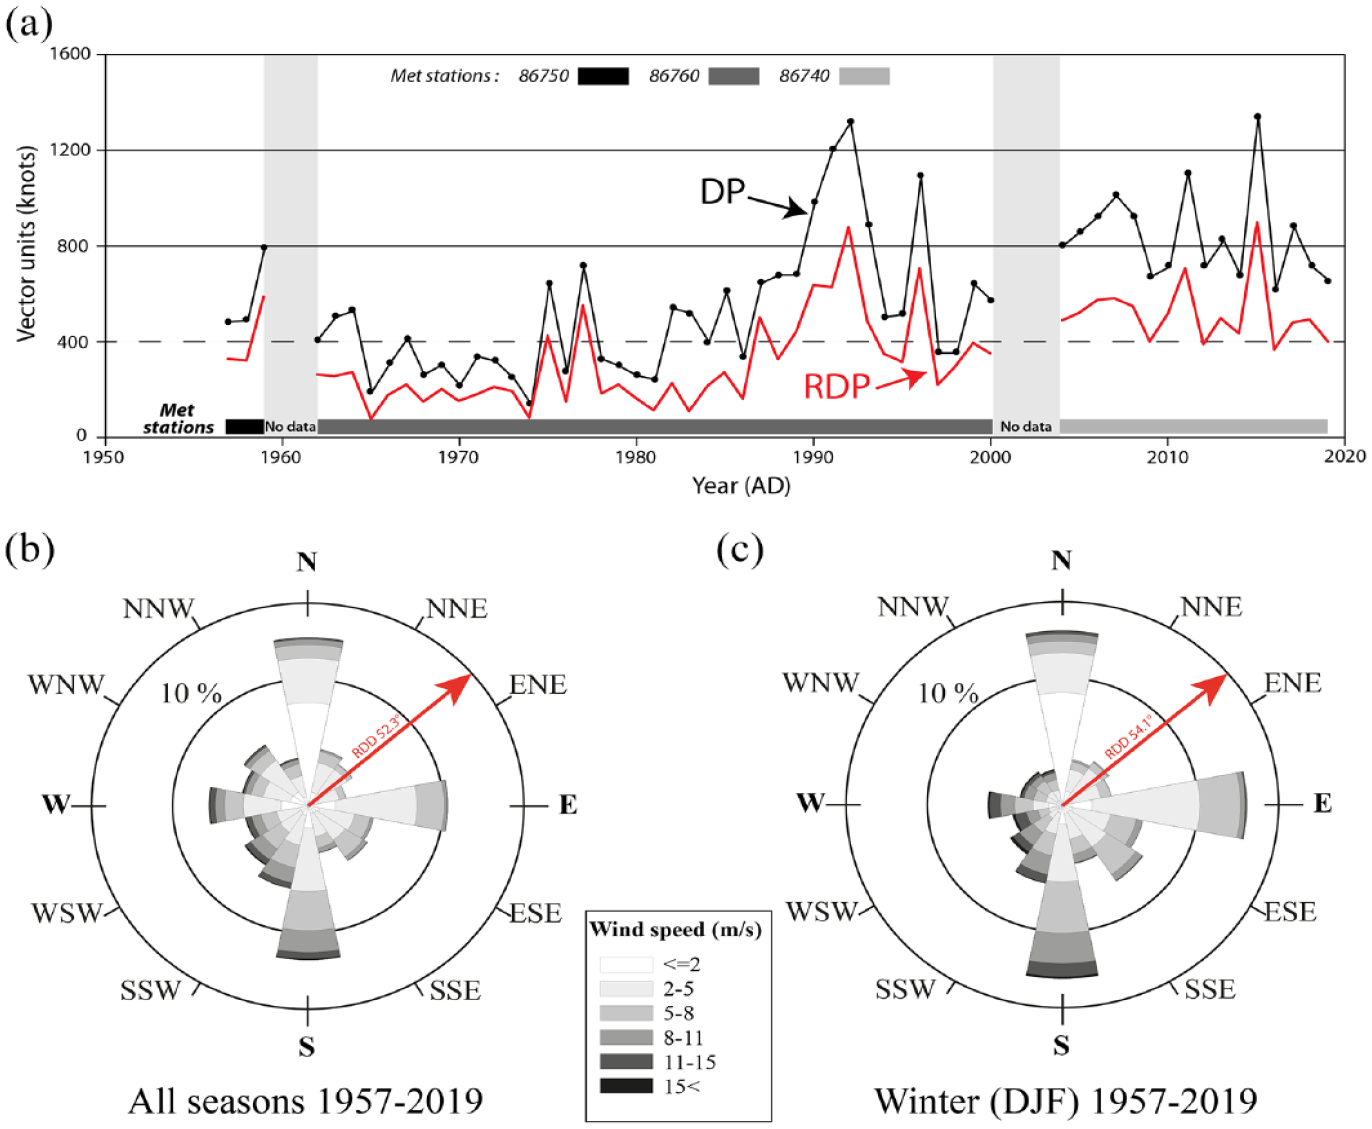
(a) Drift potential (DP, black line) and resultant drift potential (RDP, red line) calculated for the three meteorological stations at Bø (86750, 86760, 86740). (b and c) are showing the wind climate at Bø for all seasons and winter season, respectively.
The ‘Fryberger Method’ (e.g. Bullard, 1997; Fryberger et al., 1979) has been used to calculate and quantify the potential transport capacity of the wind in the study area, estimating the drift potential (DP) in vector units, resultant drift potential (RDP) and resultant drift direction (RDD). For calculating the annual DP, RDP and RDD, diurnal data (average wind speed and wind-direction at 12 PM) from the three weather stations at Bø covering the period CE 1957–2019 were used. The calculation was done using the Windrose PRO3 software (www.enviroware.com). Following Fryberger et al. (1979), the threshold value for aeolian transportation was set to 6 m/s. The DP estimates the potential sand transport by the wind, and wind environment of DP > 400 vector units are normally classified as high-energy environment, while 200–400 and <200 vector units are classified as intermediate- and low-energy environments, respectively (Fryberger et al., 1979). Figure 3 shows the results of the analysis indicating that Bø is situated in a high-energy wind environment, with an average DP of 600 vector units over the measurement period, and a maximum of 1340 measured in CE 2015. The RDD is averaging around 55° for the whole period, indicating net drift towards the northeast.
Methods
Fieldwork
Landforms and surficial deposits at Fjærvoll were mapped and categorised according to primary depositional processes during a 2-week long field campaign in summer CE 2018. The geomorphological mapping focused on aeolian and marine deposits around Fjærvoll and surficial deposits in the catchment of Nøkktjønna (Figure 4). Field mapping was conducted using ESRI Collector for ArcGIS (now ArcGIS FieldMaps).
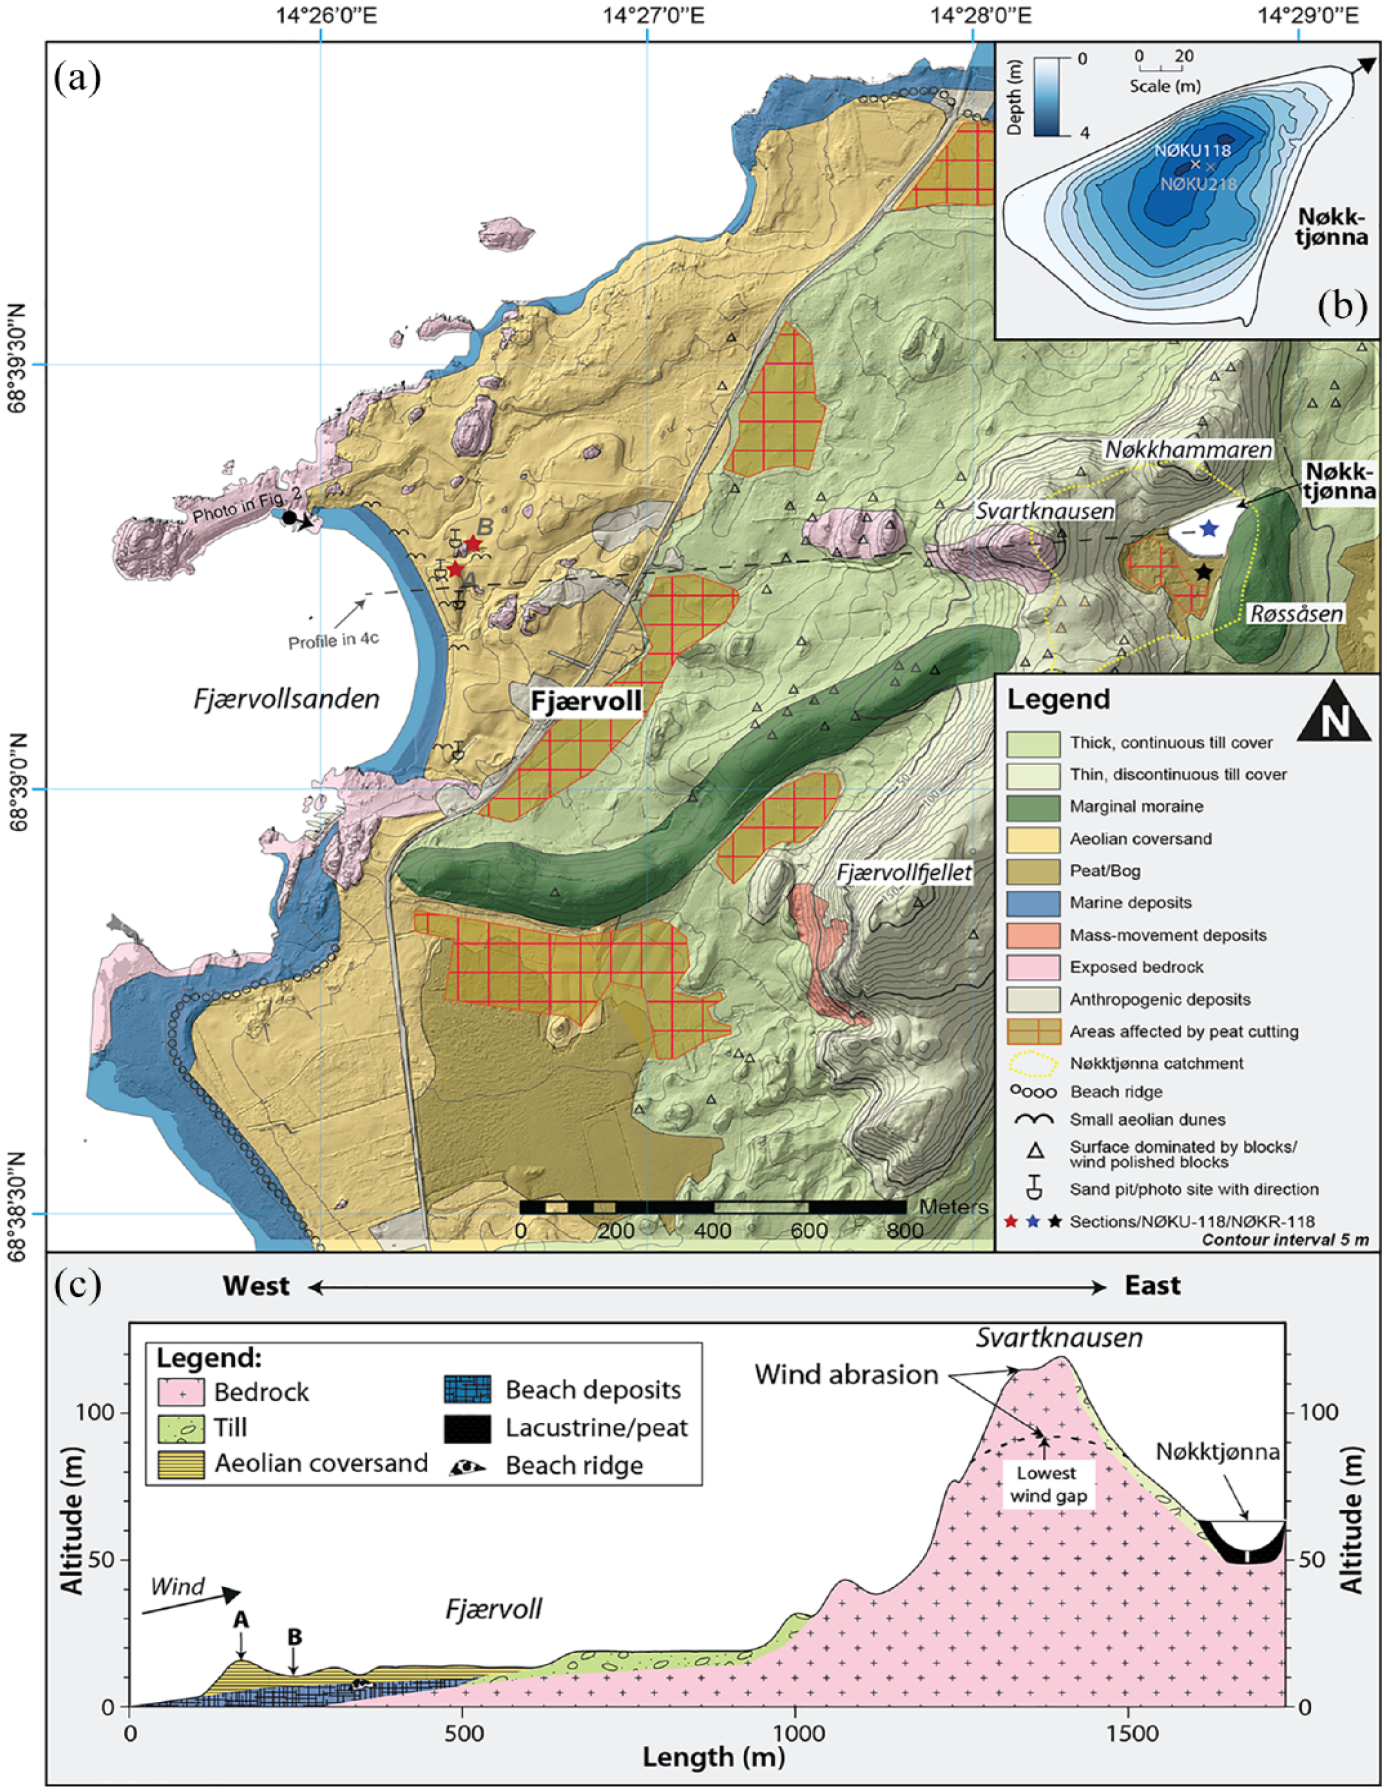
(a) Geomorphological map of the study area with coring sites (NØKU118/NØKR118) and sections (A and B) marked. (b) A bathymetrical map of Nøkktjønna. (c) A longitudinal and schematic cross-section showing a West-East transect from Fjærvollsanden to Nøkktjønna (see line in A). The profile displays surficial sediments which is important for the interpretation of the sedimentary archive in Nøkktjønna.
Two natural exposed sections near the present beach were logged (Section A and B), and sediment cores from the distal lake Nøkktjønna and the adjacent bog were analysed and dated to study past aeolian activity in the area. Catchment samples from the beach (n = 1) (1.7 m a.s.l.) and the top of the foredune (Secion A) (n = 1) (13 m a.s.l.) were collected during fieldwork and measured for grain-size using a Malvern Mastersizer 3000 following removal of CaCO3 and organic material with 10% hydrochloric acid and 35% H2O2 aqueous solution, respectively. Grain size statistics were calculated using Gradistat v.8, and (Blott and Pye, 2001).
Nøkktjønna was surveyed with a Garmin Echosounder fixed to a Garmin GPSmap 721xs chart plotter to produce a bathymetric map prior to coring (Figure 4b). Two sediment cores of similar length (NØKU118 and NØKU218) were retrieved from the deepest part of the lake (4 m depth) using an Uwitec gravity corer with 90 mm core diameter from a rubber boat. Due to a dense layer in the lake sediments, both Uwitec cores stopped at ~110 cm sediment depth. The bog south of Nøkktjønna was cored with a 75 mm ‘Russian’ peat corer (e.g. Jowsey, 1966). A coring location well away from the mapped ditches from peat harvesting was chosen, which in this case meant close to the margin of the bog (Figure 4). The peat core (NØKR118) covers 550–130 cm depth of the bog in five 1-m long sections. Several attempts were made to retrieve the upper 130 cm of the bog stratigraphy, however, due to low consolidation the peat corer was not able to properly cut out a sample from this uppermost section. The cores were carefully transported upright and stored in cold room (4°C) prior to further analysis in lab. During the transportation and storing, the uppermost part of the lake sediments (sediment-water interface) was compacted ~10–15 cm.
Sediment analyses
Both cores from Nøkktjønna share the same stratigraphy and length, however the laboratory analyses were only conducted on one core (NØKU118). The core was first scanned with a high-resolution CT-scanner (ProCon X-Ray CT-Alpha computed tomography). The core was scanned using 120 kV tube voltage, 850 μA current and an exposure time of 500 ms, resulting in an isotropic voxel resolution of 53.4 μm. To reduce beam hardening a 0.5 mm thick Cu-filter was used during scanning. To reduce file sizes and computing power demands, the CT slices were binned four times, giving a final voxel resolution of 204 μm. Further processing, visualization, detection of particles, segmentation, and analysis were done using Avizo 2020.2 (Thermo Fisher) software. The result of the CT-scanning is shown as greyscale values, representing the relative density in the sediment core. Based on visual inspection of the results, a segmentation threshold of 2800 greyscale values were set to differentiate between the ‘organic’ matrix (low relative density) and minerogenic particles (high relative density). Following the methodology of Cederstrøm et al. (2021), the minerogenic particles (>2800 grey scale value) were further analysed and the number of grains >300 μm quantified throughout the core. The chosen grain size (>300 μm) is dependent on the voxel resolution of the CT-scanning (pixel size), grains smaller than 300 μm were difficult to count due to the partial-volume effect (e.g. Ketcham and Carlson, 2001). The results were extracted volumetrically (0.5 cm3) and sampled to a resolution of 0.5 cm in the centre of NØKU118.
After being split lengthwise, the cores were visually inspected and logged. Geochemical analysis was performed on NØKU118 using an Itrax XRF core scanner (Croudace et al., 2006). The measurement was conducted using a Molybdenum (Mo) X-ray tube every 500 μm (n = 1924) with power set to 28 kv and 27 mA, and with an exposure time of 10 s. Except for iron (Fe), most of the elements have rather low count rates (<1000 counts per second), which is not uncommon for organic-rich sediments due to poorer detection limits compared to minerogenic sediments (Croudace et al., 2006). To eliminate matrix effects in the XRF-data (e.g. Tjallingii et al., 2007) and producing better signal of relative change in chemical composition (e.g. Weltje and Tjallingii, 2008), centred log-transformation (CLR) was applied. Following this, the core was scanned every 0.2 cm with a CoreSusc MK III magnetic susceptibility corelogger (n = 481).
Organic content, dry bulk density (DBD) and ignition residue (IR) were measured every 0.5 cm (1 cm3) by the loss-on-ignition (LOI) method (Dean, 1974; Heiri et al., 2001). The samples were first weighed for wet bulk density and dried at 105°C for 12 h before being weighed for dry bulk density (g/cm3) and calculation of water content (%). The samples were then ignited at 550°C for 1 h, cooled in a desiccator, and weighed. LOI was calculated based on the percentage change between the dry weight and ignition residue (IR).
Following the procedure of Nielsen et al. (2016c), the IR was sieved through 250 and 125 μm meshes (n = 191) in order to determine the amount of sand grains in the core. Mineral grains >250 μm were counted under the microscope, while grain sizes between 125 and 250 μm were weighed and calculated as percentage (%) of IR.
The uppermost 15 cm of NØKU118 were subsampled every 0.5 cm (n = 30) and analysed for the activity of 210Pb and 137Cs via gamma-spectrometry at the Gamma Dating Center, University of Copenhagen. The measurements were carried out on a Canberra ultralow-background Ge-well-detector. 210Pb was measured via its gamma-peak at 46,5 keV, 226Ra via the granddaughter 214Pb (peaks at 295 and 352 keV) and 137Cs via its peak at 661 keV.
In total, 20 samples were extracted for 14C-dating (Table 1). Eleven of these were picked out from selected intervals in the lake core (NØKU118) and three from the bog (NØKR118), while six samples were collected from sections A and B near the present beach. Since only fragments of terrestrial macrofossils (mostly leaf fragments), bones and shells were obtained, it was not possible to identify them to the species level for each sample. The samples were submitted for accelerator mass spectrometry (AMS) at the Poznań Radiocarbon Laboratory in Poland and at Beta analytics in Miami, United States. The IntCal20- (Reimer et al., 2020) and Marine20 (Heaton et al., 2020) calibration curves were employed in the online radiocarbon calibration program CALIB 8.2 (Stuiver and Reimer, 1993) for calibrating terrestrial and marine samples, respectively. ΔR was set to 61 ± 16 years based on data from marine molluscs in northern Norway (Mangerud et al., 2006).
Radiocarbon dates from the study sites.
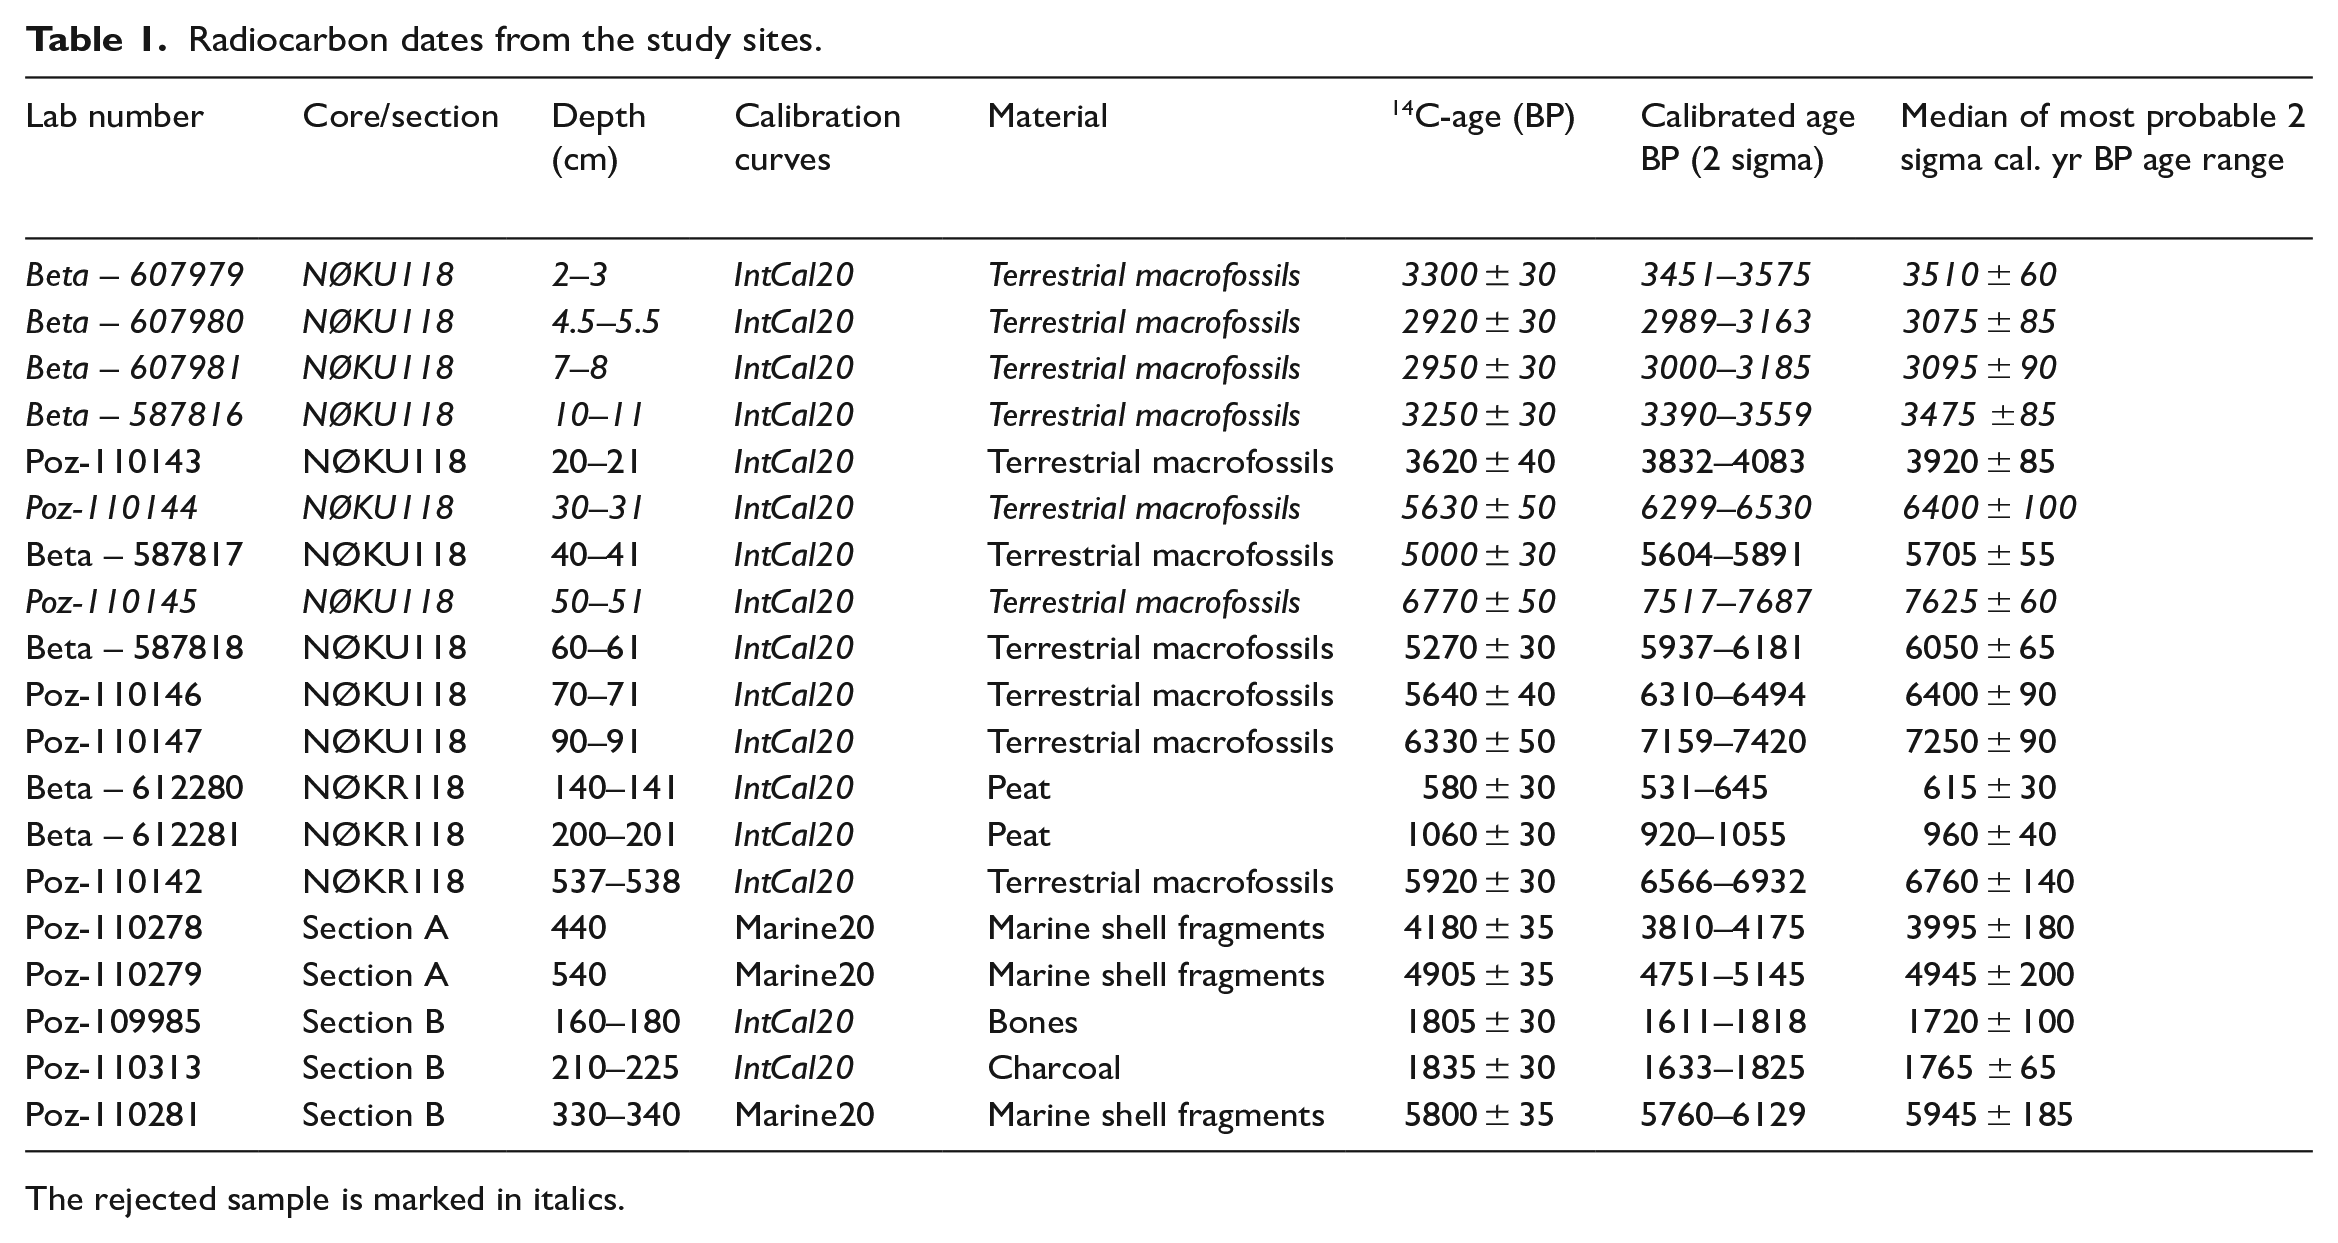
The rejected sample is marked in italics.
Results
Geomorphological context and studied sections
A geomorphological map was produced in ArcGIS after field work (Figure 4). The beach at Fjærvoll is composed of medium to coarse, moderately sorted, shell-rich sand, with a mean grain size of 340 μm and sorting of 1.729. A ~140 m long, 80 m wide and up to ~14 m high well vegetated foredune is observed behind the present beach. The foredune has an asymmetrical profile, with three distinct levels situated at 3, 8 and 14 m a.s.l. The northern part of the foredune at Fjærvoll was earlier used as a sand pit, where sand was extracted for local purposes (Elvik, 2009). The present landform is therefore anthropogenically influenced, and much reduced in size relative to its original extent. The catchment sample from the top of the foredune show mean grain size of 345 μm and sorting of 1.497, corresponding to a moderately well sorted medium sand. During fieldwork, local farmers informed about active aeolian/niveo-aeolian activity during winter-storms (usually storms from southwest and northwest), leaving a visible sand sheet on snow stretching from the beach and at least 600 m inland (across the main road) (pers. Com. Nils Erik Klaussen). Niveo-aeolian processes is common in arctic and sub-arctic climates and involves the process by which sediments (normally sand sized particles) are transported by wind and deposited on or mixed with snow (e.g. Koster and Dijkmans, 1988).
Aerial photos from the Norwegian Mapping Authority (WF-0930 from CE 1957) and historical images from CE 1900 to 1940s indicates that coastal erosion and aeolian processes were much more pronounced based on the observations of larger areas of exposed sand compared to present day. Today, most of the dunes at Fjærvoll are stable with densely vegetated surfaces used for grazing, although some small blowouts are still active in isolated patches close to the present beach. The area landwards of the foredune are predominantly covered by aeolian sediments (Figure 4). Today, most of these areas are used for grazing and cultivation. Wind-abrasion was observed on the western side of boulders in ablation till, situated in the gap between Svartknausen and Fjærvollfjellet (Figure 4).
The sedimentary structures of Sections A (8–14 m a. s. l.) and B (4.5–9 m a. s. l.) are presented in Figure 5. Section A (the foredune) consists of rather homogenous medium to coarse sand with shell fragments. A few dark laminae are visible throughout the 6-m Section, but no plant remains were found in the laminae. Two samples of shell fragments at 5.4 and 4.4 m depth (8.6 and 9.6 m a. s. l.) have been dated, giving ages of 4945 ± 200 and 3995 ± 180 cal. yr BP, respectively.
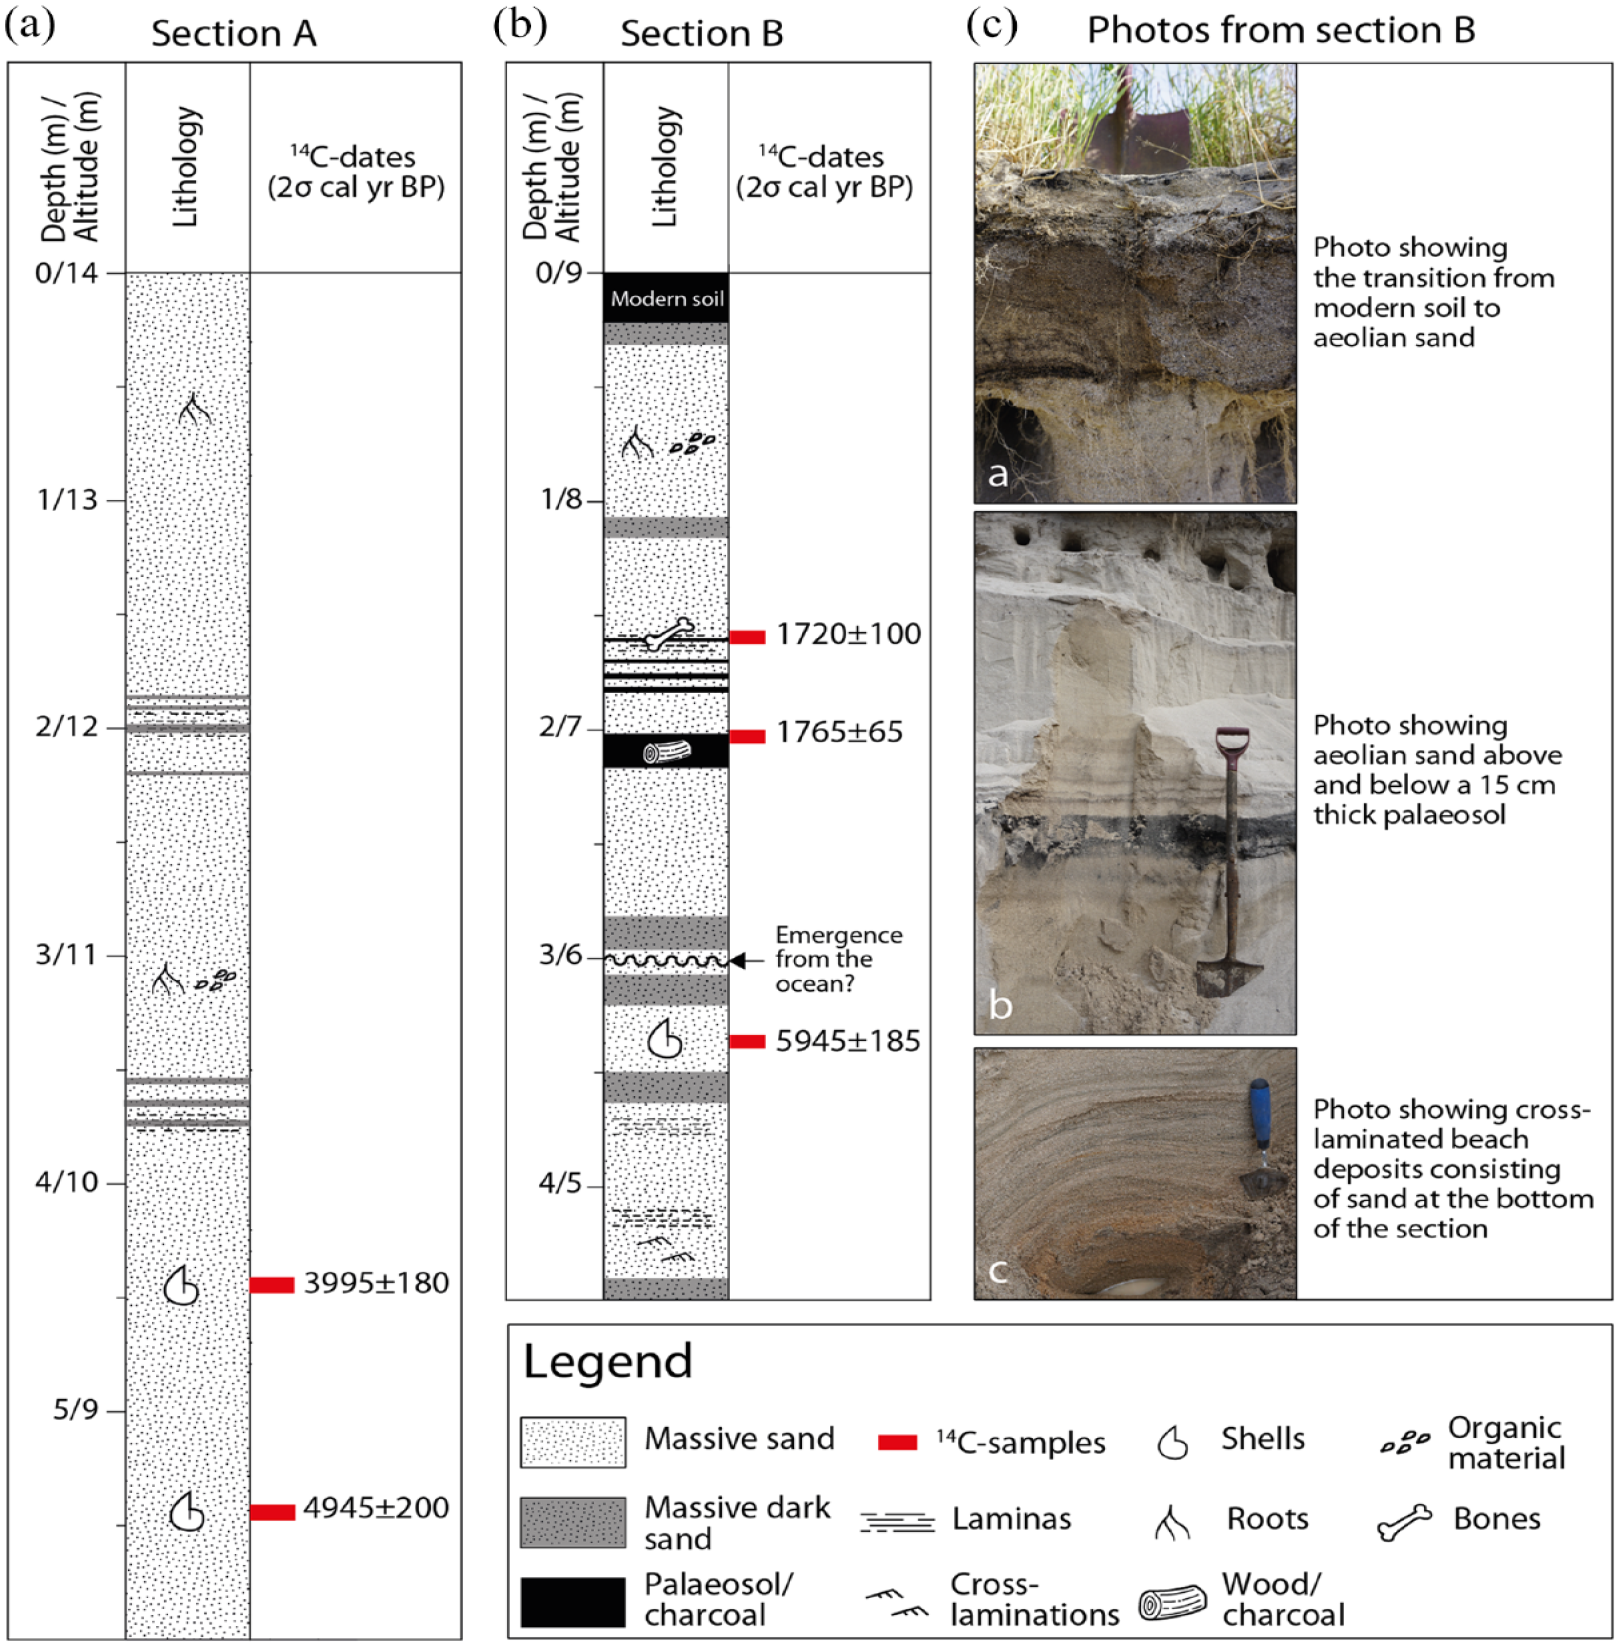
Lithostratigraphy and 14C dates from the foredune (A) and sand pit (B). The pictures show hand-dug exposures corresponding to different areas in Section B (from top to bottom: (a) uppermost limit of the Section showing modern soil, (b) aeolian sand and palaeosols at ~2 m depth and (c) the lowermost part of the Section showing cross-laminated sand).
Section B is an old sand pit situated ~200 m inland from the present beach, and ~80 m northeast of Section A. The sand pit was in active use from CE 1945 to 1960. The lowermost part of the Section, 4.5–3.3 m depth (4.5–5.7 m a. s. l.), contains laminated and cross-laminated sand with shell fragments deposited above a red-coloured and iron rich compact layer at the water table. From 3.2 to 2.25 m (5.8–6.75 m a. s. l.) the lithostratigraphy is mainly homogenous sand with shell fragments, although some darker layers with higher content of calcium carbonate are observed at 3.1 m and 2.9 m depth. Some shell fragments from 3.3 m depth (5.7 m a. s. l.) were dated to 5945 ± 185 cal. yr BP. A 15 cm thick charcoal-rich layer is observed between 2.25 and 2.1 m (6.75–6.9 m a. s. l.). Fragments of charcoal from this layer were dated to 1765 ± 60 cal. yr BP. From ~2 to 1.5 m there is increasing content of thin (<2 cm) undulating layers and laminae containing charcoal with bone fragments in-between. One bone fragment from between 1.8 and 1.6 m depth (7.2–7.4 m a. s. l.) was dated to 1720 ± 30 cal. yr BP. From 1.5 to 0.3 m the stratigraphy is mainly composed of homogenous and structureless sand. The upper part (0.3 m) of the Section is composed of well-developed soil with roots.
The peat core (NØKR118) is not described in detail due to an uncomplete record (missing the upper part). However, the core has been sampled for radiocarbon dating (see below).
Lake sediment analysis
The sediment cores from lake Nøkktjønna consist of homogeneous, dark brown, fine-grained sediments from top to bottom, apart from a thin light-coloured sand-rich layer between ~0.5 and 2 cm depth (Figure 6). Individual light-coloured sand-grains are visible through the transparent core-tube across the whole length of the cores, although with varying frequency.
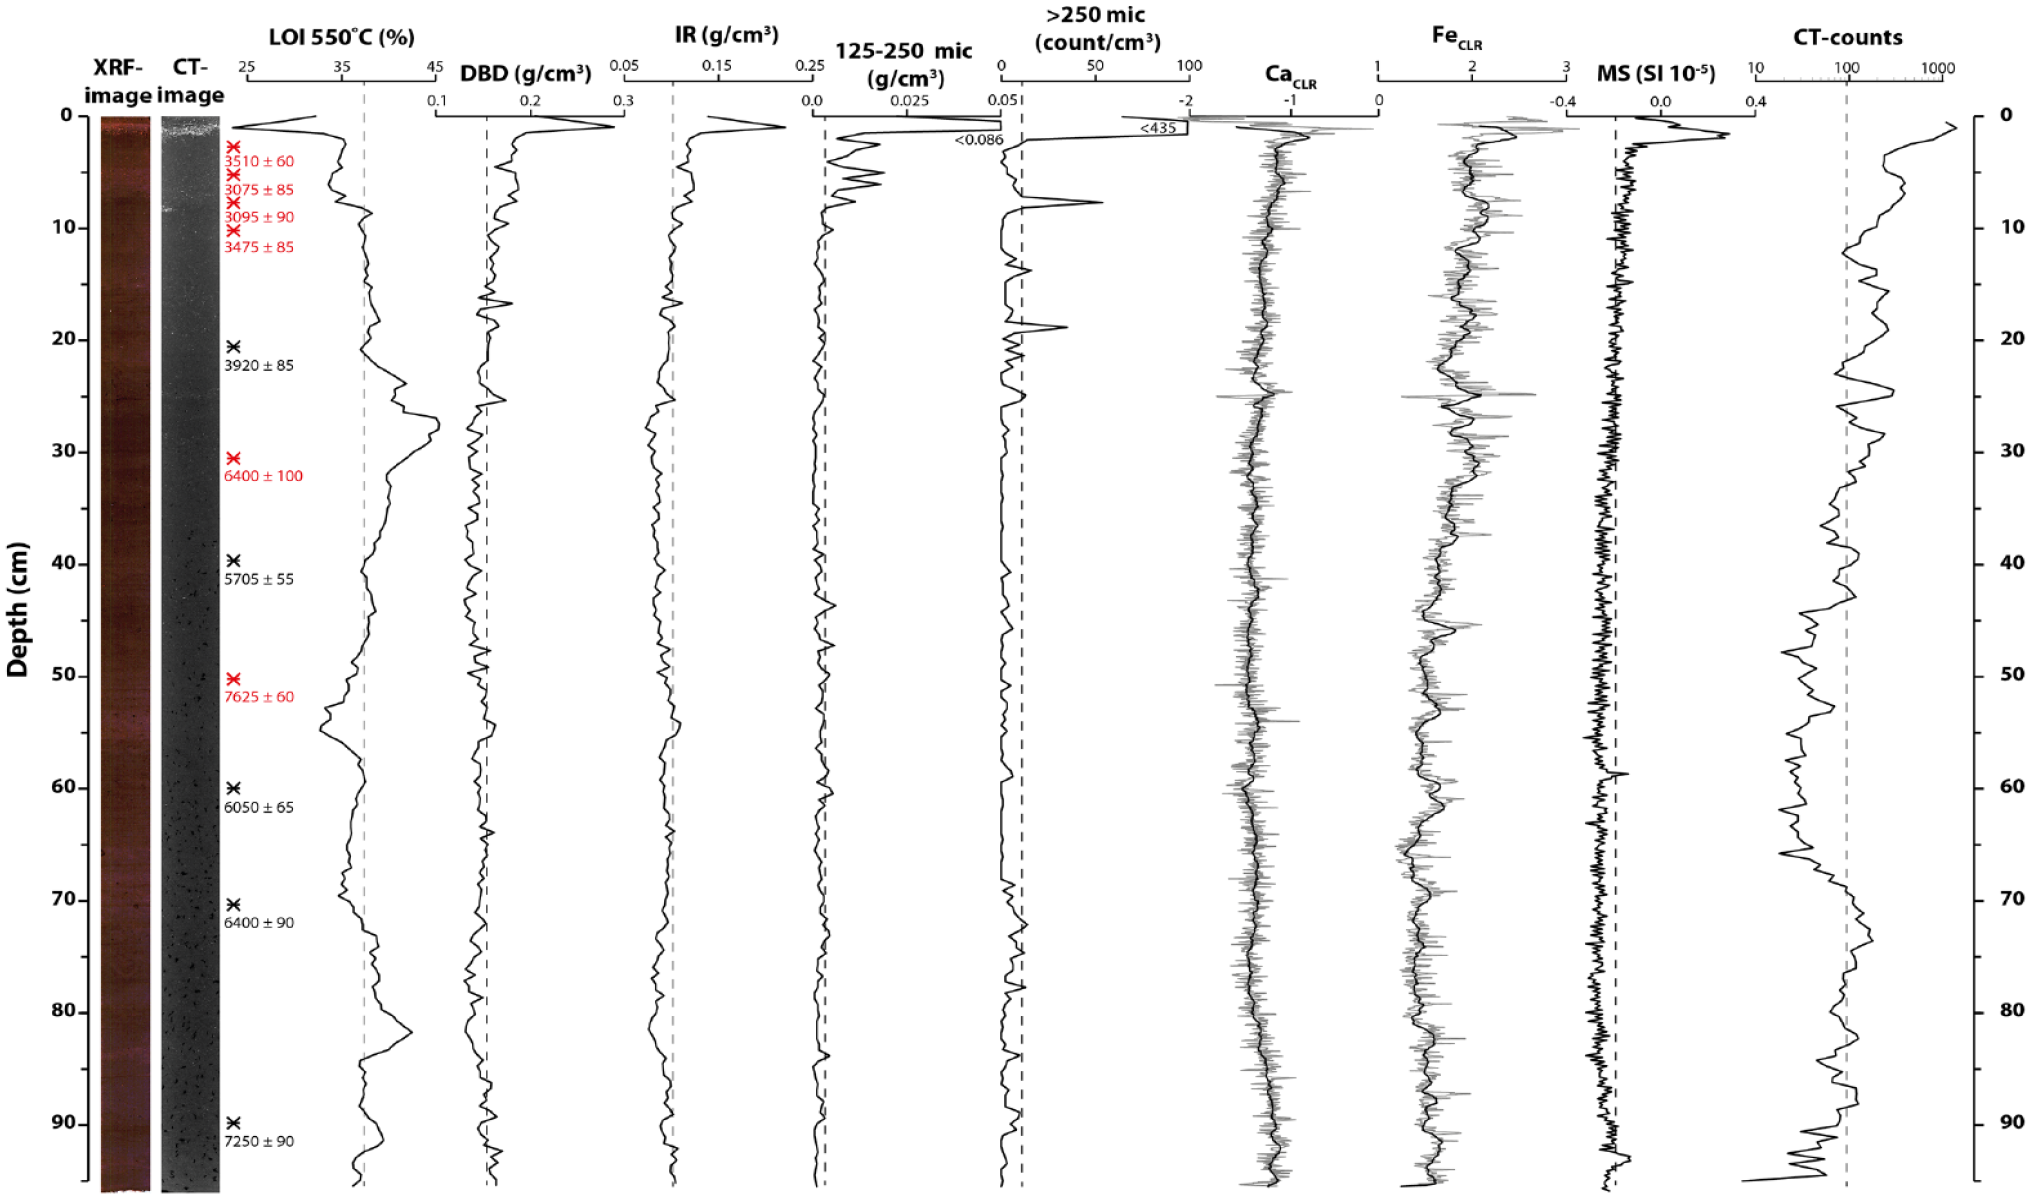
Presentation of selected sediment parameters from NØKU118. From left to right: picture of the core with depth scale, CT-image, 14C-dates (cal. yr BP), percent weight loss-on-ignition (LOI), dry bulk density (DBD), ignition residue (IR), grain size fractions 125–250 mµ (% of IR) and >250 mµ (count pr 1 cm3), Calcium- (Ca) and Iron (Fe) from the XRF-results, surface magnetic susceptibility (MS) and threshold analysis from the CT-scan (sand-sized particles >300 mµ). The dotted lines represent average value at each sediment parameter.
The results from the CT-scanning reveal more details and structures in the sediments compared to visual inspection (Figure 7). The greyscale image show areas in the core with higher relative density, thereby clearly highlighting the denser minerogenic grains against the less dense organic background. Minerogenic grains are present throughout the core, with a maximum density at 0.5–2 cm depth. Most of the sand grains in the core, except for the layer in the top, are seen as isolated grains suspended in the organic matrix. Two areas with bioturbation, seen as 1–2 cm long vertical structures filled with minerogenic particles, are present in the uppermost 10 cm of the core (Figure 7). The CT threshold analysis indicates that the number of minerogenic particles >300 µm fluctuate through NØKU118, with the highest values seen between 90–70 cm and 30–0 cm, and the lowest between 70 and 45 cm (see intervals in Figure 7). The top of the core (0.5–2 cm) stands out with the highest numbers (2250 particles).
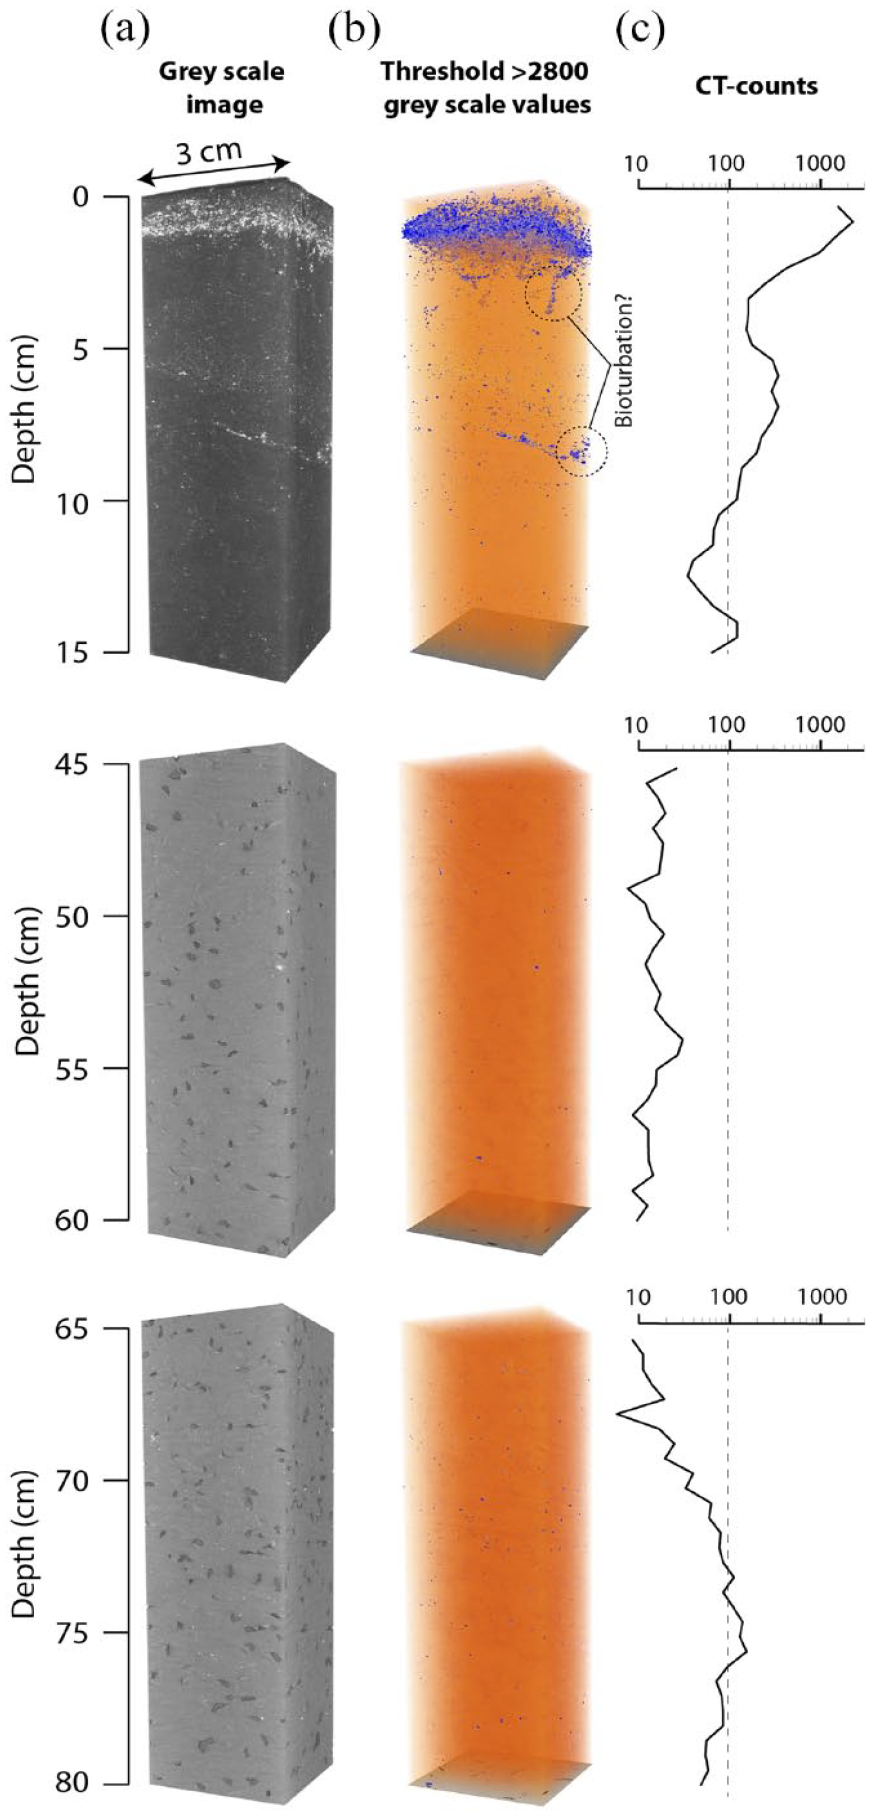
(a) Gray scale 3D X-ray CT image, (b) grey scale image with threshold set to >2800 values, and (c) sand-sized particles counted by the CT-scan for three different intervals in the core. The dotted line in (c) represents average CT-counts (96) in the entire core. Black spots in the grey scale images in (a) are gas bobbles (decomposing) developed after core was retrieved.
LOI shows some variation throughout the core, with the lowest values seen between 0.5 and 2 cm (23%) and the highest value (45%) at 27 cm (Figure 6). Through the rest of the core, LOI fluctuates between 35% and 45%. The DBD is rather constant throughout the core, with a mean value of 0.15 g/cm3. DBD are positive correlated with minerogenic particles >250 µm/cm3 (r2 = 0.72) and CT-counts (r2 = 0.59). The highest values are reached between 1 and 3 cm, with a maximum of 0.28 g/cm3 at 1.5 cm.
MS shows a relatively low and stable signal, indicating weak magnetic susceptibility in the sediments due to high proportion of organic material and water. The only peak in the dataset, at 2.5 cm, correlates with the minerogenic layer near the top of the core. The geochemical properties (XRF) show similar trends compared to MS and DBD. Calcium (Ca) show a distinct peak at around 1.4 cm, whereas the rest of the core have only small variability in the data, although a small increase is observed in the uppermost 20 cm. Compared to the other geochemical elements, iron (Fe) shows more variability with small distinct peaks in the uppermost ~40 cm of the core (Figure 6).
The wet-sieving shows that the average number of sand grains >250 μm per sample is 7, although the median is 1.5 grains. There is a clear increase in the uppermost 10 cm of the core, with the highest value of 435 grains >250 µm/cm3 at 1.5 cm depth. The weight of grains between 125 and 250 µm show a similar pattern, although with slightly more variability in the upper 10 cm of the core (r2 = 0.98). Compared to the results from the CT-data (particles >300 µm), the wet-sieving of particles >250 µm indicates much lower particle numbers per cm3. This deviation is known, and is attributed to a number of analytical sources such as resolving of grain size, density differences and image processing overestimating irregular shaped objects (Cederstrøm et al., 2021). Nevertheless, the two records show a high degree of correlation (r2 = 0.77), indicating similar variability downcore.
Chronology
The Uwitec coring system is constructed to capture an undisturbed sediment-water interface, and as the lacustrine cores (NØKU118 and 218) share an identical stratigraphy in the uppermost part (sand layer situated at ~1.5 cm), it is assumed that the cores contain the topmost and most recent sediments in the lake. The results from the radiocarbon dating, however, show that the four uppermost samples cluster around the same age (3000–3600 cal. yr BP) and are interpreted as outliers due to significantly older ages compared to the other dates (Table 1 and red coloured dates in Figure 8). These samples were probably affected by plant material redeposited due to local peat harvesting by humans or blown into the lake, thereby giving erroneously high ages (see discussion below). The ages at 30 and 50 cm are also interpreted as outliers due to younger dates above and below both samples.
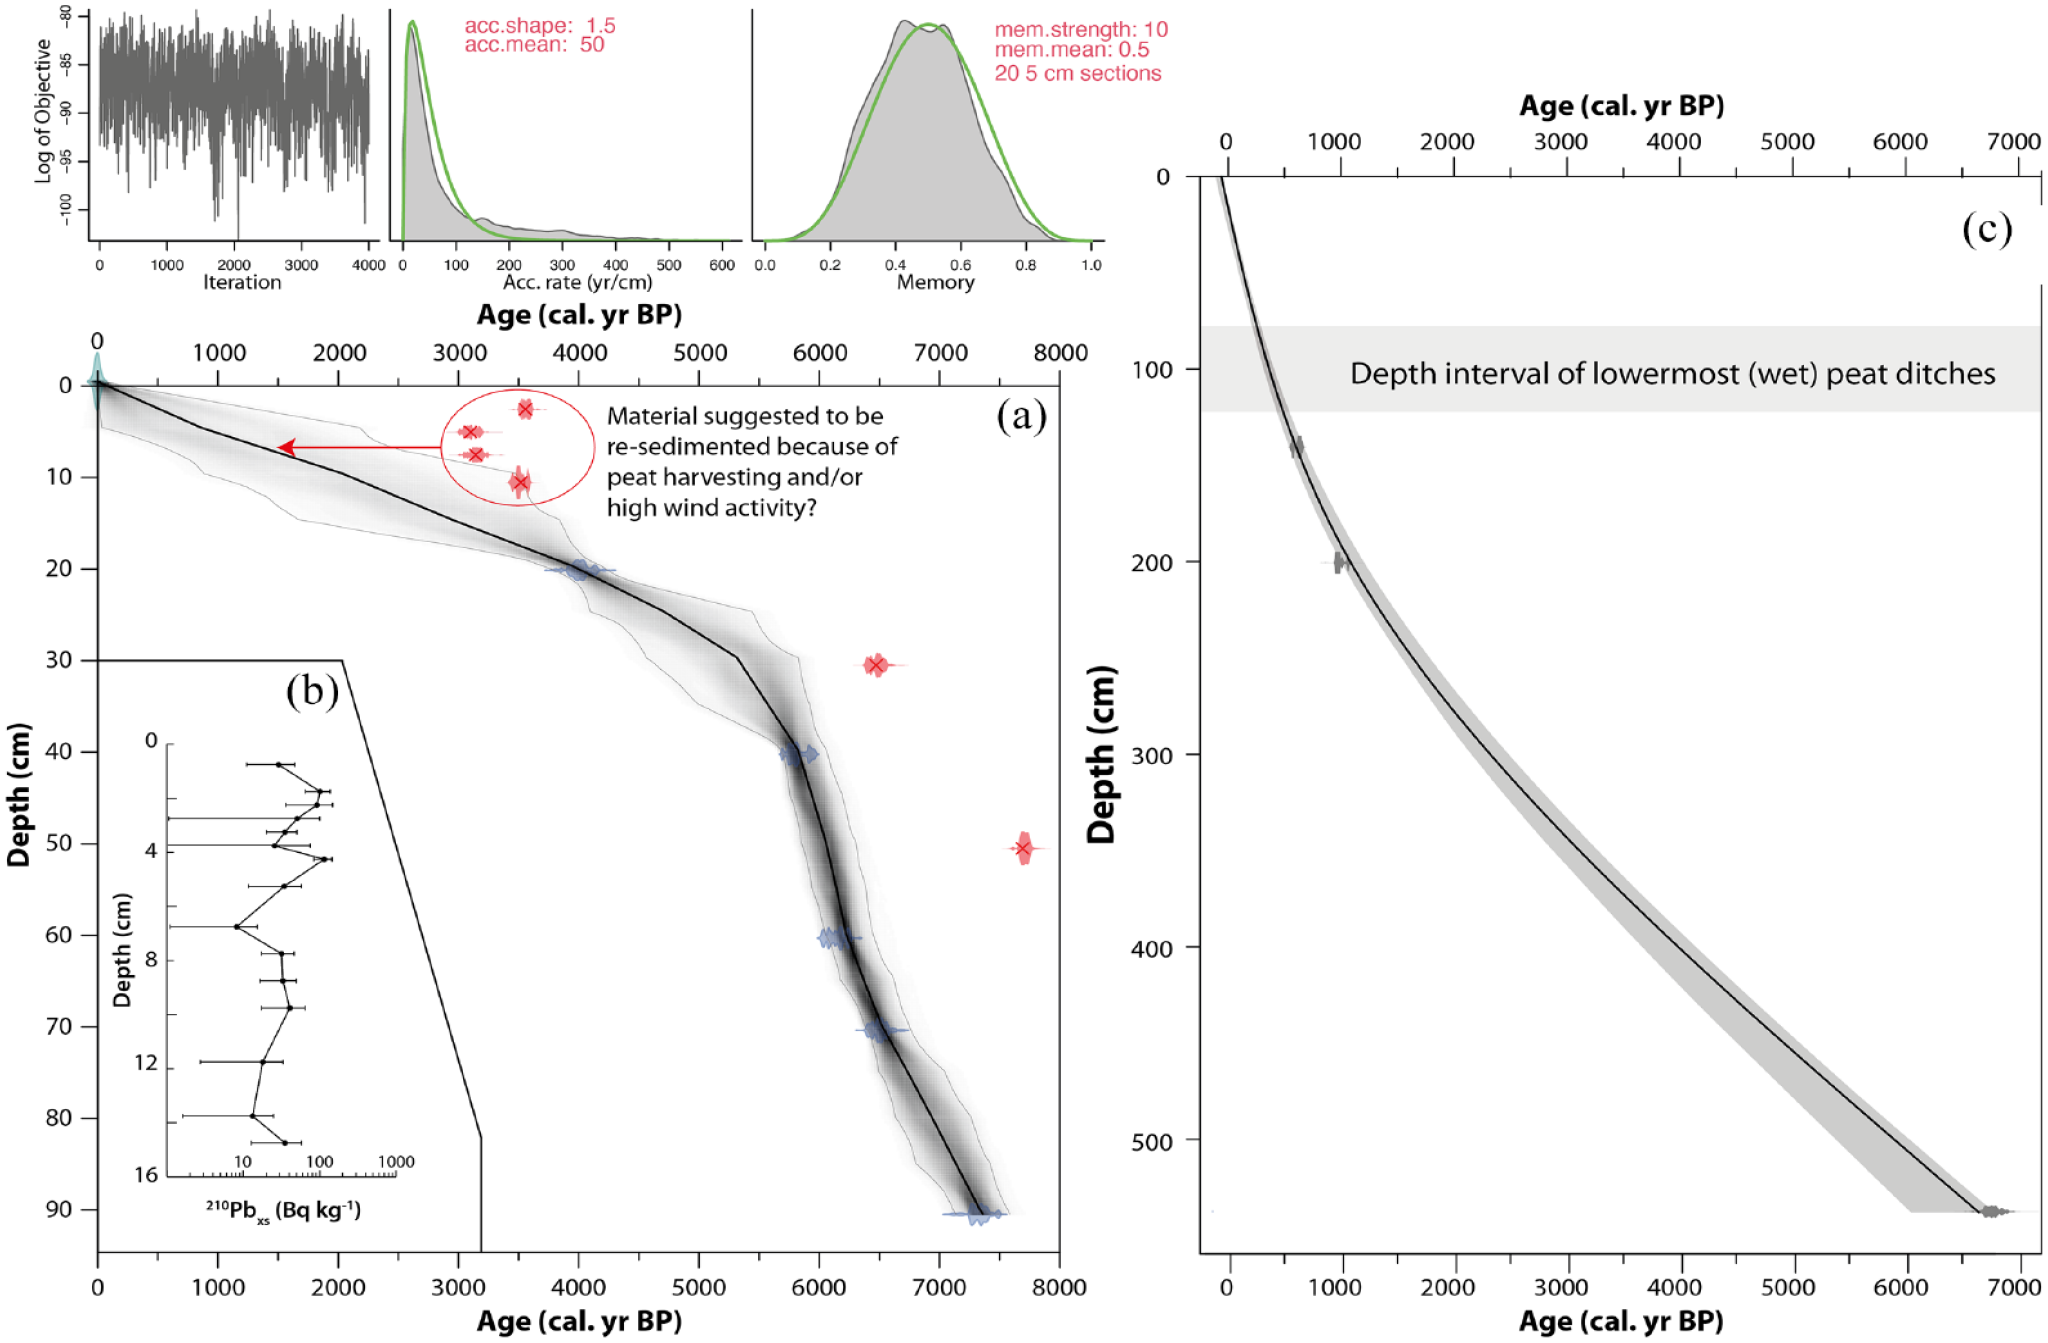
(a) Age–depth model of NØKU118 based on 14C-dating. Black line shows the best age–depth estimates with 95% confidence interval in grey shading. Red coloured dates are left out of the model due to a likely disturbance/redeposition (see text). (b) Downcore content and irregular profile of unsupported 210Pb. (c) Age-depth model of NØKR118 based on 14C-dating.
The results of the 210Pb-dating showed surface contents of unsupported 210Pb of around 100 Bq kg−1 and an irregular profile with no systematic decrease with depth. The calculated flux of unsupported 210Pb is only 38 Bq m−2 y−1 which is less than half of the expected flux (Appleby, 2001). This indicates that the site could be subject to periods of erosion or non-deposition. The content of 137Cs was generally very low (varying from 315 Bq kg−1), but the isotope was present throughout the investigated interval.
NØKU118 and 218 do not show stratigraphical signs of erosion or slumping, but there are signs of increased influx of sand sized particles in periods. The upper (wet) part of the cores was compacted during transportation, affecting the modelled sedimentation rates in the uppermost part. The 14C-date at 20–21 cm depth gives an age of 3920 ± 85 cal. yr BP, implying that the sedimentation rates are low (~0.005 cm per year) in the upper 20 cm of the core. A very low sedimentation rate is also suggested by the 210Pb-profil, however due to the irregular profile, as well as the lack of stratigraphical signs of erosion or slumping, the 210Pb-data is discarded in this setting. The age-depth model of NØKU118 was made using bacon 2.5.8 (Blaauw and Christen, 2011) and is based on the five remaining 14C-dates. The age-depth model of the peat core (NØKR118) was made in clam 2.4 (Blaauw, 2010) in R using a spline model based on three 14C-dates (Figure 8).
Discussion
Drift potential, aeolian activity and human occupation
At present, Fjærvoll is situated in a high-wind environment with DP reaching >1200 vector units during some years (CE 1991, 1992 and 2015) (Figure 3). The observational data is based on average wind speed – the arithmetic mean of daily values measured over 10-minute intervals at 0, 6, 12 and 18 h UTC – and will therefore in most cases underestimate the total DP due to the limited number of observations per day. The DP appears to have an increasing trend the last 30 years (CE 1990–2020), compared to the period between 1957 and 1990, which was more stable with lower values. Gusts >30 m/s normally occur every year at Fjærvoll (usually in January or February), however this varies greatly throughout the record (Sta. no. 86740, CE 2002–2021). As an example, the area experienced 4 days with gusts reaching 30 m/s or higher in CE 2019 and no days with gusts >30 m/s in CE 2018 (DNMI, 2021). Such wind speeds will under dry conditions activate the sand-sized particles at the beach and aeolian dunes, transporting them inland from the sediment source (Pye and Tsoar, 2008).
Apart from wind-speed, -direction and the frequency of winds, aeolian activity is affected by several factors such as soil moisture, surface cover (vegetation or snow cover), anthropogenic activity, sediment availability and, in this case, sea-level fluctuations. Along the western coast of Norway, a massive deforestation by humans occurred during the formation of heathland from ~3250 cal. yr BP and onwards (e.g. Hjelle et al., 2010). Pollen- and leaf wax analyses from mires in northern Norway suggest that agriculture was introduced in the area during the late Bronze Age (~3000 cal. yr BP) (Balascio and Wickler, 2018; D’Anjou et al., 2012; Johansen and Vorren, 1986; Sjögren and Arntzen, 2013). An archaeological site at Føre, south of Fjærvoll, is dated to CE 400–670 (1550–1620 cal. yr BP), indicating human occupation and agricultural activity during this period near the study site (Schanche, 1991). Fjærvoll (1968) suggests that the area was inhabited at least 1500 years ago, and that the first historical documentation of human occupation at Fjærvoll is from the 16th century, stating around 10–12 inhabitants. Human occupation and forest clearance can lead to increased deflation and soil dust, affecting the amount of material being transported inland by the wind and accumulated in nearby lakes (e.g. Neff et al., 2008). At Nøkktjønna the sedimentation rate (Figure 8) is rather stable at a low rate towards the top of the core, even after accounting for the compaction of the uppermost part. This indicates low accumulation rates during a time of increasing human influence in the area.
Peat harvesting and chronology
Lake Nøkktjønna is situated in a sheltered cirque-like depression and has a small drainage area without any fluvial inlets. Thus, we consider Nøkktjønna to be an ideal ‘trap’ for material being blown into the lake, as no other natural processes (fluvial-, mass-movement- or glacial-) are observed to occur in the catchment. However, humans have been occupying the area for several thousand years and probably used the nearby peat as source for fuel or building material (Gundersen et al., 1972; Fjærvoll, Unknown). Borg, being situated ~50 km south of Fjærvoll, was an important settlement and chieftain’s farm from the Pre-Roman Iron age until the 13th century (e.g. Munch et al., 2003; Solli, 2004). D’Anjou et al. (2012) studied sediment cores from Lake Lilandsvatnet close to the prehistoric settlement at Borg and found signs of land clearance by burning at ~2300 cal. yr BP, and an increase in human occupation and grazing at ~1500 cal. yr BP, which they related to the migration period in Scandinavia. Based on this and the reported site at Føre, the area has probably been affected by humans and their impact on the landscape for the last 2500–2000 years.
Turf – slabs of peat – has been used as material for constructing mounds, buildings, and longhouses in Scandinavia since the Neolithic period (Bertelsen and Lamb, 1993; Mook and Bertelsen, 2007). Peat harvesting was done by digging out ditches, both to extract suitable pieces of peat, but also to dry out the surrounding bog. The peat south of Nøkktjønna has at least seven small ditches varying from 0.8 to 1.2 m in depth (Figure 9). Most of the ditches in the western part – situated ~1 m higher in the terrain and well above the water table – are more overgrown and older compared to the ones in the eastern and wetter part which is straighter and more clearly seen. The age-depth relationship of the uppermost part of the peat core suggests that the base of the ditches (0.8–1.2 m depth), that is, the exposed old surface, is ~250–450 years in the eastern wet part (Figure 8). Dry peat is better suited than wet peat for burning as it accumulates slower and is more compact. Hence, it is likely that harvesting of peat for burning/house building at Nøkktjønna first took place in peat highest above the ground water table (e.g. the dry peat). During and after harvesting, old peat is suggested to have been transported by rainwater/snowmelt into Nøkktjønna and redeposited. When the best, most compact, peat resources were used up, wetter peat closer to the ground water table was probably exploited (i.e. the eastern part of the bog).
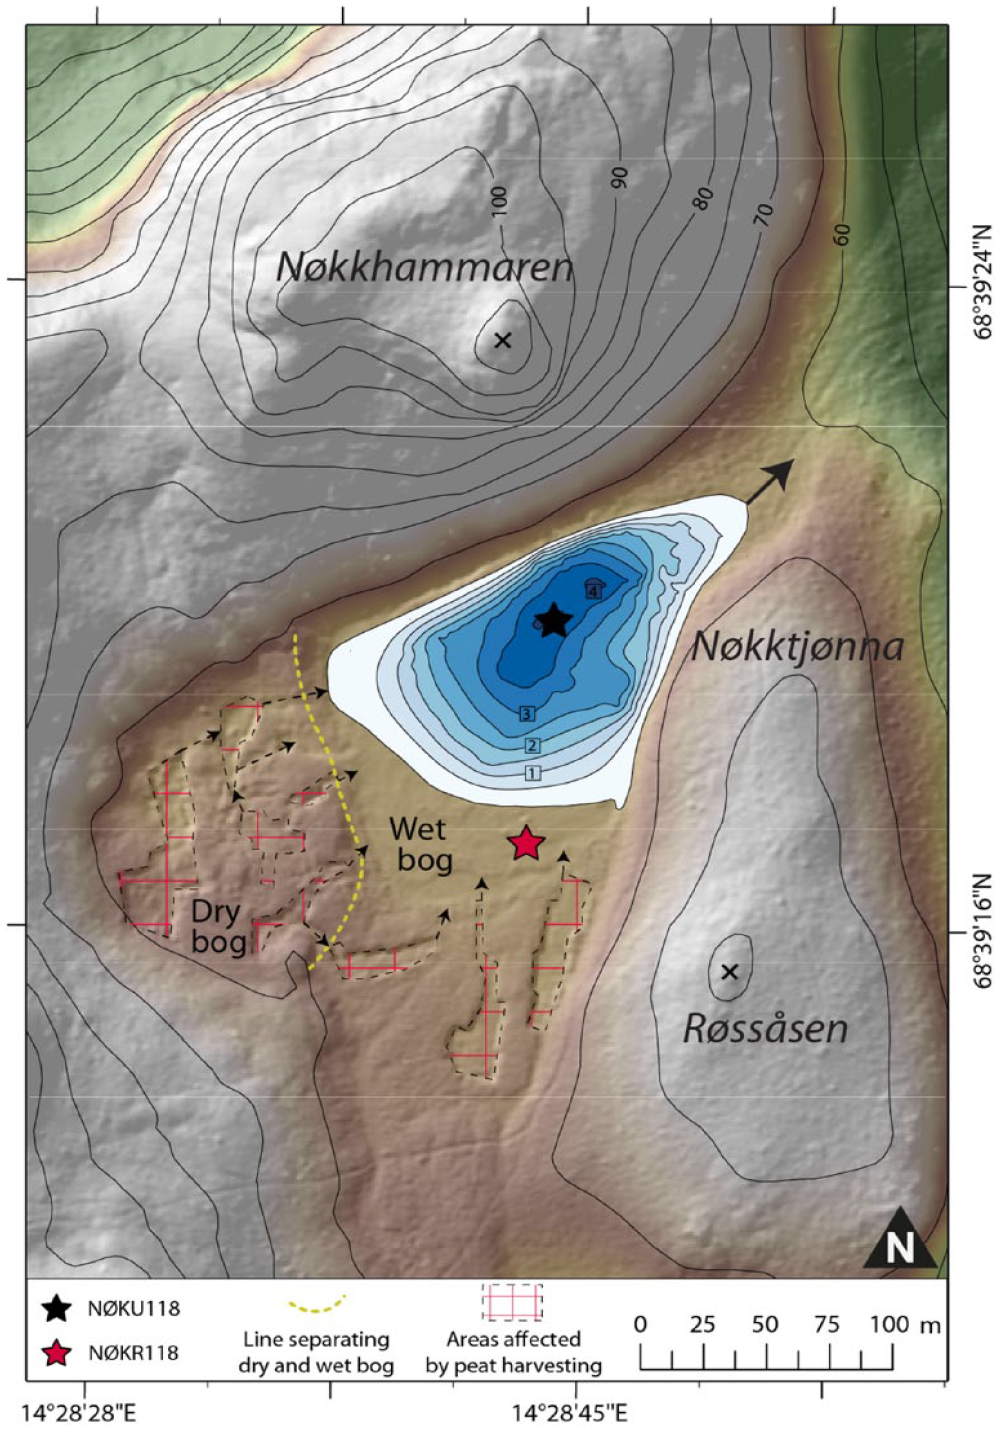
Digital elevation model of Nøkktjønna catchment showing areas interpreted to be affected by peat harvesting as drainage ditches. The average depth of the ditches is 1 m. Contour interval is 5 m on land and 0.5 m in the pond (numbers are referring to depth (m) in lake). The dry bog is situated ~1 m higher than the lake, and thus have larger potential for in-wash of material to the lake compared to the wet bog which is situated at the same altitude as the lake.
The timing of peat harvesting in the area is still unknown, however local inhabitants say that this tradition ended around CE 1950 and that most of the peat harvesting occurred at the flat-lying areas closer to sea level, as these areas were far more reachable (See Figure 4). Following the discussion above it is suggested that the uppermost four 14C-dates in NØKU118 have been affected by old plant remains being washed into the lake because of peat harvesting. Hence, redeposition of old material/sediments from the nearby bog during the settlement period resulted in a cluster of erroneously high ages in the topmost lacustrine sediments. This indicate that re-sedimentation/peat harvesting started some 2500–2000 cal. yr BP based on the age-depth model (Figure 8).
Sand sources
Based on the geomorphological mapping, stratigraphy, and 14C-dates, the aeolian deposits and sand dunes at Fjærvoll were deposited after the Tapes transgression maximum at ~6800 cal. yr BP (Figure 10a), when the sea level was at its highest (~9 m a.s.l.) during the Mid-Holocene (e.g. Møller, 1986). Most of the natural landscape has been reshaped since then due to easily cultivated areas for agricultural purposes. The foredune at Fjærvoll (Section A) is less than half of its original size due to extraction of sand, as it used to cover the northern part of the bay (~400 m). The foredune is densely vegetated and established (relict), and only minor aeolian activity (small incipient foredunes) is occurring along the coastline today. Palaeosols are not observed in the foredune, indicating a steady build-up with the possibility of erosional events after the Tapes highstand. The lowermost date in the foredune, based on shell fragments, gives an age of 4945 ± 200 cal. yr BP at 8.6 m above present sea level. The shallow waters outside Fjærvoll, as well as large tidal variations and favourable wind directions, probably led to ideal conditions for dune build-up. The observed levels on the foredune probably reflects different stages of dune formation during a falling sea level or undercutting due to storm waves (the lowermost level) (e.g. Hesp and Walker, 2013).
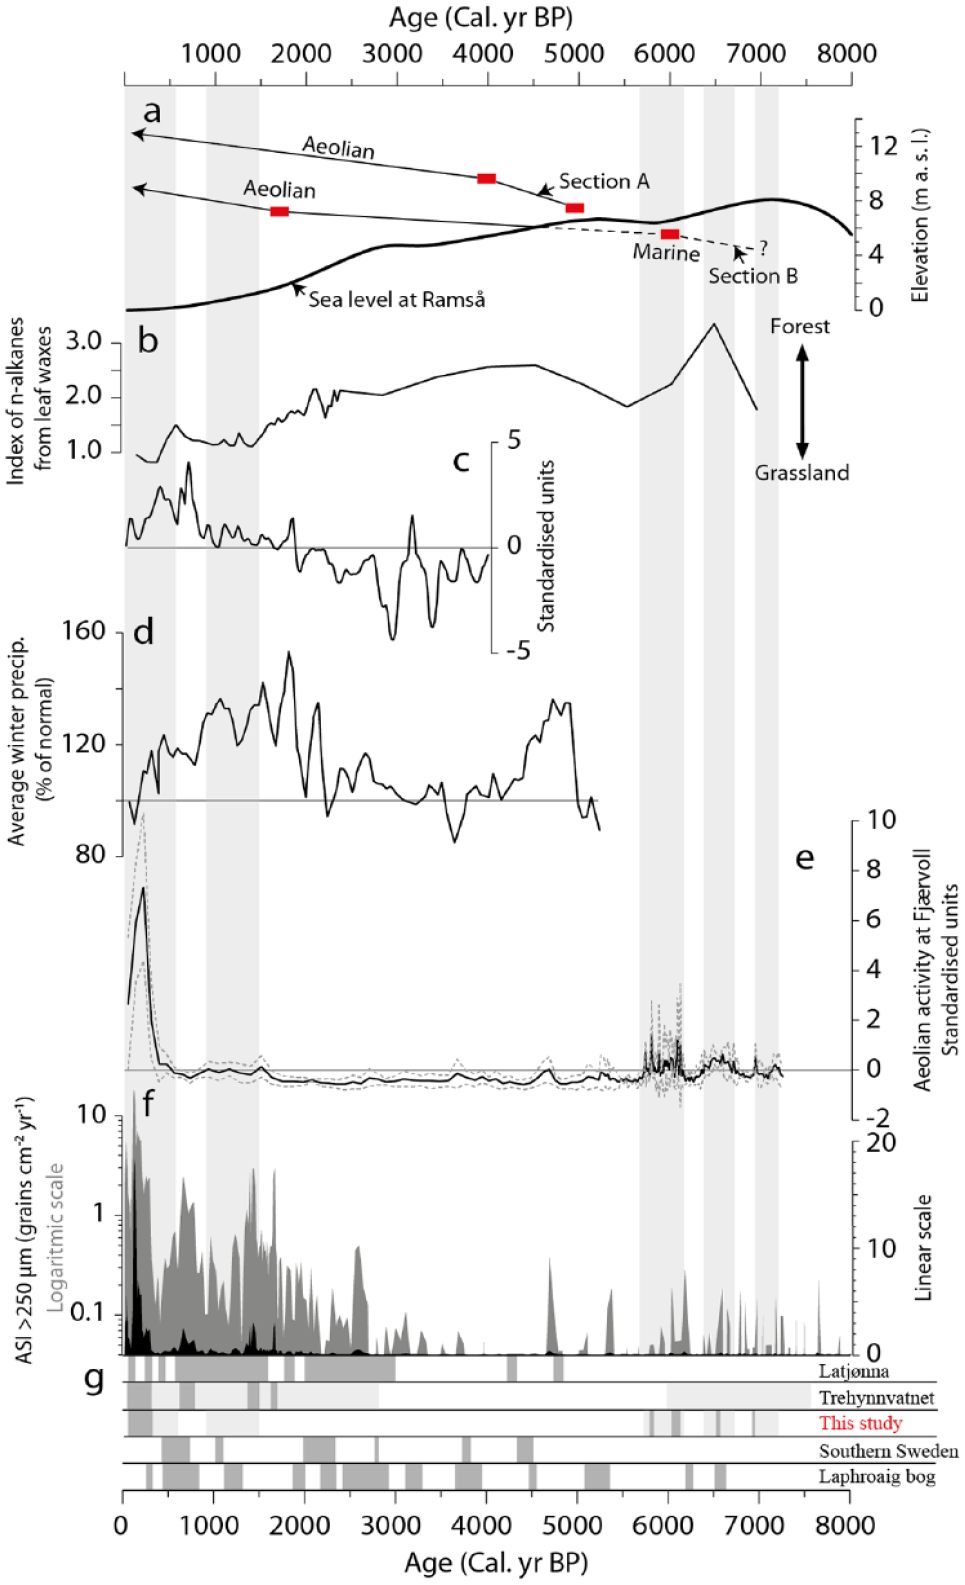
(a) RSL curve from Ramså (Marthinussen, 1962; Møller, 1986) and interpreted evolution of Section A and B at Fjærvoll. Red squares indicate 14C-samples in the sections, and the black lines indicate the rates of dune accumulation. (b) relative contributions from forest vegetation versus grassland vegetation based on the index of n-alkanes from leaf waxes: [([C25] + [C27] + [C29])/([C29] + [C31])] in Vestvågøy (D’Anjou et al., 2012). (c) North-south index of storm track position from (Orme et al., 2017). Positive values indicate northward shift in storm tracks. (d) Winter precipitation reconstructed from distal glacier-fed lakes along the coast of western Norway reflecting the strength of the westerlies (Bakke et al., 2008). (e) Standardized aeolian sediment influx to Nøkktjønna based on CT-threshold values, 125–250 and >250 µm grain-size data from NØKU-118. The dotted lines represent standard deviation. Shaded grey areas show interval with moderate aeolian influx. (f) ASI-variations reflecting storminess at Nykvåg plotted along a logarithmic (grey) and linear (black) scale (Nielsen et al., 2016c). (g) Comparison of five different local to regional storm records from northern Europe: Latjønna (Nielsen et al., 2016b), Trehynnvatnet (Nielsen et al., 2016c), this study, Southern Sweden storm stack (Kylander et al., 2023) and Laphroaig bog in Scotland (Kylander et al., 2020).
Section B, inland of the foredune, indicate shallow marine or lagoonal conditions with laminated and cross-laminated sedimentation during and after the Tapes highstand (4.5–5.7 m a. s. l. in the Section) indicated by the lowermost date of 5945 ± 185 cal. yr BP at 5.7 m a. s. l (Figure 10a). The aeolian sediments above this layer accumulated in a period of falling sea level after the Tapes Transgression maximum, which provided suitable conditions for sand accumulation initiating the coastal dunes at Fjærvoll. The charcoal-rich layers with bone fragments between 7 and 7.5 m a. s. l. reflect human occupation and could be related to a slash-and-burn agriculture, which was common in Norway during the Bronze age (Sjögren and Arntzen, 2013). It is also a possibility that this part of the Section is a midden, that is, an old dump site for waste. Both the charcoal-rich layer and individual bones from neighbouring layers are dated to 1765 ± 60 and 1720 ± 30 cal. yr BP, respectively, being within the Roman Iron age (CE 0–400) and during a time of agricultural expansion in Norway (Kaland, 2008). About 1.5 m of aeolian sediments are deposited above the charcoal-rich layers, indicating a rapid built-up due to high sand influx during the last ~1700 cal. yr BP.
Storminess at Fjærvoll
The studied lake-sediment core (NØKU118) depicts three types of sediments (Figure 7): (1) organic-rich sediments (DBD = 0.14 g/cm3), (2) organic-rich sediments with matrix-supported sand-sized grains (DBD = 0.17 g/cm3) and (3) sand-rich sediments with organic particles (DBD = 0.24 g/cm3). The latter type is only represented as one layer in the top of the cores. The results from the CT-scan and the manual counting/weighing of mineral grains show an enrichment of sand in the uppermost 25 cm of the core, corresponding to the last ~4500 cal. yr BP based on the age-depth model (Figure 8).
The drainage area of Nøkktjønna is dominated by a peat bog, with some till and exposed bedrock (mostly vegetated), and no obvious sources of sand-sized material. The lake is mostly fed by groundwater as no subaerial streams are observed entering the lake. Fluvial transportation is thus ruled out as an agent for transporting the observed sand sized particles to the lake sediments. The peak in sand content in the core is also concurrent with peaks and higher levels of Ca in the XRF data, which could correspond to increased input of shell-rich sand. It is therefore suggested that the sand grains in Nøkktjønna are deposited during periods when strong winds erode and transport sediments from the beach/dunes at Fjærvoll. Most likely this occurs as saltation or suspension during wintertime when wind activity is peaking, and the lake and nearby surfaces are frozen, or snow covered. This is also supported by the observation of sand grains on snow inland of the dunes along the coast at Fjærvoll. Based on these considerations the sediment record from Nøkktjønna potentially reflects periods of high aeolian influx during Mid- to Late-Holocene (last 7250 cal. yr BP).
To construct a continuous record of past aeolian influx at Fjærvoll a combination of the Aeolian Sand Influx-method (ASI) based on grain sizes between 125 and 250 and >250 µm (e.g. Björckl and Clemmensen, 2004) and particle counts from the CT-data from NØKU118 have been used. The datasets reflect the amount of sand grains in the core and can thereby serve as a proxy of aeolian influx. The three datasets have been divided by the sedimentation rate, standardized, and combined, resulting in an averaged curve with standard deviations indicating aeolian influx at Fjærvoll (Figure 10e). The record at Fjærvoll is dominated by rather low aeolian activity, especially the ~2800-year-period between ~4300 and 1500 cal. yr BP. Shorter periods with intensified aeolian activity (above the 90th percentile of the influx) is recorded at ~6950–6900, ~6500, ~6100–6000, 5800–5750 and ~350–20 cal. yr BP, with the last period (Little Ice Age) being the most intense as reflected by a visible sand layer. Moderate aeolian influx (above the 70th percentile of the influx) is recorded from 7250–6950, ~6750–6400, ~6100–5750, ~1500–900 and 530–20 cal. yr BP.
Regional context and North Atlantic climate
Compared to the neighbouring site at Nykvåg (Figure 10f), situated ~12 km north of Fjærvoll in a similar setting (Nielsen et al., 2016c), the record at Fjærvoll indicate less variability and a lower temporal resolution in the reconstructed aeolian activity. The reason for the large difference could be the contrasting exposure to SW-winds between the two sites, contrasting catchment areas, longer transport distances of sand from source to sink at Fjærvoll, or because of influence by human activity at Fjærvoll. Nevertheless, both records indicate periods of high to moderate storminess/aeolian activity after the Tapes transgression (~6900–5700 cal. yr BP) and between 1500 and 0 cal yr. BP – especially during The Little Ice age period (CE ~1500–1900) showing orders of magnitude higher values in both records. The ‘stormy’ period between ~6900 and 5700 cal. yr BP is probably connected to a falling sea level after the Tapes transgression highstand, when the amount of sediments being accessible for deflation increased (e.g. Wilson et al., 2004). This means that sediment availability could have played an important part in the amount of material being deflated and blown into the lake during the Mid-Holocene. The latter intensification during the LIA is a well-known stormy period being recorded by similar studies around the North Atlantic (Figure 10g), indicating that the LIA was a period of increasing frequency or intensity of storms across the whole region (e.g. Bampton et al., 2017; Clemmensen et al., 2009; Kylander et al., 2020; Orme et al., 2016a, 2016b; Wilson et al., 2004).
The dunes at Fjærvoll reflect high aeolian activity with almost 2 m of sand deposition in Section B from ~1500 cal yr. BP to the present (Figure 10a), indicating that the dunes show larger sensitivity to aeolian activity compared to the lake sediments in Nøkktjønna. This is also seen in a dunefield at Andøya, ~50 km northeast of Fjærvoll, where a high influx of aeolian sediments to Lake Latjønna is recorded from 1600 to 600 cal. yr BP (Figure 10g), interpreted to reflect high aeolian activity during the same period causing dune mobilization (Nielsen et al., 2016b).
Biomarkers such as faecal sterols, leaf wax compounds, and polycyclic aromatic hydrocarbons (PAHs) have been used in Vestvågøy, south of Langøya, to quantify initial presence of humans and vegetation changes (D’Anjou et al., 2012). The data indicates an increase in grassland from 6500 to 5500 and 2250 to 1500 cal. yr BP associated with forest clearance and increase in human and livestock population (Figure 10b). The first phase of forest clearance postdates the periods of aeolian influx at Nøkktjønna starting at 7250 cal. yr BP. The second phase occurs prior to the mobilisation of dunes at Fjærvoll starting at 1500 cal. yr BP and increase in aeolian influx to Nøkktjønna. Based on this, it seems that there is not a direct link between forest clearance and sand activation. However, continued removal of vegetation allows aeolian sand to move more easily across the landscape.
Orme et al. (2017) suggest that a change in the position of storm tracks to a more northerly position occurred during 3000–800 cal. yr BP (Figure 10c), which could explain the increasing trend in aeolian activity/storminess at Fjærvoll from around 2000 cal. yr BP and onwards. At the same time, an increasing inflow of wind driven Atlantic waters is observed in the Norwegian sea (Giraudeau et al., 2010), and this change has been interpreted to be driven by insolation and sea ice forcing, which in turn caused polar cooling and a higher latitudinal temperature gradient. This is in accordance with a more northerly storm track, as suggested by the terrestrial aeolian archives.
Glacier reconstructions in Norway suggest high winter precipitation and strong westerlies during the Late-Holocene (especially the past ~2000 cal yr. BP, see Figure 10d) (e.g. Bakke et al., 2008; Jansen et al., 2016; Nielsen et al., 2016a). High precipitation/humid conditions may restrain aeolian deflation. However, because precipitation in northern Norway usually falls as snow during wintertime, it would rather suggest sand movement through niveo-aeolian activity (e.g. Koster, 1988). Since the sand sources at Fjærvollsanden are usually snow/ice free due to tidal variation, this would suggest episodically intense periods of niveo-aeolian activity. Such activity have also been suggested in similar studies in southern Sweden (Björckl and Clemmensen, 2004; De Jong et al., 2006). Moreover, fluctuating temperatures around 0°C usually develop frozen surface on snow, which was the case during the winter CE 2023 (www.senorge.no), decreasing the roughness of the surface. Thus, the Nøkktjønna record (Figure 10e) probably reflects periods with the combined conditions of snow cover/frozen surface, opening of the landscape during agricultural development and the passage of exceptionally strong storms.
Conclusions
This study reconstructs past aeolian activity at Fjærvoll in northern Norway based on investigations of coastal sand dunes and lake sediments from Nøkktjønna situated ~1.5 km inland of the coast. A combination of three sediment parameters from the lake record expressing the influx of mineral grains was used as a proxy of aeolian activity.
The primary trends from this study show similarities to other reconstructions from northern Norway which indicates that aeolian influx to Nøkktjønna is coupled to the large-scale atmospheric circulation patterns occurring in the North Atlantic region. Six periods of high aeolian influx (above the 90th percentile of the influx) are recorded at ~6950, ~6500, ~6100–6000, 5800–5750 and ~350–20 cal. yr BP in the lake. The increased influx of aeolian sand is suggested to be associated with changes in the storm track pattern in combination with sea-level fluctuations, conditions of snow cover/frozen surface and increased anthropogenic influence the last 1500 years. The highest influx rates are recorded during the LIA (CE 1600–1930), which was a rather cold period with high storminess in northern Europe.
Footnotes
Acknowledgements
The authors are grateful to Dr. Eivind Støren and Jan Magne Cederstrøm for helping with the CT-scan and postprocessing of CT data. We also thank Joe Buckby and Oskar Eide Lilienthal who assisted during fieldwork and Professor Anne E. Bjune for help with identification of macrofossils for radiocarbon dating. We are also grateful to the reviewers for thorough comments and for suggesting changes that improved the paper.
Funding
The author(s) disclosed receipt of the following financial support for the research, authorship, and/or publication of this article: This work is based on the results from Ingvild Prestegård’s master thesis supervised by PRN and SOD. All sediment analyses were carried out at EARTHLAB (226171/F50) at the Department of Earth Sciences, University of Bergen.