
Abstract
An understanding of the geomorphological processes instigated by seismic-related catastrophes such as tsunamis is important to our understanding of their potential impacts on both past and present human populations. Due to the relative scarcity of human records of such events in prehistory, it is necessary to rely on the geological record to identify and interpret the environmental changes caused by such catastrophes. A multi-proxy analysis of geological and geomorphological data is used to identify a local signal of a region-wide 15th century palaeotsunami that inundated the SW North Island coast of Aotearoa/New Zealand. A comparison with regional geological and archaeological evidence enriches our understanding of the nature and extent of this event and its impact on human settlement that complements similar findings in other countries.
Introduction
Given the nature of significant tsunamis that have affected coastal populations over the past 20 years, it is not surprising that recent research has tended to focus on subduction zone generated events.
Aotearoa/New Zealand (A/NZ) is well known for its high levels of tectonic activity, most notably through its well-evidenced earthquake and volcanic events, both prehistoric and modern (e.g. Alpine fault ruptures: Howarth et al., 2018; Kaikōura multifault ruptures: Hamling et al., 2017; Taupō eruptions: Bebbington, 2020; Whakaari/White island eruptions: Kilgour et al., 2021). However, less well known is the tectonic capability of the region for producing sizeable and catastrophic tsunamis (NZPD, 2023), particularly on the west coast of the North Island of A/NZ which is generally protected from the country’s primary tsunamigenic subduction zone sources (Goff and Chagué-Goff, 2015). The evidence for such tsunamis is often preserved in the palaeoenvironmental record of coastal sites with wetlands formed behind some form of coastal barrier in particular possessing favourable conditions for the preservation of geological, geomorphological and archaeological data (e.g. Goff et al., 2021; Shtienberg et al., 2020).
The accurate interpretation of the A/NZ palaeotsunami record is vital in helping to understand the long-term geological and geomorphological processes acting on the landscape and the peoples who lived in it, which in turn allows for a more accurate assessment of the possible future impacts of such processes (de Lange, 2014). Therefore, in the first place it is important to investigate all the geological, geomorphological, and archaeological records for evidence of such events. In A/NZ, Māori settlement of the islands occurred around 1250–1285 CE (Bunbury et al., 2022), with written records starting with European arrival in the late 1700s (McFadgen, 2007). As such, a complete understanding of human-tsunami interactions in A/NZ, even in the relatively recent past, can only be established via the analysis of sedimentological, geological and geomorphological data, combined with archaeological and anthropological records where possible (Goff et al., 2021).
Of particular interest is the Kāpiti region in the SW North Island, A/NZ. Here previous geological and archaeological investigations identified a cluster of palaeotsunami evidence dated to the 15th century (Goff and Chagué-Goff, 2015) (Figure 1). While it is a common theme that our general understanding of the tsunami hazard for any particular coastline of the World is governed by its proximity to one or more subduction zones (e.g. Japan is more exposed than China, A/NZ more than Australia), this does not mean that more distal coasts are safe. Volcanic-related sources (Goff and Terry, 2016), tsunamigenic slope failures (Bondevik, 2022), and non-subduction zone related fault zones (Løvholt et al., 2019) all pose a risk.
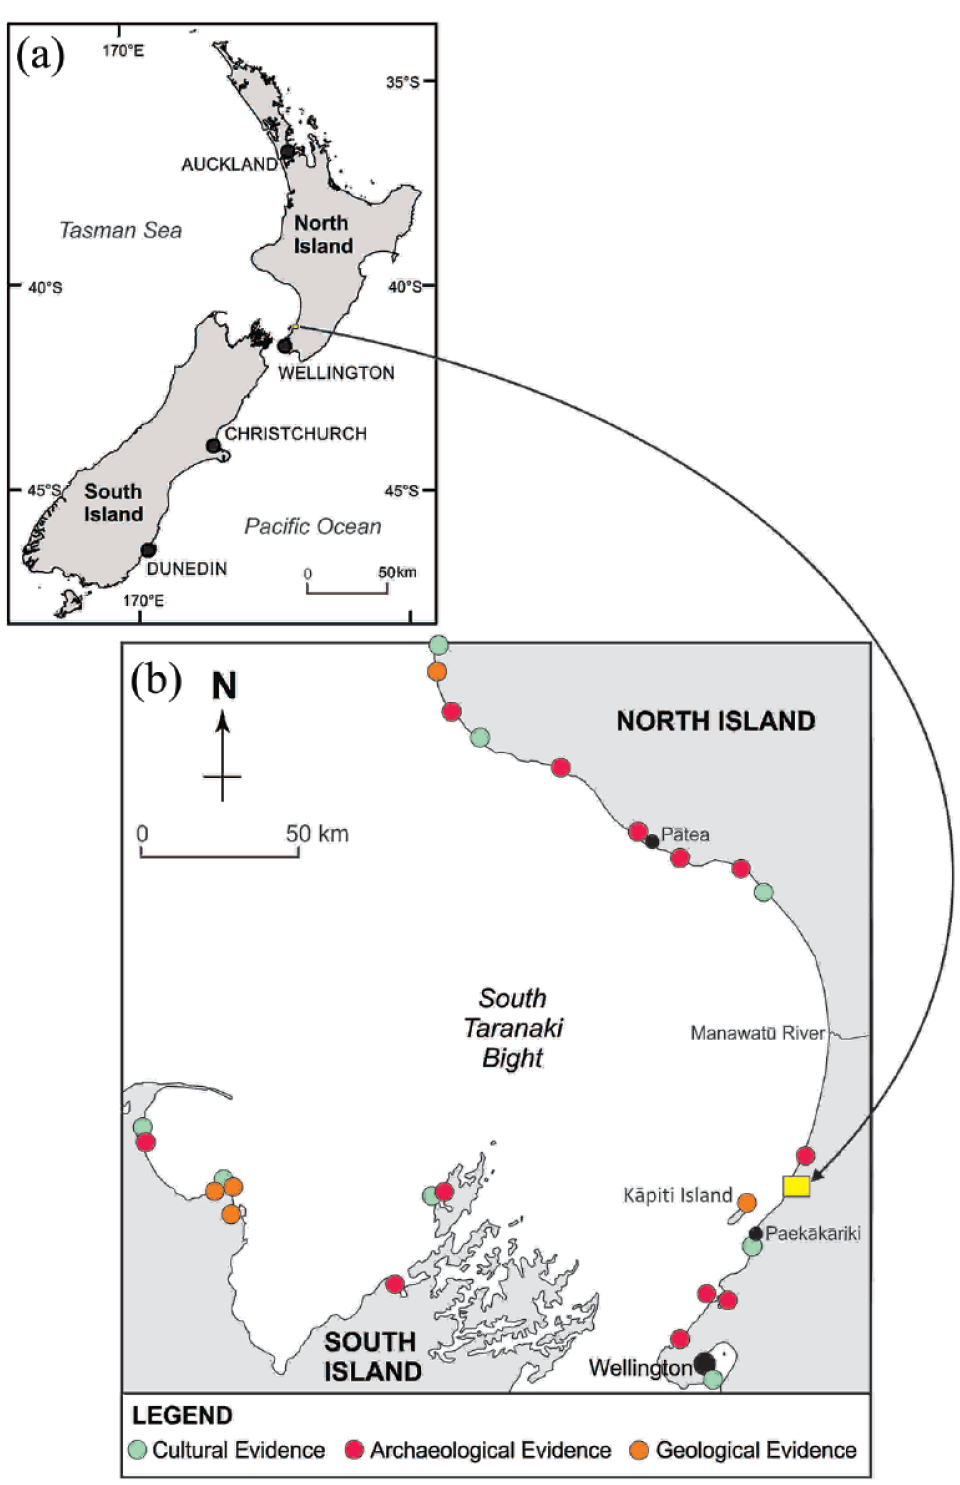
(a, b) Site location on the SW Coast of the North Island of Aotearoa/New Zealand. Yellow box marks approximate area of study site (see Figure 2 for details), filled circles indicate sites where evidence has been reported for a palaeotsunami dated to between 1470 CE and 1510 CE (Goff and Chagué-Goff, 2015).
This study aims to add to the growing body of evidence for the hypothesis that a single 15th century palaeotsunami occurred on a heretofore-unprecedented scale on the non-subduction side of the country. To do so, we studied the local geology, geomorphology and archaeology of a wetland area adjacent to Te Hāpua Road in the Kāpiti Coast District (Figure 2). Since local environmental variations in a coastal wetland can result in a varied response to a catastrophic saltwater inundation, a wide range of multi-proxy analyses were utilized. Sedimentological investigation included grainsize analysis and organic matter content, geochemistry and microfossil data, alongside a broader survey of the site, while the chronology of events was correlated using 14C dating and the results of previous regional archaeological investigations.
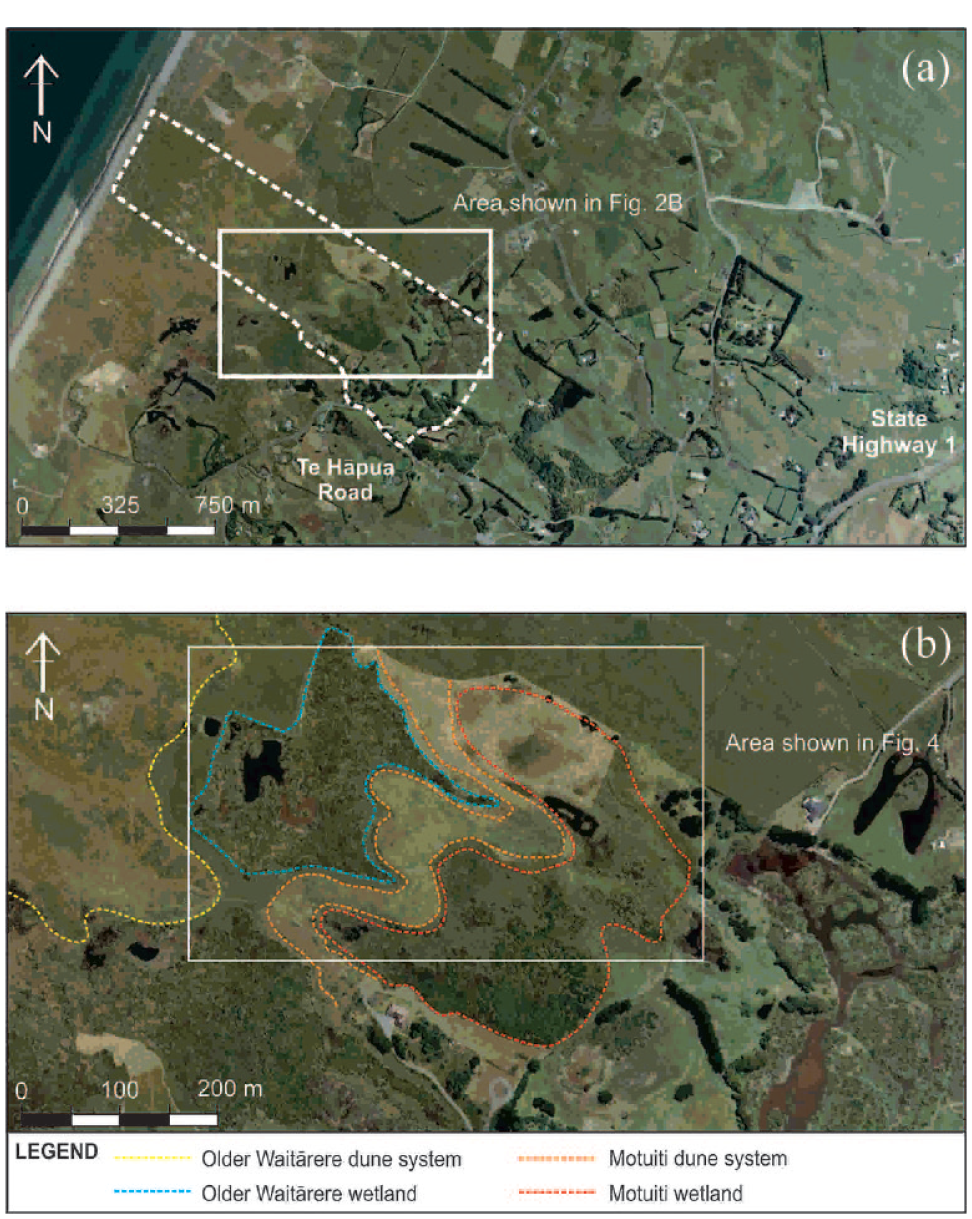
Te Hapua Road site. (a) Showing property boundary (dashed white line) and main study site (white box). (b) Detail of main study site outline association between dune systems and wetlands. White box outlines area shown in Figure 4.
Site description
The study site is located on the Kāpiti Coast, approximately 50 km north of Wellington on the southwest coast of the North Island, A/NZ. It is located within the southern part of a 200 km long sand dune belt that extends from Paekākāriki in the south to Pātea in the north (Figure 1) and sits just off Te Hāpua Road around 2 km from State Highway 1 (Figure 2). The site consists of two parabolic dune systems, the landward Motuiti (M) and seaward Older Waitārere (OW) dunes, with peat wetlands lying directly inland of each (Figure 2). This is a coastal dune landscape that consists mostly of cleared grazing land, with patches of native and introduced vegetation. The study site is approximately 0.3 km2.
A/NZ sits astride the plate boundary between the converging Australian and Pacific Plates in the southwest Pacific Ocean, creating a highly active tectonic setting. The Alpine fault, a geological expression of this plate boundary, extends for much of the length of the South Island. At its northernmost point, it splinters into a series of smaller faults (Goff and Chagué-Goff, 2015; Nodder, 1993) creating a number of active fault systems within the South Taranaki Bight including but not limited to the Cape Egmont, Kahurangi, Cape Foulwind, Manaia, Wakamārama and Wellington faults (Nodder, 1993) (Figure 3). Prior to 2000 it was recognized that the absence of an active subduction zone in this region did not preclude the possibility that large tsunamis could be generated, but rather that further work needed to be carried out. As a result, more recent research has added immensely to our understanding of the offshore fault systems and the tsunamis they may generate within the bight (e.g. Barnes and Ghisetti, 2013; Goff and Chagué-Goff, 2015; Lamarche et al., 2005; Nicol et al., 2007; Sibson and Ghisetti, 2010; Stagpoole et al., 2004) to the point where the tsunami hazard has been significantly enhanced from earlier assessments (Power, 2013).
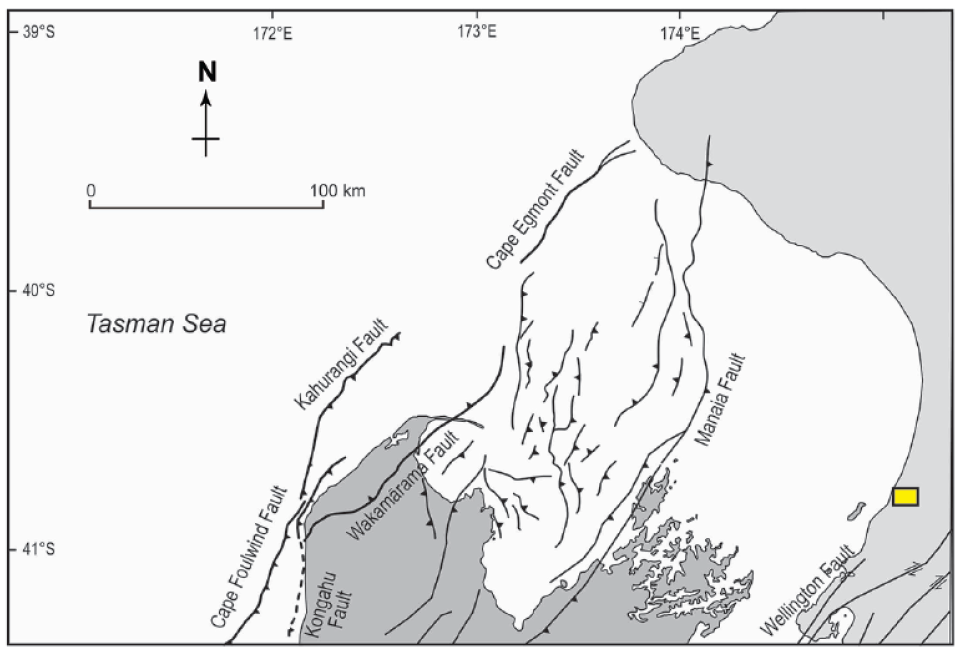
Summary of main fault systems of relevance to the study area (yellow box) discussed in the text (after Barnes and Ghisetti, 2013; Nicol et al., 2007; Nodder, 1993).
Goff and McFadgen (2001, 2003) categorized recent earthquake activity on the Kāpiti Coast into three time periods: the 13th century, the 15th century and 1750–1850 CE. It is the second period that is of interest to this paper, correlating with a shift inland and uphill of the relatively dense Māori population on the Kāpiti Coast and with evidence for a catastrophic tsunami in the region (Goff and Chagué-Goff, 2015). The evidence encompasses palaeotsunami deposits, archaeological data and Māori oral records (King et al., 2018; King and Goff, 2010).
The landforms of the Kāpiti District coastal plain have all been emplaced since sea level stabilized approximately 6500 years ago (Hawke and McConchie, 2006). Previous research into coastal dune formation in the region has theorized that several countrywide dune-building phases have occurred in the past 2000 years (Cowie, 1963; McFadgen, 1985). Of relevance to the site are the M and OW dune systems. The M dunes advanced approximately 800 years ago, while the OW dunes are thought to have formed in two separate stages; first around 500 years ago, followed by a more recent advance that began in the 1880s (McFadgen, 1985).
Dune-building phases in the area occurred during episodes of high sediment supply, followed by periods of quiescence when the dunes stabilized and soils developed (Clemmensen et al., 2001; Hesp and Thom, 1990; McFadgen, 1985). Episodes of high sediment supply had been assumed to be linked to climatic events, marine transgressions, anthropogenic land clearance or a combination thereof (Hesp and Thom, 1990; McFadgen, 1985). However, recent investigations have indicated that for coasts situated near active fault zones, seismic activity often correlates with cycles of dune building as well as tsunamis (Goff et al., 2008, 2009; Wells and Goff, 2006, 2007). The remobilization of an earlier dune phase by tsunami inundation immediately following an earthquake leads to a period of parabolic dune migration inland (Goff et al., 2008), while a younger seaward dune field is emplaced later when increased sediment supply is delivered to the coast by a process termed Seismic Driving (Goff and McFadgen, 2002; Goff and Sugawara, 2014).
Methodology
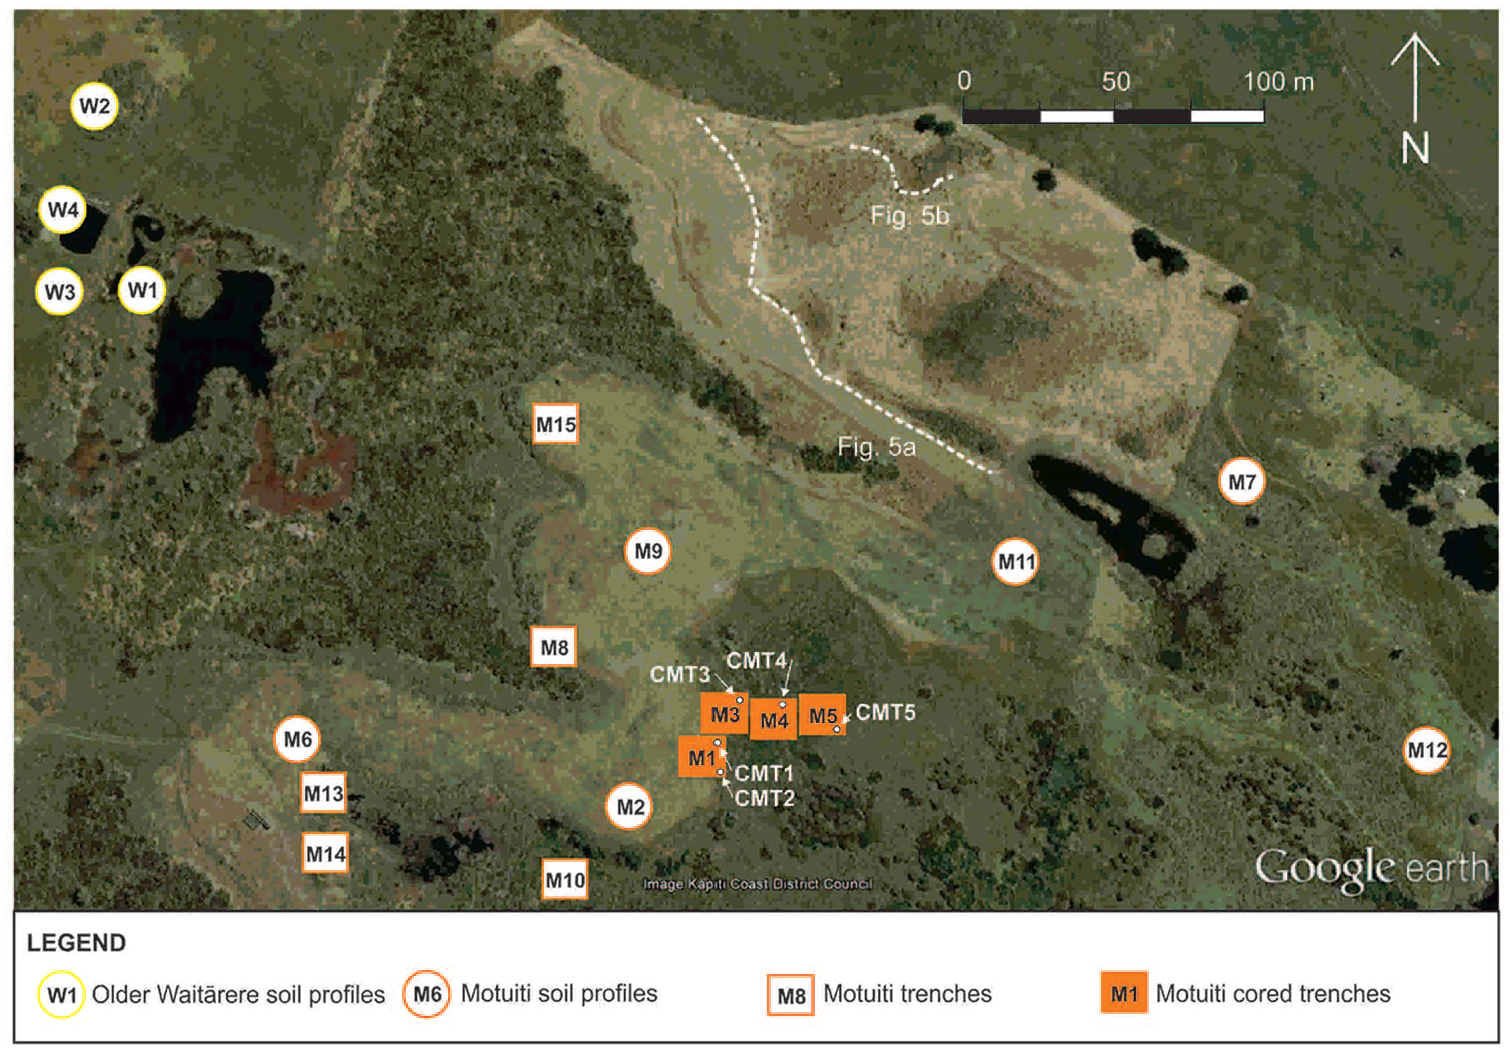
Nineteen trenches approximately 50 cm deep were excavated and their stratigraphy recorded from various locations around the site (Figure 4). The locations chosen represented a range of environments from sand dune to wetland. In four trenches (M1, M3, M4, M5) cores were taken from the trench face using split PVC piping (Figure 4). Cores ranged from 49 to 53 cm in length.
A differential global positioning system (DGPS) was used to accurately record the location of excavated trenches and tree stumps. The DGPS was calibrated to a point of known height and the resulting difference of 0.04 m was taken into account for all measurements. Transects were established using an optical Wild T1A theodolite with the depth of sand beneath the swamp found using a metal probe that was tied into the overall survey.
Grainsize analysis used a Malvern Mastersizer 2000 laser diffractometer, with the GRADISTAT programme (Blott and Pye, 2001) used to calculate the mean grainsize and sorting (after Folk and Ward, 1957). Diatom identification was based on the standards of Van der Werff and Huls (1957–1974), with the environmental classification of salinity preferences based on Denys (1991). Two cores were analysed geochemically using an ITRAX X-Ray Fluorescence (XRF) core scanner at the Australian Nuclear Science and Technology Organisation Institute of Environmental Research.
During an earlier field survey in 2008, a sample of wood was taken for radiocarbon dating from the stump of a drowned tree in the wetland to the east of the M dune system. During the field survey in 2013, further samples were taken from two stumps of drowned trees located in the northern part of the same wetland.
Results
Field survey
The M dune system presents a hairpin-type geomorphology oriented parallel to the shoreline (Figure 2). The M dunes have a lower elevation (average: 22.6 masl) than their younger OW counterparts (average: 25.0 masl), with the M wetland at 17.7 masl and the OW wetland lower, at a mean elevation of 16.6 masl. Two sections of remnant lake bench to the north of the M wetland are 19.3 masl (Figures 2 and 4).
Figure 5 outlines the areal extent of the existing drowned forest encompassing at least 140 tree stumps and the remains of fallen trees. The majority of fallen trees are oriented towards the NE. Two archaeological middens sites comprised mostly of shell hash and other mollusc remains were also identified during the field survey (Figure 5).
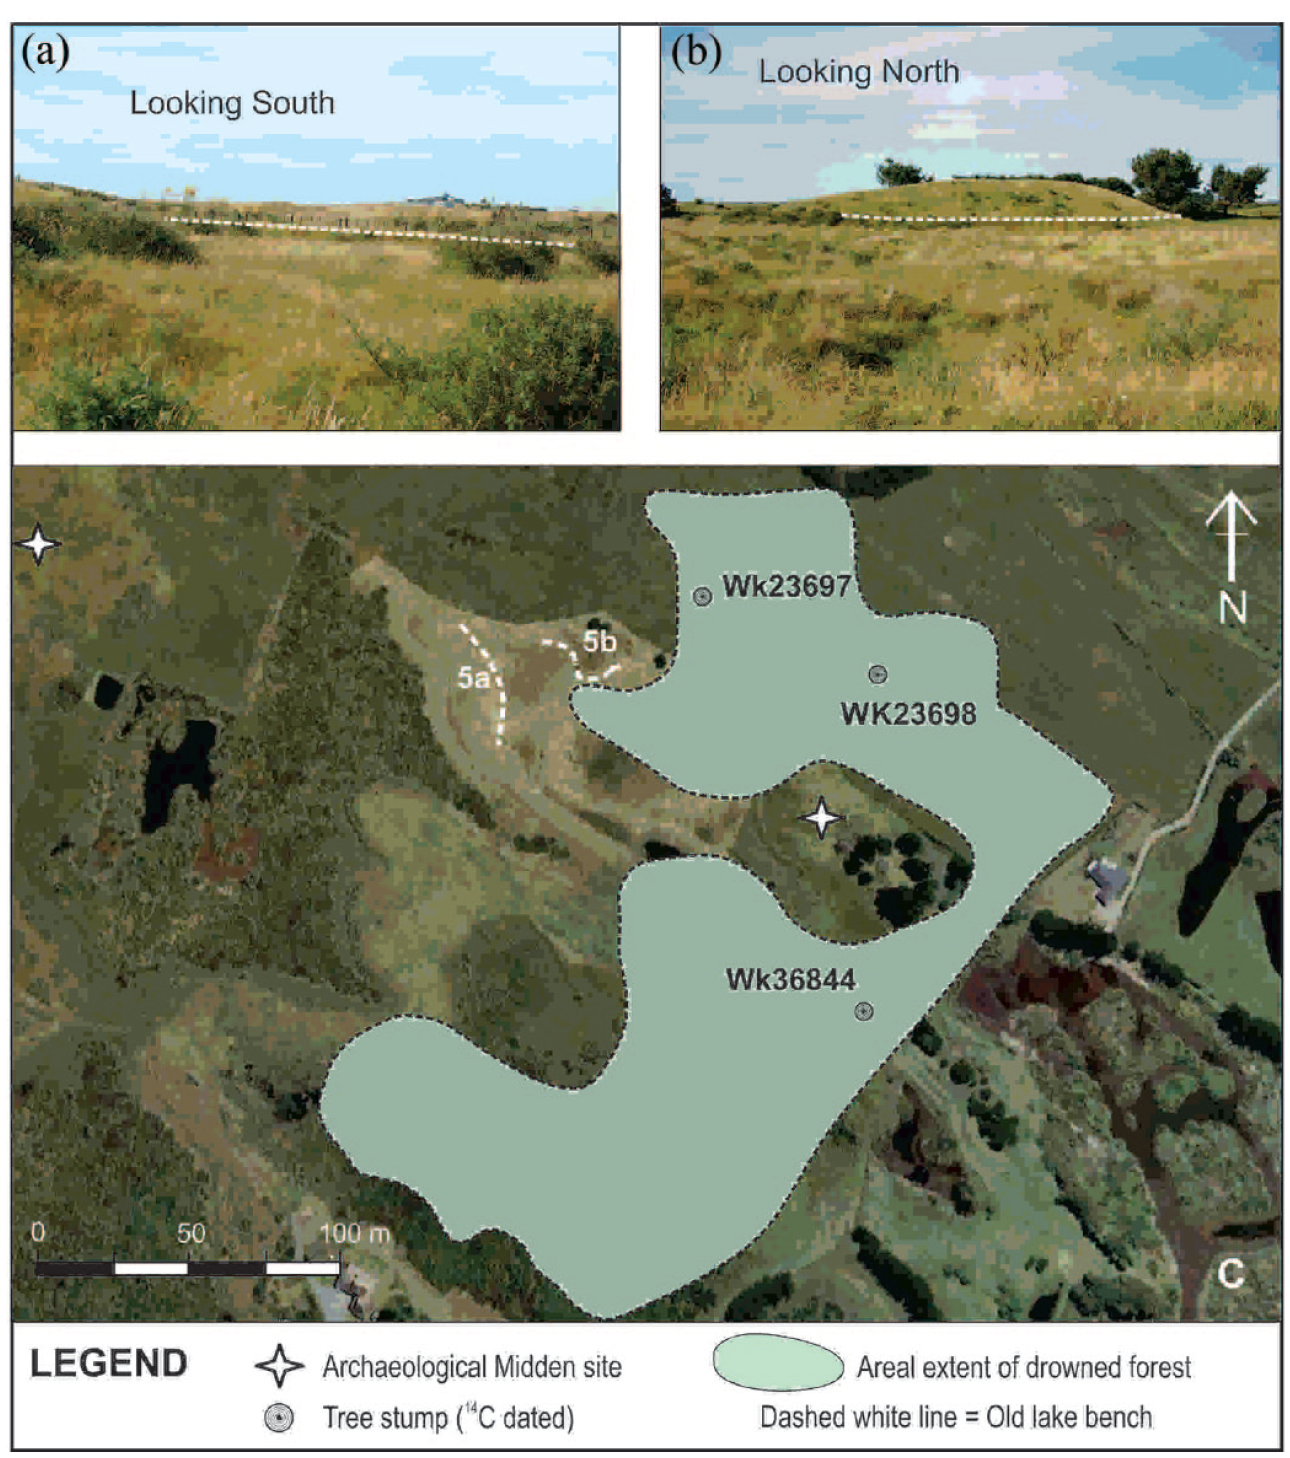
Photographs of lake benches. (a–c) Mapped limit of drowned forest defined by remnant tree stumps, location of radiocarbon dated stumps, and 15th century archaeological midden sites.
Three basic soil profiles were identified. First, the undisturbed, very poorly developed soils of the OW dunes (not shown). This comprised a weakly developed, very fine-grained A horizon, followed by an extremely weakly formed, very fine-grained B horizon. Second, the moderately well-developed, fine-grained A horizon and a relatively well-developed B horizon with medium blocky particles found on the seaward side of the lower M dunes (Figure 6a). Third, the more developed profile recorded on the landward side of the M dunes. The profile generally showed a saturated, weakly developed A horizon with fine prismatic particles, followed by a more developed B horizon with very fine to fine granular particles, overlying saturated buried A and B horizons (Figure 6b).
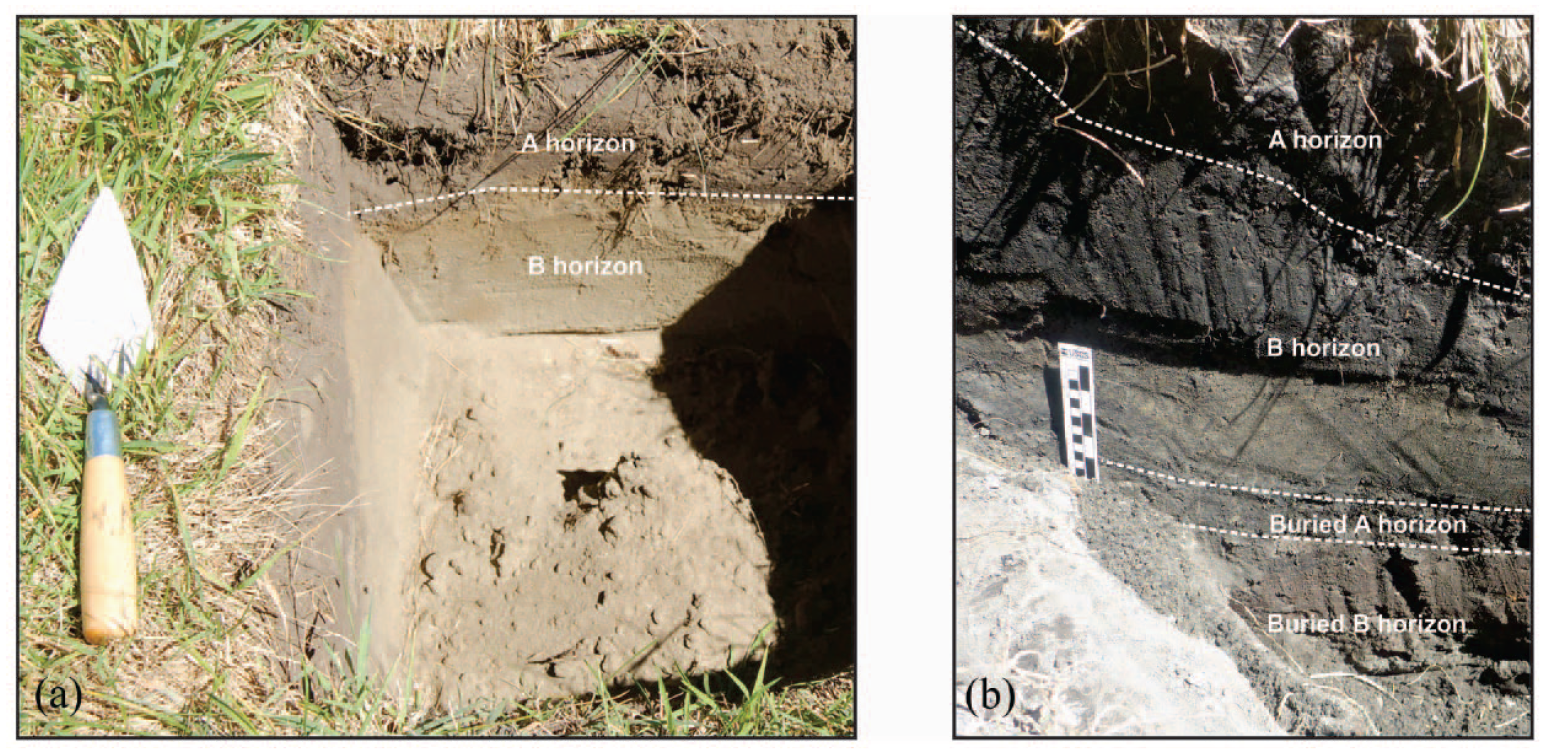
Soil profile. (a) Trench M15 – Seaward Motuiti dunes. (b) Trench M1 – Landward Motuiti dunes.
Laboratory analysis
Five cores, CMT1-5, were analysed with all possessing a similar stratigraphy, grainsize distribution, and geochemical signature. With this in mind, data from a single core, CMT2, are discussed in detail below largely because it presents the best stratigraphic representation of three ubiquitous sand layers found in all cores.
Core CMT2
Trench M1 (from which cores CMT1 and CMT2 were taken), is located 1.0 km inland from the coast at a height of 17.8 masl (Figure 4). It was excavated at the landward base of the M dunes, at the western edge of the M wetland.
The stratigraphy of Core CMT2 consists of a sandy topsoil underlain by a peaty soil that extends to a depth of 53 cm inter-fingered by two sand layers, S1 and S2, at 35–38 cm and 40–43 cm respectively. Beneath the peaty soil is a mottled sand soil that extends downcore to the base at 65 cm. This unit is separated by a third shell hash rich sand layer, S3, between 57 and 63 cm (Figure 7). Marked upper and lower wavy contacts are present throughout.
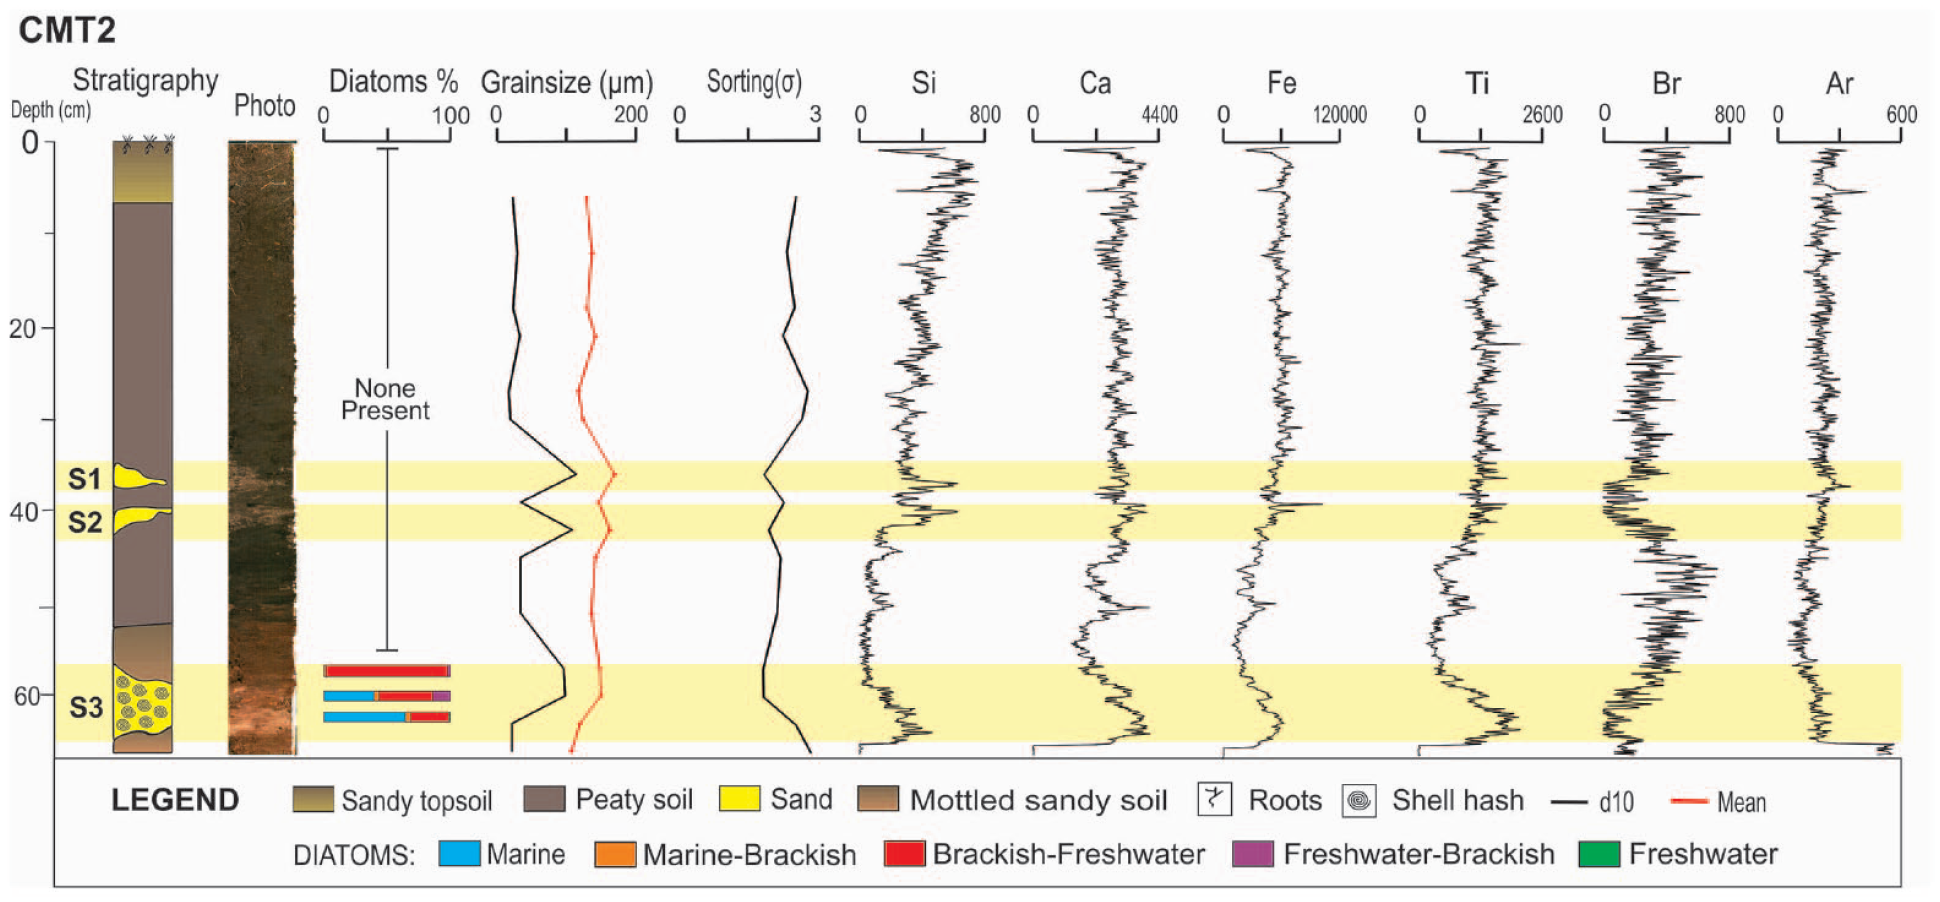
Stratigraphy, grainsize, geochemistry, and diatoms of core CMT2 (see Figure 4 for location) showing sand layers S1, S2, and S3.
Mean grainsize remains within a range of very fine to fine sand (106–168 µm) but with three distinct peaks between around 147 and 168 µm at 36, 42, and 57–60 cm. Each peak coincides with sand layers S1, S2 and S3, respectively. Particle sorting ranges from poorly to moderately sorted, with the better-sorted material coinciding with the coarser sand layers (S1, S2, and S3).
Elemental concentrations indicate that the most significant variations in the core’s geochemical profile correlate with the coarser-grained sand layers reported from the stratigraphy and grainsize analysis. All three sand layers, S1, S2, and S3, coincide with peaks in silica (Si). S2 and S3 also exhibit peaks in calcium (Ca) and iron (Fe), with the latter having an additional peak in titanium (Ti). Bromine (Br) on the other hand inversely correlates with each sand layer. Several relatively minor peaks can also be identified in Ca, Fe and Br at 50 cm. Argon (Ar) is included for reliability purposes, and remains stable throughout the core’s profile.
Diatom samples were taken at 3 cm intervals downcore with only three ultimately containing any frustules. All three samples were from within sand layer S3 at 57, 60, and 63 cm, with total counts of 286, 269 and 256 frustules respectively. The results are summarized in Table 1. Most notably there is a marked polyhalobous (marine) signal within S3, rising from 0% (57 cm) to 42.1% (60 cm) to 64.7% (63 cm) downcore. This rise inversely correlates with oligohalobion indifferent (brackish-fresh) diatoms, which decrease from 96.6% to 30.9% over the three samples. Freshwater diatoms are almost completely absent from the core, comprising only 0.4% of the deepest sample.
14C dates for tree stumps (see Figure 5).
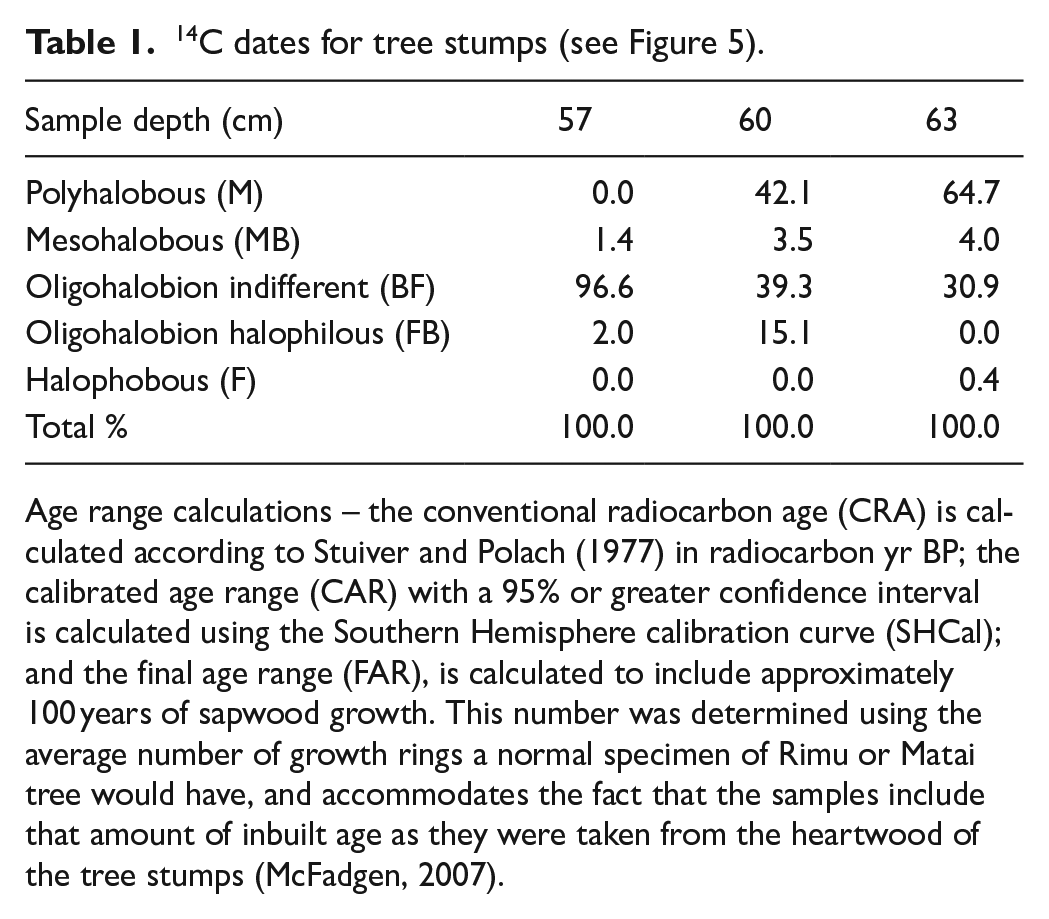
Age range calculations – the conventional radiocarbon age (CRA) is calculated according to Stuiver and Polach (1977) in radiocarbon yr BP; the calibrated age range (CAR) with a 95% or greater confidence interval is calculated using the Southern Hemisphere calibration curve (SHCal); and the final age range (FAR), is calculated to include approximately 100 years of sapwood growth. This number was determined using the average number of growth rings a normal specimen of Rimu or Matai tree would have, and accommodates the fact that the samples include that amount of inbuilt age as they were taken from the heartwood of the tree stumps (McFadgen, 2007).
Chronology
Three wood samples taken from the M wetland (Figures 2 and 5) were submitted for 14C dating at the University of Waikato Radiocarbon Dating Laboratory. All were heartwood samples, two of Rimu (Dacrydium cupressinum) and one of Matai (Prumnopitys taxifolia). The results are summarized in Table 2. Analysis provided three results for each sample: the conventional radiocarbon age (CRA), the calibrated age range (CAR) and the final age range (FAR). The average conventional radiocarbon age was 705 years before present day (yr BP), with a mean error of ± 38 years. The calibrated age range of each sample falls within an age bracket of 1155–1426 CE. Once the sapwood growth is taken into account, this range changes to 1250–1530 CE, with the Rimu specimens being significantly younger than the Matai sample, covering an FAR of 1390-1530 CE.
Cumulative percentage diatom counts for CMT4 based upon salinity preference.
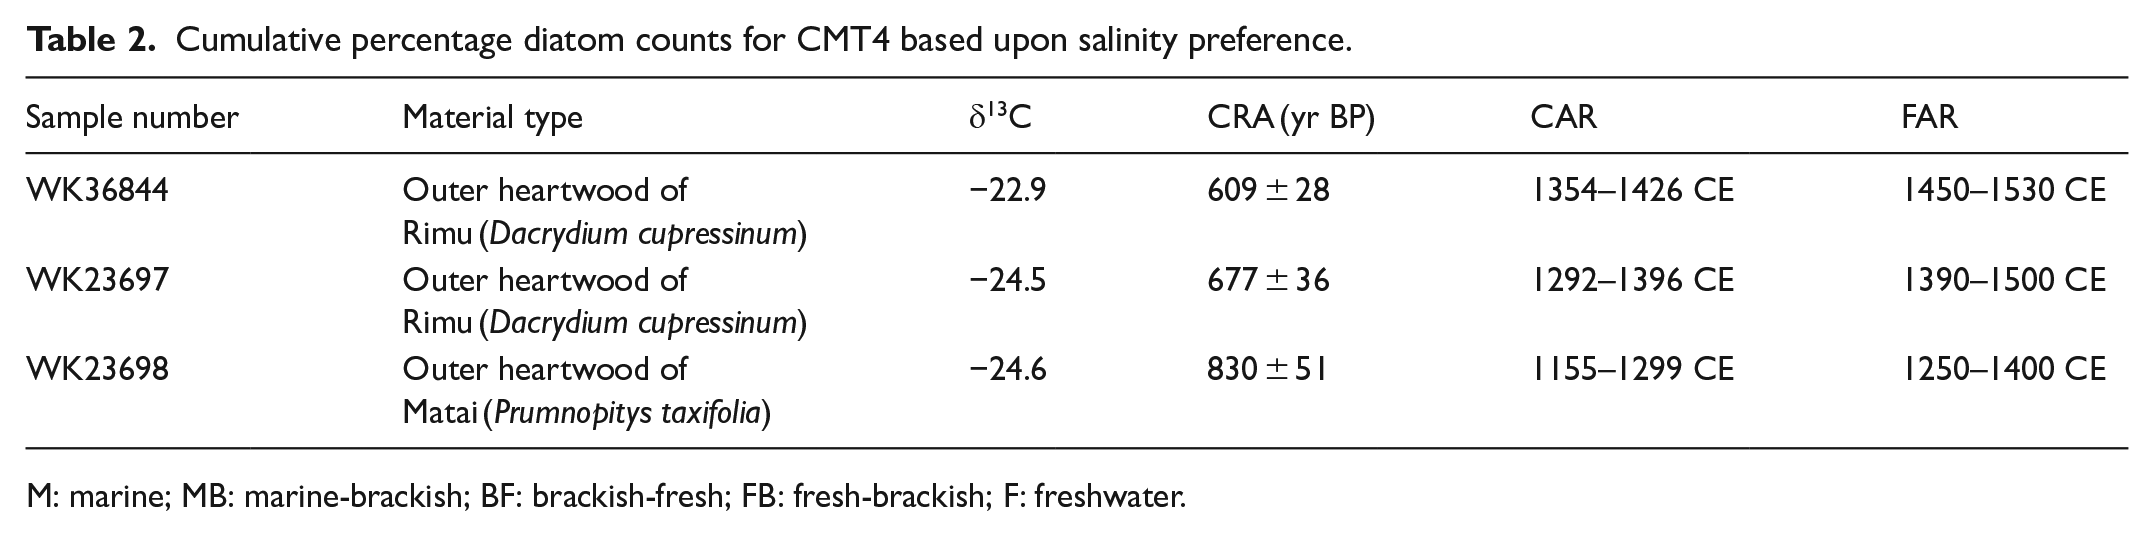
M: marine; MB: marine-brackish; BF: brackish-fresh; FB: fresh-brackish; F: freshwater.
Discussion
The identification of a local and potentially regional signal for a palaeotsunami in the region necessitates an assessment of all possible evidence placed within the appropriate tectonic and human context, and the consideration of other possible environmental drivers of landscape change.
Geomorphological change
As noted in the site description above, the geomorphology of the site is dominated by two distinct dune systems, the M and OW. The M dune system formed approximately 800 years ago, coincident with an increased supply of fine sediment to the coast following a known rupture of the Wellington fault (Figure 3) around 790–930 years BP (Goff and McFadgen, 2002; Langridge et al., 2011; McFadgen, 1985, 2007). The OW dunes are thought to have formed in two separate stages; first around 500 years ago, with a more recent advance in the 1880s (McFadgen, 1985). The former stage coincided with another rupture of the Wellington fault dated to around 1440–1640 CE (Berryman et al., 2002) and an associated aggradation surface that is part of the seismic driving process that would have produced the finer sediment for dune formation (Goff and McFadgen, 2002). While not relevant to the time period in question in this paper, the more recent advance of the OW dunes appears to be related to invasive human disturbance (associated with European colonization) of the dune vegetation leading to remobilization (Hawke and McConchie, 2006).
While this is the accepted chronology of dune formation in the region, our field survey indicates that, like the younger OW dunes, the M system also appears to have been remobilised following initial deposition. Geomorphologically, the M dunes are expressed in the landscape as parabolic ‘hairpin’ features (Figure 2). During the original process of dune formation there were undoubtedly some topographical irregularities in their geomorphology, creating points of weakness more vulnerable to blow-outs. Equally though, a tsunami would have had the greatest impact on such points of weakness, removing and re-depositing large amounts of sediment to form the intense curves seen in the present-day dune system (Figure 2) (Goff et al., 2008, 2009). Evidence for a tsunami as opposed to an aeolian geomorphological process may well be represented in the dune form with a consistently lower mean elevation between the OW and M systems. The M dunes are in excess of 3 m lower, an incongruity potentially accounted for by a catastrophic event removing the surface sediment and redepositing it in the depression to the east to form the M wetland (Figure 7).
If this remobilization largely occurred in a single event it would have had far-reaching consequences for the local drainage. The existence and location of lake benches in the M wetland suggests that there was originally a flowing body of water, likely a river or stream, running westwards through the area and draining into the ocean (Figure 8). A marked sedimentation event such as that caused by tsunami remobilization of the M dunes could have blocked the drainage outlet, causing the river to pond, forming a lake and eventually the existing wetland.
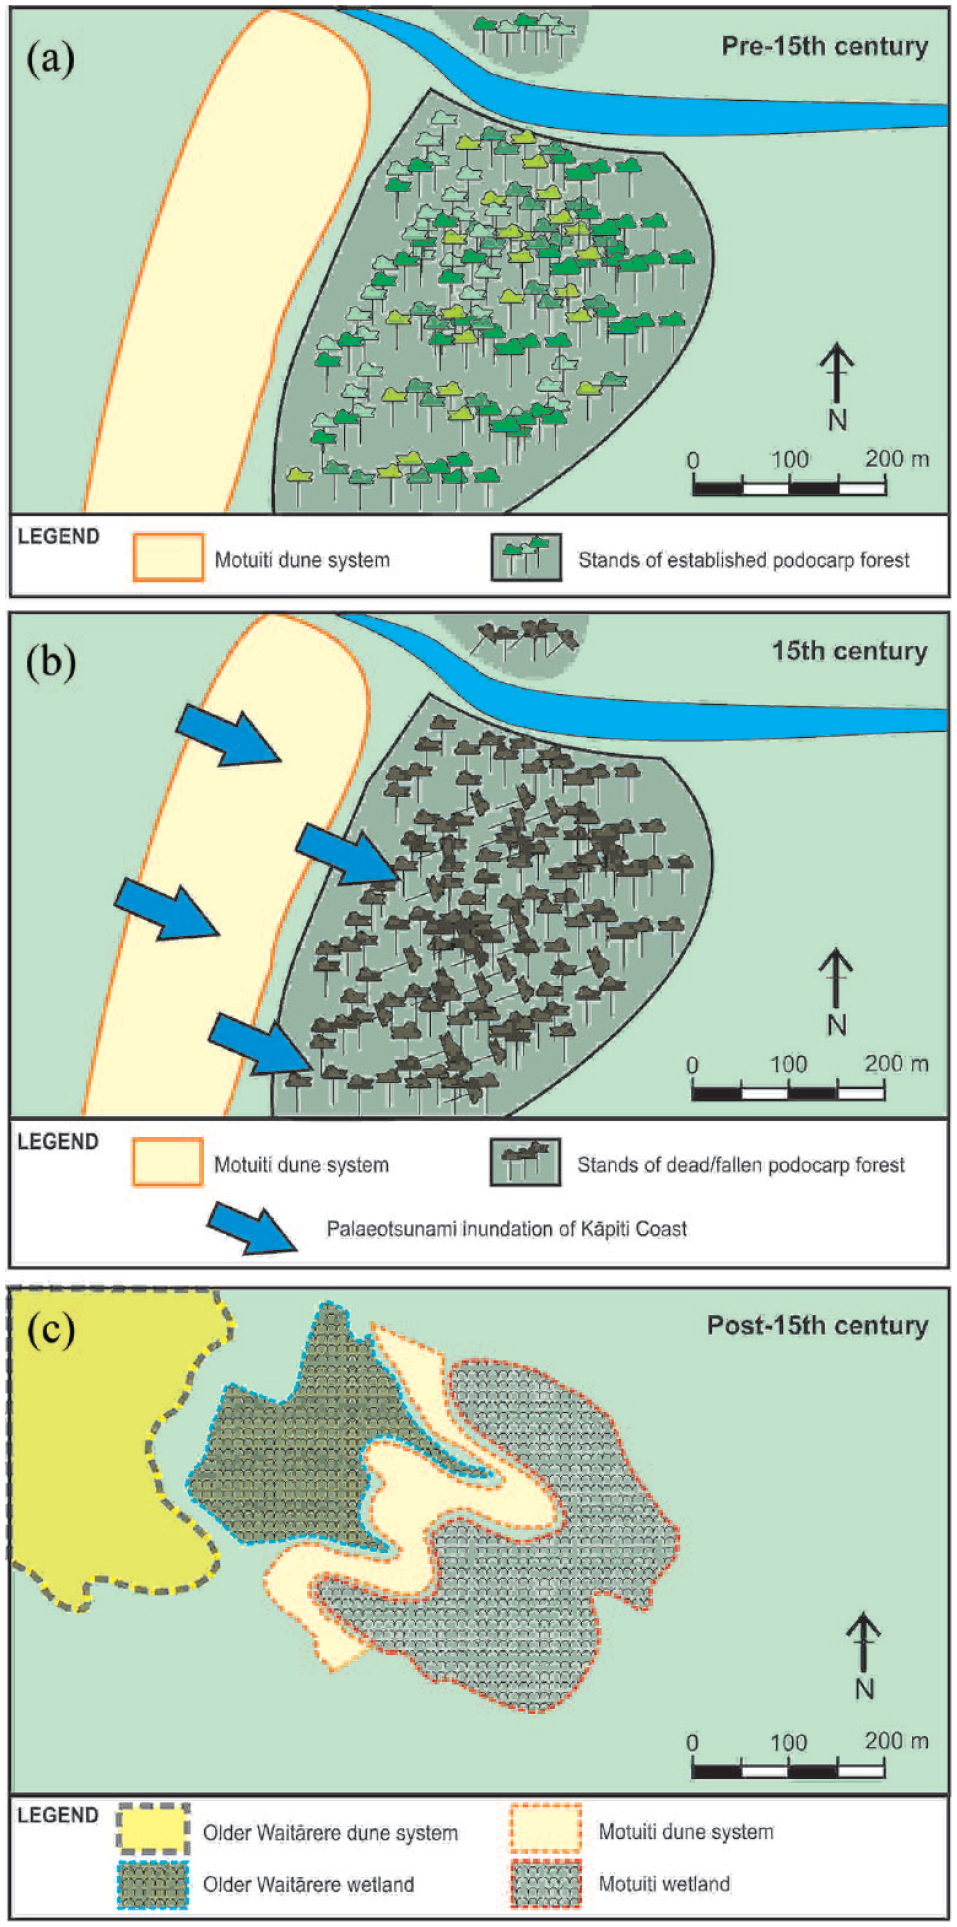
Te Hapua Road site. (a) Geomorphology prior to (pre-15th century). (b) During (15th century). (c) Geomorphology following (post-15th century) palaeotsunami inundation.
The results of the soil profiling present several lines of evidence. Firstly, they corroborate the relative ages of the sand dunes as the increasing development of soil structure inland indicates an older age for the M system. A richer yellow colour to the OW dune sand signifies that less elemental leaching from the soil has occurred, as less time has passed since the system’s stabilization. Secondly, the existence of two markedly different soil profile types within the M system supports the possibility of a single remobilising event. The first profile type was found on the dunes closer to the potential event source (the ocean) and at lower elevations than the second profile type. This latter profile type contains several indicators of a tsunamigenic deposit, including a buried soil overlain by remobilised sand separated by a sharp boundary.
Stratigraphic disturbance
Possible evidence for a tsunami is significantly enhanced by examining the stratigraphic data. Changes in average grainsize are generally indicative of an energy regime change, while better sorting represents the introduction of a layer containing a narrow grainsize range of sand into the system and is often characteristic of a tsunami deposit in such environments (e.g. Chagué-Goff et al., 2012a). Evidence for both can be seen in the grainsize data, particularly in core CMT2 where peaks in mean grainsize correlate with improved particle sorting in the units marked S1, S2 and S3 (Figure 7). S3 is of particular interest, as these characteristics are further enhanced by a marked increase in marine diatoms with depth, most likely indicating a catastrophic saltwater inundation. Further, the increase in marine diatoms coincides with the presence of shell hash in every core, indicating a sudden disturbance rather than long-term environmental change.
The geochemical signal at Te Hapua is further evidence of stratigraphic change. Elemental changes associated with tsunami inundation are often poorly preserved in such sandy environments, and can result in an ambiguous signal (Chagué-Goff et al., 2002). However, the geochemistry of core CMT2 provides reasonable evidence for a tsunamigenic event in the sand layer labelled S3 (Figure 7). Peaks in silica (Si), usually associated with higher quartz content, are often the result of a saltwater inundation carrying sand in transport (Jaffe and Gelfenbuam, 2007). Si peaks in S1 and S2 are not associated with any other marked geochemical changes, and coincide with thin layers of visible, relatively well-sorted sand. The lack of other tsunamigenic indicators, such as increased organic matter or shell hash, suggests that these sand deposits may be the result of two separate storm events. That the S3 deposition possesses a different material source becomes clear when compared with the elemental compositions of S1 and S2. In S3, a peak in Si corresponds with similar peaks in Ca, Fe, Ti, and inversely correlates with Br. Ca is often associated with marine sediments containing shells and shell hash containing calcium carbonate (Rothwell et al., 2006). Fe and Ti are metallic elements found in laminate depositions of heavy minerals concentrated in tsunami inundations, and require high-energy events for mobilization and deposition (Goff et al., 2004, 2010; Nichol et al., 2007). Finally, Br is a recognized indicator of marine sediments; its inverse correlation is evidence of the lack of preservation of such indicators in the local environment (Chagué-Goff et al., 2002). Its absence suggests that at the time of deposition, other indicative elements were deposited that have since been leached or remobilised in the environment.
The Si peaks seen in S1, S2 and S3 all correlate with a marked rise in average grainsize and improved particle sorting (Figure 7). However, S3 is unique in that it also corresponds to a significant peak in Loss on Ignition (LOI) values (not shown), often seen when organic matter is ‘rafted’ in and deposited by tsunami events (Chagué-Goff et al., 2011). The S3 deposit also coarsens upwards, a feature previously identified in tsunamigenic deposits (e.g. Goff et al., 2011). The unconformable contact between the S3 deposits and its surrounding stratigraphic unit is characteristic of the sudden input of sediment.
Chronological context
The number (at least 140), location and species of the drowned trees found at the site indicates that a sizeable podocarp forest once existed landward of the M system. Such a forest would take approximately 200 years to establish, and would require dry, sheltered conditions (Goff et al., 2004). Therefore, the dune system must have stabilized prior to the forest growth – and indeed, must have been considerably taller and more substantial to provide protection from excessive salt spray for the trees to flourish, further supporting the theory that the top of the dune system was removed by an event.
An initial interpretation of the results of the 14C dating analysis determined that the death of the forest probably occurred in the early 15th century, around 1400 CE. The similarity of the results obtained for each sample indicates that it was a singular event that caused the trees’ death, rather than a gradual environmental change over time. The trees are either Rimu (D. cupressinum) or Matai (P. taxifolia), with the former being the hardier of the two in these conditions and once established are tolerant of exposure to wind and salt spray growing in a wide range of soil types except the very wettest (Norton et al., 1988). Matai, while being a dominant lowland species, is typical of drier regions of New Zealand (Wardle, 1991). It is therefore plausible that the Matai FAR may not specifically date the age of the event since it is more susceptible to minor changes in groundwater. If this is the case it would place the event closer to the mid-15th century. The most likely explanation is that a singular, catastrophic event killed the trees, markedly altering the environment and causing saline-rich water to pond behind a remobilised dune barrier. This prevented the podocarps from recovering or re-establishing.
Regional catastrophic event signal
Seismic record
The larger regional context strengthens the argument for a catastrophic tsunami affecting the Te Hapua site in the 15th century. Multiple lines of evidence from this period, cultural, archaeological and geological, have been identified in the South Taranaki Bight that encompasses the Kāpiti region, revealing a coastline affected by tsunami inundation (Figure 1) (Goff and Chagué-Goff, 2015).
As yet, the precise source for this event is unclear but it seems most likely that it relates to one large catastrophic event as opposed to a cluster of small tsunamis (Goff et al., 2021; Goff and Chagué-Goff, 2015). Given the regional nature of the evidence it seems reasonable to propose that the source may have resulted from movement of one of the larger faults within the South Taranaki Bight (Figure 3). The recent seismic history of most of these faults is poorly understood although it appears that the Wakamarama fault was active in the 15th century, with its movement resulting in 3 m of uplift identified at the mouth of the Heaphy River (McFadgen and Goff, 2003). Further studies are needed to clarify this issue, not only of a single fault rupture but also whether a concentrated flurry of seismic activity could be responsible (Power, 2013). For example, an alternative source is suggested from Okupe Lagoon on the northern side of Kāpiti Island (Figure 1) where there is evidence for a c.15th century earthquake and tsunami, the former possibly associated with a degree of subsidence (Cochran et al., 2015; Goff et al., 2000) that may well have enhanced tsunami erosion (e.g. McSaveney et al., 2000).
Geoarchaeological record
The geoarchaeological record indicates that there was a significant change in prehistoric Māori use of this coastal region during the 15th century, with widespread settlement abandonment occurring with movement inland to higher elevations (e.g. Goff and McFadgen, 2003; Wellman, 1962).
The two shell middens identified were compared with previous archaeological research along the Kāpiti coast, and indicate short term prehistoric Māori occupation in the 15th century (McFadgen, 2010). It can be reasonably inferred that any local population present in the region at the time of the tsunami in the 15th century would have been adversely affected. Impacts of such an event include a loss of food sources, and widespread destruction of vegetation and structures such as settlements, canoes and coastal gardens (Goff and McFadgen, 2003). Specific to the site, tsunami inundation would have caused site abandonment and the subsequent formation of the wetland would have raised the water table, significantly reducing available land for settlement and removing riverine and estuarine resources. Equally, the environmental affordance of the area would have been markedly reduced with the loss of valuable forest resources. Furthermore, the inundated area would have been unsuitable for horticultural cultivation for some considerable time after the event, due to nutrient leaching and an increase in salinity levels (e.g. Chagué-Goff et al., 2012b). No post-15th century prehistoric Māori occupation sites were found.
The Māori response to the proposed event, with communities often moving many kilometres inland and uphill from the low-lying coast, indicates the scale of the event and the scope of its impacts. Storage pits for food and other materials were also moved inland and to higher elevations, while increased resource competition led to an increasingly war-like population (Goff and McFadgen, 2001). The impacts of a similar event on the current population and infrastructure on the Kāpiti Coast would be different, though equally significant and adverse – the destruction of property, agricultural resources and livestock being the most intense and far-reaching, and loss of human life a very real possibility.
The human responses reported here are by no means unique. Changes in prehistoric human settlement patterns and lifestyles brought about by seismic activity and tsunamis along the Pacific Northwest coast of the United States have been well documented (e.g. Goff et al., 2020; Hutchinson et al., 2019; Hutchinson and McMillan, 1997; Ludwin et al., 2007). Additionally, increases in resource competition and warfare, and changes in settlement patterns and culture have been recorded throughout Polynesia following similar catastrophic events (Goff and Nunn, 2016; Kirch, 1994).
Conclusions
There is considerable evidence for the remobilization of the Motuiti dunes at Te Hapua in the 15th century. Local geological, geomorphological, and archaeological evidence for catastrophic tsunami inundation matches well with a similar regional signal for a large-scale seismically-driven event. Of particular note is the distinct tsunami geomorphology of the dune system, one that could easily be mistaken for a more prosaic aeolian interpretation. This finding highlights the importance of both the use of multi-proxy analyses and the consideration of the wider regional context. While the evidence most likely indicates a mid-15th century tsunami, its occurrence on what is considered to be the safer, non-subduction side of the North Island of Aotearoa/New Zealand poses an important question – what is the source? It seems most reasonable to propose not only a seismic origin, but also that the tsunami was generated by rupture of one or more of the many faults in the South Taranaki Bight.
The identification of the most likely source will not only solve this conundrum but also shed considerable light on the true nature of the tsunami hazard for this region.
Footnotes
Acknowledgements
Grateful acknowledgement goes to the Australian Nuclear Science and Technology Organisation (ANSTO) for their assistance in geochemical analysis. Dr Chagué is also thanked for help with the interpretation of the geochemical data.
Funding
The author(s) received no financial support for the research, authorship, and/or publication of this article.