
Abstract
Through unfamiliar and at times marginal environments, successful colonisation of the Pacific Islands relied upon the introduction of domesticated flora and fauna as well as widespread burning to reduce forests and lowland vegetation for agricultural production. These transformations led to the extinction of avifauna, the reduction of forests, and extensive slope erosion and sedimentation into valleys and along shorelines. To date, most attention has been paid to human-induced changes to the terrestrial landscape. In this paper we present the archaeomalacological results from the deeply stratified coastal Kawela Mound, one of the oldest habitation sites in the Hawaiian Islands, with occupation beginning during the 12th century AD. We describe how anthropogenic change of the terrestrial landscape caused sediment run-off, increased shoreline turbidity, and progradation of the adjacent shoreline altering marine habitats, which is recorded in the diversity, size, and habitat preference of food shellfish harvested over nearly eight centuries. The construction of ancient stone-walled fishponds along the littoral shore provided an artificial rocky habitat for shellfish otherwise uncommon along the sandy coast. Consequently, AMS dated layers containing these shellfish provide an indirect avenue for determining the chronology of stone-walled fishponds, the construction of which was directed under the aegis of elites and thus one of the hallmarks of increasing social complexity during the last two centuries before Contact in the late 18th century.
Keywords
Introduction
The world today is increasingly threatened by climate change, sea level rise, forest clearance, and declining biodiversity (Department of Agriculture, Water and the Environment, 2021; Jackson et al., 2001; National Oceanic and Atmospheric Administration [NOAA], 2009; Taranger et al., 2015). Due to the growing magnitude of human-driven environmental changes, the current era has been labelled the Anthropocene, the geologic age shaped by millennia-long complex interplays between people and their local, regional, and global environments (e.g. Braje, 2015; Erlandson and Braje, 2013; Lewis and Maslin, 2015; Rick et al., 2013). In the face of continued environmental uncertainty, investigating the deep history of human ecodynamics illuminates long-term human-environment interactions that have important roles for developing future viable and resilient management systems (Braje et al., 2017).
Archaeological research at centuries to millennial time scales has documented countless examples of humans transforming their environments around the world, particularly on islands (Braje et al., 2017; Kirch, 1982; Rick et al., 2013; e.g. Fitzpatrick and Giovas, 2021; Spriggs, 1991). In evolutionary and environmental sciences, islands have long been considered unique due to their distinctive characteristics–inherent boundedness (dispersal barriers), relative isolation, size, limited resources, reduced competition, decrease in biodiversity, and biogeographic variability (DiNapoli and Leppard, 2018: 157; MacArthur and Wilson, 1967; Rolett and Diamond, 2004). Due to the fragility of island biota to external disturbances, the arrival of people initiated sharp declines in biodiversity resulting in the marked transformation of insular ecosystems.
The colonisation of islands is often characterised by extensive human predation of endemic fauna, the introduction of non-native flora and fauna–including culturally important domesticates, and deforestation through a combination of landscape burning and clearance for expanding agriculture and to improve access to prey (McGlone et al., 2005; Rolett and Diamond, 2004; but see also Hunt and Lipo, 2009). These behaviours cumulatively resulted in processes of extinction, erosion, and ecological transformation (see review in Braje et al., 2017; Kirch, 2004), and have been identified on Mediterranean islands (Allen, 2003; Bover et al., 2016; Butzer, 2005), California’s Channel Islands (Anderson et al., 2010; Hofman et al., 2015; Jones et al., 2008), the Caribbean (Giovas et al., 2012; Soto-Centeno and Steadman, 2015; Steadman et al., 2015) and across the Pacific (Fitzpatrick and Giovas, 2021; Hawkins et al., 2016; Summerhayes et al., 2017; Weisler, 1995; White, 2004).
Differences in island size and type (e.g. high volcanic, continental, makatea or raised limestone, and atolls), and isolation (i.e. nearest island or continent), play a central role in determining the degree of anthropogenic impact (Braje et al., 2017: 287; Weisler, 1999). Since species richness increases with island area and decreases with island isolation, it is no surprise that isolated islands and archipelagos, such as those of Remote Oceania, were fundamentally transformed by human arrival (Anderson, 2002; Kahn et al., 2015; Kirch, 1982). To colonise these unfamiliar and at times marginal environments, Pacific Island colonists relied upon the introduction of a transported landscape (Anderson, 1952; Kirch, 1982). This suite of introduced fauna such as pigs (Sus scrofa), dogs (Canis familiaris), jungle fowl (Gallus gallus), and rats (Rattus spp.) and cultigens, including different kinds of taro (Colocasia esculenta, Cyrtosperma sp.), yam (Dioscorea spp.), coconut (Cocos nucifera), bananas (Musa spp.) and breadfruit (Artocarpus altilis), turned the unfamiliar natural environment into a cultural landscape (Bayman and Dye, 2013: 36–37; Hommon, 2013: 55, 78–80). The arrival of Pacific colonisers with this suite of non-native biota, particularly rats (Rattus spp.), accelerated the extirpation and extinction of endemic avifauna (Steadman, 1995, 2006) and the gradual disappearance of lowland forests (Anderson, 2002, 2009; Athens et al., 2002; Kirch, 2005; Spriggs, 1997). Direct human predation has also been credited as a cause of avifaunal extinctions (Weisler and Gargett, 1993), with the rapid extermination of the moas (Dinornithidae, Emeidae) in New Zealand as a prime example (Anderson, 1989; Holdaway and Jacomb, 2000). The margins of East Polynesia also provide examples of extensive deforestation–the loss of forest cover on Easter Island once dominated by the now extinct Jubaea palm (Flenley et al., 1991; Flenley and Bahn, 2002; Orliac, 2000), the transformation of Hawaiian Pritchardia spp. dominated dryland forests to herbs and shrubs (Athens, 2009; Hunt and Lipo, 2009; Spriggs, 1991), and the deforestation of large tracts of the North and South Islands of New Zealand (Dodson, 1992; McWethy et al., 2014).
The consequence of these ecological transformations were biophysical cascades that affected ‘trophic systems, nutrient cycling, hydrology and soils’ (Braje et al., 2017: 289; see also Chynoweth et al., 2013; D’Antonio et al., 2011; Swift et al., 2018). For instance, Rolett and Diamond (2004; but see Hunt and Lipo, 2013) have suggested that the deforestation of Easter Island and Mangareva was exacerbated by extensive predation on nesting seabirds, which deposit nutrients (e.g. phosphorus, nitrogen) into terrestrial ecosystems and burrow into soils, influencing vegetation (Smith et al., 2011). Widespread deforestation resulted in extensive erosion and sedimentation (Butzer, 1971; French, 2003; Kirch, 2005; Waters, 1992). On Aneityum Island, southern Vanuatu, charcoal and pollen analysis documented the onset of burning (associated with shifting cultivation) and a decline in tree and shrub taxa relative to increases in grasses and ferns (Spriggs, 1986). This was followed by major episodes of valley infilling and coastal progradation with sediment from steep volcanic hillslopes. Whilst the loss of endemic island biota is a biodiversity tragedy, ecosystem transformation in some cases can be considered a success for sustainable island subsistence economies (Hunt and Lipo, 2013; Spriggs, 1997). People developed, managed, and maintained domesticated, cultural landscapes that assisted their survival in new, often isolated, island environments. For example, across the Pacific Islands, the mobilisation of hill-country sediments into the valleys and coasts both facilitated intensive lowland agriculture and increased island area by transforming reef flats into coastal silt plains (Enright and Gosden, 1992: 192), thereby expanding arable land, introducing nutrient-rich volcanic sediments, and enhancing overall agricultural productivity. Similar trajectories of deforestation, erosion, and sediment redeposition have been identified in Fiji (Dickinson et al., 1998; Hope et al., 2009), the Society Islands (Lepofsky et al., 1996), Mangaia (Kirch, 1997), New Caledonia (Miller, 1997; Sand, 1995), Papua New Guinea (David et al., 2020; Rowe et al., 2020) and Palau (Fitzpatrick and Giovas, 2021). What is rarely reported, however, is the impact terrestrial and indeed littoral alterations (e.g. fishpond and trap construction: Fitzpatrick, 2020; Rogers, 2023), may have had on marine ecosystems. An exception is recent work by Fitzpatrick and Giovas (2021), who reconstructed feedback loops between terrestrial food producing systems and marine environments in Palau, Micronesia, and the Lesser Antilles, Caribbean, documenting long-term sustainable and responsive decision-making.
In this paper, we present the archaeomalacological results from the Kawela Mound, one of the oldest habitation sites in the Hawaiian Islands, with well-documented occupation possibly beginning during the 12th century AD; that is, near first colonisation of the archipelago. We show how change in the terrestrial landscape caused alteration of the adjacent marine habitats, recorded in the size, diversity, and habitat preferences of shellfish in the deeply stratified coastal sandy dune midden occupied over eight centuries. Monumental walled fishpond construction also provided an artificial rocky habitat along an otherwise predominantly sandy soft shore. Indeed, Weisler and Kirch (1982: 64–65) recognised that ‘. . . construction of the four fishponds on the reef flat may have provided an “artificial” rocky environment of the kind where N. picea thrive. Recovery of this mollusc in dated . . . midden deposits may thus provide an indirect date for fishpond construction’. We show that documenting the nature of inshore habitats before and after significant human alteration contributes important information for modern coastline restoration and management.
Background
The Hawaiian Islands may have been colonised between AD 1000 and 1100 (Athens et al., 2014; Kirch, 2011), although few habitation sites date to this time. Most of the handful of known early habitations are situated in the idyllic windward settings astride nutrient-rich alluvial soils accumulated on valley bottoms with ample fresh water for agricultural production which underpinned Hawaiian society. The Kawela Mound site (State of Hawai‘i site number 50–60-04–144; see Weisler et al., 2023) is unique in that it is located along the south-central leeward shoreline of the elongate island of Moloka‘i (61 km east-west by 11 km north-south) which is centrally located within the main Hawaiian archipelago (Figure 1). The Kawela Mound is a low sandy dune, ~1.5 m high and 425 m2, which was previously situated immediately west of Kawela Stream, just inland from the adjacent sandy marine beach, and ~500 m from a marshy area surrounding the inland margin of Kakahai‘a fishpond–an ideal zone for planting the introduced cultigens taro (Colocasia esculenta) and sweet potato (Ipomea batatas) and habitat for wading and migrating birds (Figure 2). Moloka‘i has a barrier reef that extends ~50 km along the south shore and, at Kawela, the reef stretches nearly 1 km offshore with expanses of live coral, aggregate reef and patch reefs, sand and rubble areas, and extensive coverage of pavement (Rogers and Weisler, 2022: fig. 2). There are several stone-walled fishponds (loko kuapa) on the shallow reef flat near Kawela, including monumental Kānoa and Ali‘i fishponds (Figure 2). With only ~500 mm of annual precipitation (Giambelluca et al., 1986), occasional heavy rains during November to March deposit upland sediments along the shoreline causing muddy waters that persist for days.
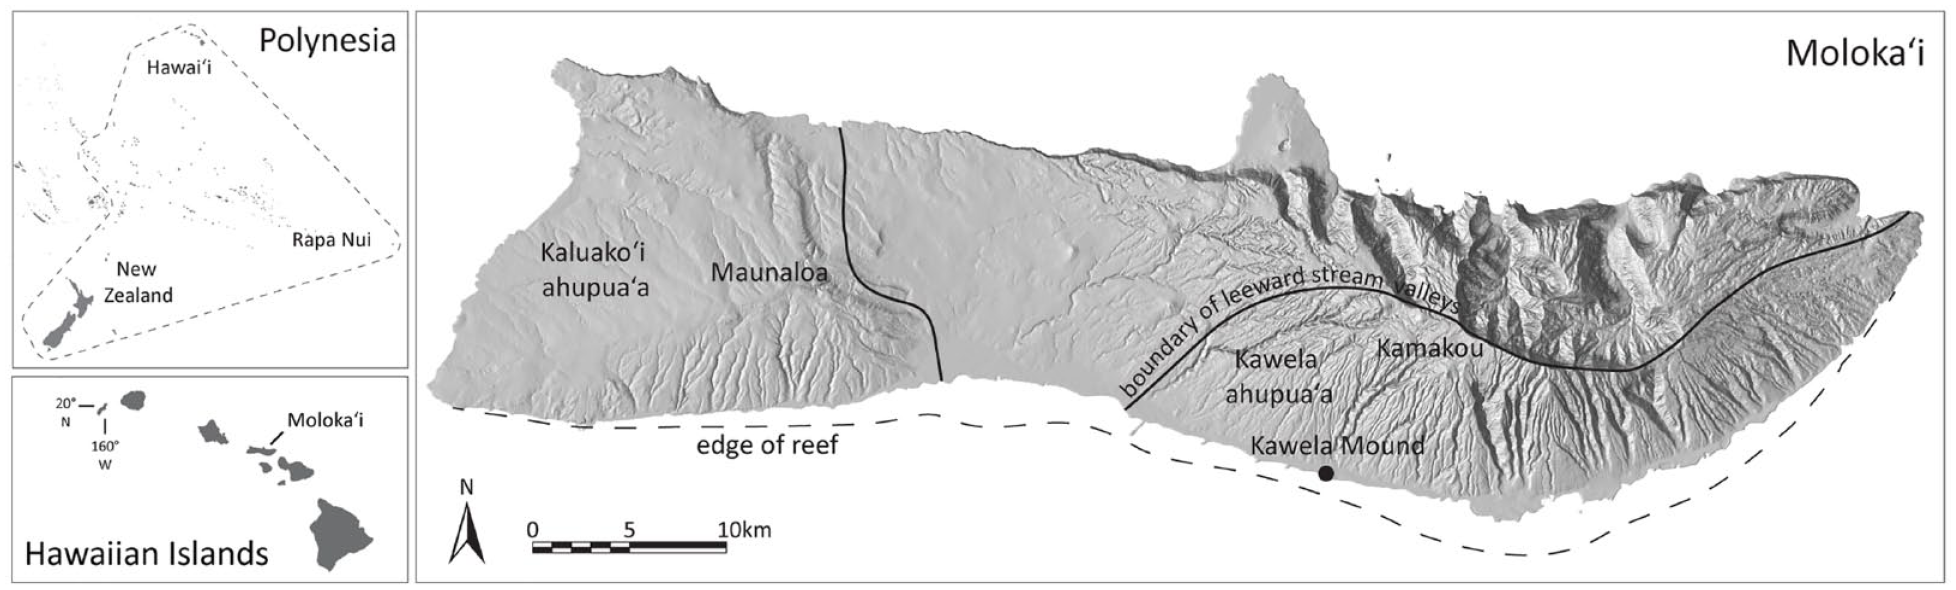
Map of Polynesia, the Hawaiian Islands, Moloka‘i and Kawela Mound site (black dot). Note the roughly east-west line delimiting the region of leeward stream valleys (after Weisler et al., 2023: fig.1).
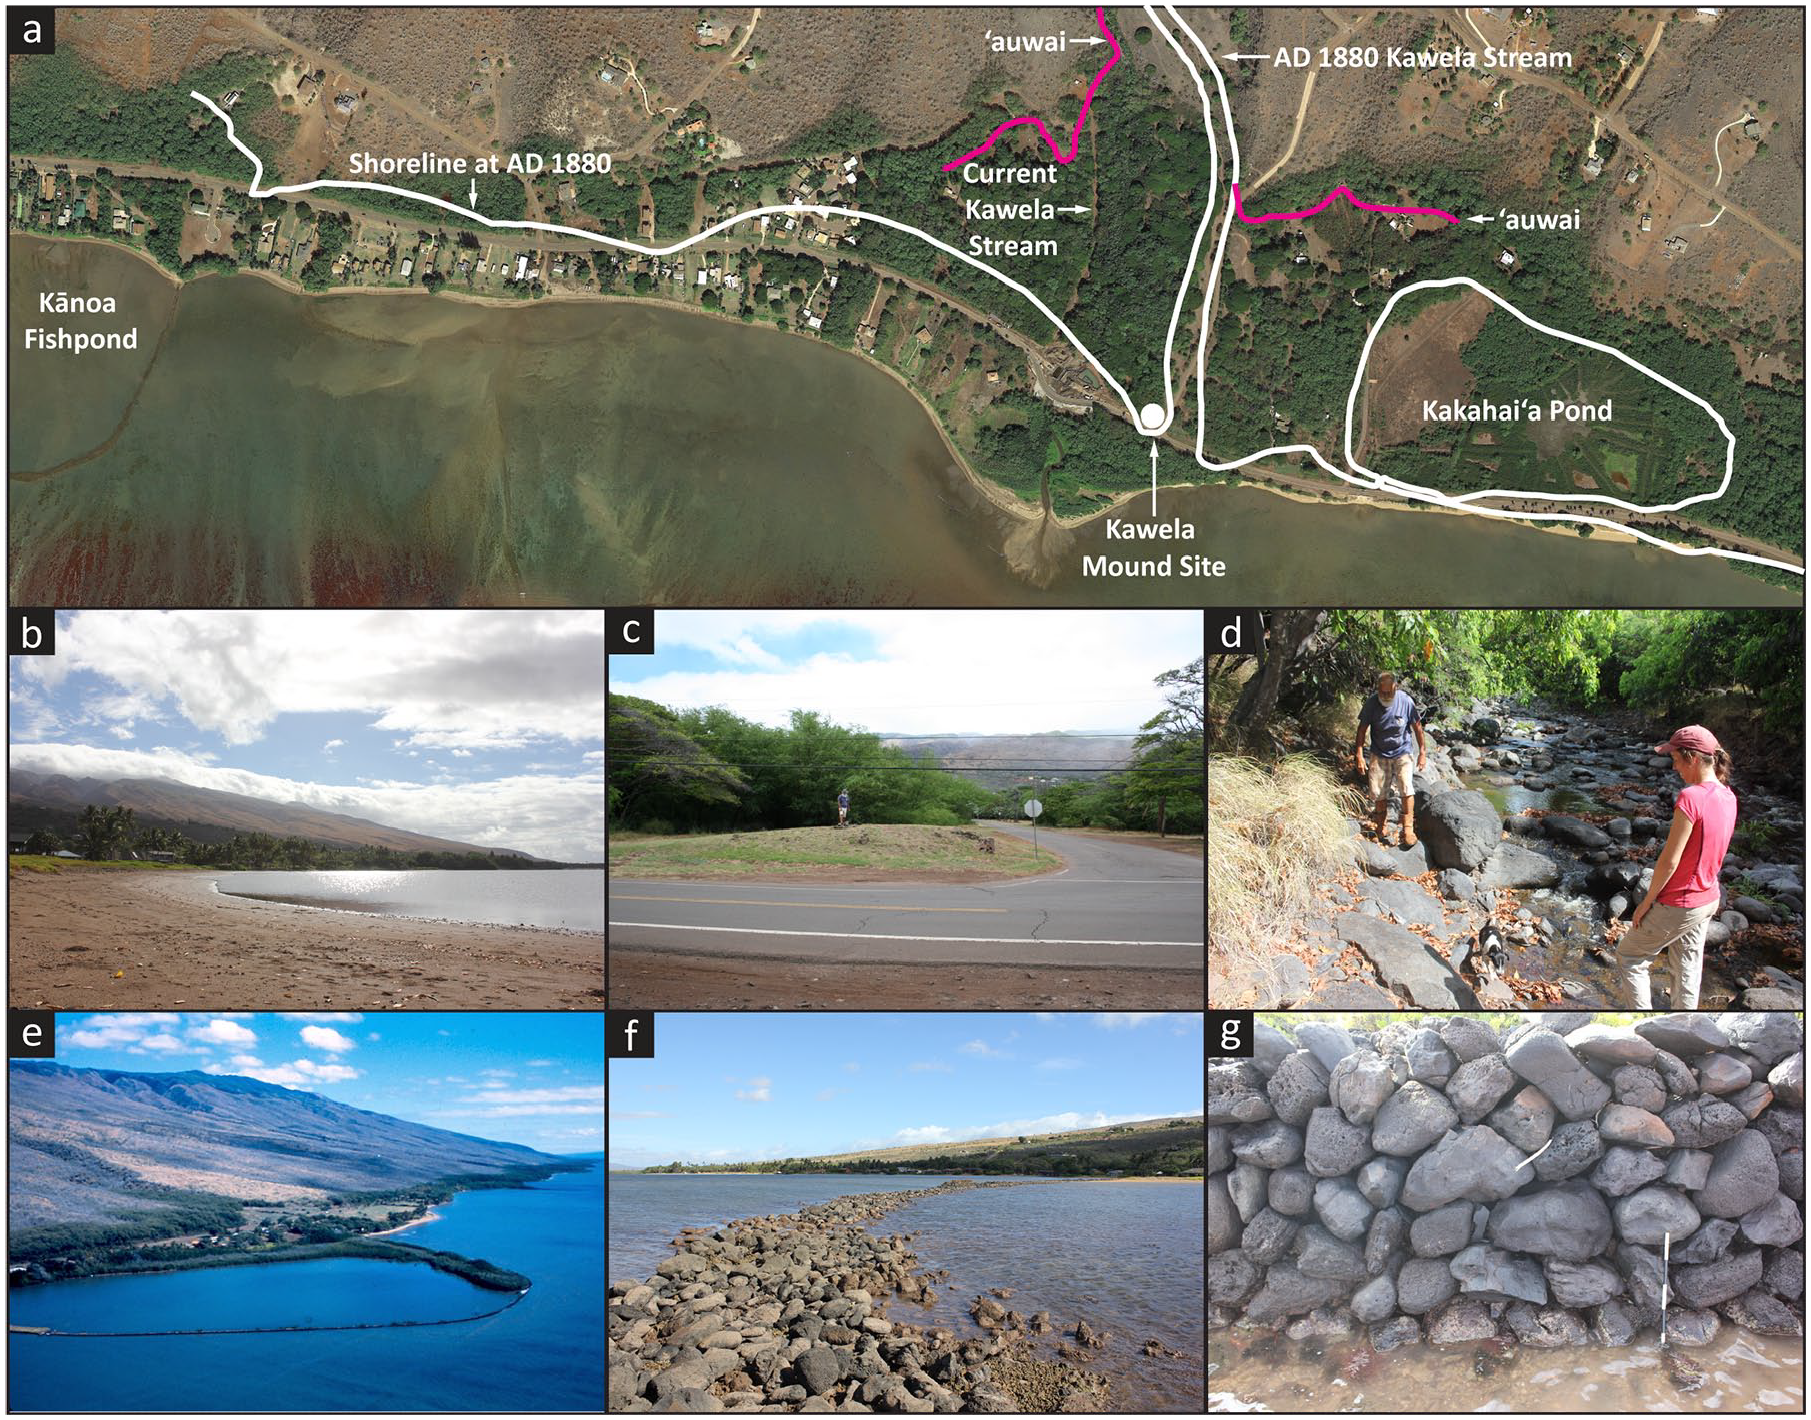
Kawela environmental context: (a) GoogleEarth image of the study area indicating the location of the Kawela Mound site, Kānoa fishpond and two eroded walled fishponds barely visible to the east. An 1880 map, overlain in white, shows the inland Kakahai‘a fishpond, Kawela Stream east of the Kawela Mound at 1880, and the former shoreline. Two irrigation ditches or ‘auwai (pink lines) supplied water to sweet potato fields on the flood plain (Weisler et al., 2023: fig.3); (b) protected, sandy shore at Kawela (Photo: A. Rogers); (c) Kawela Mound site looking north (taken in 2013; Weisler et al., 2023: fig.2B); (d) Kawela Stream, ~0.5 km inland, flowing in August 2018 after heavy upland rain (Weisler et al., 2023: fig.2C); (e) aerial view of Ali‘i (foreground) and Kānoa (background) fishponds taken in 1980 (Photo: M. Weisler); (f) view across reef flat near Kawela from the stone-walled Kānoa fishpond (Photo: A. Rogers); (g) intact Kānoa fishpond wall ~2.5 m high (Photo: A. Rogers).
Investigations at the Kawela Mound were part of a 7.7 km2 intensive survey of the madjacent upland areas and excavation programme directed by MIW in the early 1980s (Weisler and Kirch, 1985). The survey encompassed three traditional land units (ahupua‘a) where 499 architectural features were recorded of which 14% were excavated. Unlike the Kawela Mound, described below, the upland settlements represent a late prehistoric (mostly post AD 1600) settlement with well-defined residential complexes consisting of multiple individual architectural features built from dry-laid stone walls surrounding level soil areas (Weisler and Kirch, 1985: figs.7–11). More than 400 m2 of excavated area at 72 architectural features revealed status differences in residential complexes; in other words, the upland zone, below ~150 m elevation, represented a well-preserved late prehistoric community complete with gardening zones to produce sweet potato and gourds–typical rain-fed crops grown in leeward environments. Importantly, evidence for landscape burning for developing gardens began by the 17th century (Weisler et al., 2023). And the accumulation of a ~2 m thick layer of upland sediments surrounding the inland margin of Kakahai‘a Pond during early historic times (Weisler, 1983; Weisler et al., 2023; fig.3) reflects the introduction of deer, goats, and cattle that grazed upland forage destabilising the slopes.
A 21 m long trench, roughly north-south, was excavated through the Kawela Mound, but only Trench 7 was archaeologically excavated through all the cultural layers to basal sterile sand ~3.0 m below surface (Weisler et al., 2023: fig.8). Excavations proceeded primarily in 5 cm arbitrary levels within well-defined layers and sediments were dry sieved through 6.4 mm mesh, retaining all cultural material. Bulk samples of screened midden were retained from the 3.2 mm sieves from Trench 7 where samples averaged ~250 ml. The shellfish retained in the 6.4 mm sieves is analysed here. Further excavation methods, stratigraphic profile illustrations, site map, and full details of the layers and cultural content are described in Weisler et al. (2023).
We briefly summarise, using Weisler et al. (2023), the Mound stratigraphy as represented in Trench 7 which contains the entire sequence of five cultural layers atop culturally sterile beach sand. Ages for individual layers are modelled Bayesian median ages after Weisler et al. (2023: table 1, fig. 11). Stratum I is a very dark grey (Munsell colours 10YR 3/2 to 5YR3/1) loamy sand historic layer with plentiful historic artefacts including metal, ceramics, bottle and window glass, bone from historically introduced animals (sheep or goat) and Roof Rat (Rattus norvegicus). There are few traditional artefacts. Osteological identifications included chicken (Gallus gallus), seabirds and wading birds, sea turtle, pig, dog, and the Polynesian introduced rat (R. exulans). The dominant fish, throughout all cultural layers, were inshore reef species including surgeonfish (Acanthuridae), parrotfish (Scaridae), wrasses (Labridae), trevallies (Carangidae), and goatfish (Mullidae). Urchins and crabs were also represented throughout all layers. Stratum II is a grey (5YR 5/1) sandy loam with a Bayesian modelled duration of AD 1485–1746. Evidence for burning presumably to prepare gardening appears towards the latter end of this period. The end of the Stratum II occupation range represents the abandonment of the late prehistoric upland residential complexes (Weisler and Kirch, 1985). The presence of several buried A horizons (Weisler et al., 2023: fig. 8) suggests periodic occupation during Stratum II. There is a low density of combustion features, midden and traditional artefacts with a few intrusive metal and glass fragments. Stone adze making, use and reworking and bone fishhook manufacture are represented. There are some bones of historically introduced animals, but most fauna is likely prehistoric including the highest number of sea turtle bones, as well as chicken, dog and pig. The extirpated endemic Hawaiian goose (Branta sandvicensis), marsh and pond-dwelling birds (common moorhen, Gallinula chloropus; mud hen, Fulica americana), seabirds and an owl (Asio flammeus) were inventoried. Stratum II represents limited occupation and use of the nearby freshwater pond. Stratum III is a very dark grey (5YR3/1) to black (5YR 2.5/1) sandy loam that was intensively occupied from AD 1464 to 1485. Stone adze making, use and reworking, bone fishhook manufacture, and multiple kinds of lithic material from the west end of the island were present. There were numerous combustion features, the greatest amount and density of traditional artefacts, and the largest amount of pig bones and highest diversity of crustacea. Stratum IV is also a loamy sand, with pockets of very dark grey (5YR 3/1) to grey (5YR 5/1) matrix with occupation spanning AD 1451–1464. Combustion features and traditional artefacts are few. There was only ~10% of the amount of bone recovered from Stratum III suggesting sporadic use. The lowest cultural layer, Stratum V, is a grey (5YR 5/1) sand with a maximum depth of 2.72 m. It represents initial occupation of the area at a Bayesian modelled age of AD 1121–1262 (median AD 1210) making it one of the oldest habitations in the Hawaiian Islands (Weisler et al., 2023). Stratum V was occupied until AD 1451. There were a few combustion features, several kinds of traditional artefacts (adze material, coral abrader, stone debitage), the most bones of the extirpated Hawaiian goose which is typical of early deposits (e.g. Emory and Sinoto, 1961), the largest density of rat bones, one pig bone, seabird bones including frigatebird (Fregatidae), white-tailed tropicbird (Phaethon lepturus) and Hawaiian petrel (Pterodroma cf. sandwichensis). Inshore reef fish, urchins and crabs, typical of all Mound layers, were identified. Stratum VI was a culturally sterile ‘salt and pepper’ sand consisting of basalt (5YR 2.5/1, black) and coral (2.5YR 8/2, pinkish white) representing the palaeo-beach.
In summary, the Kawela Mound contains five cultural layers totalling ~3 m in thickness, with a median age of initial occupation (Stratum V) at AD 1210, sporadic occupation during Stratum IV, intensive occupation in Stratum III coinciding with upland residential complexes, then, again, sporadic use during Stratum II (inferred from low midden densities and several buried A horizons), then recent occupation during Stratum I which contained few traditional artefacts and abundant historic materials.
Methods
Molluscs were identified to the lowest taxonomic level using identification manuals, published literature (Kay, 1979; Severns, 2011), and an extensive Indo-Pacific marine fauna reference collection developed by Weisler and held at the Pacific Archaeology Laboratory, The University of Queensland. Taxonomic nomenclature was verified using the World Register of Marine Species online database (WoRMS Editorial Board, 2023). Mollusc remains were quantified using Minimum Number of Individuals (MNI), Number of Identified Specimens (NISP), and weight rounded to the nearest 0.01 g. The use of different quantification methods is an important issue in all zooarchaeological analyses and, when considering mollusc abundance, shell robusticity as well as taphonomic factors can heavily skew the data (Bowdler, 2014; Thomas and Zapata, 2018: 2). The relationship between MNI and NISP values for molluscs at the family-level was examined using Spearman’s regression analysis (Morrison and Cochrane, 2008: 2391; Rogers and Weisler, 2020a: 37).
To investigate midden taxa and their associated habitats through time, two methods of analysis were employed: (1) taxonomic abundance, with respect to Neritidae gastropods, and bivalve taxa as environmental indicators; and (2) shell size (length).
Mollusc taxonomic abundance
Taxonomic abundance was reported by stratum to determine the dominant mollusc taxa and assemblage diversity through time. Diversity was assessed using the following diversity indices: NTAXA, Shannon’s evenness (E), Shannon-Wiener index of diversity (H′), Simpson’s dominance (1 – D), Fisher’s α, and chord distance. Diversity indices can be applied in archaeological contexts to obtain quantitative estimates of assemblage variability (biological structure and composition) (Heip et al., 1998: 63; Tuomisto, 2012). There are two independent characteristics which constitute community or assemblage diversity: (1) species richness, a measure of the total number of species; and (2) taxonomic evenness, the distribution of individuals per species (Heip et al., 1998: 63, 80).
NTAXA reports assemblage richness (i.e. number of species; Morris et al., 2014: 3515) and is measured by collapsing taxonomic categories to the highest common level, thereby avoiding falsely inflated richness when a mollusc family can be more easily identified to genus or species, such as morphologically distinctive Neritidae or Cypraeidae genera. Shannon’s evenness (or equitability) (E) measures the evenness with which individuals are divided among the taxa present (taxonomic evenness). Output values are between 0 and 1, with 1 being an assemblage with a completely even composition (Colwell, 2009: 260; Magurran, 1988: 36–37). The Shannon-Wiener diversity index (H’) considers both the abundance (number of individuals) and evenness (number of taxa) of the assemblage when assessing diversity. H’ values can range from 0 to 5, although in ecological studies they typically range from 1.5 to 3.5 (Magurran, 1988: 35; Margalef, 1972). When the H’ output is 0 the assemblage is represented by only a single taxon (Hammer et al., 2001: 172; Magurran, 1988). Simpson’s dominance (1 – D) was used to assess the dominance of one taxon in the assemblage as the index is heavily weighted towards the most abundant species in the sample while being less sensitive to species richness. Values range from 0 to 1 where low values indicate dominance of a single taxon, while values closer to 1 indicate that all taxa are equally present (Colwell, 2009:260; Magurran, 1988: 39–40). Fisher’s α measures overall diversity by reporting on the presence of rare species (Colwell, 2009: 261; Magurran, 1988). The output of Fisher’s α is a value close to the number of species expected to be represented by one individual (Hayek and Buzas, 2010: 290–294). Chord distance is a scaled measure of Euclidean distance, which is used to analyse similarity and difference between groups (Legendre and Gallagher, 2001). Chord values range between 0 and √2 (1.41), with higher values indicating increasing distance (or difference) between samples. This distance reaches its maximum when the two sites have no species in common (Legendre and Gallagher, 2001: 274).
Marine environments provide a mosaic of spatially and ecologically bound habitat niches containing specific and highly specialised taxa. Perhaps even more so than terrestrial environments, the discrete set of fauna and flora found within a marine habitat niche would be absent or present in vastly differing quantities in even slightly different habitats due to this level of specialisation (Branch, 1984; Futuyma and Moreno, 1988; Hopkins et al., 2014). Bivalves are particularly known to be excellent environmental indicators and, through their presence or absence, can indicate levels of salinity, temperature, turbidity, and water quality (e.g. presence of pollutants such as oil, sedimentation, sewage, nutrients, and heavy metals) in an environment. Neritidae are one of the most diverse molluscan families with species occupying freshwater, brackish and marine environments, calm or high energy coasts, and various substrate types (Maciolek, 1978). Due to the family diversity, Neritidae taxa are also considered excellent indicators of the presence of specific environments. To assess the potential environmental change in the intertidal zone at Kawela, bivalve and Neritidae abundance and associated environmental preferences are assessed in greater detail.
Shell size through time
A temporal change in shell size can be used as a proxy for age to identify changing intensity of human foraging behaviour, or to signal environmental change in factors such as sea surface temperature (SST), turbidity, or wave action (Faulkner, 2009; Mannino and Thomas, 2002; Milner et al., 2007; Rogers and Weisler, 2020b). Shell size through time (examined across strata) was assessed for Neripteron neglectum (pipipi; speckled nerite), Nerita picea (pipipi; black nerite), Brachidontes crebristriatus (kio nahawele; Hawaiian mussel), Isognomon californicum (nahawele; black purse shell), and Isognomon spp. (nahawele; tree oyster) (see Supplemental Material for the measurements taken to determine species size) (Giovas et al., 2013; Linoy Libini et al., 2011). Statistically significant differences in size were assessed using the Kruskal-Wallis test and post hoc Dunn pairwise test with Holm correction. All statistical analyses were conducted using IBM SPSS Statistics 28 and RStudio. The significance threshold for all tests was p = 0.05.
Results
Spearman’s regression analysis indicated that MNI and NISP were significantly correlated for 99.4% of the Kawela Mound midden assemblage at Trench 7 (Table 1). The remaining 0.60% of the midden were taxa that were represented by too few data points to conduct the analysis. Due to these results, it is indicated that MNI and NISP provide comparable datasets and all analysis proceeded using MNI metrics. NISP results are reported in the Supplemental Material.
Results of regression analysis determining the strength of correlation between MNI and NISP by mollusc family.
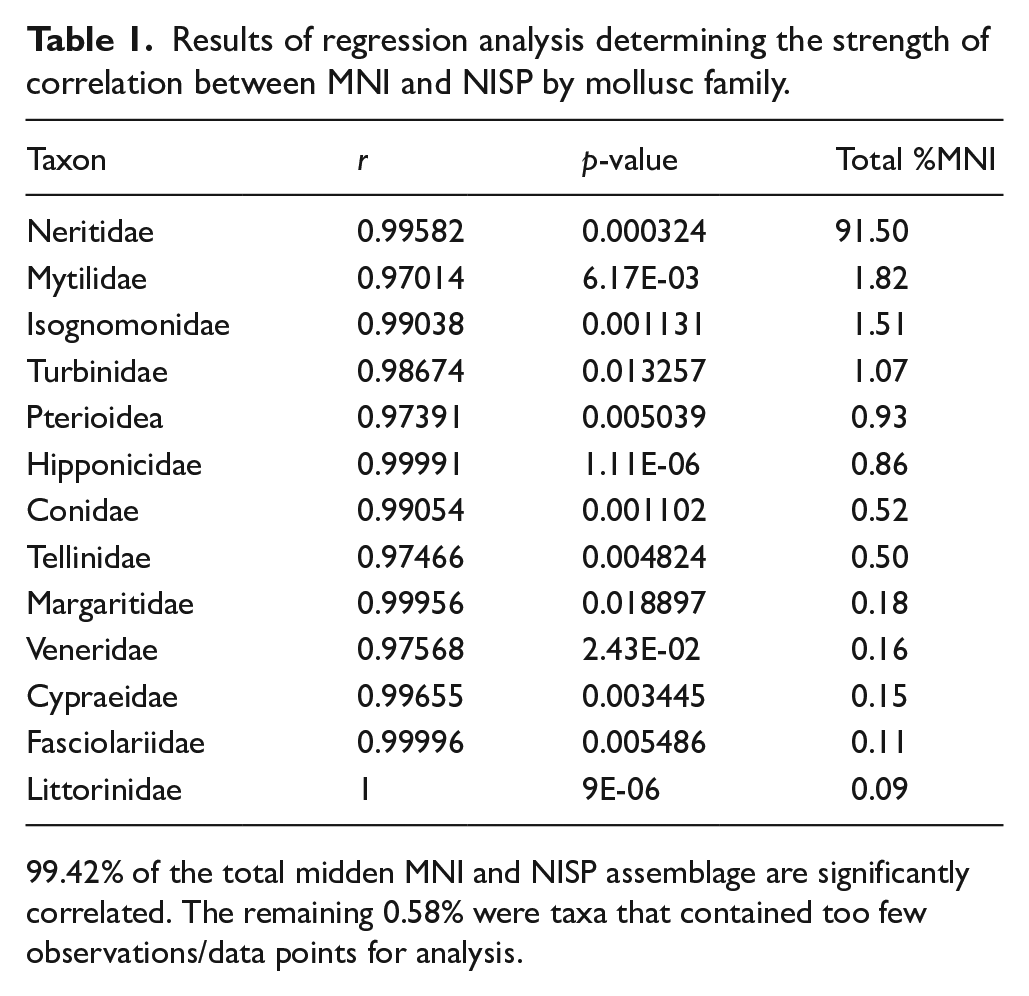
99.42% of the total midden MNI and NISP assemblage are significantly correlated. The remaining 0.58% were taxa that contained too few observations/data points for analysis.
Taxonomic abundance and diversity
The Kawela Mound Trench 7 shellfish assemblage was overwhelmingly dominated by Neritidae gastropods (MNI: 13,448; 90.36%), particularly Neripteron neglectum (MNI: 11,662; 78.36%) (Table 2; Figures 3 and 4). Other identified taxa included the gastropods Turbo sandwicensis, Trochus intextus, and Conus spp. and the bivalves Brachidontes crebristriatus, Isognomon californicus and Quidnapagus palatam (Table 2; Figures 3 and 4).
MNI quantification by stratum of the dominant taxa identified from Trench 7, Kawela Mound, Moloka‘i.
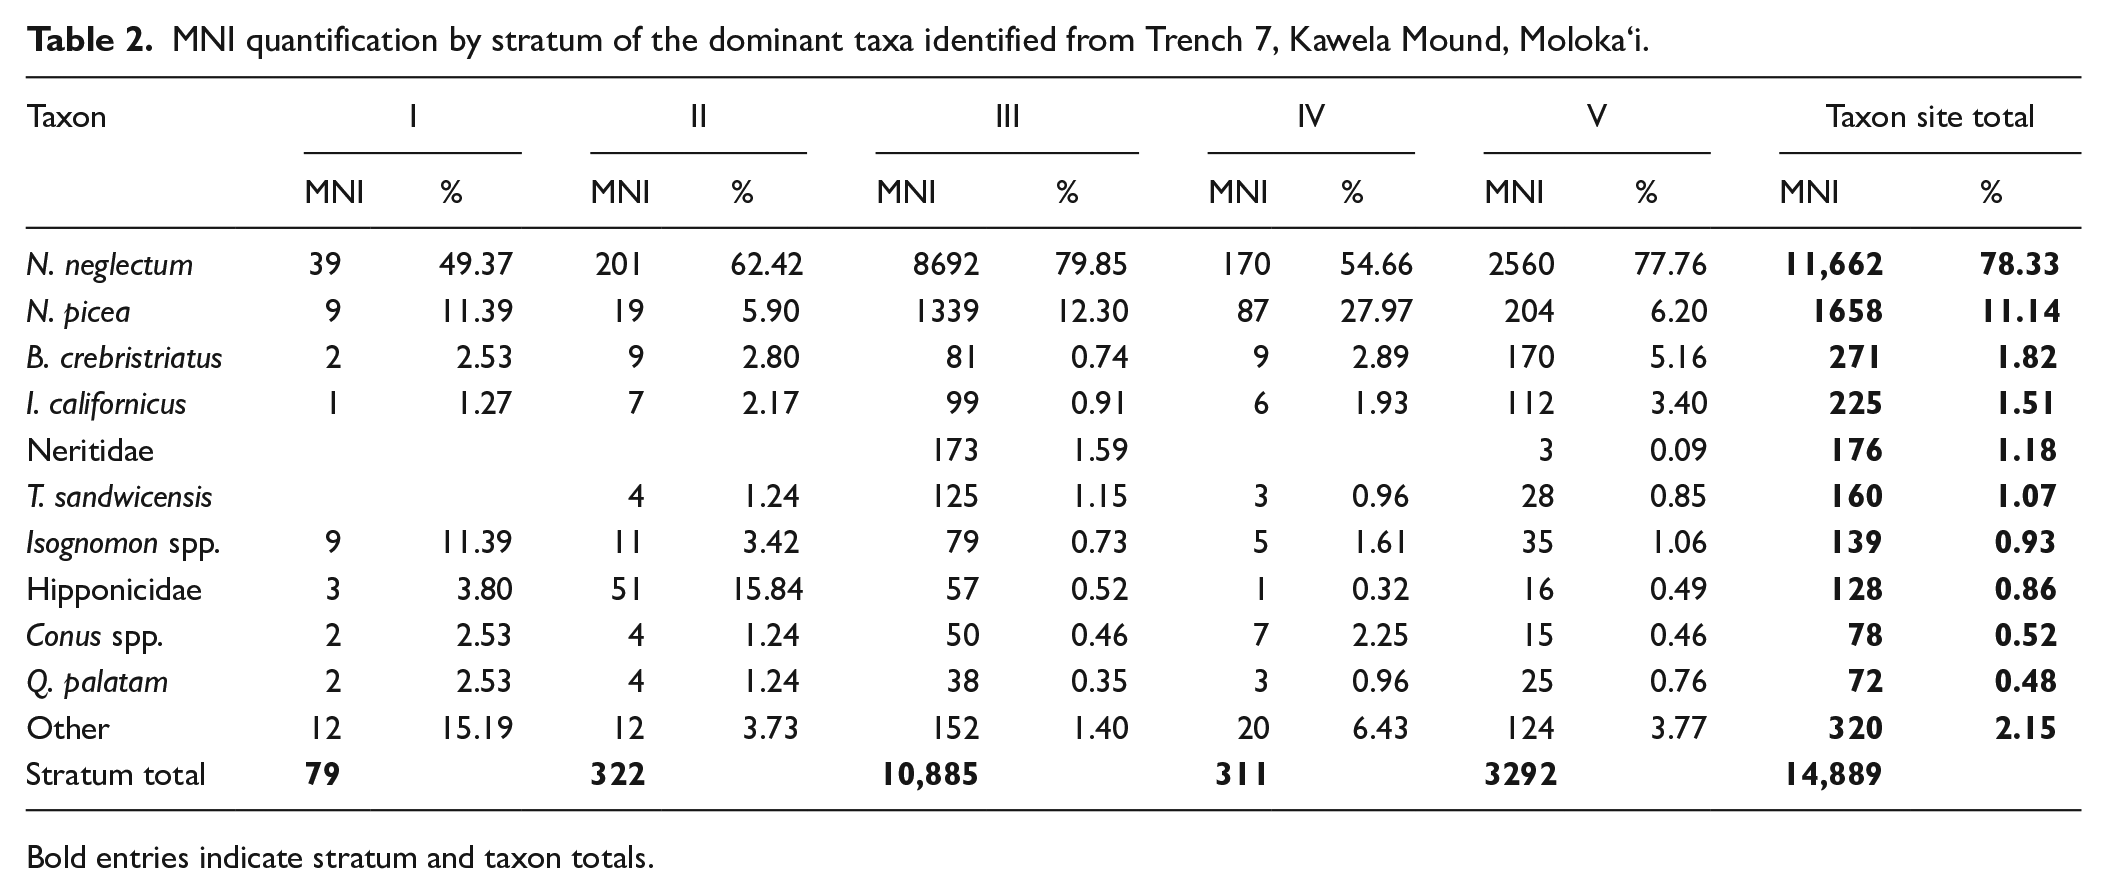
Bold entries indicate stratum and taxon totals.
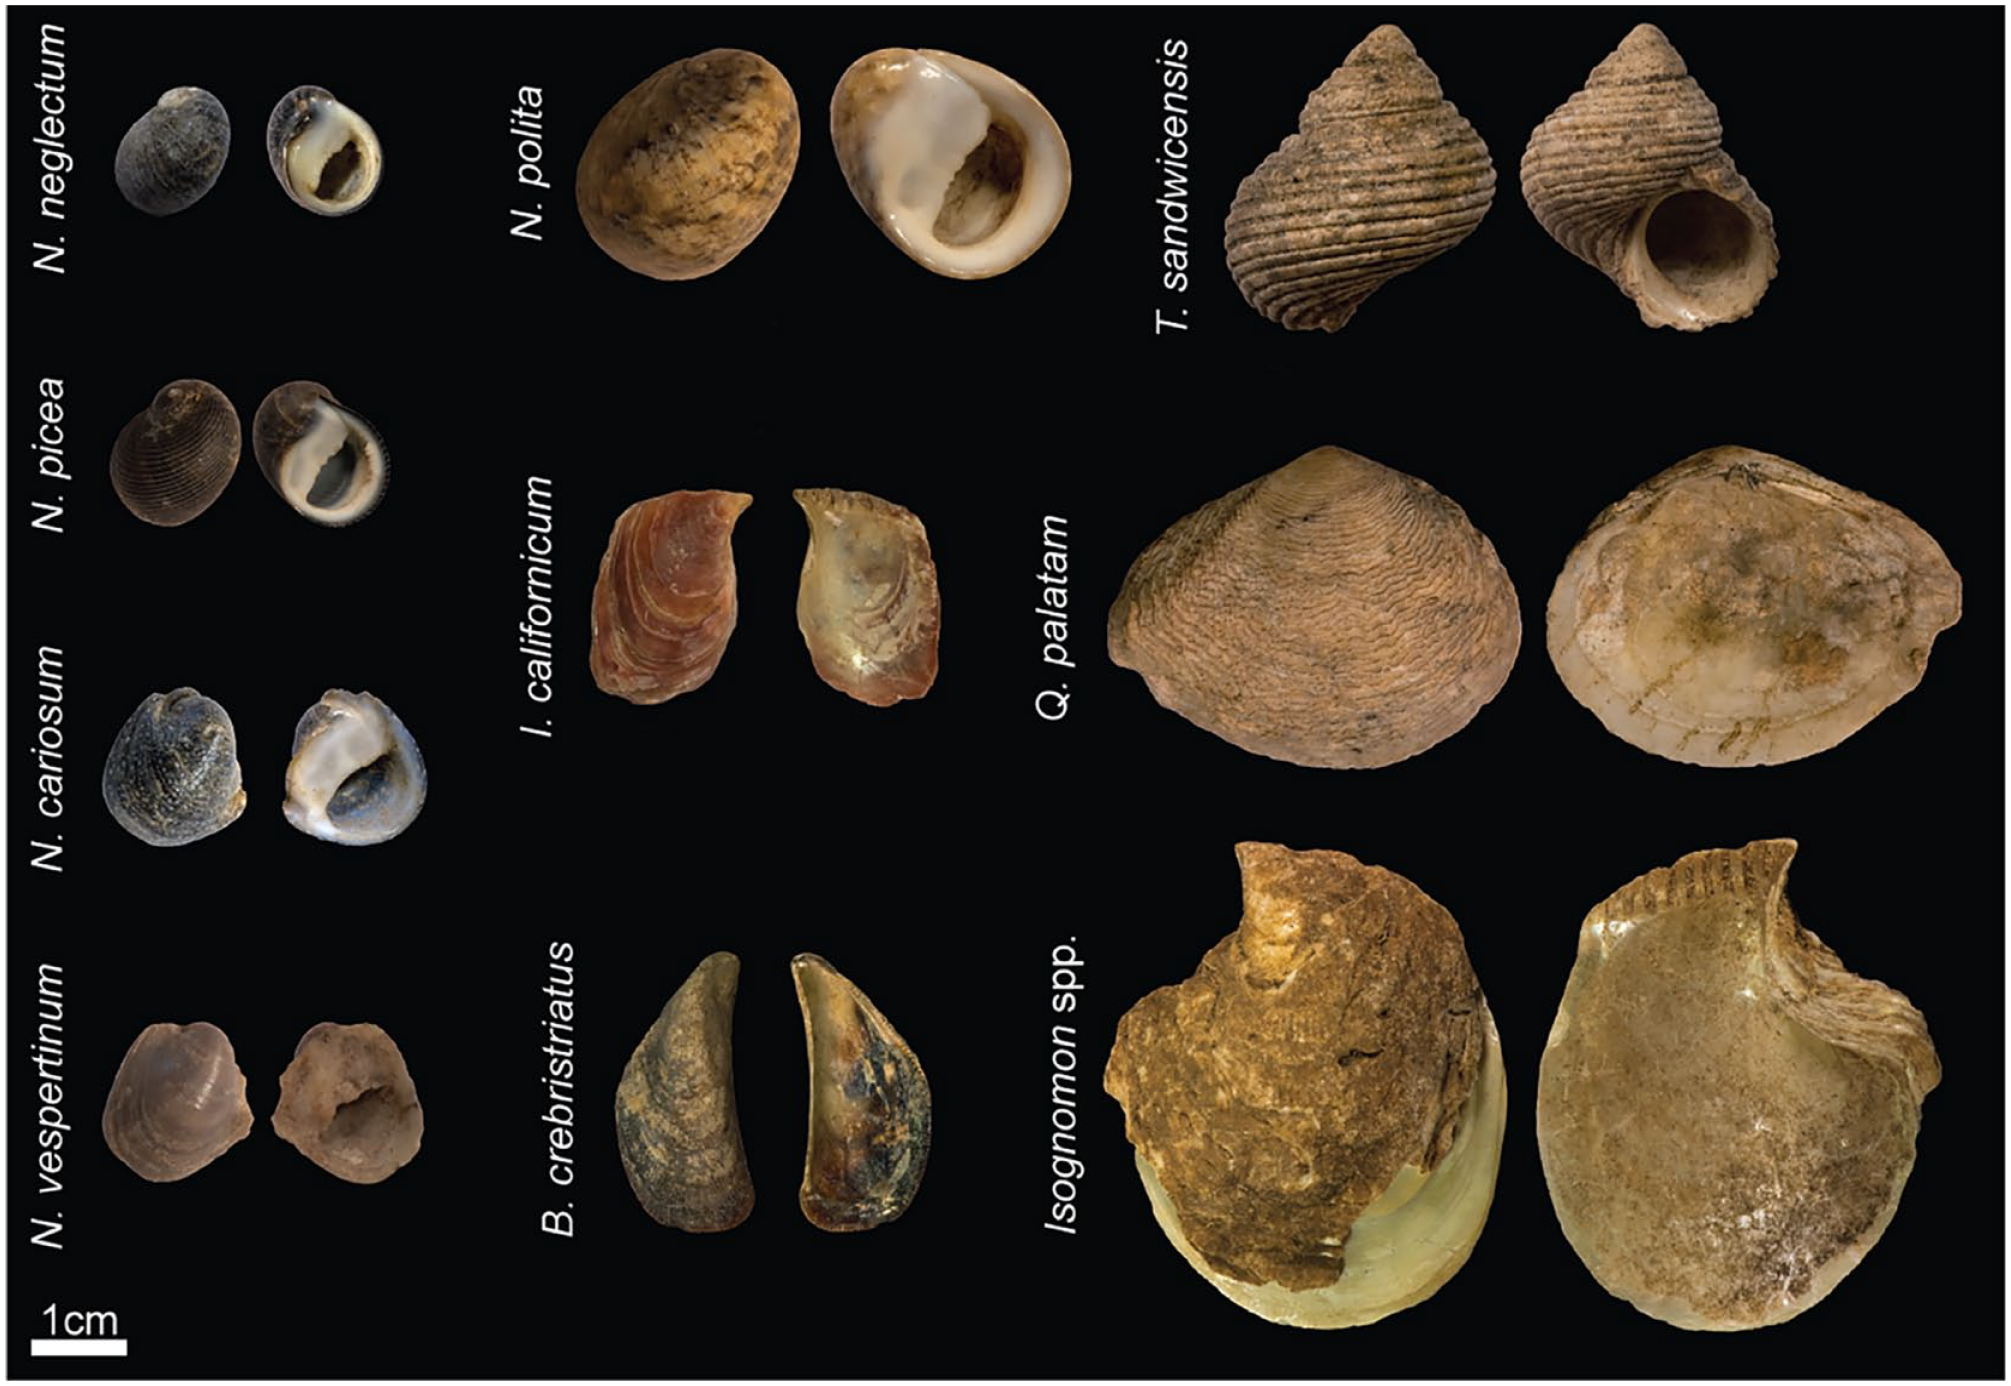
Common mollusc taxa from Trench 7, Kawela Mound.
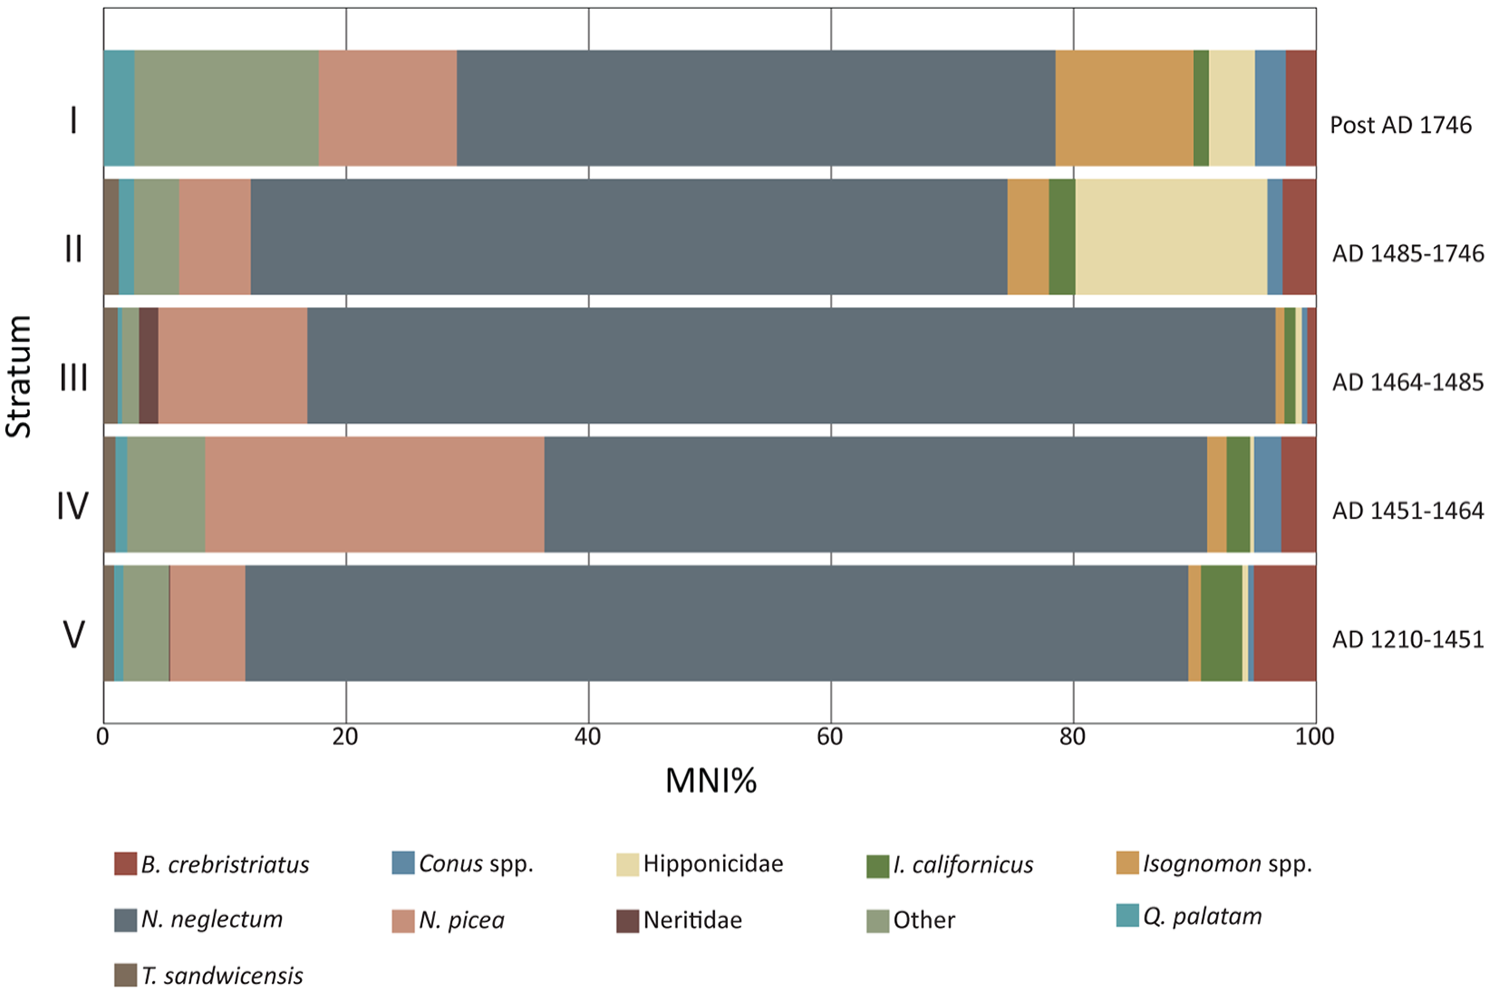
Relative abundance by MNI of the dominant taxa identified from Trench 7, Kawela Mound.
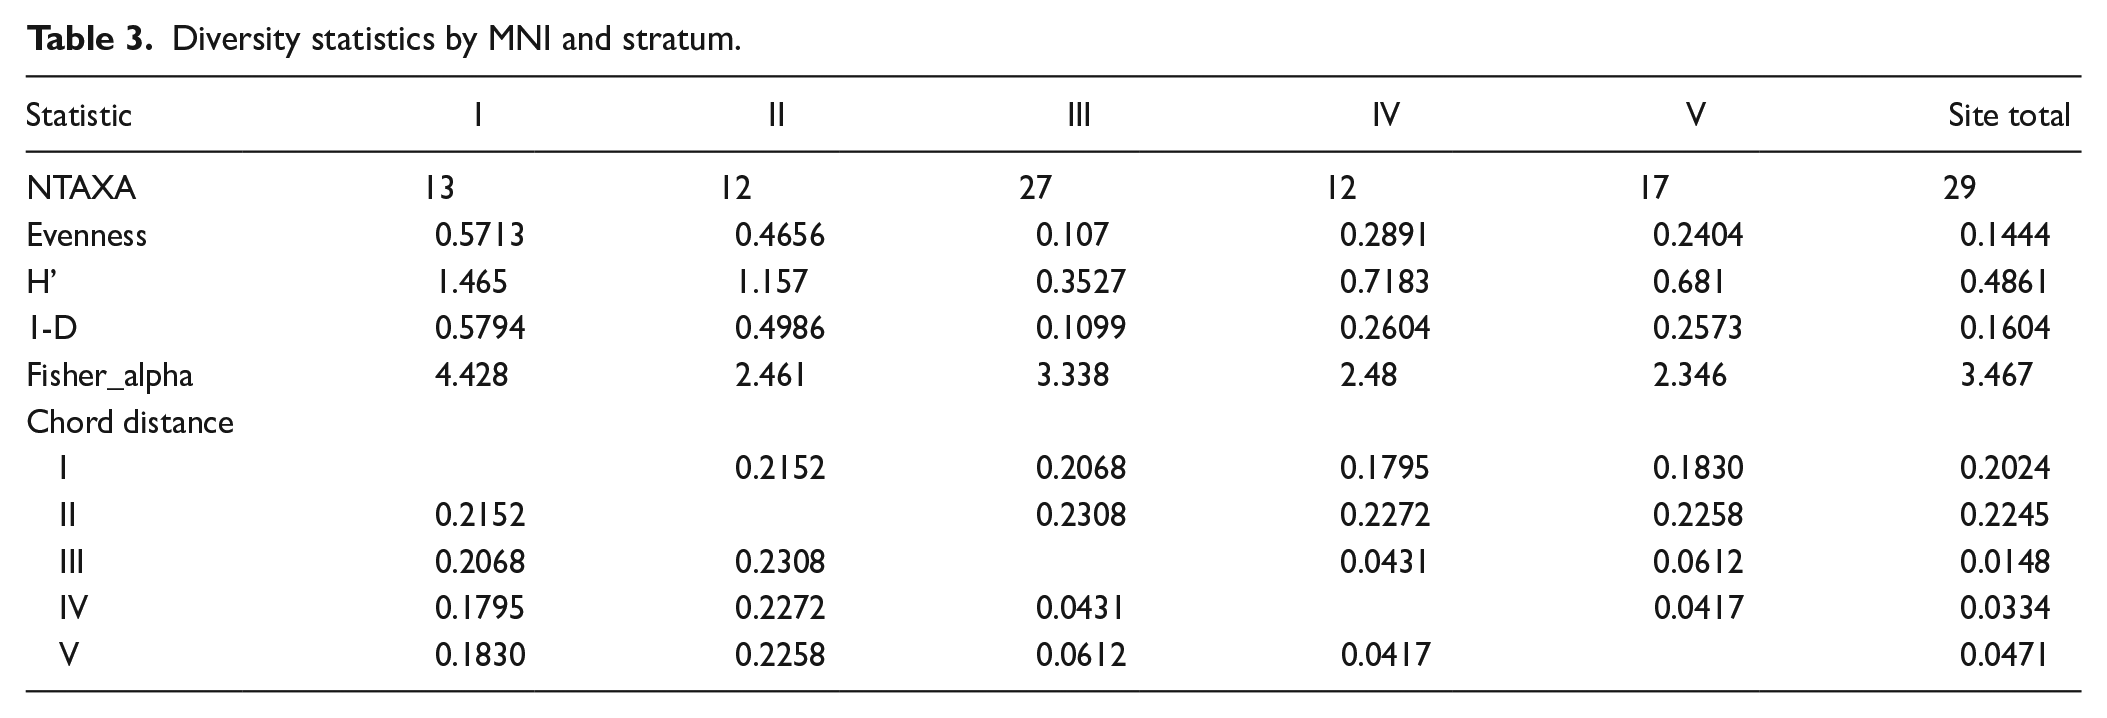
While Neritidae taxa remained the most abundant across all strata, taxonomic richness (NTAXA: number of species) varied (Table 3). The Stratum III assemblage displayed the greatest species richness (NTAXA: 27), whilst Strata II and IV evidenced the least (NTAXA: 12). This is consistent with Stratum III being the most intensively occupied period at Kawela Mound, as suggested by other kinds and amounts of cultural content as well as the dense black sediment colour relative to other strata (Weisler et al., 2023). Diversity statistics evidenced a trend up through the deposit. Mollusc assemblages show similar indices in Strata IV and V of reasonably uneven richness and diversity (dominated by one or few taxa). The assemblage becomes extremely uneven in Stratum III, due to the overwhelming dominance of Neritidae taxa, despite the greater species diversity (NTAXA: 27). This result is explained by the Fisher’s α Stratum III output, indicating a high number of species expected to be represented by just one individual. Strata I and II are characterised by increased evenness, where the assemblages have a comparatively more diverse composition (increased richness and evenness, reduced dominance of a single taxon) (Table 3). Chord distances between strata are low, due to the high number of common taxa between the assemblages. However, overall chord distance results indicate that Strata IV and V are very similar, and their faunal compositions are the most different from Strata I and II. Similarly, Stratum III is the most like IV and V. Overall, diversity results indicate that Strata IV and V are similar, and Strata I and II are similar and a change in taxonomic diversity (richness, evenness) has taken place since initial occupation.
Diversity statistics by MNI and stratum.
The Neritidae assemblage was comprised of Neripteron neglectum, Neripteron cariosum, Neripteron vespertinum, Nerita picea, and Nerita polita (Figure 3). Whilst N. neglectum remained the most-harvested taxon throughout the sequence, the abundance of the other Neritidae taxa varied (Table 4; Figure 5). N. picea increased significantly in relative abundance from Stratum V (MNI: 7.22%) to Stratum IV (MNI: 32.58%) and remained a significant contributor to the Strata I, II and III assemblages. Conversely, sand-dwelling Nerita polita, brackish Neripteron cariosum, and the freshwater Neripteron vespertinum were identified in Strata III, IV, and V, but almost entirely disappear from the sequence in Strata I and II (Table 4; Figure 5).
Neritidae assemblage identified to species-level by MNI and stratum.
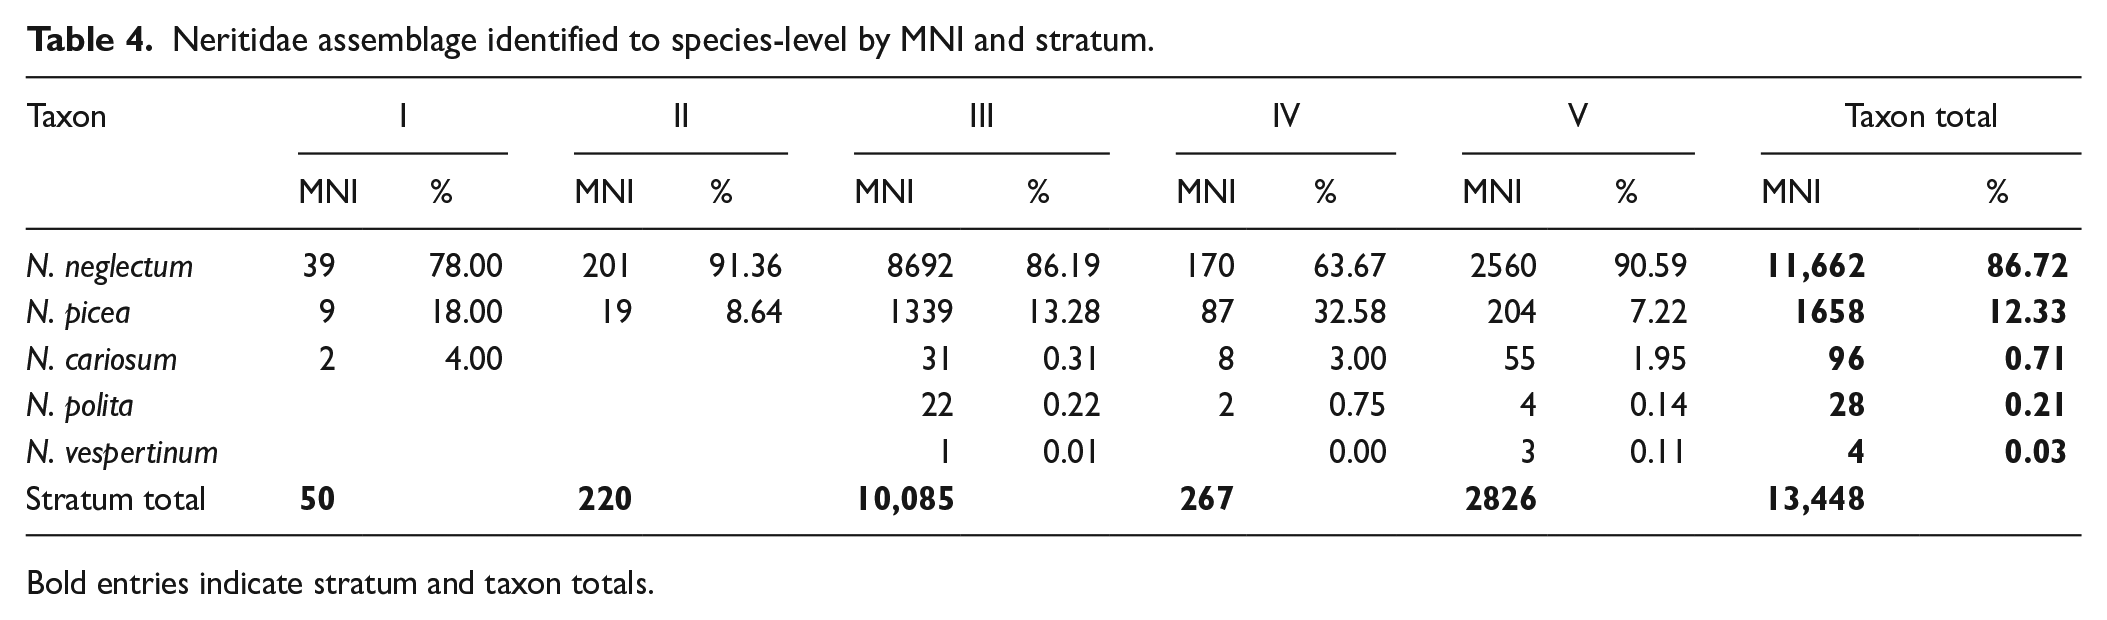
Bold entries indicate stratum and taxon totals.
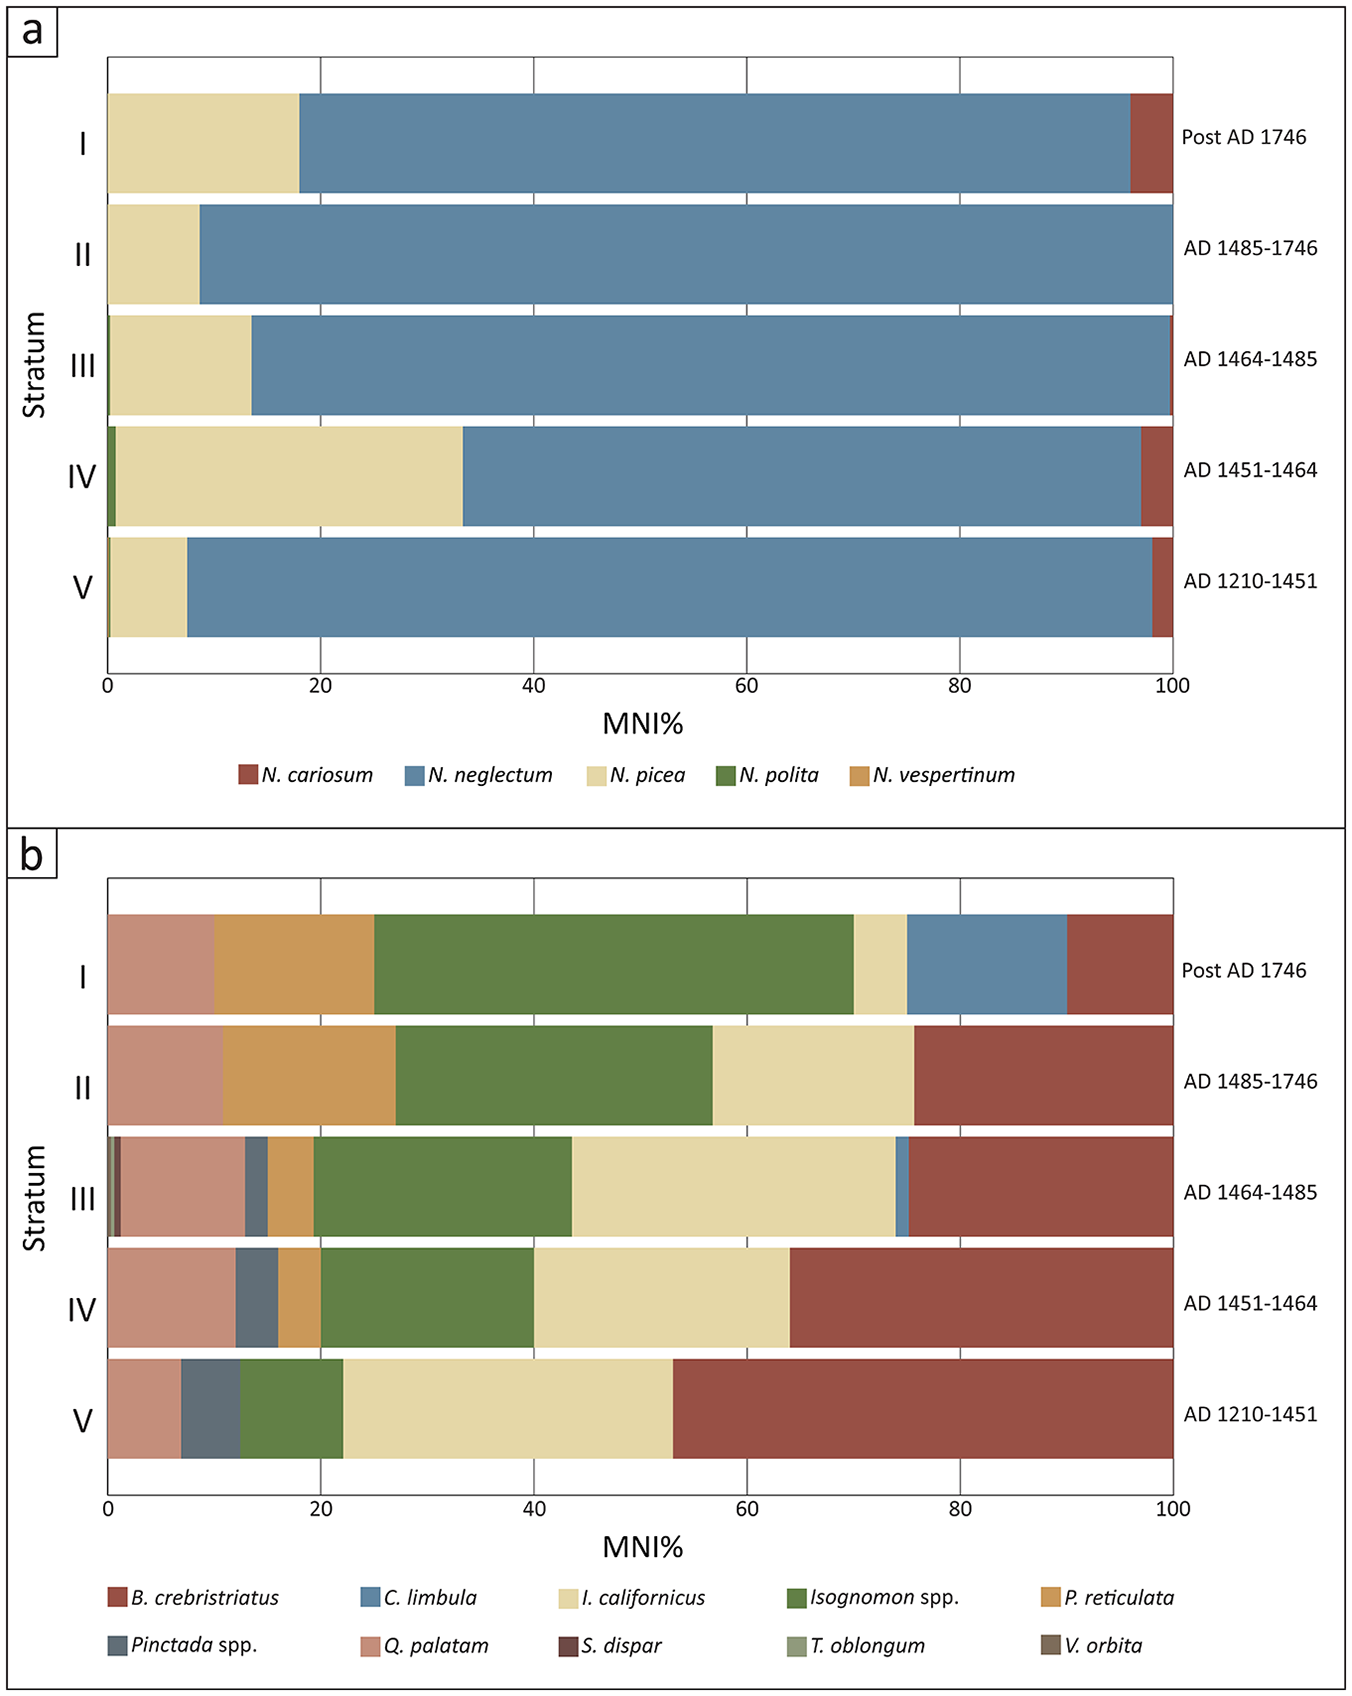
Relative abundance (MNI%) of (a) Neritidae and (b) bivalve assemblages.
The bivalve assemblage was comprised primarily of Brachidontes crebristriatus, Isognomon californicus, Isognomon spp., Quidnapagus palatam, Periglypta reticulata and Pinctada spp. (Table 5; Figure 5). Stratum III contained some additional bivalve taxa that were identified in minor quantities (Table 5). Due to excellent preservation, I. californicum remains retained their distinctive red colouring (Figure 3). As such, remains identified as Isognomon spp. represents tree oysters other than I. californicum. The bivalve assemblage shows a significant and steep decline in the relative abundance of Brachidontes crebristriatus and Isognomon californicus through time. Pinctada spp. is stable in Strata IV and V, but suddenly declines in Stratum III and then disappears from the sequence. Conversely, Isognomon spp. abundance increases enormously through the sequence, from a low contribution to the bivalve assemblage in Stratum V (MNI: 9.67%) to a high contribution in Stratum I (MNI: 45.00%). Quidnapagus palatam abundance increases slightly in Stratum IV and remains relatively stable through time. Similarly, Periglypta reticulata appears in Stratum IV and increases in relative abundance through the strata. Chama limbula appears as a significant contributor in Stratum I (Table 5; Figure 5). Overall, earlier periods are characterised by higher abundance of Brachidontes crebristriatus, Isognomon californicus and Pinctada spp. taxa, while the later periods are characterised by higher abundance of Isognomon spp., Periglypta reticulata and Chama limbula.
Bivalve assemblage by MNI and stratum.
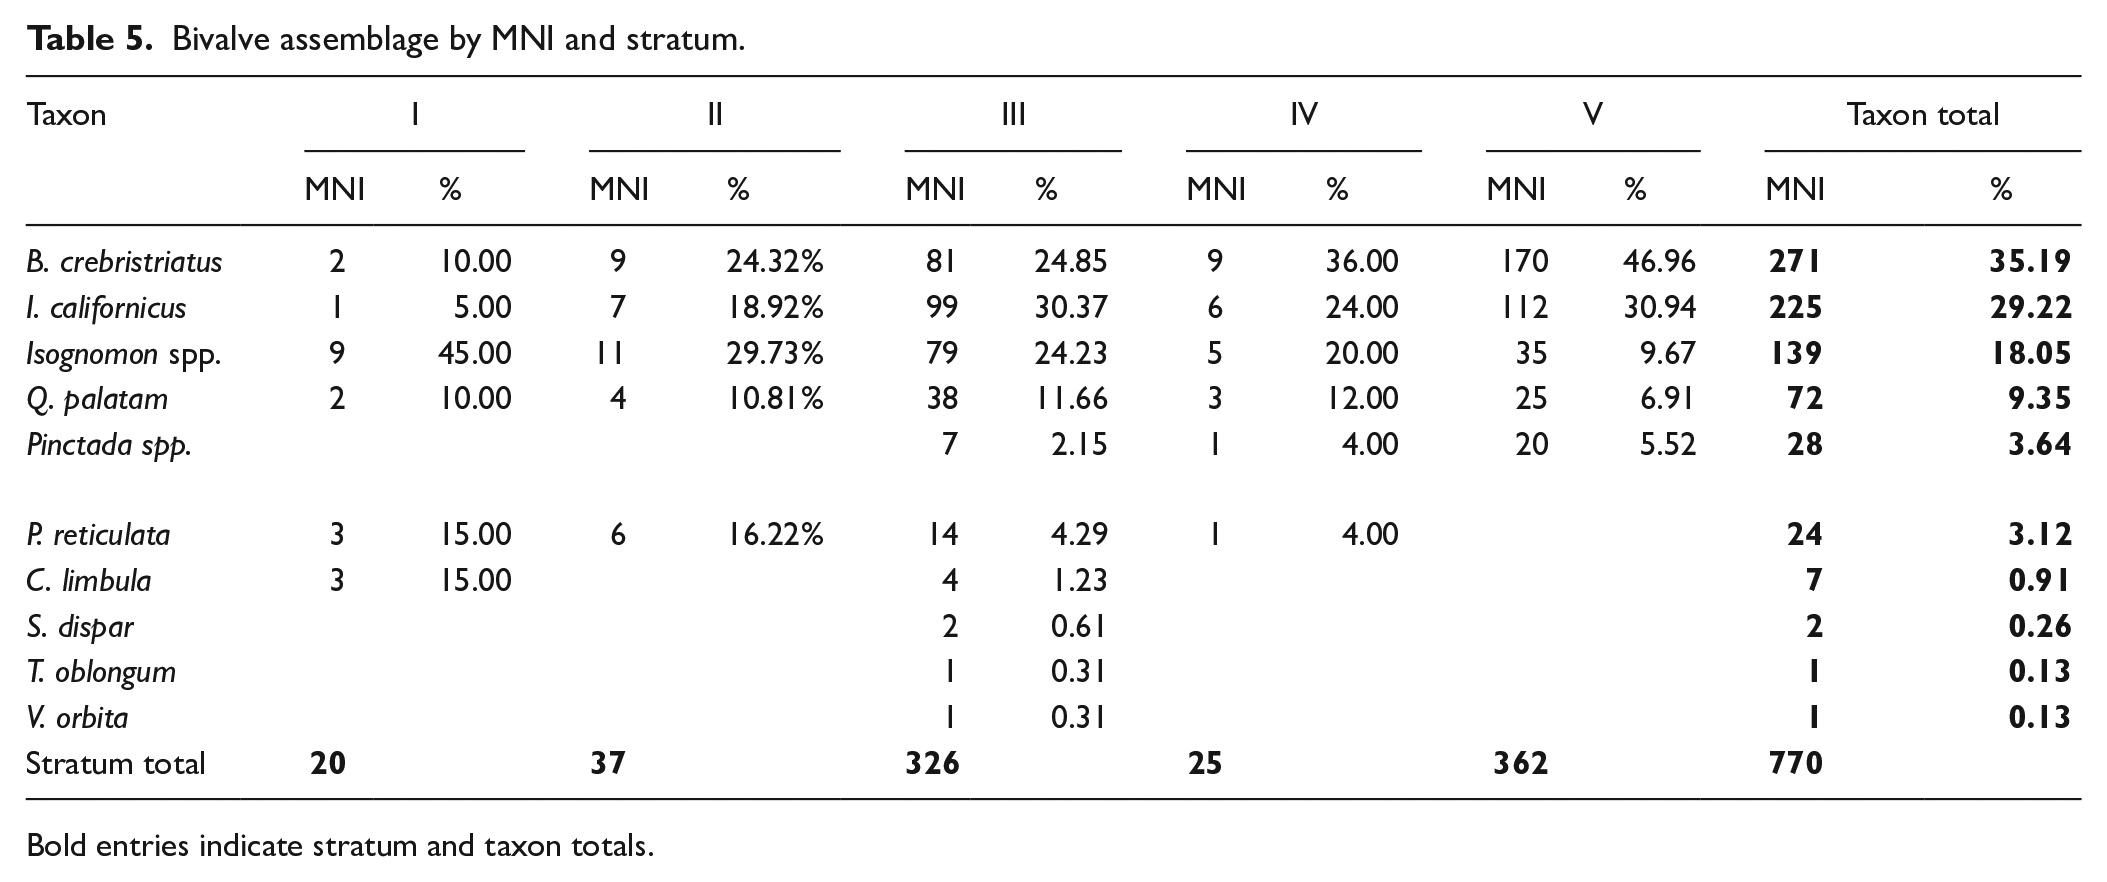
Bold entries indicate stratum and taxon totals.
Shell size
Size measurements were taken from gastropods N. neglectum and N. picea and bivalves B. crebristriatus, Isognomon spp., Pinctada spp. and Isognomon californicus. Sizes of N. neglectum and N. picea indicated a consistent and significant decline in shell length over time (Figure 6; Table 6). For N. neglectum, the median decline of 3.55 mm from Stratum V (median: 8.65 mm) to Stratum I (median: 5.10 mm) was significant (Dunn test p ⩽ 0.001). Similarly, for N. picea, from Stratum V (median 11.03 mm) to Stratum II (median: 9.30 mm) was statistically significant (Dunn test p ⩽ 0.007) (see Supplemental Material for all significance values).
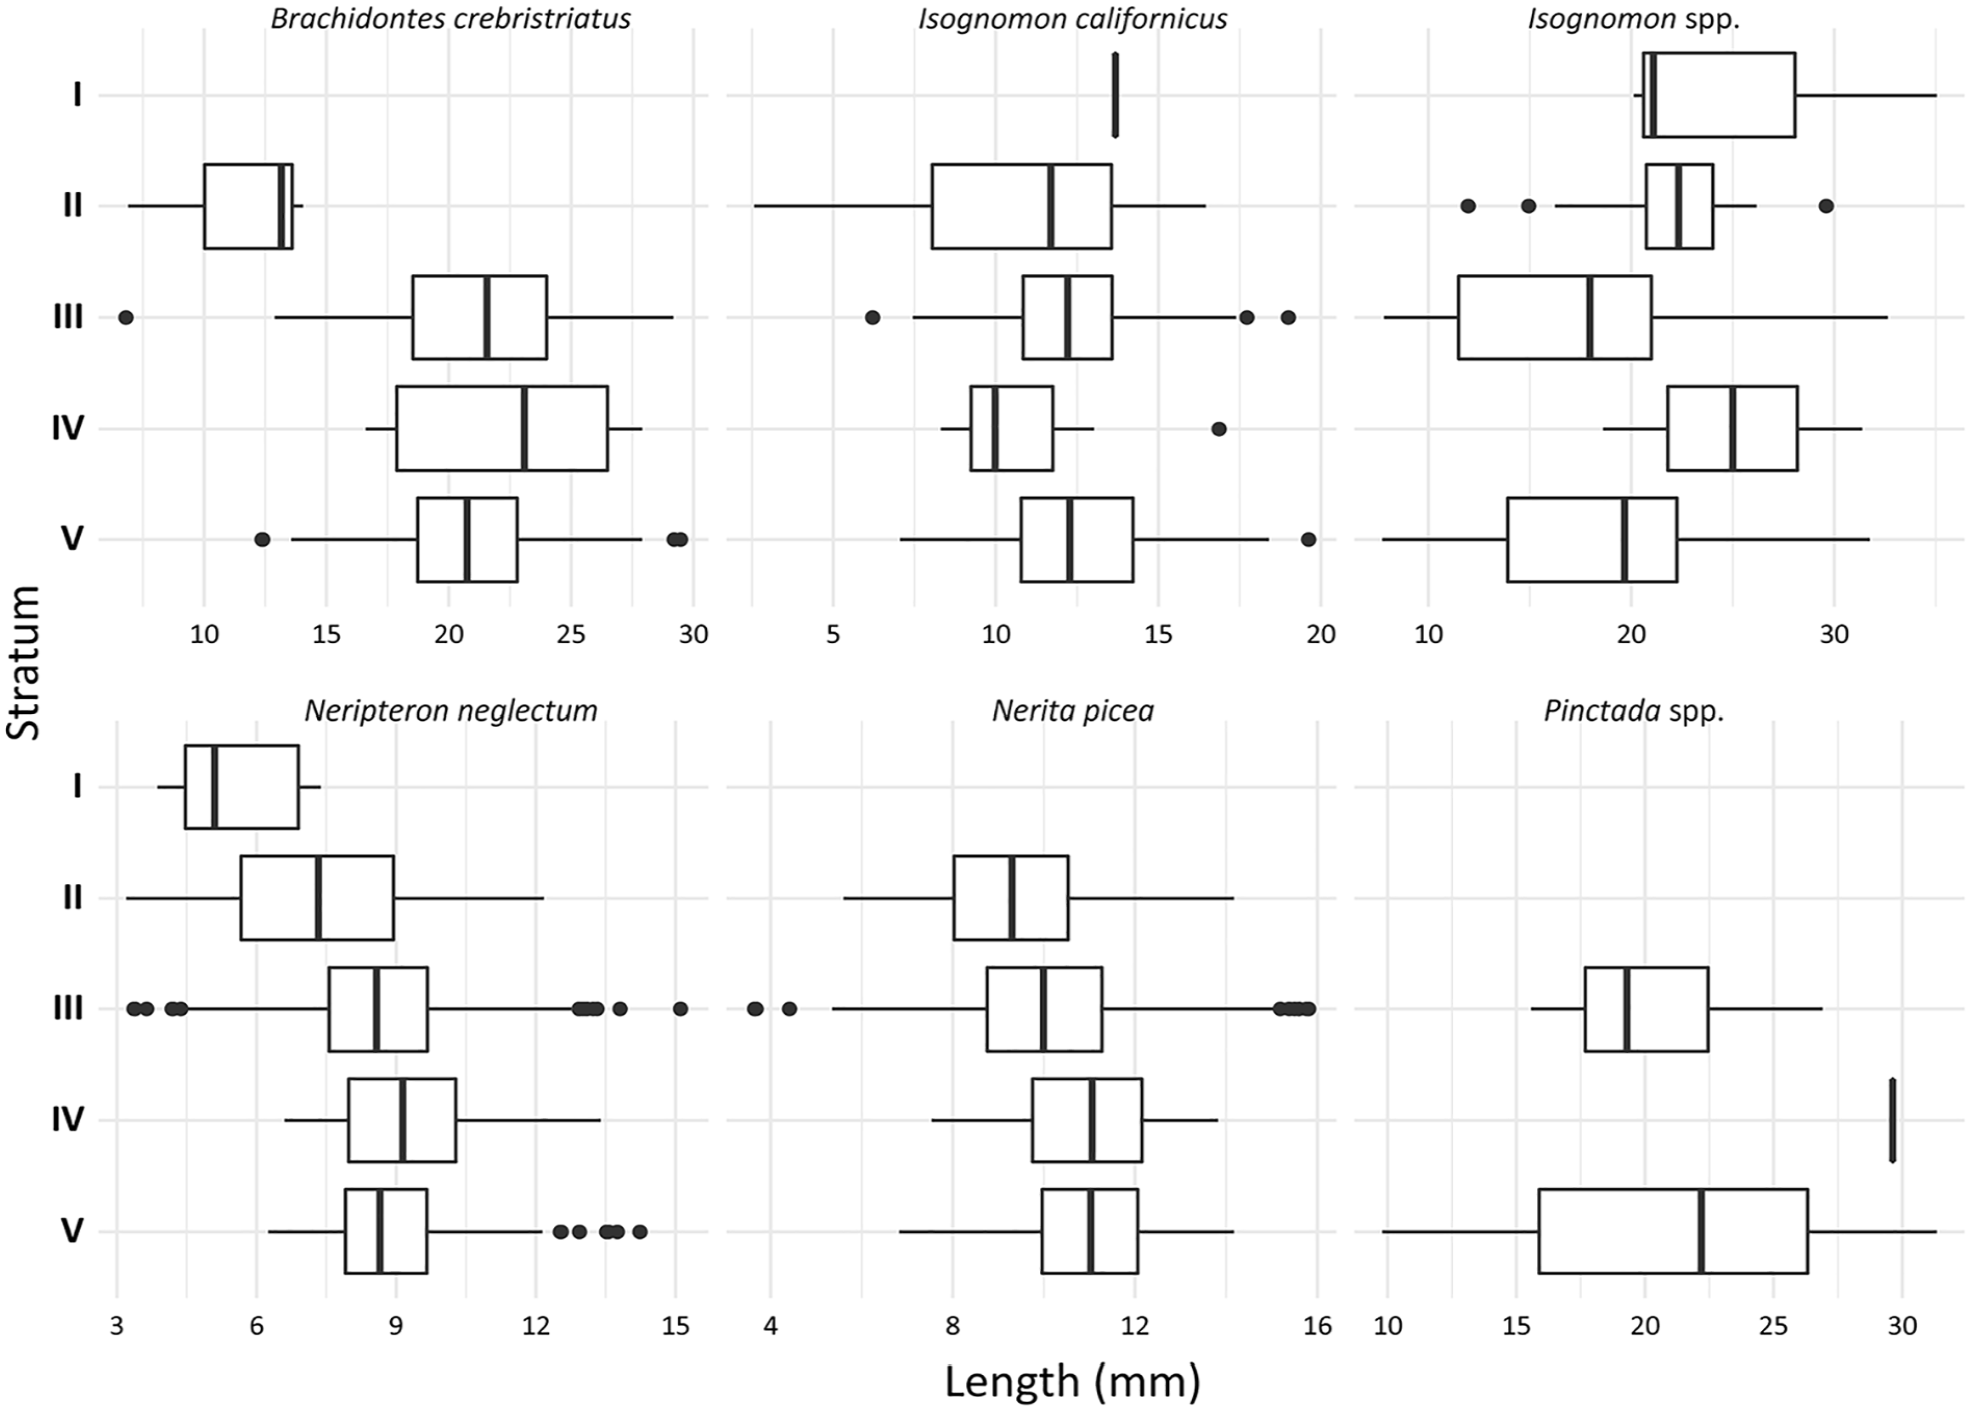
Size boxplots for measurable individuals from major taxonomic groups. Note that shell length was taken for N. neglectum and N. picea, valve length for B. crebristriatus, and hinge length for Isognomon californicus, Isognomon spp. and Pinctada spp. (see Supplemental Material).
Descriptive statistics for measurable Isognomon californicus, Pinctada spp., Isognomon spp., Brachidontes crebristriatus, Neripteron neglectum, and Nerita picea. No statistically significant differences were found between valve side groups for bivalves (see Supplemental Material).
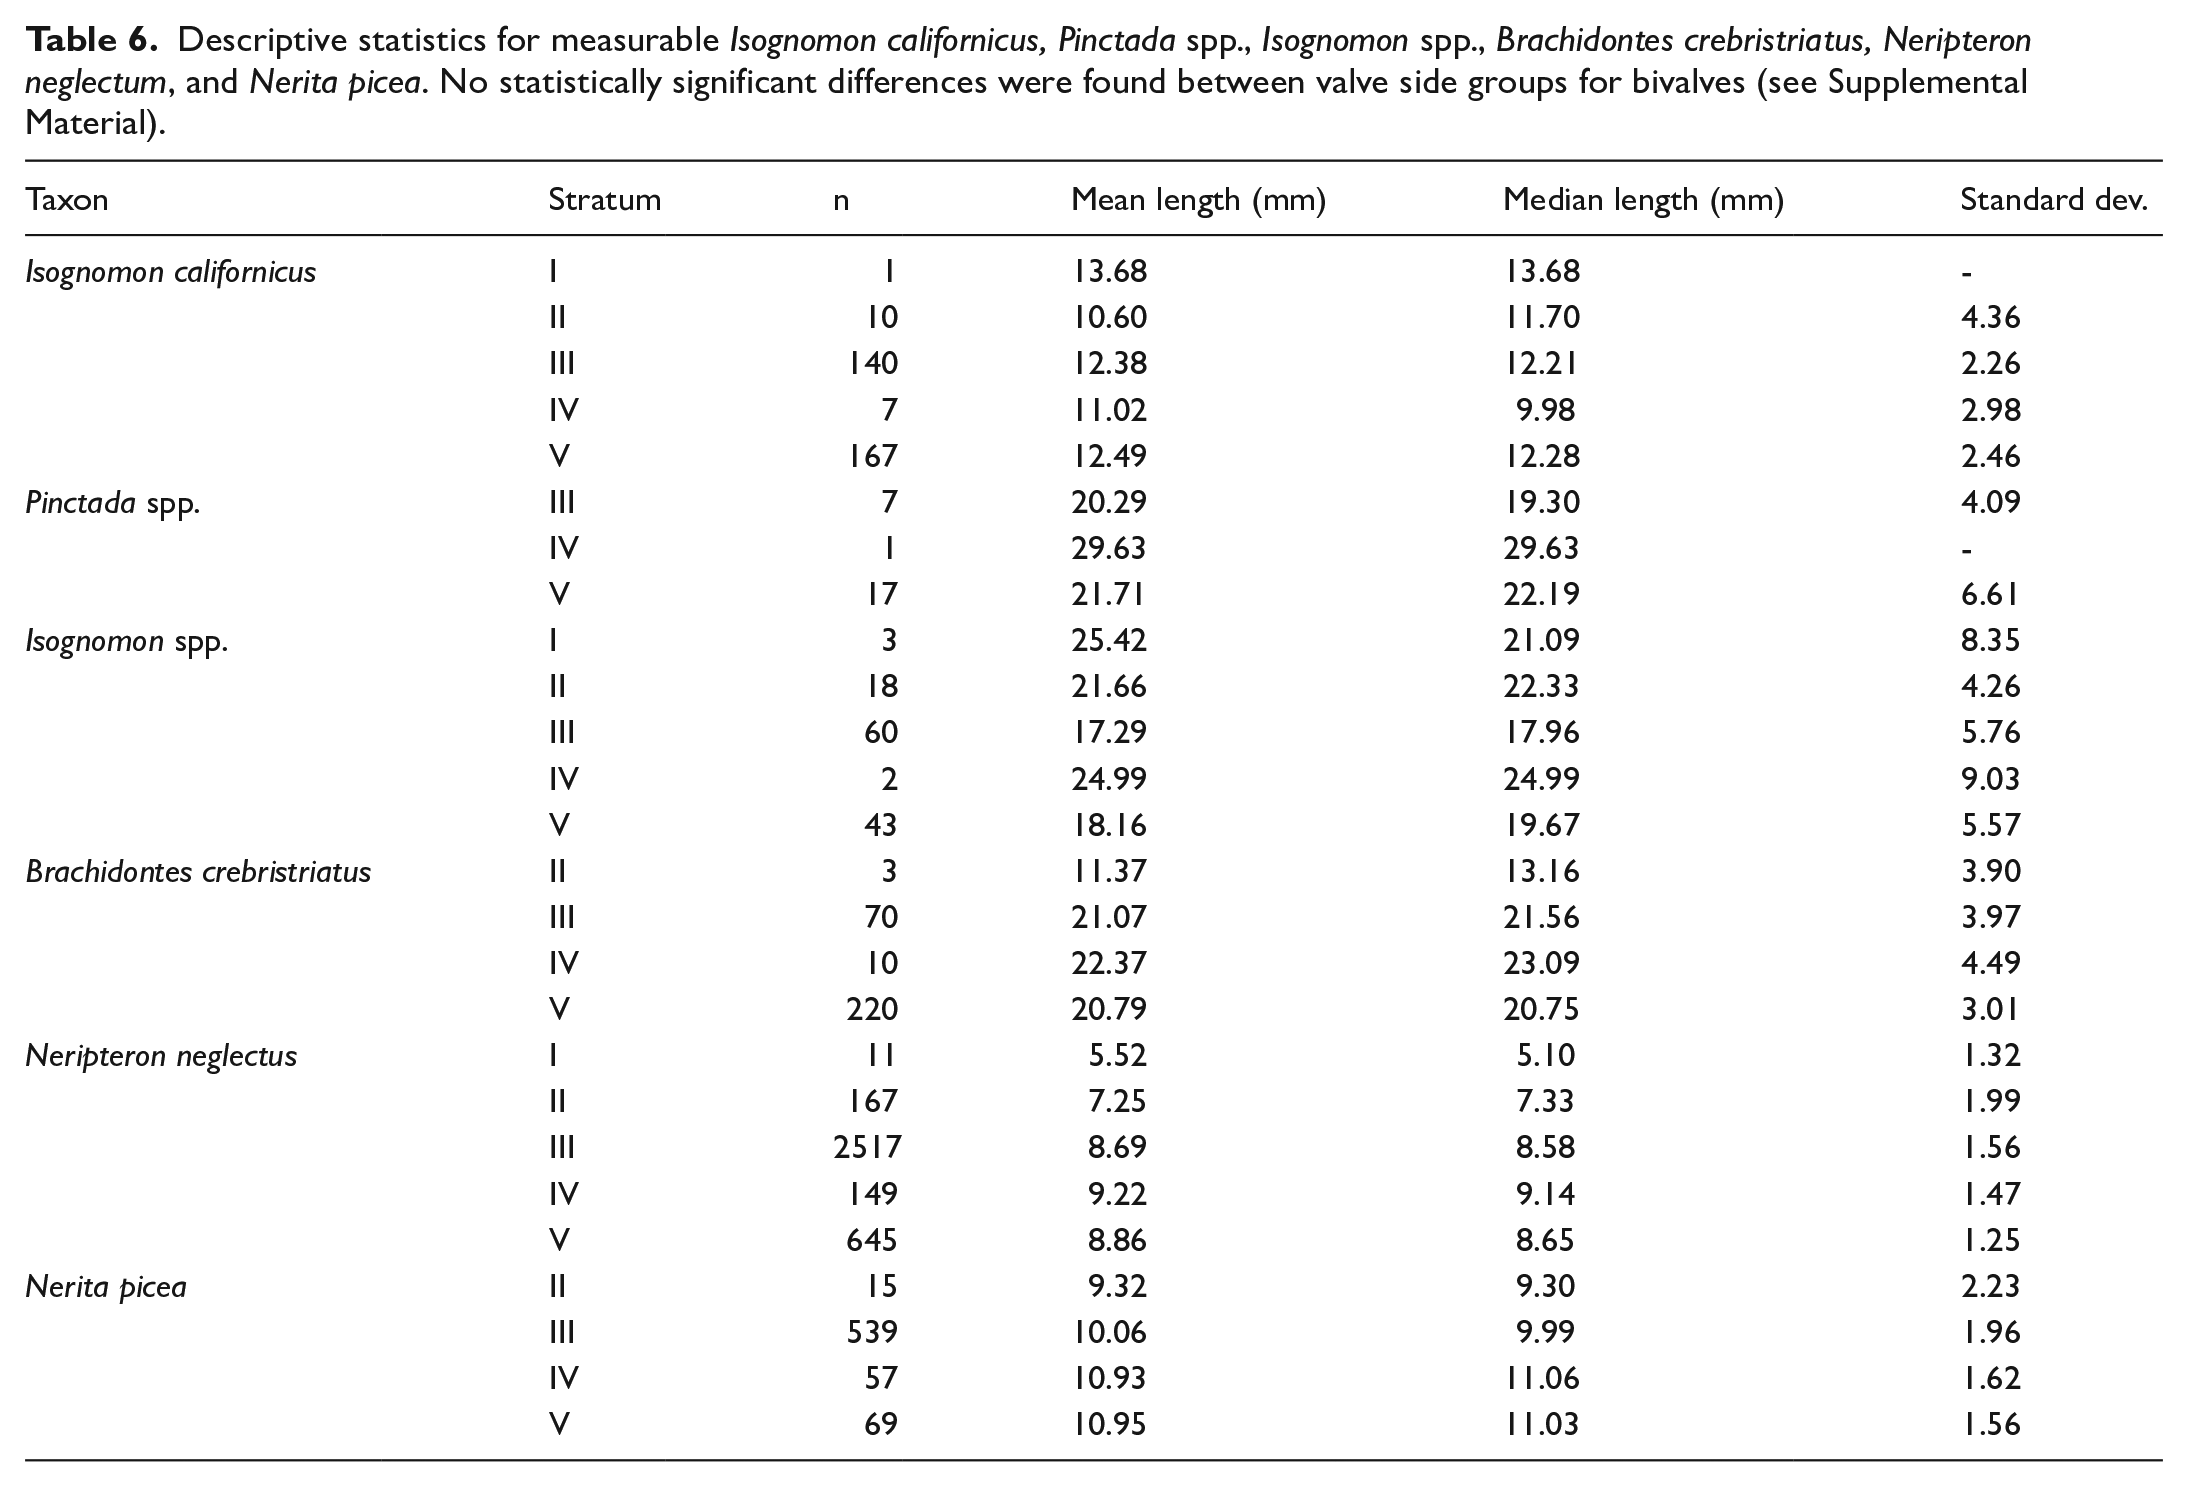
When assessing bivalve size, no significant difference was identified between left and right valve assemblages by taxonomic group (Supplemental Material). As such, measurements of left and right valves were assessed together to increase stratum sample size (Table 6). I. californicus size was relatively stable throughout the sequence showing no significant size changes (Kruskal-Wallis p = 0.27) (Figure 6). B. crebristriatus size also remained relatively stable through Strata III, IV and V, but declined suddenly by 8.41 mm from Stratum III (median: 21.56 mm) to Stratum II (median: 13.16 mm) (Dunn test p = 0.02). The Pinctada spp. assemblage showed a minor size decline from Statum V (median: 22.19 mm) to Stratum III (median: 19.30 mm), however this wasn’t statistically significant (Kruskal-Wallis p = 0.30). Conversely, Isognomon spp. showed a size increase from Stratum V (median: 19.67 mm) to Stratum IV (median: 25.00 mm) and again from Stratum III (median: 17.96 mm) to Stratum I (median: 21.09 mm) and II (median: 22.33 mm). Only the size increase from Stratum III to Stratum II was statistically significant (Dunn test p = 0.02) (Figure 6; Table 6; see Supplemental Material for all significance values).
Discussion
Whilst the Kawela Mound shellfish assemblage remains overwhelming dominated by speckled nerites (Neripteron neglectum) through time, there are some interesting changes across the archaeological sequence. Notably, (1) the disappearance or decline of freshwater and some brackish taxa (Neripteron vespertinum, Neripteron cariosum; Brachidontes crebristriatus, Isognomon californium, Pinctada spp.) concomitant with an increase in tree oysters (Isognomon spp.) and mud-tolerant clams (Periglypta reticulata); and (2) the sudden increase in rocky shore-dwelling, splash-tolerant, and marine-only taxa (e.g. Nerita picea, Chama limbula). As many of the later phase mollusc taxa require estuarine conditions, it seems unlikely that the Kawela Stream would have been permanently dammed to divert stream waters into adjacent terraced agricultural fields (Allen, 1991: 122), resulting in the total disappearance of a brackish ecosystem. However, a stone barrage wall was identified downslope from a high-status upland residence (Weisler and Kirch, 1985: 138) and it is likely that elites occasionally controlled water flow into the flood-plain gardening system. Other environmental changes may explain taxonomic shifts in mollusc taxa: (1) increased sedimentation at the inshore zone; and (2) development of marine rocky shore habitat from fishpond construction.
Inshore sedimentation and its effects
Agriculture in ancient Hawai‘i is generally divided into irrigated pondfield systems for taro cultivation in wet, windward locations and rain-fed (dryland, flood-water) systems for sweet potato and taro cultivation in leeward lowlands (Earle, 1977; Handy, 1940; Hommon, 2013; Ladefoged et al., 2009; Vitousek et al., 2010). Due to its dry, leeward location, Kawela supported a dryland or flood-water agricultural complex (Hommon, 2010: 20–22; see also Weisler, 1989: 128; Weisler and Kirch, 1985). The cultivation of this leeward environment would have involved shifting cultivation practices–sequences of vegetation clearance, burning and planting, followed by fallow period and subsequent re-use (Allen, 2004: 208; e.g. Kirch, 1994; Rosendahl, 1972; Weisler and Kirch, 1985: 134).
Vegetation loss through slash-and-burn agriculture, and the effects of Pacific rat (Rattus exulans) populations, would have created unstable upland slopes that initiated erosion across Kawela ahupua‘a (Athens et al., 2002; Ladefoged et al., 2009; Palmer et al., 2009; Vitousek et al., 2010; Weisler and Kirch, 1985: 134). The redeposition of sediments would not have been detrimental to the Kawela dryland system as ‘erosion also exposes rock and little-weathered soil near the surface, making the effective age of the soil much younger than that of the geological substrate from which it was formed’, enhancing the fertility of both the erosional and depositional areas (Vitousek et al., 2010: 783). It may, however, have had more detrimental impacts in inshore zones from coastal sedimentation (David et al., 2020; Rowe et al., 2020). The effects of sedimentation along the Kawela coast may have been further exacerbated by four stone-walled fishponds that are situated 2.5 km east and 3.5 km west of the Kawela Stream mouth–all within easy foraging distance. Kānoa fishpond, closest to Kawela Stream, encircles ~20 ha of the littoral shore, acting as an enormous sediment trap of upland deposition and, importantly, restricting the movement of sediments along the shore. This process is visible with monumental fishponds today, including Ali‘i fishpond, that have been largely infilled by sediments, stabilised by invasive mangroves (Rhizophora mangle) and pickleweed (Batis maritima) growing within fishponds (Figure 7) (Chimner et al., 2006).
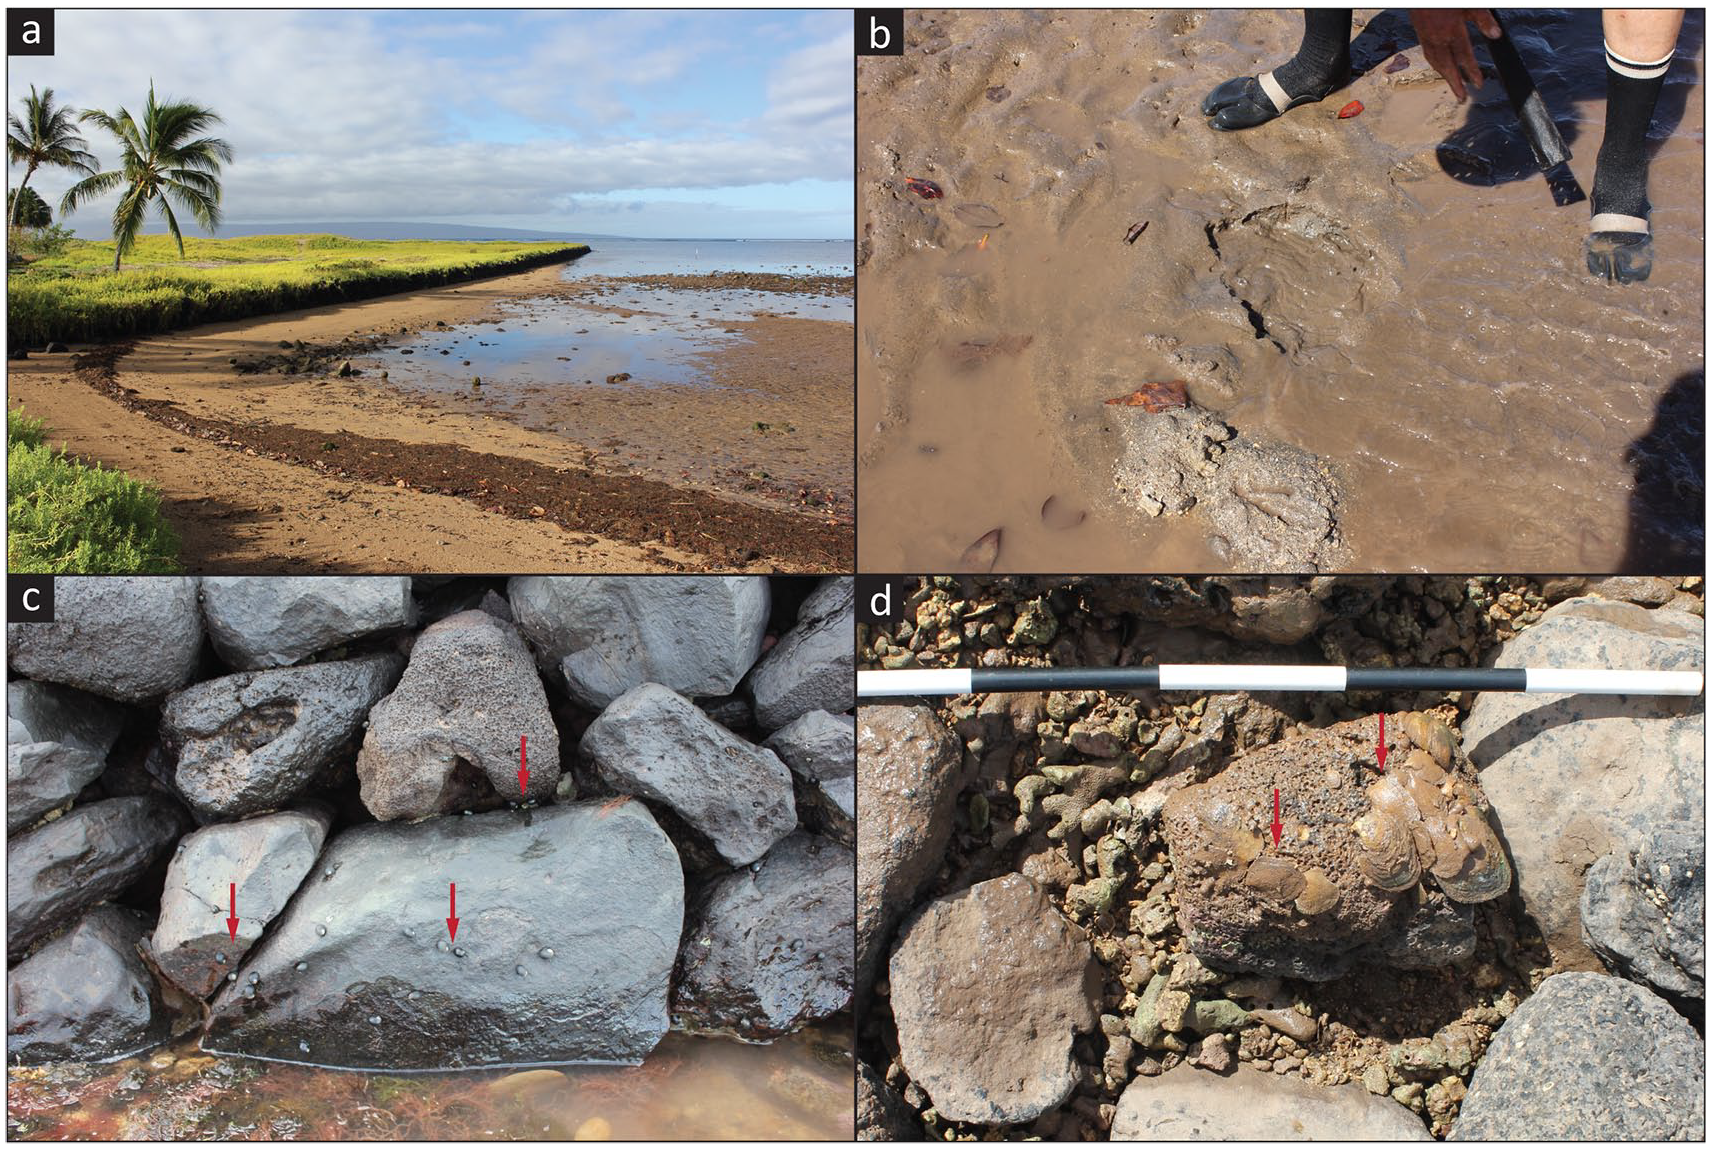
Current Kawela coastal environment: (a) infilling of Kānoa fishpond from modern sedimentation, exacerbated by introduced pickleweed (Batis maritima); (b) siltation in the inshore zone; (c) Nerita picea found on Kānoa fishpond basalt walls above low tide; (d) Isognomon perna found on Kānoa fishpond basalt walls and coral rubble. Red arrows in (c and d) point to some shellfish.
Sedimentation is a natural process, whereby eroded sediments are transported by water and, as the water flow slows, settle out of the water column onto a surface (Julien, 2010). Sedimentation can be beneficial or detrimental to aquatic environments. Beneficial effects include nutrient replenishment and the building of new substrates (e.g. marsh development). High concentrations of suspended sediment, however, can negatively impact water quality and lead to reduced survival of aquatic fauna and flora. Adverse effects include the burial of bottom-dwelling organisms and surfaces, decreased penetration of light in the water column, changes to nutrient balance and water circulation, increased turbidity, and coastline alteration (Fischetti, 2001; Huber, 1999; Julien, 2010). Lastly, as sediment particles absorb warmth from the sun, suspended sediments can increase water temperature causing further stress to some species (Environment and Climate Change Canada, 2016).
Molluscs are highly specialised, niche-adapted organisms. They are excellent environmental indicators and bivalves, in particular, can be used to track water quality. The Kawela Mound sequence demonstrated a consistent and significant decline in B. crebristriatus, I. californicus, and Pinctada spp. through time. B. crebristriatus and I. californicus are both brackish tolerant taxa, and Pinctada spp. are predominantly marine but can occupy bays with freshwater input (Hawai‘i’s State Wildlife Action Plan, 2015; Kay, 1979; WoRMS Editorial Board, 2023). Given the nearby location of Kawela Stream (Figure 2), the presence of a brackish to marine environment is expected. Pinctada spp., however, often have a very poor tolerance for turbid water and high levels of suspended sediment (Aji, 2011; Yukihira et al., 1999). The taxon’s rapid decline to Stratum III and subsequent disappearance from the sequence (Figure 5; Table 5) is likely the result of coastal sedimentation initiated by land use practices, that increased turbidity and siltation. Little research has been conducted on B. crebristriatus and I. californicus as they are not considered economically important species today. We suggest that, like Pinctada spp., B. crebristriatus and I. californicus struggled to tolerate increasing sedimentation and water turbidity in the Kawela inshore zone. A similar occurrence may have taken place in Pearl Harbor where B. crebristriatus mussels were recorded prior to 1850 when water quality in the harbour was reportedly high (low sedimentation and turbidity) but disappeared after damaging land practices in the mid-nineteenth century began to increase the sediment load of runoff reaching the harbour (Coles, 2006). Beyond increased suspended inorganic particles, siltation, and turbidity, sedimentation may have altered the composition of nutrients and heavy metals in the inshore zone. Ringwood (1992) found that I. californicus growth, fertilisation of gametes, and embryo development were negatively affected by exposure to cadmium (Cd) and copper (Cu) metal pollutants. Gallmetzer et al. (2017) similarly found that heavy metal input (Hg, Mn, Fe, Ni, Cu, Cd, Zn) can drive changes in molluscan communities. Researchers have shown that Hawaiian soils are naturally high in a number of heavy metals (e.g. Cd, Cr, Fe, Mn, Pb) (AECOM Technical Services, 2012; Barnard and Halbig, 1985, 1988; Hue et al., 2001; Sutherland, 2000). At Kawela, sedimentation from upland erosion would have introduced iron, manganese, and other metals, that may have further pushed some taxa to their survival limits. Sedimentation and the reduction in water quality may also explain the decline and disappearance of the freshwater nerite, Neripteron vespertinum and the freshwater-brackish nerite Neripteron cariosum, both of which would have inhabited Kawela Stream and occurred near the mouth of the outflow (Kay, 1979). Similarly, the sand-dwelling Nerita polita could not have tolerated increased silt content on sandy substrates (Kay, 1979), explaining its disappearance from the sequence.
A decline in shell size through time was reported for Pinctada spp., B. crebristriatus, Neripteron neglectum, and Nerita picea, and for I. californicus in Stratum IV (Figure 6; Table 6). The reduction in water quality likely drove these changes as high concentrations of suspended sediment are negatively correlated to body condition and growth rates. For filter-feeding bivalves, inorganic silt suspension reduces the amount of food available and, for grazing gastropods, reduced light penetration and smothering sediments reduce algal growth (Brim Box and Mossa, 1999). Feeding-related stress would have caused depressed rates of growth and even starvation with long-term exposure to such conditions (Grant and Thorpe, 1991). Higher water temperatures, such as those produced by high levels of suspended sediment, are also known to reduce the growth rate of many Pinctada taxa (Aji, 2011). The significant decline in B. crebristriatus size in Stratum II is particularly notable. Brachidontes crebristriatus are larger when growing in brackish water and it is possible that the Stratum II size reduction indicates that people were gathering this taxon from further offshore, in more pristine marine conditions, perhaps because it had largely disappeared from the high-sediment inshore zone (Hawai‘i’s State Wildlife Action Plan, 2015).
The disappearance or decline of turbidity and suspended sediment-intolerant taxa (N. vespertinum, N. cariosum; B. crebristriatus, I. californium and Pinctada spp.) occurred concomitant with an increase in Isognomon spp. and Periglypta reticulata. Isognomon spp. occupy a specific niche in brackish estuaries characterised by low flow rates and high silt content that would be unfavourable conditions for many other oysters (Gillies et al., 2017; Thomsen and McGlathery, 2006). In New South Wales, Australia, Benthotage et al. (2022) found that leaf oysters (Isognomon ephippium) were able to persist in dense populations in estuaries with low pH and high turbidity that were dominated by fine silt. Similar observations have been reported from the Andaman Islands, where leaf oysters (I. ephippium) were often found covered with a layer of fine silt and sometimes half-buried in muddy sediment (Thangavelu et al., 2011). Further, in 2018 the authors visited Kānoa fishpond and noted the extreme coastline siltation resulting from modern land clearance for housing and infrastructure and the introduction of invasive ungulates over the past few centuries. The only mollusc taxa found on the Kānoa fishpond walls were Isognomon perna, Nerita picea, and Hipponicidae (Figure 7). Isognomon spp. increased in size in Stratum IV, perhaps as a response to sudden terrigenous input, associated nutrient increase, and appearance of its preferred habitat. Periglypta reticulata is similarly found in intertidal areas in sand and mud and would be tolerant of increased sediment in the substrate (Bernard et al., 1993; Kay, 1979). Quidnipagus palatam was identified consistently through the Mound site phases. It occupies intertidal areas in coarse sand and coral fragments and silty and gravely sands (Kay, 1979). Q. palatam would have tolerated the increasingly silty substrate produced by sedimentation. The change in bivalve communities demonstrates a consistent increase in turbidity and suspended sediment-tolerant bivalves from Stratum V (MNI: 16.57%) to Stratum I (MNI: 70%) (Table 7; Figure 8). As many of these taxa (e.g. Isognomon spp., Q. palatam, P. reticulata) are larger-bodied (correlating to more food/individual) than other harvested molluscs, this change in taxa may well have been preferable to Kawela foragers (Figure 3).
Relative abundance of turbidity- and sediment-tolerant bivalve taxa.
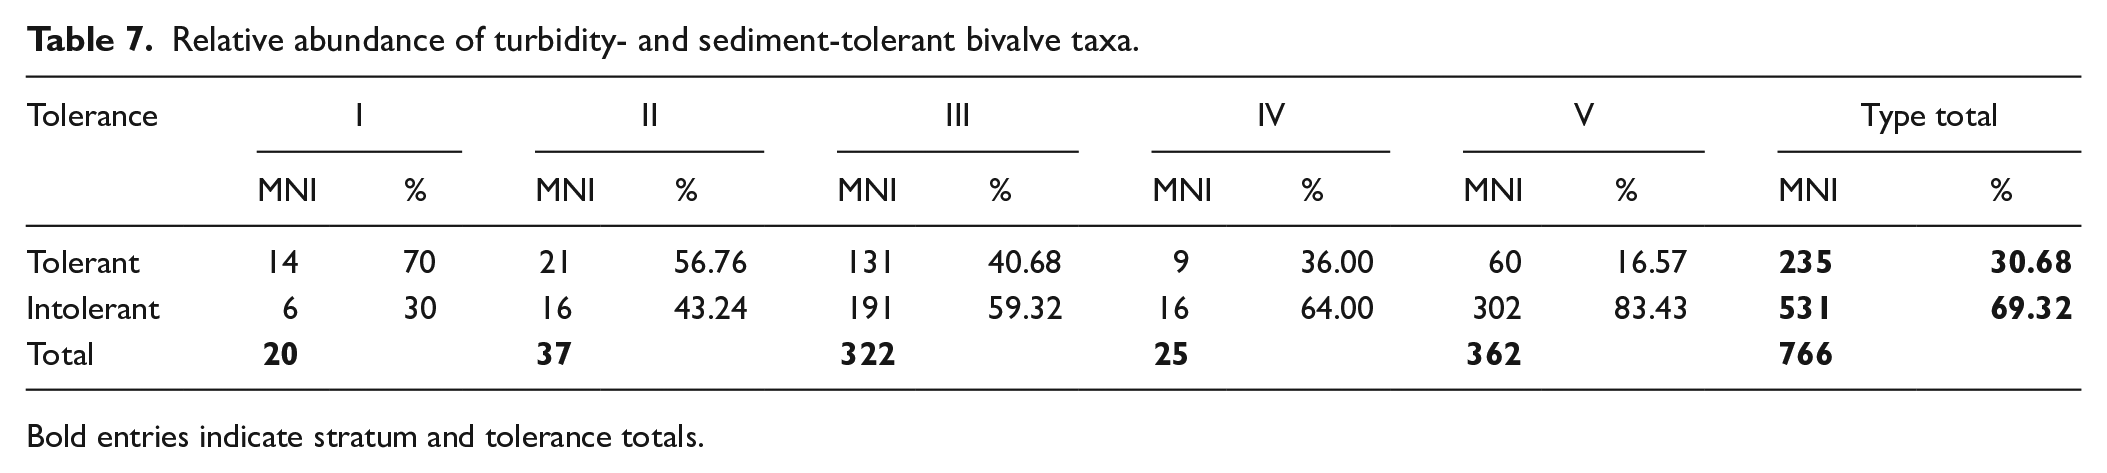
Bold entries indicate stratum and tolerance totals.
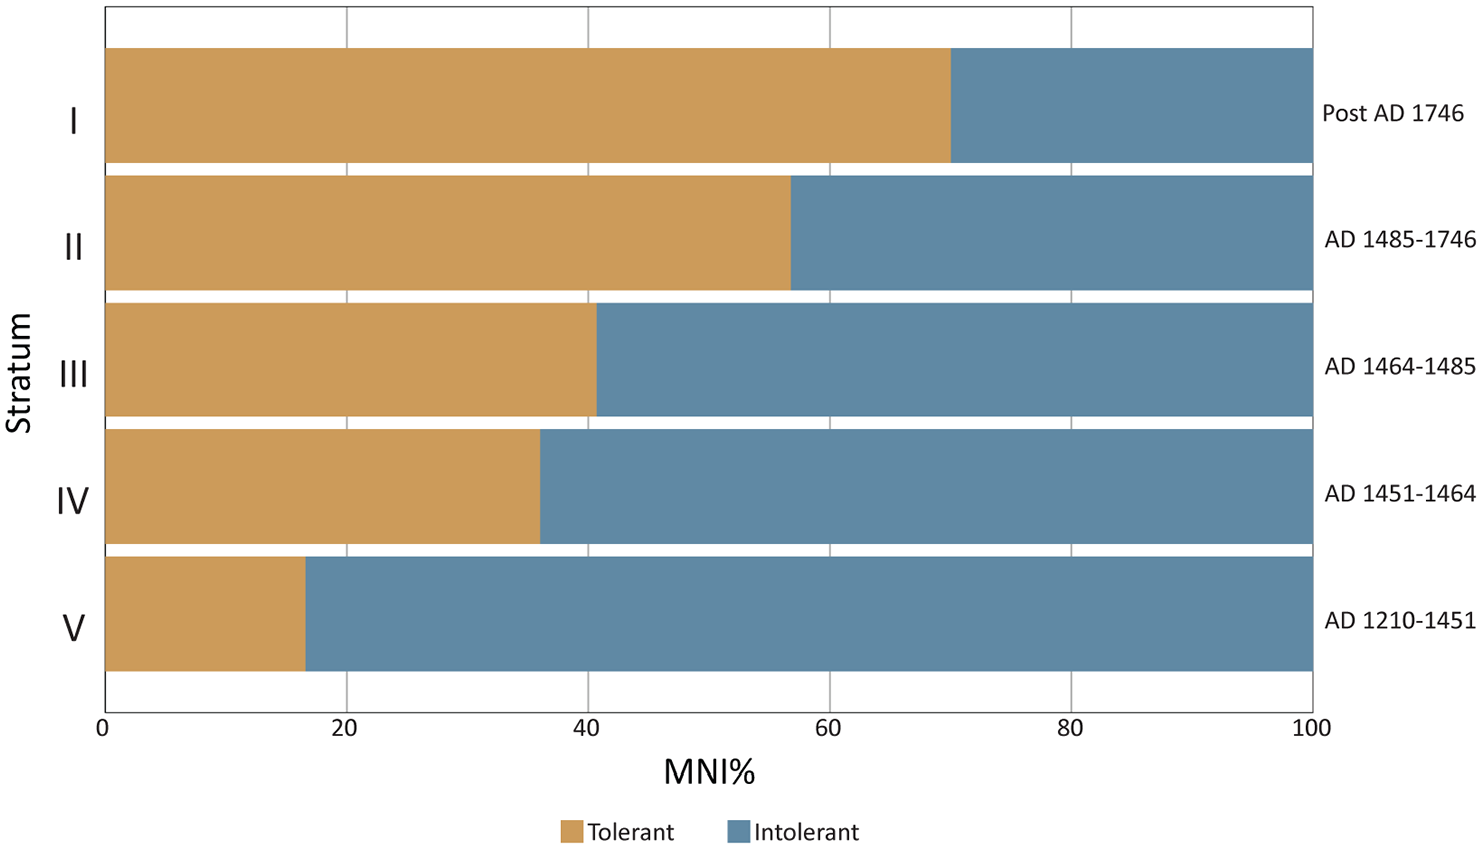
Relative abundance of turbidity- and sediment-tolerant bivalve taxa.
Importantly, N. neglectum remains overwhelmingly the dominant taxon through time (Figure 4; Table 2), indicating that inshore sedimentation, whilst enough to cause some molluscan communities changes, was not enough to cause a complete phase shift as is visible today at Kawela. Fitzpatrick and Giovas (2021) documented patterns of land use and sedimentation in Palau, Micronesia, and the Lesser Antilles, Caribbean. The authors reported that, in Palau, mangrove forests and strategically planted taro beds prevented much of the upland sediment from entering the littoral zone. However, mangrove deforestation in the Lesser Antilles resulted in inshore sedimentation and coastal smothering. Mangroves were an historic introduction to the Hawaiian Islands and the majority of the Kawela agricultural system was a dryland-flood-water system for sweet potato cultivation. There was, however, Kakahai‘a Pond – an inland fishpond for the culturing of mullet and taro and irrigation ditches (‘auwai) supplying water to sweet potato fields (Figure 2). Much like the taro beds identified in Palau (Fitzpatrick and Giovas, 2021), Kakahai‘a Pond and the ‘auwai would have acted as a sediment traps and helped to reduce the rate of local coastal sedimentation. Indeed, auguring around the pond showed a 2 m thick layer of silt that accumulated during the past two centuries (Weisler, 1983: table 1, figs. 3, 5, 6; Weisler et al., 2023: fig. 3).
Overall, we suggest that Kawela ahupua‘a sedimentation and Kānoa and Ali‘i fishponds as enormous inshore sediment traps resulted in increased suspended sediment, turbidity, and possible nutrient changes along the coastline. This initiated a community shift in bivalve populations to taxa that could tolerate higher turbidity and silty substrates as we have shown here (Table 7; Figure 8). The change appears to have been begun in Stratum IV (AD 1451–1464) with the appearance of P. reticulata and significant increase of Isognomon spp. tree oysters alongside declines in turbidity and suspended sediment-intolerant taxa (N. vespertinum, N. cariosum; B. crebristriatus, I. californium, and Pinctada spp.). This time period aligns well with current Hawaiian cultural phases, where it is thought that rainfed agriculture, such as the Kawela dryland system, largely developed after AD 1400 and increased intensification after AD 1650 (Vitousek et al., 2010: 783). Agricultural intensification and increased run-off due to historically introduced ungulates explains the molluscan community phase shift to almost exclusively silt- and turbidity-tolerant taxa by Stratum I (post AD 1750).
Expansion of marine rocky shore habitat
The significant increase of Nerita picea in Stratum V (MNI: 7.22%) to Stratum IV (MNI: 32.58%) may indicate the construction of Kānoa and nearby fishponds by Stratum IV (AD 1451–1464). N. picea are marine, not brackish, nerites (WoRMS Editorial Board, 2023). They require a rocky habitat and prefer to occupy the high intertidal splash zone. There would have been a rocky habitat at the mouth of the Kawela Stream. However, this would have been too brackish for N. picea and much better suited to the very abundant, euryhaline N. neglectum (Kay, 1979). Where then, was the closest marine, rocky, splash zone habitat for N. picea? On Moloka‘i, N. picea is most abundant on exposed, volcanic, windward coastlines (Rogers and Weisler, 2022). The closest analogue habitat to Kawela would have been the 1.5+ m high basalt boulder stone walls of the four nearby fishponds that offered volcanic rock substrate extending up to ~400 m into the reef flat, proving a marine rocky habitat. The upper portions of the walls would have remained exposed at high tides, offering a splash-exposed, high intertidal-like refuge, as is the case today (Figure 7). N. picea grow and reproduce rapidly and can spawn consistently throughout the year (Axelsen, 1968; Chislett, 1969). Further, Nerita spp. pelagic veliger stage can extend to 6 months, providing a greater opportunity to be dispersed more widely on currents and colonise new areas (Underwood, 1975). As such, N. picea could have quickly established abundant populations after fishpond construction. The appearance of Chama limbula in Stratum III, which requires marine conditions, hard structures and occurs in areas of low sedimentation (Amar, 2021), may also have benefitted from fishpond construction.
Overall, the shift in molluscan communities recorded in the Kawela Mound was initiated by two events: (1) coastal sedimentation because of land use practices; and (2) the construction of four fishponds nearby, which served as sediment traps that exacerbated local turbidity but also provided rocky marine habitats otherwise not present along the soft shore consisting primarily of sand and mud.
Conclusion
Over eight centuries, the people living around Kawela transformed the terrestrial and inshore marine zones into a culturally modified land- and seascape. These changes produced abundant resources capable of supporting growing populations. Changes in the molluscan community were initiated by inshore sedimentation and the construction of stone-walled fishponds. However, these changes did not reduce mollusc productivity and, in some cases, may even have been preferable to foragers (e.g. larger-bodied Isognomon spp. individuals).
Today, local communities such as Āina Momona, Moloka‘i No Ka Heke, and other organisations across the Hawaiian Archipelago are restoring fishponds and freshwater streams that were infilled and diverted, respectively, by post-1900s land use practices (McDaniel, 2018; McWhorter, 2022; Office of Aquaculture, 2021). The Kawela Mound site documents centuries of mollusc taxa and inshore environments prior to these modern alterations when fishponds were in use and the Kawela Stream followed perennially. This information may assist restoration efforts by providing a pre-European baseline for molluscan communities, population structure, and shell size along the Kawela shoreline. Indeed, this study provides another example of archaeology as an increasingly essential component of historical ecology; offering insights into past taxa distributions, ecosystem structure and functioning, harvest thresholds, species resiliency, and desired future conditions (Braje et al., 2017; Braje and Rick, 2013; Lotze et al., 2011). Humans have been the dominant ecosystem engineer in landscapes for over ten thousand years. In some instances, essential ecological interactions fail to take place once people have been removed from the landscape (e.g. Bird et al., 2016; Bliege Bird et al., 2018; Crabtree et al., 2019; Levis et al., 2017) or millennia-long food production systems survive enormous environmental and climatic shifts only to collapse after European arrival (e.g. Reeder-Myers et al., 2022; Rogers, 2023; Thompson et al., 2020). Understanding ecosystem functioning prior to the transformative effects of people, particularly European colonisers, is essential for present-day food security challenges, with the goal of restoring environmental integrity and alleviating biodiversity crises (e.g. Reeder-Myers et al., 2022; Wood et al., 2017).
Supplemental Material
sj-docx-1-hol-10.1177_09596836231219474 – Supplemental material for Terrestrial cultural landscapes changed inshore marine ecosystems: Eight centuries of shellfish harvesting from the Kawela Mound site, Hawaiian Islands
Supplemental material, sj-docx-1-hol-10.1177_09596836231219474 for Terrestrial cultural landscapes changed inshore marine ecosystems: Eight centuries of shellfish harvesting from the Kawela Mound site, Hawaiian Islands by Ashleigh J Rogers and Marshall I Weisler in The Holocene
Footnotes
Acknowledgements
Firstly, we thank the Moloka‘i community for supporting our work over the years. The original field and lab work was supported by Kawela Plantation Development Associates while Weisler was employed at the Bernice P. Bishop Museum Honolulu, Hawai‘i in the early 1980s. We especially thank Sara Collins, Virgil Meeker and Walter Mendes for assistance with excavating and processing the material from the Kawela Mound site. The loan of the Kawela shellfish for this study was organised by Stephanie Lambert at the Bishop Museum. We thank Matthew Harris for his assistance with ![]() . Radiocarbon dating of the Kawela Mound site was facilitated by grants from the Australian Nuclear Science Technology Organisation (ANSTO), and the Universities of Otago and Queensland. Thanks to all.
. Radiocarbon dating of the Kawela Mound site was facilitated by grants from the Australian Nuclear Science Technology Organisation (ANSTO), and the Universities of Otago and Queensland. Thanks to all.
Data statement
Data available on application to the authors.
Funding
The author(s) disclosed receipt of the following financial support for the research, authorship, and/or publication of this article: Radiocarbon dating of the Kawela Mound site was facilitated by grants from the Australian Nuclear Science Technology Organisation (ANSTO), and the Universities of Otago and Queensland.
Supplemental material
Supplemental material for this article is available online.
References
Supplementary Material
Please find the following supplemental material available below.
For Open Access articles published under a Creative Commons License, all supplemental material carries the same license as the article it is associated with.
For non-Open Access articles published, all supplemental material carries a non-exclusive license, and permission requests for re-use of supplemental material or any part of supplemental material shall be sent directly to the copyright owner as specified in the copyright notice associated with the article.