
Abstract
Pollen records are the most important proxy for reconstructing past terrestrial vegetation. While new approaches for improved quantitative interpretation of pollen data have been developed over the last decades, the availability of pollen records remains mostly limited because pollen samples are still analysed manually, which is a time-consuming task and requires extensive training. Here, we present an approach for automated recognition of pollen and spores from lake sediments using deep convolutional neural networks and machine learning. The approach includes two stages. The detector first locates pollen and spores in the sample matrix, and the classifier then classifies these objects. We have trained the approach on two pollen datasets from two lakes in north-eastern Germany. So far, our approach is able to automatically recognise 10 pollen types and Lycopodium spores with high accuracy. As soon as more training data are available, more pollen and spore types can be added. The preparation of training data, the training of the neural networks and their application are accessible via a freely available, browser-based user interface called TOFSI.
Introduction
Pollen records from lake sediments or peat serve as a primary proxy for land-cover reconstructions, and they are also extensively used in climate reconstructions and in long-term biodiversity studies. Despite their significance, the availability of pollen records is limited in many parts of the world, particularly outside Europe and North America. This limitation stems from the fact that, since the beginning of pollen analysis more than 100 years ago, pollen records have been, and still are, generated by manual pollen counting under a light microscope. This process is time-consuming and requires extensive training.
Initial attempts to automate pollen recognition began more than 30 years ago (Langford et al., 1990; Stillman and Flenley, 1996; Vezey and Skvarla, 1990). However, it is only in the last decade, with the emergence of fast artificial neural networks and deep learning, that automated pollen recognition has become truly feasible. Approaches utilising these neural networks have demonstrated automated classification of up to 46 pollen types with reasonable accuracy (Daood et al., 2016; Olsson et al., 2021; Sevillano et al., 2020; Sevillano and Aznarte, 2018). Holt and Bennett (2014) and Viertel and König (2022) summarise the current state of automated pollen recognition and discuss the necessary next steps towards routine adoption of automated palynology, such as standardisation of training data.
The practical application of automated pollen recognition is currently most advanced in the field of aerobiology, specifically for airborne pollen monitoring. Pollen monitoring is of particular importance for the many pollen allergy sufferers, as they benefit from better pollen flight forecasting. Monitoring is being developed using various approaches, including classical pollen slides from mechanical pollen samplers (e.g. Hirst samplers), multispectral imaging flow cytometry (Dunker et al., 2021), and dedicated airborne particle identifiers (e.g. Daunys et al., 2022; Matavulj et al., 2023). A first network of autonomous airborne pollen detectors, known as the e-PIN system, has recently been established in Bavaria (https://epin.lgl.bayern.de/pollenflug-aktuell). Punyasena et al. (2022) present a workflow for the automated recognition of modern pollen collected in pollen traps.
To the best of our knowledge, there has been no development or application of automated pollen recognition for subfossil pollen and spores found in lake sediments or peat. Automated pollen recognition is more challenging in these samples owing to the prevalence of various other remnants, such as detritus, algae, and mineral particles. Automated approaches must, therefore, first find pollen and spores in the sample matrix. In addition, subfossil pollen and spores typically have poorer preservation than fresh, airborne pollen grains. These differences increase the challenges of automated recognition.
In a recent collaboration within the DIG-IT! project, ecologists from the University of Greifswald and visual computing experts from the Fraunhofer Institute IGD in Rostock have explored the potential of automated image recognition for the study of wood anatomy, root growth, and bat monitoring (Gillert et al., 2023; Krivek et al., 2023; Peters et al., 2023; Resente et al., 2021). As a fourth focus, we investigated the automated recognition of subfossil pollen and spores in lake sediments. To achieve this, we developed a two-stage image recognition algorithm that is applicable to pollen slide images. In this study, we present the approach and evaluate its ability to firstly locate pollen in the sample matrix and then classify pollen types. In addition, we designed a user-friendly, browser-based interface that allows individuals with no prior machine learning experience to prepare training data, train algorithms, and apply automated pollen recognition.
Materials and methods
Algorithm setup
Our pollen recognition algorithm consists of two primary stages, the detector and the classifier. The detector aims to find pollen and spores in the light-microscope images provided. We implemented the detector using a Faster R-CNN object detector (Ren et al., 2017). To address the challenge of the limited depth of field in microscope images, we adopted the use of image stacks containing multiple focal planes. In an initial pre-processing step, these individual layers are combined to create a composite image that integrates the most relevant features from each focal plane (Figure 1). We use a method inspired by the Mertens’ exposure fusion algorithm for high dynamic range imaging (Mertens et al., 2007). Mathematically, it can be expressed as follows:
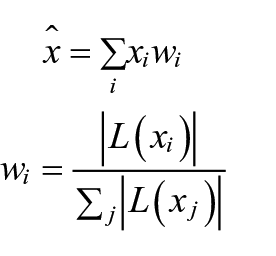
where
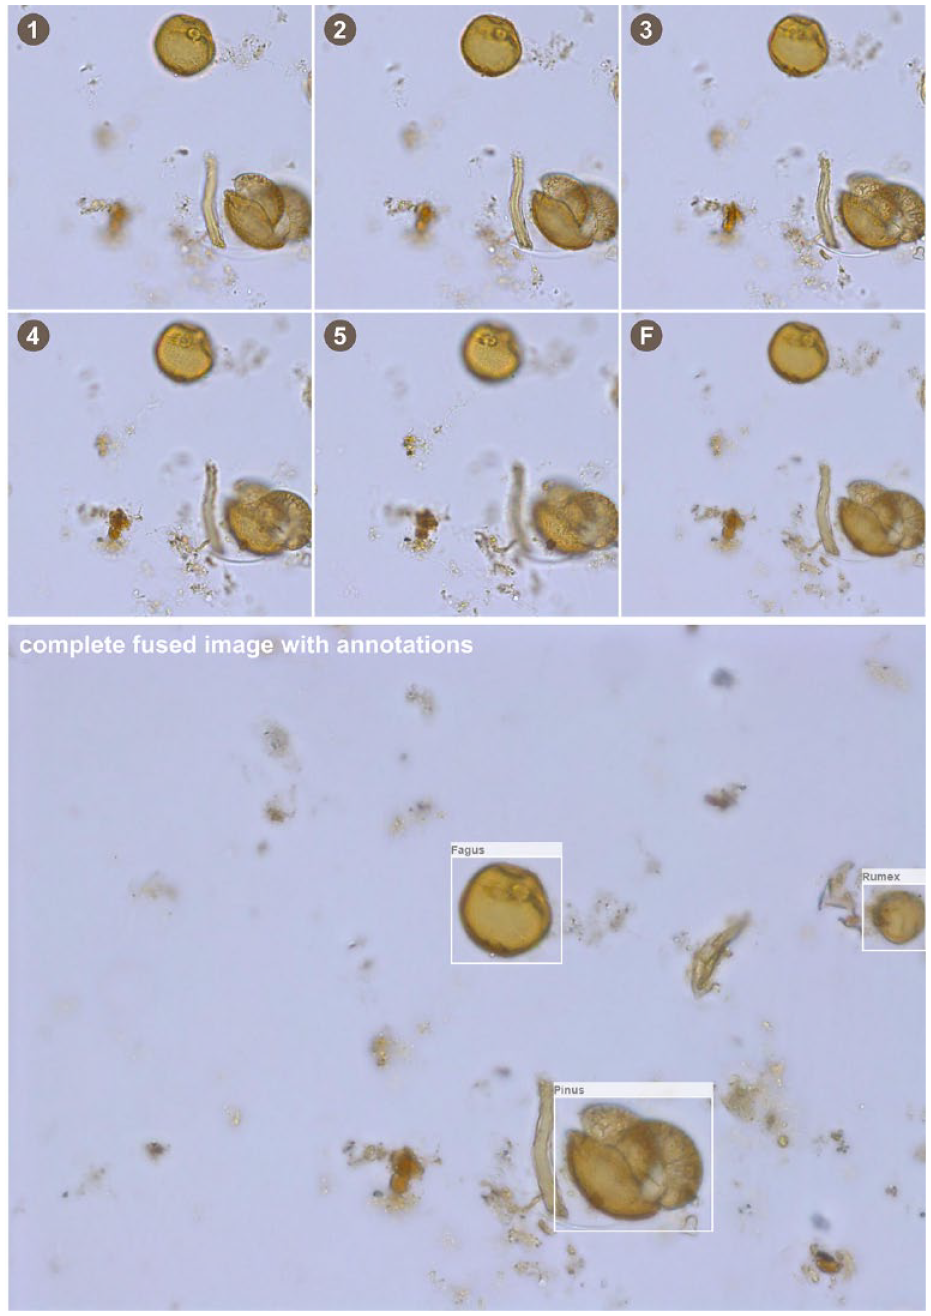
Top: Example of a stacked image section with five focal planes (1–5) and the fused image (F). Below: The corresponding complete image, fused, with annotations.
The classifier identifies (we use the terms ‘classify’ and ‘identify’ interchangeably here) pollen grains and spores that were detected in the first stage. The classifier uses full resolution, rectangular image crops of the pollen and spores detected in the first step. The size of the image crops depends on the size of the detected objects, that is, it is variable. We observed that the focus fusion algorithm could potentially lead to the loss of certain visual features that are crucial for the identification of pollen types. Therefore, this second stage receives as input the four most focused layers, arranged as a grid. How well a layer is focused is estimated from the response of the Laplace filter.
In addition to the species of interest, the second stage is also trained to directly classify objects as a negative class of ‘non-pollen’, if annotated by the user, such as in our TAN dataset. The additional visual information from the four most focused layers and from the higher image resolution helps to filter out objects misidentified as pollen or spores in the first stage.
This second stage is realised using a MobileNetV3 [2] image classifier. This architecture was chosen mainly for its speed, as the tool is intended to run on commercial off-the-shelf devices, such as laptops. Moreover, larger architectures did not yield better classification performance in our experiments.
User interface
Our pollen recognition algorithm has been implemented in the PyTorch framework and is accessible through a browser-based user interface named TOFSI (https://github.com/alexander-g/Tofsi-POST). The user interface allows users to train the algorithms for the detection and classification of pollen grains and spores either simultaneously or separately. The user interface runs in Chromium-based browsers such as Chromium, Chrome or Firefox. It provides the tools to 1. prepare training data, 2. train the algorithm(s) and 3. apply automated recognition. An introduction to using TOFSI is available along with the user interface.
Our algorithm is specifically tailored for single-view microscope images; it is not suitable for large, stitched images. To account for the low depth of field of microscope images, the algorithm is adjusted to handle stacks of images taken at slightly shifted focal planes. Images should be provided as multi-layer TIFF files, with optional JPEG compression applied to the individual layers. The current version of our approach has been tested to work well with up to 13 layers. To prepare training data, objects such as pollen, spores, and other elements of interest present in the images can be delineated by rectangular bounding boxes and subsequently labelled. For each image stack, the coordinates and corresponding labels of all bounding boxes are stored in a JSON file.
The training of both the detector and the classifier requires a sufficient number of annotated training images. Within the training section of the user interface, annotated objects are categorised into four different groups. The ‘Classes of interest’ contain all the objects that the algorithm should learn to recognise separately. Rare pollen and spores can be included in either ‘Other objects’ or ‘Unknown classes’. Objects that are neither pollen nor spores are subsumed under ‘Rejected classes’. The training process can be focused solely on the detector (which identifies pollen and spores within the sample matrix) or on the classifier (which distinguishes and classifies pollen and spores).
For the current examples, the Stochastic Gradient Descent (SGD) optimiser was used with an initial learning rate of 0.01, reduced by a factor of 0.2 every 12 epochs, for a total of 50 epochs. In machine learning, an epoch refers to one complete pass through the dataset during the training of a model. The weight decay was set to 0.0001 and the batch size to 32. These parameters were determined empirically and based on similar work in other application domains. They are a reasonable default choice for retraining on other datasets with a similar type of images. For advanced users, the user interface allows for customisation of the learning rate and the number of training epochs.
To extend the training data, we artificially generate additional training images by augmentation, that is, by transforming existing training images by rotation and horizontal and vertical flips. Augmentation is performed automatically in the user interface.
In order to increase robustness against false positives, we introduce the erroneous predictions from the first stage as an additional negative class. We also annotated a small number of non-pollen objects in the training data and added them to the negative class. Owing to a very long-tailed class distribution (some pollen types are rare while others are abundant), we use under-sampling of the majority classes. This step helps to reduce the bias of the classifier towards the most common pollen and spore types. For retraining, the user is advised to manually select training images with a balanced number of classes, if possible.
Training data
We generated two training datasets employing subfossil pollen samples from lakes located in north-eastern Germany. The first dataset contains 13,180 image stacks extracted from seven pollen samples from the Tiefer See lake in north-eastern Germany (TSK, Table 1). These pollen samples were extracted from a modern, annually laminated sediment section spanning the years 1986–2004 CE (Brauer et al., 2019). Pollen samples were prepared according to the standard procedure described by Fægri and Iversen (1989), which includes treatment with 25% hydrochloric acid, 10% sodium hydroxide, and acetolysis at 100°C for 7 min. In order to preserve fragile pollen grains, treatment with hydrofluoric acid was not included in the sample preparation. Consequently, the samples may contain mineral particles. To also include an exotic marker in the training, one or two tablets of Lycopodium clavatum spores, distributed by Lund University under batch no. 3862, were added to each sample. Images were captured at the University of Utrecht using a Leica DM6000 B automated stage light microscope, equipped with a 40x objective and a DFC310 FX camera. The resulting images measure 1392 × 1040 pixels, with a resolution of 0.23 µm/pixel. To account for the inherent low depth of field of high-resolution microscope images, five images were captured at successive focus levels for each location, thereby collectively covering approximately 15–20 μm along the z-axis. The individual, JPEG-compressed images were converted into stacked, multi-layer TIFF files using a Python script. The resulting size of each stack is approximately 1.5–2 MB per stack. Pollen, spores and other relevant objects were manually labelled using our user interface. To do this, the location of these objects within the images was marked by enclosing them in a rectangular bounding box, allowing for some margin around each object (Figure 1). We labelled all pollen types, although only a limited number of pollen types were included in the training as distinct classes. Pollen identification mainly follows the key of Moore et al. (1991) and pollen types were named accordingly. Pinus pollen grains with only one saccus and detached single Pinus sacci were named Pinus sacci.
Training and validation datasets from Lake Tiefer See (TSK) and Lake Tangahnsee (TAN). Secale was only included in the training and validation with the TSK dataset.
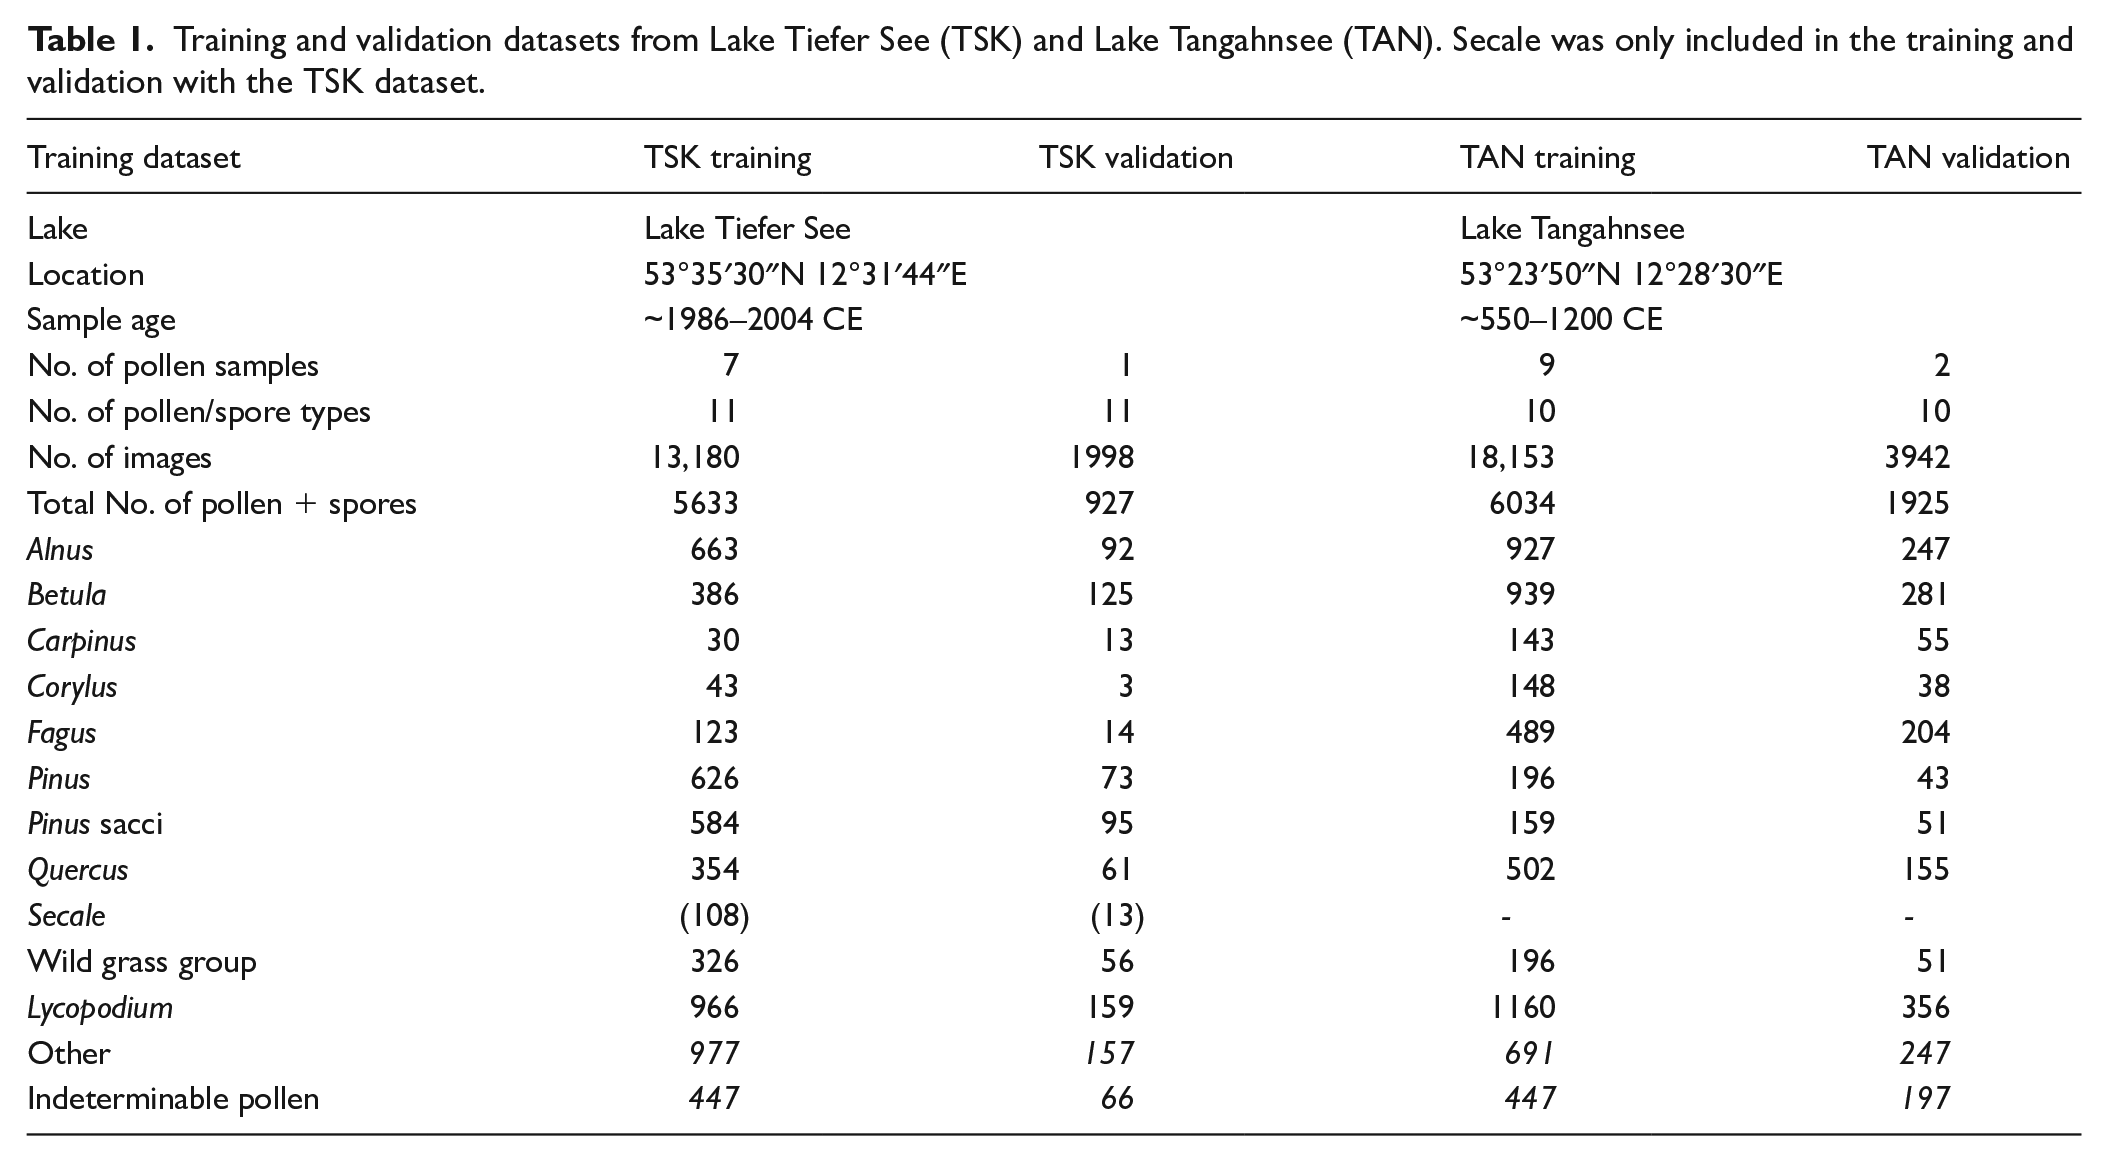
We also labelled exotic Lycopodium spores from the marker tablets as an additional class. Pollen and spores that could not be reliably identified, for example because of their location at the edge of an image or their poor preservation, were classified as ‘indeterminable’. In the TSK dataset, a total of 6034 pollen and spores were labelled, including 447 ‘indeterminable’ pollen grains. For validation purposes, an additional set of 1998 images was produced, including 927 labelled pollen grains and spores, with 66 indeterminable pollen grains.
The second dataset includes 18,153 image stacks from nine pollen samples from the Tangahnsee lake in north-eastern Germany (TAN, Table 1). These samples were collected from a core depth of 940 to 1050 cm, covering approximately the period 550–1200 CE. The pollen samples and images were prepared in the same way as those from Lake Tiefer See, with the exception that images were saved as uncompressed TIFF files. The size of each image stack is approximately 21 MB. To enhance the detection of pollen within the sample matrix, we additionally labelled selected detrital objects as ‘non-pollen’. A total of 6034 pollen and spores were labelled for the training, including 447 ‘indeterminable’ pollen grains, along with 1694 ‘non-pollen’ objects (Table 1). An additional set of 3942 images was prepared for validation, including 1928 labelled pollen and spores and 197 indeterminable pollen grains.
Using these two training datasets, we generated three fully trained models, the TAN model (using TAN training data only), the TSK model (using TSK training data only) and the TAN+TSK model (using TAN and TSK training data).
Evaluation
We first assess the performance of the detector (stage 1 of our algorithm), that is, the ability to find pollen and spores in the sample matrix. This evaluation involves estimating the proportion of all pollen and spores that the detector has successfully found. We then evaluate the performance of the classifier (stage 2 of our algorithm) by determining the precision and recall of the outcome.
Precision for each class describes the proportion of correctly classified objects among the classified objects. Precision is calculated as the ratio of true positives to the sum of true positives and false positives. Conversely, recall for each class characterises the proportion of all pollen/spores present in a sample that have been successfully detected by the algorithm. Recall is calculated by dividing the number of true positives by the sum of true positives and false negatives. We calculate precision and recall for different confidence levels established by our algorithm. Confidence levels are calculated using the Softmax function, which is applied to the raw outputs of the classifier neural network. Softmax creates a probability distribution, assigning a probability score to each of the different classes. We have found that confidence levels above 70% indicate a correct classification in most cases and therefore use this threshold for the following tests.
To determine whether automated recognition has successfully detected a particular manually labelled object, we utilise the concept of Intersection over Union (IoU). The IoU is calculated as the shared area between the bounding box defined by the detector and the manually defined bounding box. This shared area is then divided by the total area of both bounding boxes. We consider a manually labelled object to be correctly detected by the algorithm if the IoU value is greater than 0.4.
Results
We separately tested and evaluated the performance of the pollen detector (which detects pollen and spores in the sample matrix) and the pollen classifier (which classifies the objects detected by the detector) with the three trained models.
TAN dataset
Detector
For the TAN dataset, the TAN model exhibits the best performance. It detects 1468 (99.1%) of the 1481 pollen and spores present in the validation dataset that belong to the 10 classes included in the training. Furthermore, it successfully detects 253 (92.7%) out of 273 pollen grains in the validation data, which belong to classes not included in the training, the majority of which are indeterminable pollen grains.
The TSK model shows slightly poorer detection capabilities. It detects 1444 (97.5%) of the 1481 pollen and spores from the classes included in the training. Notably, the model missed some Lycopodium spores in equatorial view. The likely reason for this is that spores in this position are rare in the training dataset. In addition, the model detects 238 of the 273 (87.2%) pollen grains from classes not included in the training.
The performance of the TSK + TAN model is similar to that of the TSK model. It detects 1434 of the 1481 (96.8%) pollen and spores from the classes included in the training, with a similar tendency to miss some Lycopodium spores. It also detects 234 of the 273 (85.7%) other pollen grains, primarily missing indeterminable pollen grains.
Classifier
The classification of pollen and spores of the TAN validation dataset achieves the highest accuracy using the TAN model. At the 70% confidence level, the average precision across all taxa is 0.93, meaning that 93% of the classifications are correct. Precision is highest for Lycopodium (0.99), Fagus (0.98) and Pinus (0.98) and lowest for Corylus (0.89) and Wild grass group pollen (0.82). Corylus (n = 148) and Wild grass group (196 pollen grains) and are present with rather few specimens in the training data (Table 2). It is worth noting that higher precision has been observed for other taxa with low numbers of specimens, such as Carpinus (n = 143) and Pinus (n = 196). This implies that factors beyond the amount of training data can influence the accuracy of automated detection.
Performance of three pollen recognition models when applied to the TAN dataset.
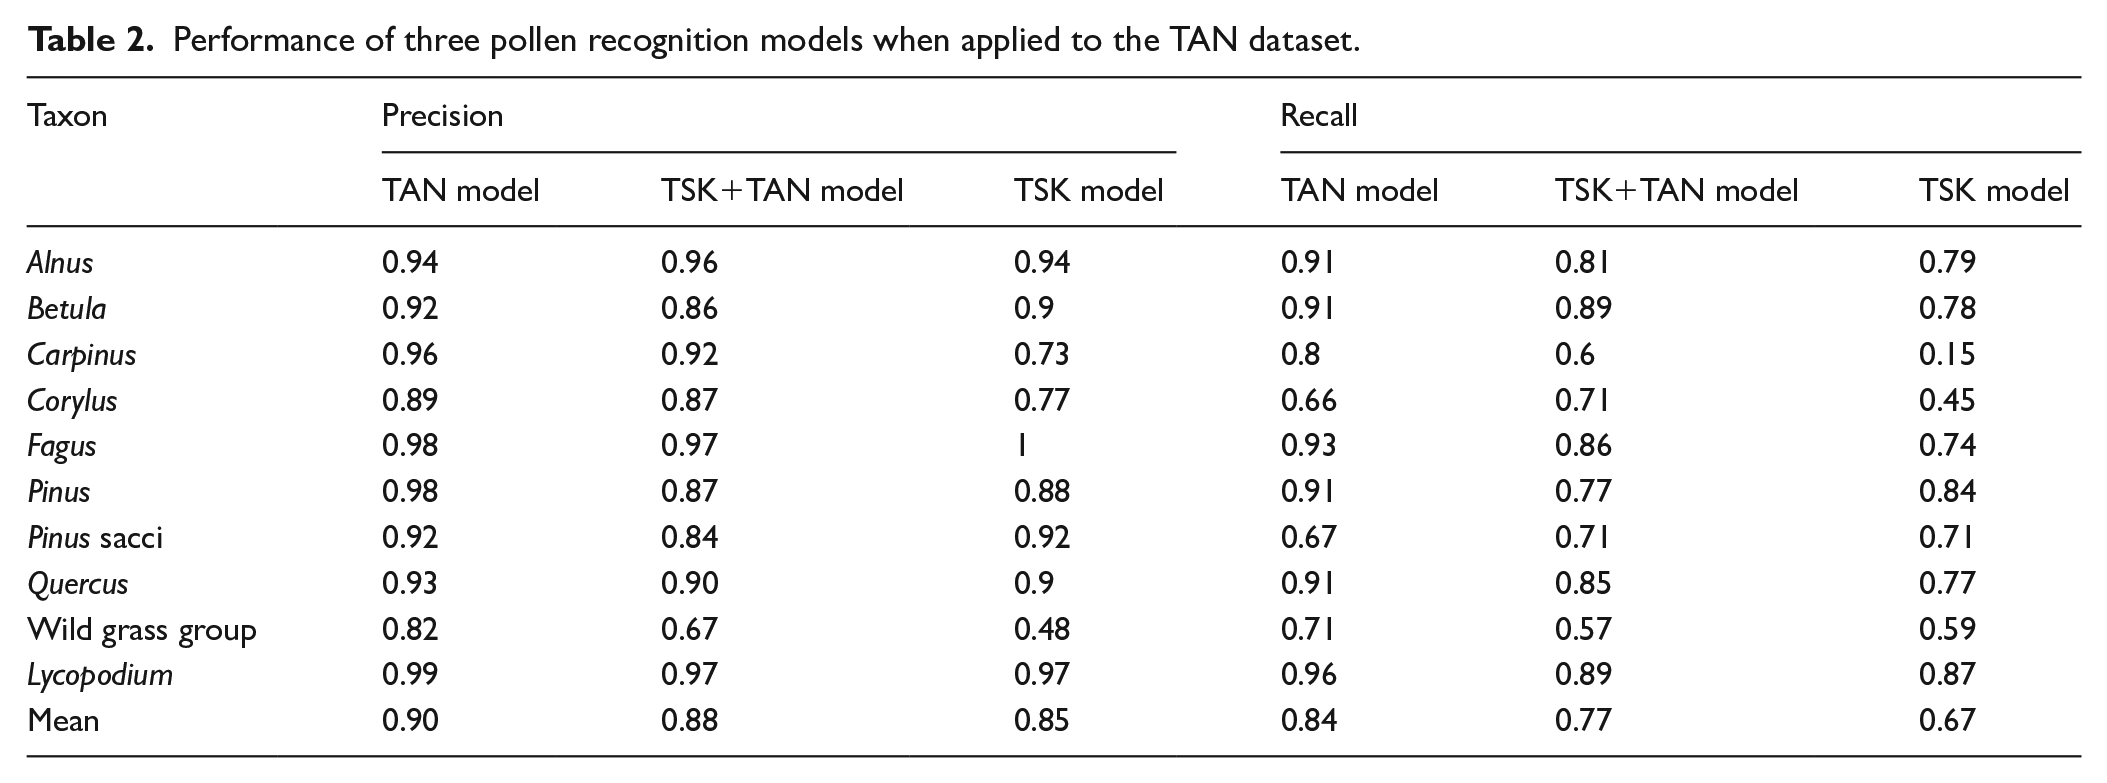
The TAN model also achieves the highest mean recall (0.84), meaning that 84% of all the pollen present in the validation data are correctly classified. Among specific taxa, the recall is highest for Alnus (0.91), Betula (0.91), Fagus (0.93), Pinus (0.91), Quercus (0.91), and Lycopodium (0.96). However, the recall is lower for Corylus (0.66), Pinus sacci (0.67) and Wild grass group (0.71). The taxa with lower recall values are less frequent in the training data (n < 200). The lower recall values are therefore probably indicative of an insufficient number of specimens within the training data.
The classification is slightly less accurate with the TSK + TAN model. At the 70% confidence level, the mean precision is 0.88, ranging from 0.97 for Lycopodium to 0.67 for Wild grass group pollen. The mean recall is 0.77, ranging from 0.89 for Betula and Lycopodium to 0.57 for Wild grass group pollen. Classification with the TSK model is also less accurate. Although the precision is only slightly lower (mean 0.85, ranging from 1.0 for Fagus to 0.48 for Wild grass group), the recall is notably lower than with the other models (mean 0.65, ranging from to 0.90 for Lycopodium to 0.07 for Carpinus).
TSK dataset
Detection
Regarding the TSK dataset, the TSK model and the TSK + TAN model perform similarly well. Specifically, the TSK model detects 669 (96.8%), while the TSK + TAN model detects 672 (97.3%) of the 691 pollen and spores in the validation data, belonging to the classes included in the training. Notably, both models missed mainly Lycopodium spores and single Pinus sacci. Among the 193 other pollen grains, the TSK model detected 187 (96.9%), while the TSK + TAN model detected 188 (97.4%). In contrast, the performance of the TAN model is somewhat weaker. It detects 647 out of the 691 (93.6%) pollen and spores from the classes included in the training and 178 out of the 193 (92.2%) other pollen grains.
Classification
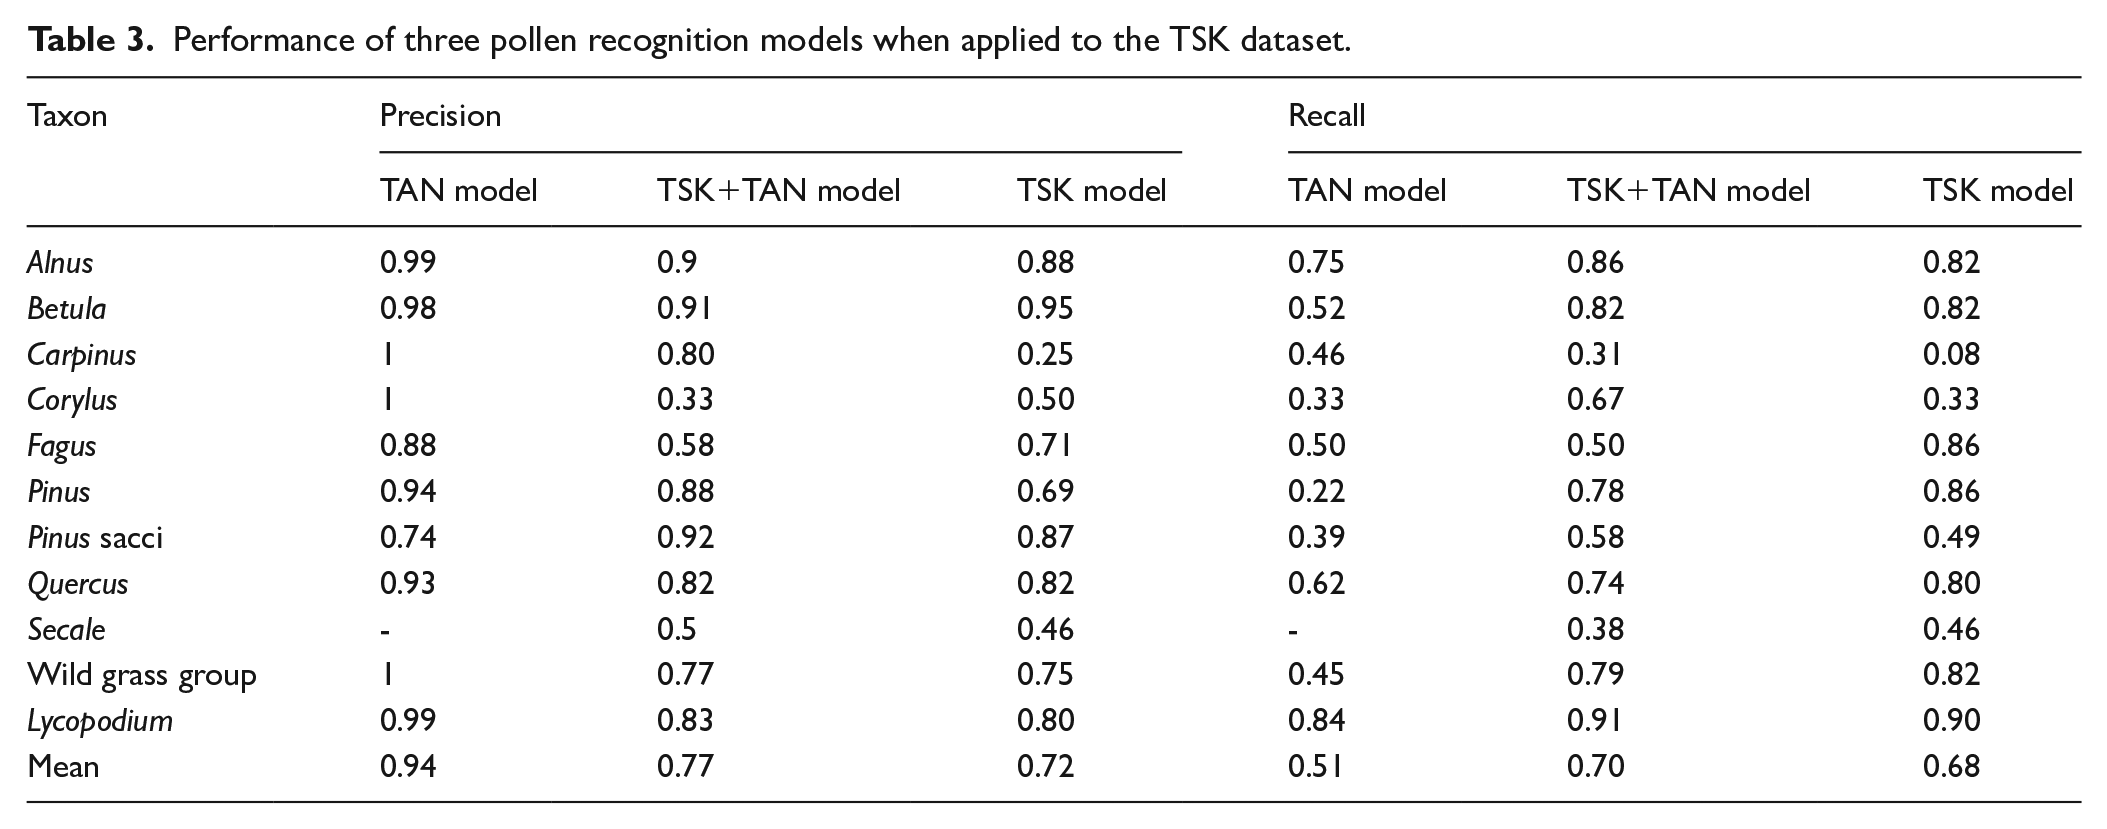
In terms of classification, both the TSK model and the TSK + TAN model perform equally well. At the 70% confidence limit, the mean precision is 0.72 with the TSK model and 0.77 with the TSK + TAN model (Table 3). With the TSK model, the precision ranges from 0.95 for Betula to 0.25 for Carpinus. With the TSK + TAN model, the precision ranges from 0.92 for Pinus sacci to 0.33 for Corylus. The mean precision is higher (0.94) for the TAN model, ranging from 0.74 for Pinus sacci to 1 for Carpinus, Corylus and Wild grass group pollen. The mean recall, on the other hand, is clearly higher for the TSK model (0.70) and the TSK + TAN model (0.68) than for the TAN model (0.51).
Performance of three pollen recognition models when applied to the TSK dataset.
Comparison of TAN and TSK
For almost all taxa, both recall and precision in automated recognition are higher with the TAN dataset than with the TSK dataset (Figure 2). The most likely reason for this is the difference in image quality. Images of the TAN dataset have been taken with uniform microscope settings, ensuring that brightness and colour intensity are consistent across all images (Figure 3a and b). Images from the TSK dataset, on the other hand, were accidentally taken with varying microscope settings, resulting in differences in brightness and colouration among the images. The majority of the training data is well coloured (Figure 3c), some batches, including the validation data, are almost colourless (Figure 3d). To enhance recognition, we artificially increased the colour intensity of these images (Figure 3d). However, the differences may still have limited pollen recognition. We did not test whether JPEG compression, which was used for the TSK images but not for the TAN images, had a negative impact on the performance of our approach. At the moment, we assume that any such effect is small.
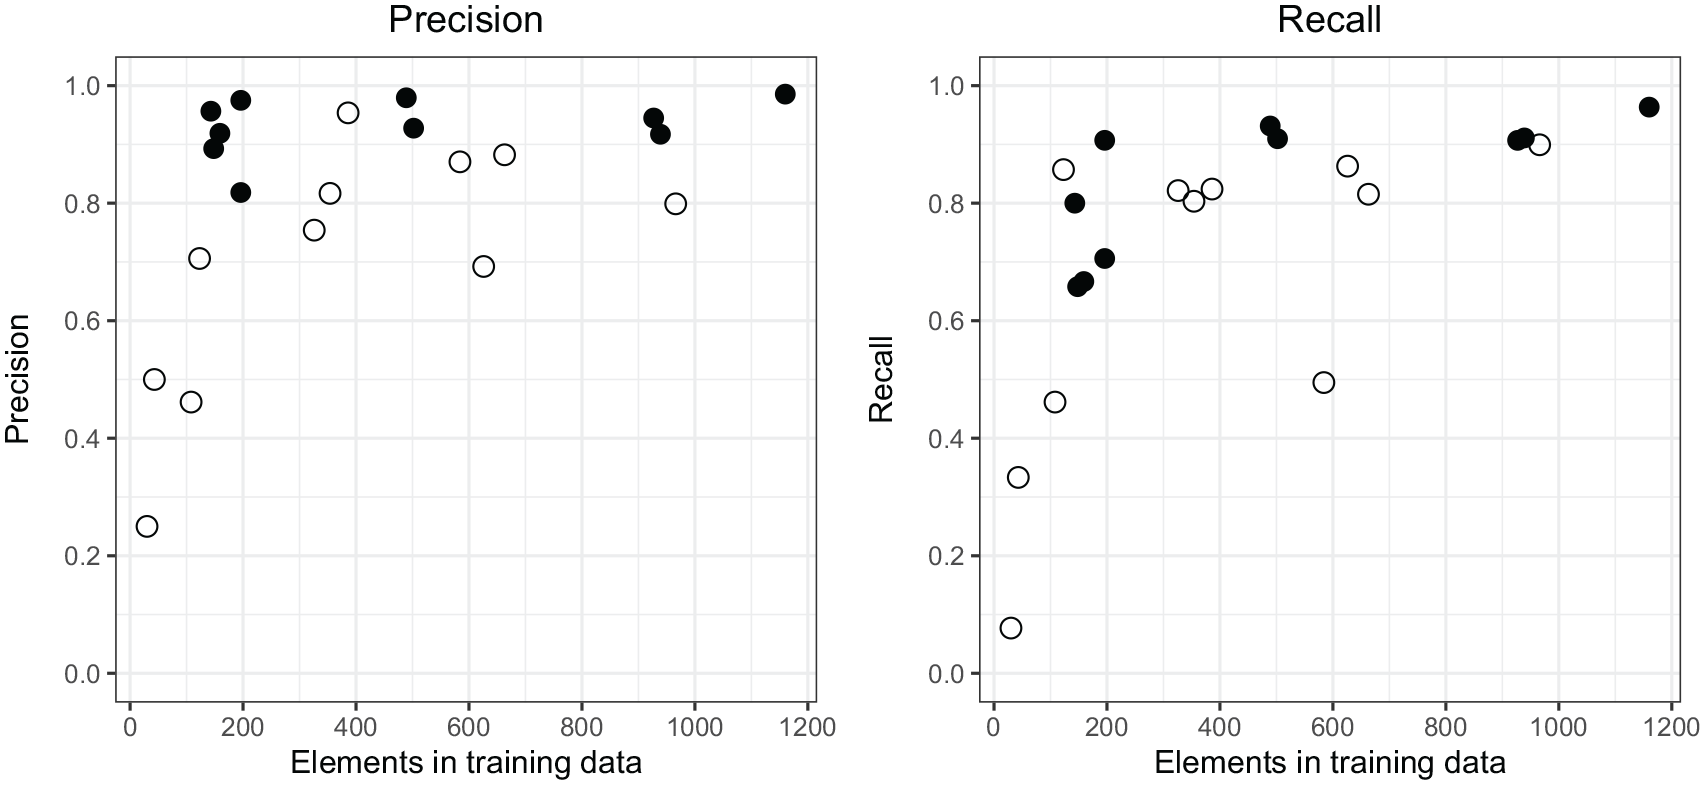
Comparison of precision and recall for classification for single classes of the TAN dataset with the TAN model (full dots) and the TSK dataset with the TSK model (open dots).
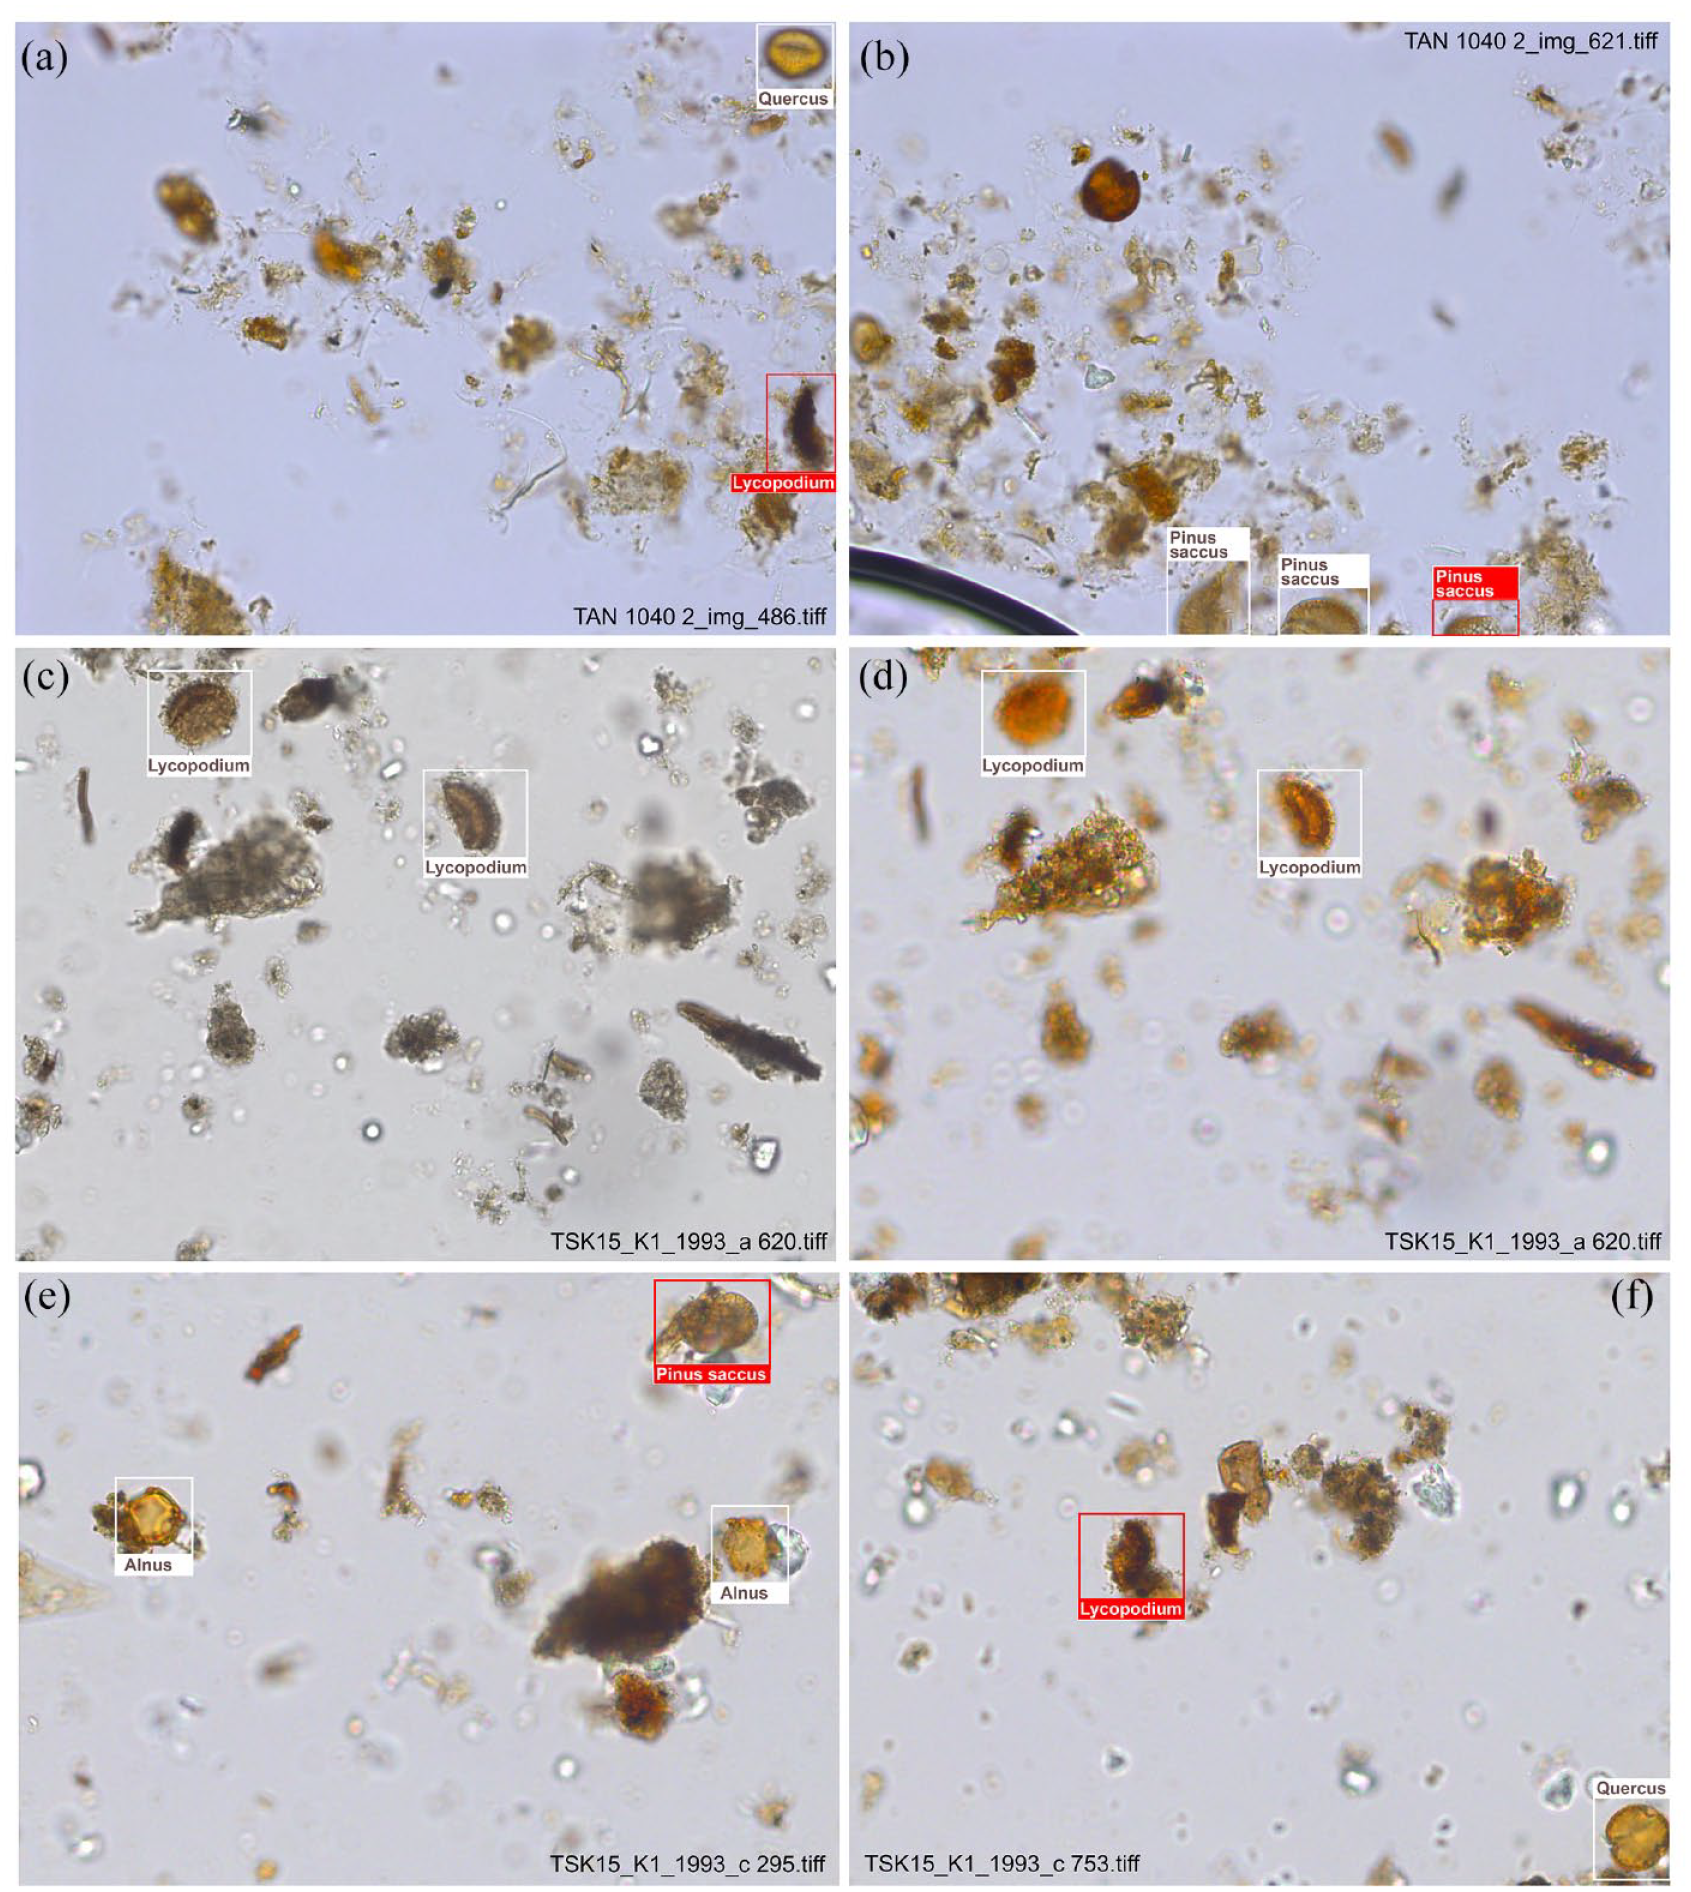
Differences in image quality between the TAN and TSK datasets, illustrated with example images of correctly classified (white box) and undetected (red box) pollen and spores. Images from the TAN dataset were taken with uniform lighting settings, so that brightness and colouration of the images are consistent (a and b). Our detector worked well, only very few pollen and spores, mainly some Lycopodium spores in equatorial view (a) and incomplete Pinus sacci (b), remain undetected. In the TSK dataset (c–f), different microscope settings resulted in different brightness and colouration of the images. Colourless images were adjusted (c and d). Also in the TSK data, mainly single Pinus sacci ((e) partly hidden) and Lycopodium spores in equatorial (f) view were not detected.
Precision and recall are lowest for pollen types with a small number of specimens in the training data, for example, for Carpinus, Corylus and Secale in the TSK dataset. It appears that precision and recall are reasonably high when the number of training images exceeds 200. Nevertheless, in the TSK dataset, about 50% of the individual Pinus sacci were misclassified, although there are 584 training images (for confusion matrices see supplementary material). Some of these were classified as complete Pinus pollen grains, suggesting that the distinction between individual single sacci and complete grains needs further training. For Alnus, Betula and Corylus the number of training images is already high. However, there are still some misclassifications between these three pollen types, apparently because of their similarity.
Discussion
We present a browser-based tool that enables users to develop and apply automated pollen recognition without any background in programming, image recognition, and artificial intelligence. The tool facilitates users to annotate stacked microscopic images, train pollen recognition models, and ultimately apply pollen recognition to samples from different environments, such as lake sediments and peat.
Pollen detection
Recently, several studies have explored the suitability of newly available DCNNs for classifying fresh pollen grains using pollen grain images prepared from flower samples (e.g. Olsson et al., 2021; Sevillano and Aznarte, 2018). Punyasena et al. (2022) also tested automated recognition using real pollen samples from pollen traps. Instead, we attempt to automatically classify subfossil pollen in samples from lake sediments. In such samples, the additional challenge is to first detect pollen grains in the sample matrix of detritus, algae, fungal remains, etc. Initially, we assumed that analysis of light microscopic images alone might not be sufficient to separate pollen from other remnants, and that additional information, such as fluorescence images, might be required. However, our approach to pollen detection using a Faster R-CNN object detector proved effective; finding almost all pollen grains belonging to types that were included in the training, and also over 90% of the pollen grains belonging to types not yet included in the training. Successful detection requires that pollen grains are not obscured by other objects, that is, that the sample material is adequately diluted. In our samples, the ratio of pollen to other remnants is rather low, so, with the necessary dilution, usually only 0–2 pollen grains are present per image. Nevertheless, scanning a sample area of 15 × 15 mm yields ~1500 images with mostly well over 1000 pollen grains, which is a statistically robust pollen count. Preliminary tests indicate that our approach is also suitable for detecting pollen in peat samples, at least as long as the pollen grains are not obscured by detrital material.
Pollen classification
Currently, our tool has been trained on 10 pollen types and Lycopodium spores and is able to classify them with a precision and recall of about 0.9. The number of types included in the training is still low compared to the 46 types included in Sevillano et al. (2020) and the 28 types in included in Olsson et al. (2021). Both studies generated training data from clean flower samples, allowing the rapid production of hundreds or thousands of labelled pollen images for each taxon. However, their approaches are not trained for pollen recognition in lake sediments or peat. We believe that optimal classification of subfossil pollen from lake sediments and peat will require that the training data be generated from subfossil material, that is, using images in which pollen and spores are located in the sample matrix of detritus and various other remnants. Labelling enough pollen grains and spores in this way is very time-consuming, particularly for rare pollen types. However, we can now harness the ability of our algorithm to detect almost all pollen grains in lake sediment samples to produce further training data more rapidly. A human analyst would only need to review the labelled images before they are added to the training sets, eliminating the need to manually select and annotate pollen grains within the image stacks.
In the TAN dataset, recall and precision are around 0.9 for the pollen types with 500–1000 labelled specimens in the training data. We expect recognition to be similarly effective for the pollen types with fewer training data so far, namely Wild grass group, Secale, or Corylus, as soon as more training data become available. Faster production of training data will also allow us to test whether classification with the current setup-will improve further when the amount of training data is increased, for example to 10,000 specimens per taxon.
Our work has so far focussed on pollen types that are usually easy for the human eye to distinguish at 400 times magnification. However, it remains an open question whether our approach is also suitable for distinguishing more difficult pollen types such as cereal pollen or the various Plantago pollen types. Manual classification in such cases often relies on the use of higher magnification and/or phase contrast. Punyasena et al. (2012) demonstrated that machine learning approaches are as capable as humans at distinguishing very similar pollen types – in their case black and white spruce pollen – using super-resolution images generated with structured illumination light microscopy. Also Holt and Bebbington (2014) and Sevillano et al. (2020) have shown that closely related pollen types, which had previously been regarded as indistinguishable, can be distinguished using either basic shape features or DCNNs. Both studies used darkfield imagery taken at a rather low optical magnification (Holt et al., 2011). Whether higher magnification images will be required to automatically classify difficult pollen types using our approach requires further testing.
Potential applications of our approach at its present stage
At this stage, our approach is not suitable for producing complete pollen datasets, as the classification is limited to common, fairly well distinguishable pollen types and is not error-free. In the next step, we will expand the training data to include more pollen types and improve the classification. Nonetheless, we consider our approach to be potentially useful even at this stage, at least for applications that do not require high taxonomic resolution. This includes, for example, overview pollen analysis of new sediment cores or pollen analysis for biostratigraphic dating, at least as long as key taxa are already classified. In addition, the approach is well-suited to studying annual variations in pollen deposition and pollen mast years of individual taxa in the past, which only requires the recognition of the respective pollen types and the exotic marker. Long pollen mast records are useful for studying the (flowering) ecology of tree taxa (in Europe, e.g. Fagus sylvatica and Picea abies), for linking lake sediments to tree rings, and for dating lake sediments (Theuerkauf et al., 2019).
If higher taxonomic resolution is required, TOFSI may be useful as a first step in the analysis, followed by manual revision of the automated classifications and manual classification of pollen types unknown to the algorithm. For revision, we automatically write image regions with classified objects into individual taxon folders, including folders for ‘others’ and ‘non-pollen’. Within each folder, the image regions are sorted in order of the confidence of the classification, allowing for quick revision of the images, for example, using the icon view of Windows Explorer. The image regions still retain all image layers for more detailed inspection. In addition, all regions retain their coordinates so that objects can be easily checked manually under the microscope, using higher magnification and phase contrast if necessary.
We tested this semi-automated approach with additional samples from the TAN core. The fully manual analysis of one of these samples with ~1000 pollen and spores took about 3 h, whereas automated classification with manual revision took only about 1 h. We expect that as more training data become available, the reliability of the automated classifications will continue to improve, reducing the time required for manual revisions. It should be noted that the semi-automated approach may be somewhat incomplete, as the manual revision only includes those objects that were detected by the TOFSI pollen detector in the first place, whether as some pollen, spore or non-pollen. As mentioned above, the number of undetected pollen and spores is minimal and is expected to decrease with additional training data. Where such errors are permitted, this semi-automated workflow will significantly accelerate pollen analysis.
Advantages (and disadvantages) of working with digital images
Using such a (semi)automated approach to pollen recognition, a pollen analyst will primarily be working with digital images on a screen rather than at a microscope, which has a number of advantages. Firstly, images can be easily shared for discussion and archived for later review, allowing greater reproducibility of the results. In our experience, digital pollen slide images are also very useful for training students. Secondly, digital images potentially allow further valuable data to be extracted, such as the size or shape of particular pollen grains or other objects (cf. Holt and Bebbington, 2014). Thirdly, without the need for a microscope, the choice of workplace is more flexible. Finally, working on a computer screen is more eye-friendly than long microscope sessions.
There are some limitations to working with digital images, the most important being image quality. Under the microscope, pollen grains in unfavourable positions can be moved or rotated by applying pressure to the cover slip, which is not possible with images. Diluting samples appropriately and preparing slides as thinly as possible reduces instances where physical rotation is required to identify grains. Also, in our setup, all image coordinates are stored so that one can return to particular grains under the microscope for manual inspection. This also allows grains to be examined with phase contrast and higher resolution if required. Working with digital images takes up disk space. As described below, even uncompressed images require about 20 GB of disk space per sample. This disk space currently costs less than 50 Euro cent and will be become even cheaper in the future.
Some technical issues
We prepared datasets with uncompressed (TAN) and JPEG-compressed (TSK) images. The size of a single stacked image with five image layers is approximately 20 MB for the uncompressed and 2 MB for the compressed image files. As mentioned above, our algorithm is likely to perform similarly well with the smaller, compressed images.
We did not remove mineral particles in the samples used for the present study because the mineral content was generally low. In low concentrations, mineral particles did not obviously hamper the automated detection and recognition of pollen and spores. However, the performance of TOFSI may decline when the concentration of mineral particles is high, obscuring pollen grains. In such cases removal of mineral particles may be necessary, either by treatment with hydrofluoric acid or by heavy liquid separation.
Slide preparation and microscope setup takes only 3–4 min per sample. The time required to scan a sample depends on several factors, including the scanning device, the microscope objective, the camera adapter, and the size and resolution of the camera sensor. In our case, scanning of a sample area of ~20 × 20 mm took about 2 h. For the actual automated pollen detection, we used a standard PC (AMD Ryzen 7) equipped with an NVIDIA GeForce RTX 2080 Ti graphics card. When running on the GPU, the processing of a single sample takes ~30–60 min, depending on the number of pollen and spores detected.
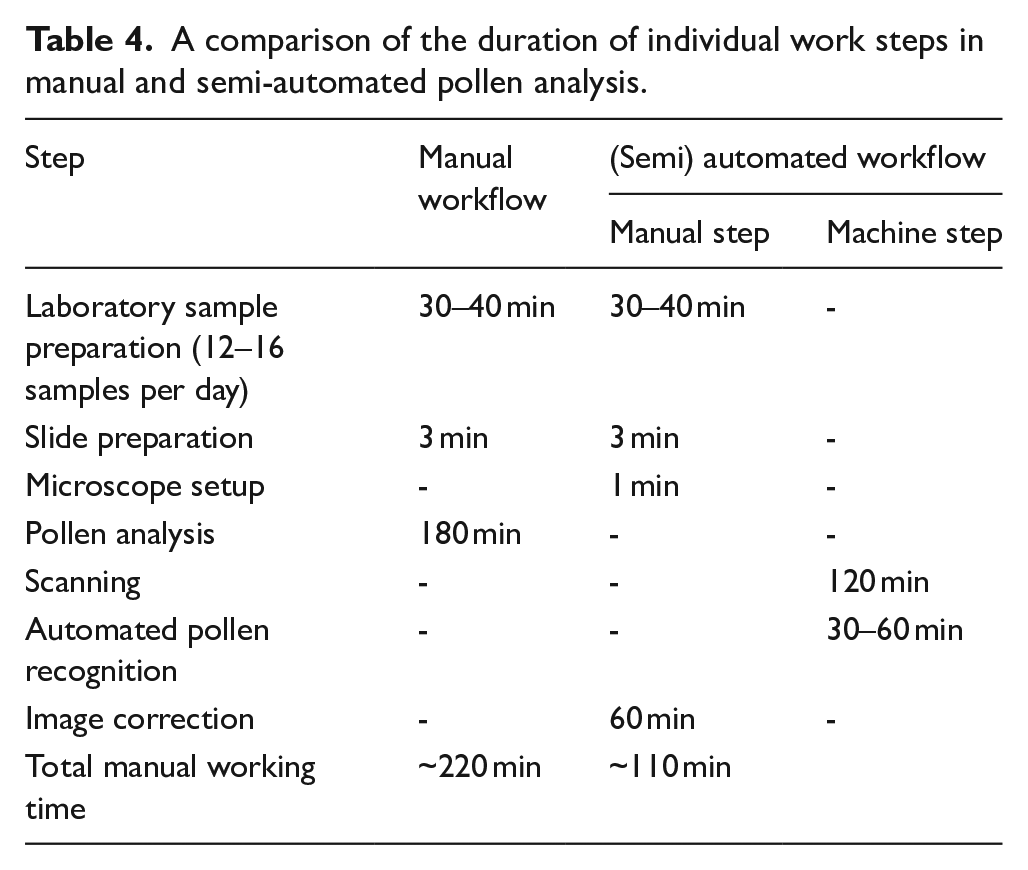
We found that classification was less accurate for pollen and spores that were incompletely captured at the image margins. For the present study, all samples were scanned without overlap between adjacent images. Scanning with sufficient overlap will solve this issue, but it could also lead to objects being counted twice on adjacent images. As the xy coordinates of all detected objects are known, such cases can be identified by an additional step of data analysis by comparing the position of all detected objects. For detected pairs, only the object with the higher confidence is included in the final results (Table 4).
A comparison of the duration of individual work steps in manual and semi-automated pollen analysis.
Our tests indicate that, currently, successful detection and classification of pollen and spores can only be achieved when training images and sample images have similar properties, that is, images were acquired using the same scanning device with uniform settings. Further tests are necessary to explore whether training with mixed datasets, for example training datasets produced using different scanning devices and varied settings, can produce more robust models.
Further steps
Our tool is generally effective for (semi)automated identification of pollen and spores in lake sediments and possibly peat. The essential next step is to produce additional training data to explore more fully the potential of our approach. As previously discussed, producing training data has been slow so far. We expect that this process will be notably faster in the future, particularly for rare pollen types, since we can now use the tool to annotate further pollen grain images quickly. These annotations still need revision, but revising them is a much faster process compared to manually creating them from the beginning. We are confident that by adding more training data, classifying many more pollen and spore types will become feasible. As mentioned before, a crucial question is whether new training data alone will be sufficient to achieve accurate classification also of challenging pollen types, such as tetrads of the Ericaceae, Empetraceae and Pyrolaceae families, the various pollen types of the Plantaginaceae family, and cereal pollen. Differentiating such difficult pollen types manually typically demands higher resolution with 63x or 100x oil objectives (and phase contrast).
Using higher magnification objectives to scan whole slides has notable drawbacks. Firstly, higher magnification significantly increases the number of required images. In addition, objective lenses with higher magnification further reduce the depth of field further and require additional focal planes. Thirdly, using higher magnification objective lenses increases the number of incompletely captured pollen grains and spores at the image margins, which requires more overlap between adjacent images and, consequently, further increases the number of images. In our current setting and for a sample area of 20 × 20 mm, the scanning time consequently increases from about 2 h using a 40x objective to over 12 h using a 100x objective.
To attain higher resolution, scanning with 40x oil objectives is one possible option. Compared to air objectives, 40x oil objectives have a higher numerical aperture. This means that they produce images with finer details, without extending the scanning time. Another alternative is to rescan only the image regions with critical pollen grains with higher magnification. In our setup, we save the coordinates of all objects to be able to revisit the corresponding image regions automatically.
The progress in automated image recognition is advancing rapidly. The forthcoming revisions of the networks utilised in our method, namely the Faster R-CNN object detector and the MobileNetV3 image classifier, might further enhance the automatic classification of pollen and spores.
Conclusions
The present tests have demonstrated the capability of state-of-the-art image recognition approaches to detect and classify pollen and spores in lake sediment samples that were scanned using a motorised, regular light microscope. The time-consuming preparation of training data has resulted in a yet low number of classified pollen types and spores. The current capabilities of our pollen recognition approach will significantly accelerate the production of training data in the future. A key question is the extent to which classification can be further improved with more training data, particularly for difficult pollen types.
The still limited number of classified pollen types implies that our approach at the present stage is not yet suitable for full pollen analysis. However, it already proves useful for studies that focus on key pollen types, such as for biostratigraphic dating or the study of pollen mast cycles. When combined with manual revision, the approach can accelerate pollen analysis considerably.
Our tool is sensitive to various image properties, including magnification, resolution, and colour settings. It is also sensitive to properties of the pollen and spores, which are determined by sample preparation (most importantly the duration of acetolysis) and the mounting medium. Using the tool for a specific dataset may require expanding existing training datasets or building up new ones. Our user interface TOFSI provides all the necessary tools to prepare the training data and train the models for the automated recognition of pollen and spores in a range of sample types.
Supplemental Material
sj-pdf-1-hol-10.1177_09596836231211876 – Supplemental material for A trainable object finder, selector and identifier for pollen, spores and other things: A step towards automated pollen recognition in lake sediments
Supplemental material, sj-pdf-1-hol-10.1177_09596836231211876 for A trainable object finder, selector and identifier for pollen, spores and other things: A step towards automated pollen recognition in lake sediments by Martin Theuerkauf, Nia Siradze and Alexander Gillert in The Holocene
Supplemental Material
sj-pdf-2-hol-10.1177_09596836231211876 – Supplemental material for A trainable object finder, selector and identifier for pollen, spores and other things: A step towards automated pollen recognition in lake sediments
Supplemental material, sj-pdf-2-hol-10.1177_09596836231211876 for A trainable object finder, selector and identifier for pollen, spores and other things: A step towards automated pollen recognition in lake sediments by Martin Theuerkauf, Nia Siradze and Alexander Gillert in The Holocene
Footnotes
Acknowledgements
We thank Timme Donders and Friederike Wagner-Cremer, University of Utrecht – The Netherlands, and Swen Großmann, iib Warnemünde – Germany, for granting access to motorised microscopes for preparing pollen slide scans. We are also grateful to two anonymous reviewers for their very valuable comments on our manuscript.
Funding
The author(s) disclosed receipt of the following financial support for the research, authorship, and/or publication of this article: The present study was funded by a joint research project DIG-IT! that has been supported by the European Social Fund (ESF), reference: ESF/14-BM-A55-0016/19, and the Ministry of Education, Science and Culture of Mecklenburg-Vorpommern, Germany.
Supplemental material
Supplemental material for this article is available online.
References
Supplementary Material
Please find the following supplemental material available below.
For Open Access articles published under a Creative Commons License, all supplemental material carries the same license as the article it is associated with.
For non-Open Access articles published, all supplemental material carries a non-exclusive license, and permission requests for re-use of supplemental material or any part of supplemental material shall be sent directly to the copyright owner as specified in the copyright notice associated with the article.